

Abstract
Introduction
This study investigated the effects of hyperbaric oxygen treatment (HBOT) on the accuracy and reliability of point-of-care fingertip capillary blood glucose values in euglycaemic non-diabetic participants compared against venous serum blood glucose samples processed in an accredited pathology laboratory.
Methods
Ten non-diabetic hyperbaric staff members (age 35–55 years) underwent a standard 243 kPa HBOT exposure for 95 minutes. Blood glucose levels were measured via (i) finger-prick capillary test using the FreeStyle Optium™ Neo H glucometer and (ii) venous serum test using the Cobas 6000 laboratory analyser. Samples were taken at (T1) 0 minutes (pre-HBOT), (T2) 25 minutes, and (T3) 55 minutes into HBOT.
Results
All participants were euglycaemic at T1 (BGL 3.8–5.4 mmol·L-1). The highest venous serum value was 5.90 mmol·L-1 at T3 and the highest capillary value was 6.30 mmol·L-1 at T1. Post hoc tests showed a statistically significant difference between the mean capillary result pre-dive (T1) and readings at T2 (P = 0.001) and T3 (P < 0.001) while differences between T2 and T3 capillary results were not statistically significant, illustrating the effect of HBOT on capillary beds. Differences in venous values across the time points were not significant.
Conclusions
Venous serum glucose samples processed in an accredited laboratory may be more consistently accurate, but capillary point-of-care testing avoids delays in sample processing and provides glucose data that are of clinical relevance. The FreeStyle Optium™ Neo H glucometer is safe to use and provides a reliable measurement of blood glucose in the HBOT environment.
Keywords: Blood glucose level, Glucose monitoring, Diabetes, Hyperbaric oxygen treatment
Introduction
Since the 1970s there has been a gradual increase in the applicability of hyperbaric oxygen treatment (HBOT) which has seen it move away from the sole domain of diving-related disorders. It is now used in the management of a number of medical and surgical conditions, including wounds that fail to heal due to diabetes or radiation injury.[ 1]
Accurate identification of blood glucose level (BGL) particularly at levels lower than 4.0 mmol·L-1 is extremely important in the clinical hyperbaric oxygen environment. A growing proportion of the hyperbaric patient population now has diabetes either as a causative factor (e.g., non-healing wounds) or a concurrent medical co-morbidity to their treatment indication. A number of studies have noted HBOT to acutely lower blood glucose, particularly in patients using insulin or insulin secretagogue therapy.[ 2 - 11] These changes in blood glucose levels could potentiate a clinically significant hypoglycaemic episode whilst at pressure. The exact physiological reasons for blood glucose fluctuations in the HBOT environment have yet to been fully elucidated.[ 3 , 12]3,12 Furthermore, the symptoms of hypoglycaemia may mimic those of cerebral oxygen toxicity, a potentially serious side-effect of HBOT.[ 5 , 13] Management of oxygen toxicity is quite different from that for hypoglycaemia therefore it is important for clinicians to be able discern which clinical event is occurring.[ 13 - 15]
Venous serum glucose measurements performed in central laboratories remain the reference method for the evaluation of glucose levels, especially for diabetic patients. However, due to their point-of-care (POC) availability, speed of analysis, and minimal blood volume requirements glucose meters are frequently used as a substitute for venous glucose assay.[ 16 - 18] The POC glucometer, using capillary blood is now a routine method for glucose analysis in the normobaric setting as well as in the hyperbaric chamber.[ 6 , 13] It is notable that the hyperbaric environment exposes the POC device to a variety of atmospheric, technical and patient factors that may potentially adversely affect the analytical accuracy of the device.[ 19 - 21]
Several studies demonstrate a consistent bias towards overestimation of the blood glucose from capillary samples when compared to venous serum measurements performed under standard laboratory conditions at one atmosphere absolute (atm abs) (101.3 kPa) pressure.[ 6 , 13] Vasomotor changes experienced during HBOT further complicate comparison of capillary to venous samples.[ 19 - 21] Additionally, the immediate milieu of modern HBOT requires careful consideration of which electronic devices are permitted within the hyperbaric chamber due to fire and implosion risk.[ 22 - 25] These factors can be coupled with the potential for analytic inaccuracies when used outside the manufacturers’ specified environmental conditions.[ 25] Performance of POC glucometers has been demonstrated to be unpredictable under hyperbaric conditions, due to either the direct effects of pressure on engineered components or the effects of hyperoxia on biochemical machinery (e.g., enzymes in test strips) or a combination of both.[ 22]
This study aimed to assess the accuracy and reliability of POC fingertip capillary blood glucose values in euglycaemic non-diabetic participants under hyperbaric conditions and compare against contemporaneous venous serum samples processed in a recognised pathology laboratory.
Methods
This study was prospectively approved by the Tasmanian Human Research Ethics Committee (UTAS HREC No: H0015770) and conducted in accordance with National Health and Medical Research Council (NHMRC) guidelines and relevant institutional governance procedures. All participants (n = 10) were hyperbaric staff members at a tertiary referral hospital for the state of Tasmania, Australia. Each participant gave written informed consent to the inclusion of their data in this study. Participants were non-diabetic and had a valid medical certificate for diving.[ 26 , 27]
Each participant was additionally screened for dyslipidaemia and diabetes mellitus as the presence of elevated venous serum triglyceride levels and modest increases in HDL cholesterol levels can influence long-term glycaemic control.[ 28 , 29] Participant characteristics are reported in Table 1.
Table 1. Relevant characteristics of the study group .
| Characteristic | n = 10 |
| Gender (% male/female) | 50/50 |
| Age range (years) | 35–55 |
| Weight range (kg) | 70–95 |
| Non-diabetic (%) | 100 |
| HbA1c range (%) | 4.50–5.90 |
| Cholesterol range (mmol·L-1) | 3.90–7.40 |
Immediately prior to hyperbaric exposure each participant had an intravenous cannula inserted aseptically into their preferred antecubital fossa. They then underwent a standard 243 kPa (14 metres’ seawater [msw] equivalent) hyperbaric exposure according to a ‘14:90:20’ treatment table (Figure 1). Each participant received oxygen via an Amron™ oxygen treatment hood (Amron International, Inc., California, USA) in a multi-place chamber with an accompanying attendant as per Australian and New Zealand Standards.[ 26 - 30] None of the participants consumed food whilst undergoing this treatment. All participants had consumed a normal breakfast prior to exposure.
Figure 1.

Illustration of a ‘14:90:20’ hyperbaric treatment profile showing respired gas and BGL sampling times
Blood was drawn from the intra-venous cannula at three time-points for laboratory processing, with simultaneous capillary sampling undertaken by lancing the finger-tips of each participant for POC blood glucose testing. POC capillary blood testing was performed using three separate FreeStyle Optium™ Neo H glucometers (Abbott Healthcare, Massachusetts, USA). At each time-point the finger-prick capillary sample was divided between the three glucometers to evaluate inter-glucometer variability. The FreeStyle Optium™ Neo H glucometer was used to process both the pre-exposure POC BG value and the intra-exposure (in-chamber) BG values. The FreeStyle Optium™ Neo H glucometers are designed for use with the glucose dehydrogenase (GDH-NAD) enzymatic test-strips which were used in this study according to manufacturer’s instructions for all POC testing.[ 31]
Time-point 1 (T1) was immediately prior to compression; (a normobaric sample at 101.3 kPa), time-point 2 (T2) was at the start of the first air-break after 25 minutes of hyperbaric oxygen at 243 kPa; and time-point 3 (T3) was at the start of the second air-break after 55 minutes of hyperbaric oxygen at 243 kPa. Glucometer testing for capillary blood glucose values at T2 and T3 testing was undertaken within the hyperbaric chamber under pressure. All POC capillary glucose results were compared with venous serum glucose results obtained from a reference laboratory (see below).
Venous serum samples were drawn from each participant into a blood collection tube containing sodium fluoride, and a glycolysis inhibitor used to limit the ex vivo consumption of glucose.[ 32] The rate of glycolysis varies with the glucose concentration, temperature, white blood cell count, and other factors. All samples were retained in-chamber until the end of the hyperbaric exposure from whence all samples were taken to the laboratory. The elapsed time from collection-to-separation of the blood sample did not exceed the test site’s laboratory recommendations.[ 33]
Laboratory testing of venous serum samples was performed using the hexokinase enzymatic reference method with the GLUC3 kit of the cobas 6000 laboratory analyser’s c501 module (Roche Diagnostics GmbH, Mannheim, Germany) in the on-site biochemistry laboratory of the research facility. The laboratory is accredited as a human pathology testing provider by the National Association of Testing Authorities, Australia (NATA).[ 34] The cobas 6000 system has a standard deviation of 0.05 mmol·L-1 when the mean is 5.1 mmol·L-1. The precision diminishes at a higher glucose level of 14.2 (considered a pathological level) with a standard deviation of 0.16 mmol·L-1.[ 35]
STATISTICAL ANALYSIS
Mean absolute relative difference (MARD) calculation is currently the most widely accepted measurement for comparing the performance and accuracy of multiple meters in a single study.[ 36] MARD is determined by dividing the difference between the measured and reference values by the reference value and multiplying by 100 to generate a percentage.
For this study MARD was calculated by using two sets of data collected simultaneously. MARD was chosen for this review due to the requirement for direct clinical applicability of results.[ 37] The first set of data was obtained using the average of the three repeated capillary measures from the Freestyle Optium Neo H, while a standard laboratory measurement on venous samples provided the second dataset. The percentage reflects the average difference between capillary and the reference value. The mean of the readings from the three glucometers was compared to the venous laboratory sample. The similarity of these measures was confirmed first using a repeated-measures one-way analysis of variance (ANOVA) for each time point. The influence of time point was further examined by conducting repeated measures ANOVA using the mean capillary results as well as the venous serum values. Post hoc tests were examined to determine between which time points the differences were statistically significant.
Results
The average capillary and venous serum values obtained across the hyperbaric oxygen exposures are presented in Figure 2. Of note, at 25-minutes the cross-point blood glucose level was 4.7 mmol·L-1.
Figure 2.

BGL trends in capillary and venous serum samples during hyperbaric oxygen treatment. Values are means and the error bars display standard deviation
Descriptive data for capillary and venous serum values for the sample are shown in Table 2. The venous serum data demonstrate that all participants were euglycemic at baseline (BGL 3.8–5.4 mmol·L-1). The highest venous serum value was 5.90 mmol·L-1 at T3 and the highest capillary value was 6.30 mmol·L-1 obtained at T1.
Table 2. Venous serum and capillary blood glucose mmol·L-1 (n = 10) .
| Time-point | Mean (SD) | Range |
| T1: pre-dive | ||
| Venous Serum | 4.60 (0.50) | 3.80–5.40 |
| Capillary Average | 5.39 (0.42) | 4.77–6.07 |
| Capillary 1 | 5.33 (0.42) | 4.70–6.20 |
| Capillary 2 | 5.36 (0.48) | 4.70–6.30 |
| Capillary 3 | 5.47 (0.43) | 4.80–6.10 |
| T2: 1st air-break | ||
| Venous Serum | 4.72 (0.68) | 3.30–5.50 |
| Capillary Average | 4.72 (0.41) | 4.00–5.23 |
| Capillary 1 | 4.78 (0.43) | 4.20–5.30 |
| Capillary 2 | 4.66 (0.48) | 3.90–5.30 |
| Capillary 3 | 4.71 (0.43) | 3.90–5.30 |
| T31: 2nd air-break | ||
| Venous Serum | 4.94 (0.55) | 4.10–5.90 |
| Capillary Average | 4.60 (0.38) | 4.00–5.23 |
| Capillary 1 | 4.59 (0.36) | 3.90–5.10 |
| Capillary 2 | 4.67 (0.35) | 4.10–5.20 |
| Capillary 3 | 4.54 (0.52) | 3.90–5.40 |
ASSESSING DIFFERENCES BETWEEN REPEATED MEASURES
Variables were normally distributed and an examination of absolute skewness and kurtosis revealed that all model variables fell within skewness ≤ ± 2.0 and kurtosis ≤ ± 7.0.[ 38] The results were interpreted descriptively and clinically as comparable and this was confirmed by the repeated measures ANOVA which found no statistically significant differences between capillary measures pre-dive (T1) [Wilks Lambda = 0.711, F(2,8) = 1.626, P = 0.255], during the first air break (T2) [Wilks Lambda = 0.773, F(2,8) = 1.176, P = 0.357], and during the second air break (T3) [Wilks Lambda = 0.799, F(2,8) = 1.004, P = 0.408].
A statistically significant effect was found for time for the mean capillary values [Wilks Lambda = 0.117, F(2,8) = 30.068, P < 0.001]. The multivariate Partial Eta squared result was 0.883 suggesting a moderate to large effect as per Cohen’s (1988) classification.[ 39] Post hoc tests were examined to determine between which time points the differences were statistically significant. These tests suggest that the difference between the mean capillary result at T1 and both subsequent readings at T2 (P = 0.001) and T3 (P < 0.001) were statistically significant but the differences between T2 and T3 capillary results were not statistically significant. Differences in venous serum values across the time points were, however, not statistically significant [Wilks Lambda = 0.651, F(2,8) = 2.142, P = 0.180].
MEAN ABSOLUTE RELATIVE DIFFERENCE
The MARD reflects the percent variation that the capillary average differs from the reference value. Table 3 details descriptive data for the sample with respect to MARD percentages. As capillary scores were subtracted from the venous results, a negative MARD suggests that the venous serum value was less than the capillary value, and vice versa. As such, the results in Table 3 indicate that, on average, the venous serum BGL results were lower than capillary results at T1 and that this changed over the course of the HBOT. There was less average difference at T2 during the first air-break in the HBOT, although the range in values indicates that imprecision remains for some participants. In contrast, noting that the variation around the mean is reduced at T3 during the second air-break, the differences between the samples were not statistically significant.
Table 3. Mean absolute relative difference (MARD) (n = 10) .
| Sample time | MARD (%) Mean (SD) | MARD (%) Range |
| T1 | -17.94 (11.48) | -40.35–3.85 |
| T2 | -1.39 (14.09) | -35.35–11.11 |
| T3 | 6.44 (7.00) | -6.52–15.82 |
Individual variability was evident from the large standard deviations and minimum and maximum values. These MARD results suggest relatively poor correlation between venous and capillary results, especially pre-exposure and after 55 min of HBOT. Although this appears to hamper the clinical use of capillary readings (since scores not only have a low accuracy but the direction of agreement is inconsistent), this finding must be interpreted in the context of the physiological changes occurring in the capillary bed during HBOT.[ 40]
Discussion
This study assessed the accuracy and reliability of blood glucose values obtained from fingertip capillary samples in 10 euglycaemic non-diabetic participants tested by POC glucometer in hyperbaric conditions against contemporaneous venous serum blood glucose samples.
Self-monitoring blood glucose systems are regulated under several parameters including safety and reliability testing, analytical performance evaluation, and accuracy. The International Organisation for Standardisation stipulates the minimum accuracy criteria required from these systems. The latest version released in 2013, ISO 15197 is more rigorous than the first version of the standard; 95% of blood glucose results must fall within ± 0.83 mmol·L-1 at glucose ≤ 5.55 mmol·L-1 and within ± 15% at glucose ≥ 5.55 mmol·L-1.[ 41] The FreeStyle Optium™ Neo glucometer meets the ISO 15197:2013 standard and was assessed in accordance with this tertiary referral hospital’s institutional risk-assessment procedures[ 24] and was therefore deemed safe for use under therapeutic hyperbaric conditions.
In this study it was noted that capillary BGL measurements by POC glucometer were higher than laboratory-measured venous serum levels under normobaric conditions. This was consistent with the expected physiological decrement in BGL when sampling at different points along a metabolically active vascular bed. Although venous serum levels are often viewed as the ‘gold standard’ against which other measurements are validated, this is misleading as there is no single absolute BGL within the body at any given point in time. Glucose is the primary fuel source for most cellular activity under normal conditions and, as would be anticipated from first principles, the BGL progressively falls from the arterial ‘delivery’ side of the vascular bed to the venous ‘drainage’ side, with the capillary BGL being somewhere in between (Figure 3A). From a clinical perspective, it is the glucose delivery to the end-user tissues that is of paramount importance – and, it can be argued, this is better represented by the capillary sample than a downstream venous sample.
Figure 3.
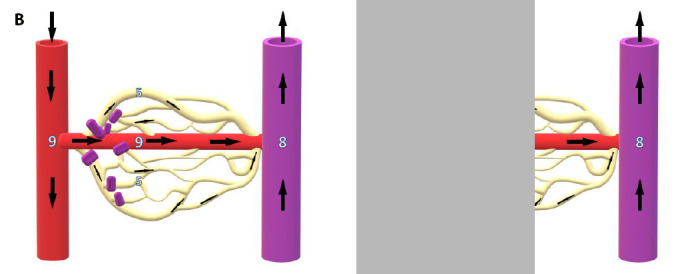
A. Resting microvasculature. Progressive reduction in BGL is evident as blood passes from arterial delivery side, through the metabolically active capillary bed, to the venous side of the circulation. B. Hyperoxic vasoconstriction. Closure of precapillary sphincters causes shunting of blood away from metabolically active capillary bed through metarterioles or other arteriovenous anastomoses. Constant metabolic demand in capillary bed therefore leads to increased glucose extraction from capillary blood and reversal of the usual capillary-venous BGL ratio. Numbers are notional BGLs in mmol·L-1
Hyperoxia, as encountered in HBOT, is a profound systemic vasoconstrictor. Constriction of pre-capillary arterioles diverts blood away from the capillary bed through arteriovenous anastomoses, increasing the shunt fraction, and resulting in arterial blood more directly reaching the veins. In the context of blood glucose levels this will lead to a relative elevation of the venous BGL in comparison to the capillary level (Figure 3B). This expected reversal of the normal capillary:venous BGL ratio during HBOT, secondary to vasoconstriction in the fingertips, has been previously reported in a limited sample (n = 4) during HBOT.[ 2]
From a technical perspective POC glucometers require a single use test strip to be inserted into the glucometer, one of three enzymes (glucose dehydrogenase, GD; glucose oxidase, GO; or hexokinase, HK) impregnated into the strip.[ 42 , 43] The enzyme acts on the whole blood obtained from a finger-prick taking 4 seconds to display a digital figure representative of capillary glucose on the POC glucometer.[ 44] All manufacturers of POC glucometers work within ISO 15197:2013 which requires that test strips should demonstrate 95% accuracy.
The effectiveness of the enzymatic reaction and thus accuracy can be influenced by many factors. Specifically – haematocrit or contaminant interference, difference in strip batches and strip rotting (an issue if the strips are stored in-chamber due the repeated adiabatic temperature changes during compression/decompression).[ 45] However, a significant consideration for the hyperbaric physician is the effect of partial pressures of oxygen (PPO2) in the HBOT environment. A bench study by Tang et al., on venous serum from diabetics indicated oxygen can lower glucose measurements obtained with GO-based amperometric test strips.[ 18 This supports evidence from multiple studies that note issues with the enzyme reaction of the test strips used in a glucometer in hyperbaric and hypobaric environments and the respective PPO2.[ 9 , 20 , 46 , 47] Test strips at this institution’s hyperbaric unit, including those used in this study, are therefore routinely stored outside the chamber and taken inside only as required to minimise this potential confounder.
Conclusion
The FreeStyle Optium™ Neo H glucometer meets clinical requirements and provides a reliable measurement of blood glucose in the HBOT environment. The results of this work are consistent with the changes anticipated (from first principles) in BGL measurements under HBOT conditions. Capillary BGL is higher than venous pre-HBOT but falls to the same or lower levels during HBOT as peripheral vasoconstriction leads to an increased shunt fraction and the diversion of blood away from skin capillaries. This results in (i) the ‘arterialisation’ of venous blood glucose levels and (ii) increased glucose extraction from the reduced blood supply in the capillary bed in order to meet the stable metabolic demands of end-organ tissues, leading to a reversal of the normal venous:capillary BGL ratio.
The concept of what constitutes the ‘gold-standard’ BGL needs to be reconsidered in the hyperbaric context. Ultimately, it is the adequacy of glucose supply to end-user tissues that is of clinical relevance. Venous samples processed in an accredited laboratory may be more consistently accurate, but (i) delays in sample processing may cause artefactual reduction in BGL and (ii) measurement downstream of the metabolically-active end-organ vascular beds (and/or vascular shunts) renders interpretation of results problematic. Arterial samples provide a better assessment of the adequacy of glucose supply but are technically more difficult to perform, and painful for the patient. We would argue strongly that point-of-care testing of capillary samples should be regarded as the gold-standard in clinical practice. Capillary POC testing avoids delays in sample processing and provides the single most relevant blood glucose value irrespective of microvascular flow changes: the BGL present at the level of the end-user tissues.
Footnotes
Conflicts of interest and funding: nil
Contributor Information
Carol R Baines, Department of Diving and Hyperbaric Medicine, Royal Hobart Hospital, Hobart, Tasmania, Australia.
P David Cooper, Department of Diving and Hyperbaric Medicine, Royal Hobart Hospital, Hobart, Tasmania, Australia.
Geraldine A O’Rourke, Office of the Chief Nurse and Midwife, Health Professional Policy and Advisory Services, Department of Health, Tasmania, Australia.
Charne Miller, Alfred Health Clinical School, La Trobe University, Prahran, Victoria, Australia.
References
- Jain KK. Textbook of Hyperbaric Medicine [eBook]. Springer International Publishing; 2017. Available from: https://doi.org/10.1007/978-3-319-47140-2. [cited 2019 May 22]. [Google Scholar]
- McIlroy D, Banham N. Comparison of venous glucose to finger-prick glucose in patients with diabetes under hyperbaric hyperoxic conditions: A pilot study . Diving Hyperb Med. 2013;43:226–8. [PubMed] [Google Scholar]
- Wilkinson D, Banham N, Nolting M, Mahadi MK, Chapman IM, Heilbronn LK. Hyperbaric oxygen therapy increases insulin sensitivity in overweight men with and without type 2 diabetes . Diving Hyperb Med. 2015;45:30–6. [PubMed] [Google Scholar]
- Trytko B. Does hyperbaric oxygen affect blood sugar levels in diabetics? [Abstract]. SPUMS Journal. 2002; 32: 138 Available from: http://archive.rubicon-foundation.org/7686. [cited 2019 May 25]. [Google Scholar]
- Ekanayake L, Doolette DJ. Effects of hyperbaric oxygen treatment on blood sugar levels and insulin levels in diabetes. SPUMS Journal. 2001; 31: 16- 20. Available from: http://archive.rubicon-foundation.org/xmlui/bitstream/handle/123456789/7701/SPUMS_V31N1_3.pdf?sequence=1. [cited 2019 May 08]. [Google Scholar]
- Peleg RK, Fishlev G, Bechor Y, Bergan J, Friedman M, Koren S, et al. Effects of hyperbaric oxygen on blood glucose levels in patients with diabetes mellitus, stroke or traumatic brain injury and healthy volunteers: A prospective, crossover, controlled trial . Diving Hyperb Med. 2013;43:218–21. [PubMed] [Google Scholar]
- Capelli-Schellpfeffer M Pilipson L, Bier M, Howe L, Boddie A. HBO and hypoglycaemia in diabetic surgical patients with chronic wounds . Undersea Hyperb Med. [Abstract]. 1996; 23 (Suppl): 81 Available from: http://archive.rubicon-foundation.org/569. cited 2019 May 08. [Google Scholar]
- Kingston W Fabus S, Niezgoda J. Effects of hyperbaric oxygen on blood glucose levels . Undersea Hyperb Med. [Abstract]. 2002; 29: 144 Available from: http://archive.rubicon-foundation.org/1082. [cited 2019 May 30]. [Google Scholar]
- Vote DA, Rose CH, Gleaton CH, Moon RE. Serial plasma glucose in diabetic patients during hyperbaric oxygen therapy (HBO) [Abstract]. Undersea Hyperb Med. 2000; 27 (Supp): 62 Available from: http://archive.rubicon-foundation.org/6918. [cited 2019 May 15]. [Google Scholar]
- Lo C, Jun M, Badve SV, Pilmore H, White SL, Hawley C, et al. Glucose-lowering agents for treating pre-existing and new-onset diabetes in kidney transplant recipients. Cochrane Database Syst Rev. 2017;2:CD009966. doi: 10.1002/14651858.CD009966.pub2. [DOI] [PMC free article] [PubMed] [Google Scholar]
- Perdrizet G, Gasho K, Fan L, Qureshi I. Does hyperbaric oxygen therapy cause hypoglycaemia in diabetic patients? a review of 119 diabetic patients treated in a multiple chamber. [Abstract]. Undersea Hyperb Med. 2007; 34: 246 Available from: http://archive.rubicon-foundation.org/5100. [cited 2019 April 14]. [Google Scholar]
- Price ME, Hammett-Stabler C, Kemper GB, Davis MG, Piepmeier EH Jr. Evaluation of glucose monitoring devices in the hyperbaric chamber. Military Med. 1995;160:143–6. [PubMed] [Google Scholar]
- Hampson NB, Atik D. Central nervous system oxygen toxicity during routine hyperbaric oxygen therapy. Undersea Hyperb Med. 2003;30:147–53. [PubMed] [Google Scholar]
- Plafki C, Peters P, Almeling M, Welslau W, Busch R. Complications and side effects of hyperbaric oxygen therapy. Aviat Space Environ Med. 2000;71:119–24. [PubMed] [Google Scholar]
- Hart GB, Strauss MB. Central nervous system oxygen toxicity in a clinical setting. In: Bove AA, Bachrach AJ, Greenbaum LJ, editors . Undersea and hyperbaric physiology IX. Proceedings of the ninth international symposium on underwater and hyperbaric physiology. Bethesda (MD): Undersea Hyperbaric Medical Society; 1987. p. 695- 9. [Google Scholar]
- Schifman RB, Nguyen TT, Page ST. Reliability of point-of-care capillary blood glucose measurements in the critical value range. Arch Pathol Lab Med. 2014;138:962–6. doi: 10.5858/arpa.2013-0455-OA. [DOI] [PubMed] [Google Scholar]
- Tang Z, Louie RF, Lee DM, Miller EE, Kost G. Oxygen effects on glucose meter measurements with glucose dehydrogenase and oxidase-based test strips for point of care testing. Critical Care Med. 2001;29:1062–9. doi: 10.1097/00003246-200105000-00038. [DOI] [PubMed] [Google Scholar]
- Hermayer KL, Loftley AS, Reddy S, Narla SN, Epps NA, Zhu Y. Challenges of inpatient blood glucose monitoring: standards, methods, and devices to measure blood glucose. Curr Diab Rep. 2015;15(3):10. doi: 10.1007/s11892-015-0582-9. [DOI] [PubMed] [Google Scholar]
- Shafer MR. 1991 Federal Nursing Service Award Recipient. The effect of increased atmospheric pressure on glucose reagent strip accuracy. Mil Med. 1992;157:162–5. [PubMed] [Google Scholar]
- Edge CJ, Grieve AP, Gibbins N, O’Sullivan F, Bryson P. Effects of pressure on whole blood glucose measurements using the Bayer Glucometer 4 blood glucose meter. Undersea Hyperb Med. 1996;23:221–4. [PubMed] [Google Scholar]
- Vote DA, Doar O, Moon RE, Toffaletti JG. Blood glucose meter performance under hyperbaric oxygen conditions. Clin Chim Acta. 2001;305:81–7. doi: 10.1016/s0009-8981(00)00418-6. [DOI] [PubMed] [Google Scholar]
- Burman F, Sheffield R, Posey K. Decision process to assess medical equipment for hyperbaric use. Undersea Hyperb Med. 2009; 36: 137- 44. Available from: http://archive.rubicon-foundation.org/8368. [cited 2019 May 23]. [PubMed] [Google Scholar]
- Sheffield PJ, Desautels DA. Hyperbaric and hypobaric chamber fires: A 73-year analysis. Undersea Hyperb Med. 1997;24:153–64. [PubMed] [Google Scholar]
- Tsouras T. Test results for the evaluation of a glucometer for use under hyperbaric conditions: Technical report. Undersea Hyperb Med. 2017;44:27–32. doi: 10.22462/1.2.2017.5. [DOI] [PubMed] [Google Scholar]
- National Fire Protection Association . NFPA 99. Health Care Facilities Code, Hyperbaric Facilities 99-116. 2018. ISBN 978-145591679-5.
- Australian Standard AS/NZS 4774.2-2019. Work in compressed air and hyperbaric facilities. In Part 2: Hyperbaric oxygen facilities. Sydney, Australia: Standards Australia International Ltd; 2019. Available from: https://infostore.saiglobal.com. [cited 2019 April 12]. [Google Scholar]
- Australian Standard AS/NZS 2299.1.2015. Occupational diving operations. Standard operational practice - Supplement 1: AS/NZS 2299 diving medical examination forms (Supplement to AS/NZS 2299.1:2015). Sydney, Australia: Standards Australia International Ltd; 2015. Available from: https://infostore.saiglobal.com. [cited 2019 April 12]. [Google Scholar]
- Feingold K, Grunfeld C. Diabetes and dyslipidemia. In: De Groot LJ, Chrousos G, Dungan K, editors. Diabetes and dyslipidemia. South Dartmouth (MA): National Library of Medicine, National Institutes of Health; 2019. Bookshelf ID NBK305900. [Google Scholar]
- Schofield JD, Liu Y, Rao-Balakrishna P, Malik RA, Soran H. Diabetes dyslipidemia. Diabetes Ther. 2016;7:203–19. doi: 10.1007/s13300-016-0167-x. [DOI] [PMC free article] [PubMed] [Google Scholar]
- Amron International . Available from: https://www.amronintl.com/amron-products/oxygen-treatment-hoods.html. [cited 2019 October 30].
- Abbott Diabetes Care . Available from: https://www.myfreestyle.com.au/products/freestyle-optium-neo-blood-glucose-ketone-monitoring-system/. [cited 2019 October 30].
- Bowen RAR, Remaley AT, Olsen B. Interferences from blood collection tube components on clinical chemistry assays. Biochemia Medica (Zagreb). 2014;24:31–44. doi: 10.11613/BM.2014.006. [DOI] [PMC free article] [PubMed] [Google Scholar]
- Hartley T. User’s guide to pathology services – Royal Hobart Hospital Pathology Services incorporating pathology south. 2014. Available from: https://www.dhhs.tas.gov.au/service_information/information/pathology_-_royal_hobart_hospital. [cited 2019 March 15].
- National Association of Testing Authorities (NATA) Australia. Available from: http://www.nata.com.au. [cited 2019 March 02].
- van Gammeren AJ, van Gool N, de Groot MJM, Cobbaert CM. Analytical performance evaluation of the Cobas 6000 analyzer – special emphasis on trueness verification. Clin Chem Lab Med. 2008;46:863–71. doi: 10.1515/CCLM.2008.159. [DOI] [PubMed] [Google Scholar]
- Klaff LJ, Brazg R, Hughes K, Tideman AM, Schachner HC, Stenger P, et al. Accuracy evaluation of contour next compared with five blood glucose monitoring systems across a wide range of blood glucose concentrations occurring in a clinical research setting. Diabetes Technol Ther. 2015;17:8–15. doi: 10.1089/dia.2014.0069. [DOI] [PubMed] [Google Scholar]
- Simmons DA. How should blood glucose meter system analytical performance be assessed? J Diabetes Sci Technol. 2015;10:178–84. doi: 10.1177/1932296815598599. [DOI] [PMC free article] [PubMed] [Google Scholar]
- West SG, Finch JF, Curran PJ. Structural equation models with non-normal variables: problems and remedies. In: Hoyle RH, editor. Structural equation modelling: Concepts, issues and applications. Newbery Park (CA): Sage; 1995. p. 56- 75. [Google Scholar]
- Cohen J. Set correlation and contingency tables. Appl Psychol Meas. 1988;12:425–34. doi: 10.1177/014662168801200410. [DOI] [Google Scholar]
- Pardo S, Simmons DA. The quantitative relationship between ISO 15197 accuracy criteria and mean absolute relative difference (MARD) in the evaluation of analytical performance of self-monitoring of blood glucose (SMBG) systems. J Diabetes Sci Technol. 2016;10:1182–7. doi: 10.1177/1932296816644468. [DOI] [PMC free article] [PubMed] [Google Scholar]
- International Standards Organisation. ISO 15197:2013. In vitro diagnostic test systems – Requirements for blood-glucose monitoring systems for self-testing in managing diabetes mellitus. p. 1- 46. Available from: https://www.iso.org/standard/54976.html. [cited 2019 April 12].
- Tonyushkina K, Nichols JH. Glucose meters: A review of technical challenges to obtaining accurate results. J Diabetes Sci Technol. 2009;3:971–80. doi: 10.1177/193229680900300446. [DOI] [PMC free article] [PubMed] [Google Scholar]
- Hones J, Muller P, Surridge N. The technology behind glucose meters: test strips. Diabetes Technol Therapeut. 2008;10:S10–S26. doi: 10.1089/dia.2008.0005. [DOI] [Google Scholar]
- Vaddiraju S, Burgess DJ, Tomazos I, Jain FC, Papadimitrakopoulos F. Technologies for CGM: Current problems and future promise. J Diabetes Sci Technol. 2010;4:1540–62. doi: 10.1177/193229681000400632. [DOI] [PMC free article] [PubMed] [Google Scholar]
- Cavallini A, Qloudlab SA. Amperometric test strips for point of care biosensors: An overview. White Paper©. March; 2015. Available from: https://pdfs.semanticscholar.org/fd0e/f36c0722b304e58524f2a17fb801238ed8a0.pdf?_ga=2.21386361.333283664.1573198073-2036622705.1573198073. [cited 2019 May 23].
- Oberg D, Ostenson C-G. Performance of glucose dehydrogenase and glucose oxidase-based blood glucose meters at high altitude and low temp. Diabetes Care. 2005;28:1261. doi: 10.2337/diacare.28.5.1261. [DOI] [PubMed] [Google Scholar]
- Ginsberg BH. Factors affecting blood glucose monitoring: Sources of errors in measurement. J Diabetes Sci Technol. 2009;3:903–13. doi: 10.1177/193229680900300438. [DOI] [PMC free article] [PubMed] [Google Scholar]