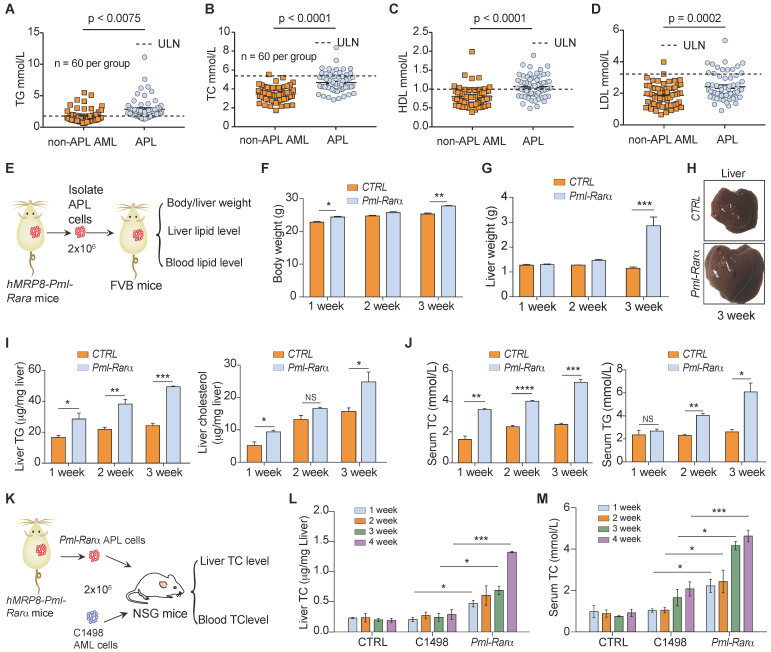
Figure 1.
Lipid profiles of patients with APL and mice transplanted with APL cells from hMRP8-Pml-Rarα APL mice. (A-D) Serum triglyceride (TG), total cholesterol (TC), high-density lipoprotein (HDL) and low-density lipoprotein (LDL) levels in APL patients (n = 60) and non-APL AML patients (n = 60) were evaluated before induction therapy. (E) Approaches to define the effects of murine APL cells or normal spleen cells on the body/liver weights, liver lipid levels, and blood lipid levels of FVB recipient mice. (F and G) Body weights (F) and liver weights (G) of the FVB recipient mice transplanted with normal spleen cells (CTRL) and Pml-Rarα APL cells (Pml-Rarα) at the indicated times after inoculation. (H) Representative liver morphologies of CTRL and Pml-Rarα recipient mice at 3 weeks after inoculation. (I) Total triglyceride (TG) and cholesterol levels of the liver lipids extracted using the chloroform/methanol method. The data were normalized to the liver weights and are represented as the mean ± the standard error (SEM). N = 3 mice per group. (J) Serum TG and total cholesterol (TC) levels in the CTRL and Pml-Rarα recipient FVB mice at the indicated times after inoculation. (K) Approaches to define the effects of murine APL cells or non-APL AML cells (C1498) on liver and blood TC levels in NSG recipient mice. (L and M) Liver and serum TC levels in recipient NSG mice transplanted with normal spleen cells (CTRL), Pml-Rarα APL cells, or C1498 AML cells at the indicated times after inoculation. For panels F-M, n = 4 mice per group. APL: acute promyelocytic leukemia; AML: acute myeloid leukemia; ULN: upper limits of normal.

