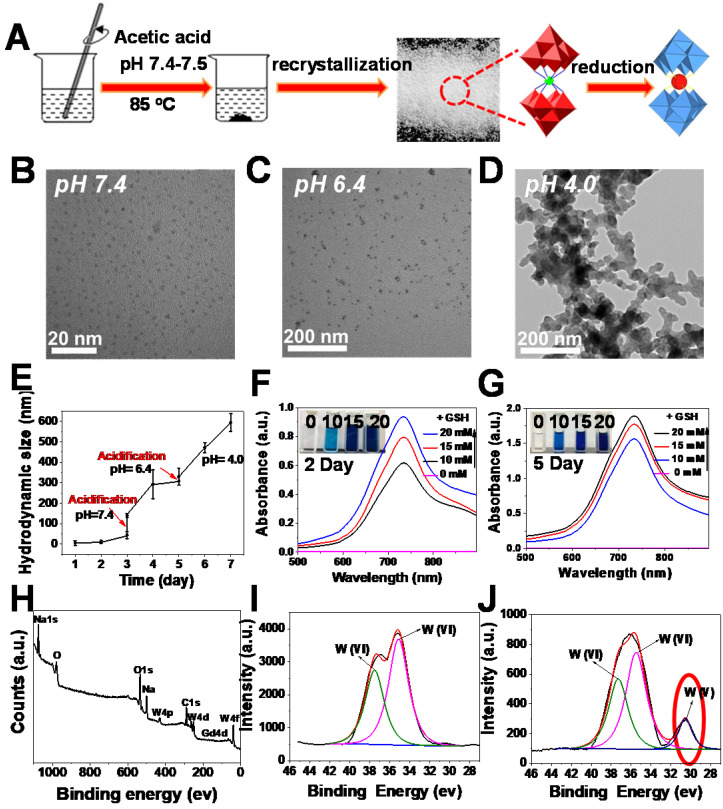
Figure 1.
Synthesis and characterization of oxidized and reduced GdW10O36 NCs. (A) Schematic diagram of synthesis. (B-D) TEM images of nanoclusters at pH = 7.4, 6.4 and 4.0. (E) DLS measurements of GdW10O36 NCs with continuous acidification from pH = 7.4 to 4.0. UV-vis spectra and corresponding photographs of GdW10O36 clusters before and after reduction in the presence of various concentrations of GSH (0, 10, 15, and 20 mM) on the 2nd (F) and 5th day (G). (H) XPS spectra of GdW10O36 NCs. (I-J) XPS spectra of W 4f in GdW10O36 NCs before and after reduction.

