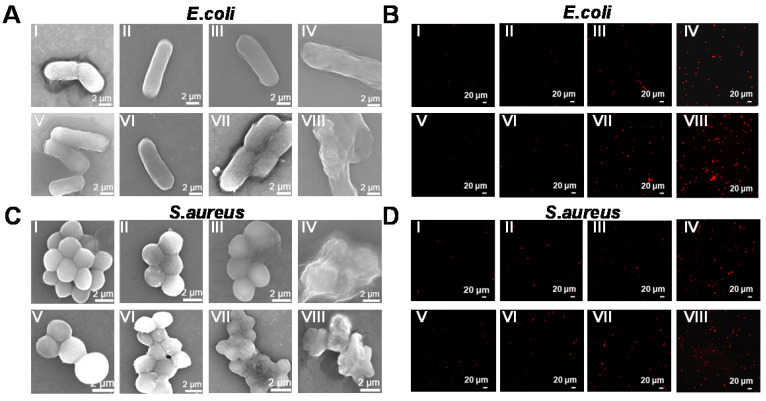
Figure 7.
Morphology and live/dead staining imaging of E. coli and S. aureus bacteria after different treatments. SEM images (A, C) and fluorescent staining photographs (B, D) of E. coli and S. aureus display bacterial membrane changes after different treatments. (I) Control, (II) Reduced GdW10O36, (III) H2O2, (IV) Reduced GdW10O36+H2O2, (V) Control+NIR, (VI) Reduced GdW10O36+NIR, (VII) H2O2 +NIR, and (VIII) GdW10O36 + H2O2 +NIR. (A, C: Scale bar represents 2 µm; B, D: Scale bar represents 20 µm).

