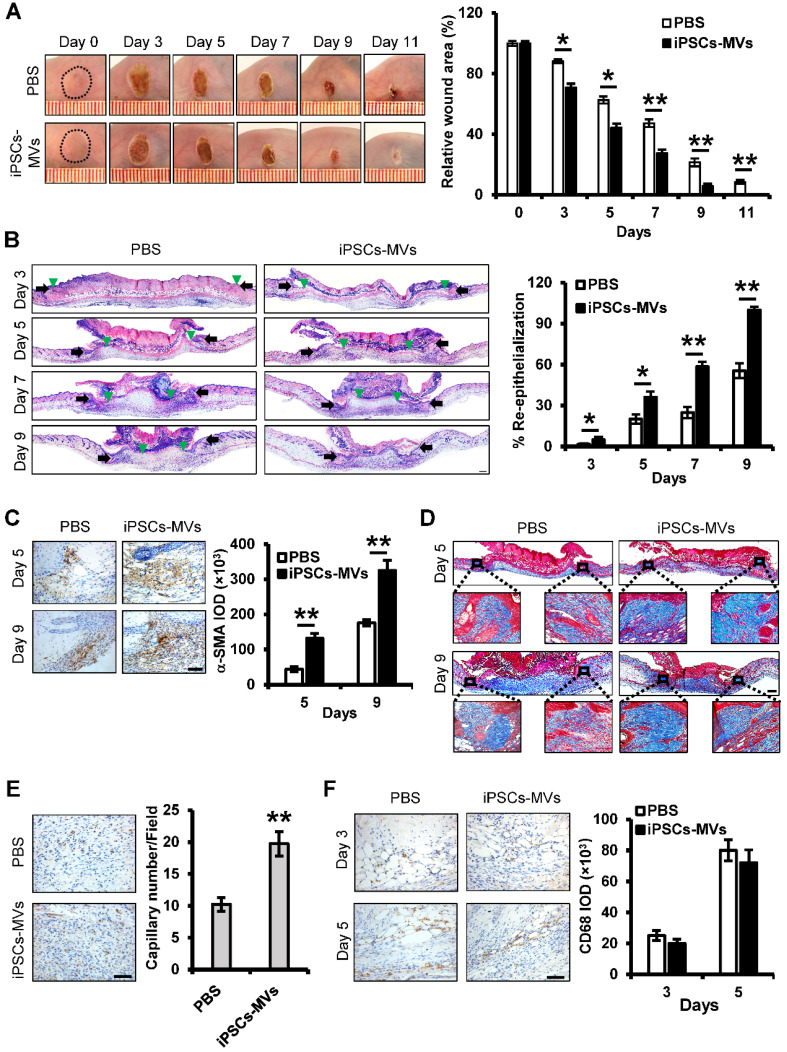
Figure 3.
iPSCs-MVs accelerate deep second-degree burn wound healing and promote keratinocytes migration in vivo. (A) Representative macroscopic images of wounds treated with PBS or iPSCs-MVs on days 0, 3, 5, 7, 9 and 11 after wounding (left panel). Quantitative analysis of wound area per group, expressed as the percentage of the initial wound size at day 0 (right panel). n = 6 mice per group. (B) Representative photomicrographs of H&E-stained wounds per group on days 0, 3, 5, 7 and 9 after wounding. Black arrows represent the dermal border; green arrows represent the epidermal margin (left panel). Scale bar = 200 µm. Quantitative profiles of the re-epithelialization ration of wounds (right panel). The re-epithelialization was calculated as described in Materials and Methods. (C) Representative photomicrographs of α-SMA immunostaining of wounds per group on days 5 and 9 after wounding (left panel). Scale bar = 50 µm. The areas stained with α-SMA were determined by planimetric image analysis using Image Pro Plus 6.0 software (right panel). (D) Representative photomicrographs of Masson's trichrome-stained wounds per group on days 5 and 9 after wounding. (E) Representative photomicrographs of CD31 immunostaining of wounds per group on days 11 after wounding (left panel). Scale bar = 50 µm. The numbers of stained capillaries were counted (right panel). Statistics regarding the number of stained capillaries were obtained using five randomly selected fields of view for each group. (F) Representative photomicrographs of CD68 immunostaining of wounds per group on days 3 and 5 after wounding (left panel). Scale bar = 50 µm. The areas stained with CD68 were determined by planimetric image analysis using Image Pro Plus 6.0 software (right panel). All values are expressed as mean ± SD from three independently repeats, *P < 0.05, **P < 0.01 compared with control.

