Abstract
Background
Lung adenocarcinomas (ADCs) show heterogeneous morphological patterns that are classified into five subgroups: lepidic predominant, papillary predominant, acinar predominant, micropapillary predominant and solid predominant. The morphological classification of ADCs has been reported to be associated with patient prognosis and adjuvant chemotherapy response. However, the molecular mechanisms underlying the morphology differences among different subgroups remain largely unknown.
Methods
Using the molecular profiling data from The Cancer Genome Atlas (TCGA) lung ADC (LUAD) cohort, we studied the molecular differences across invasive ADC morphological subgroups.
Results
We showed that the expression of proteins and mRNAs, but not the gene mutations copy number alterations (CNA), were significantly associated with lung ADC morphological subgroups. In addition, expression of the FOXM1 gene (which is negatively associated with patient survival) likely plays an important role in the morphological differences among different subgroups. Moreover, we found that protein abundance of PD-L1 were associated with the malignancy of subgroups. These results were validated in an independent cohort.
Conclusions
This study provides insights into the molecular differences among different lung ADC morphological subgroups, which could lead to potential subgroup-specific therapies.
Keywords: Lung adenocarcinoma (lung ADC), morphological subgroup, differentiation, FOXM1
Introduction
Lung cancer is the leading cause of death from cancer in the United States and worldwide (1-3). Lung adenocarcinoma (ADC) is the most common histologic subtype, comprising 40% of lung cancers (1,4). Over 70–90% of surgically resected lung cancers were invasive ADCs (1,5). In 2011, the International Association for the Study of Lung Cancer (IASLC), American Thoracic Society (ATS), and European Respiratory Society (ERS) proposed to classify invasive lung ADCs into 5 morphological subgroups, lepidic predominant ADC (LPA), papillary predominant ADC (PPA), acinar predominant ADC (APA), micropapillary predominant ADC (MPA) and solid predominant ADC (SPA) (1).
The morphological classification was reported to be a prognostic factor of lung ADC patients. For example, a study with 292 lung ADC patients by Gu et al. showed that patients with LPAs, PPAs/APAs and MPAs/SPAs formed three distinct survival groups (6). Similar results were also reported by Russell et al. (7). In addition, Hung et al. (8) showed that lung ADC patients with MPAs and SPAs had worse disease-specific survival. In a study with 440 lung ADC patients, Yoshizawa et al. (9) showed that the 5-year disease free survival rate was the lowest in MPAs and SPAs, and the tumors in these subgroups recurred more frequently compared with those in other morphological subgroups. Overall, LPAs were associated with more favorable survival outcomes, while patients whose tumors were in the MPA and SPA morphological subgroups showed worse prognosis. Patients with PPA and APA tumors were in the intermediate groups. The ADC morphological classification was also reported to be associated with patient adjuvant chemotherapy response. Tsao et al. (10) showed that MPA/SPA patients benefit from adjuvant chemotherapy in terms of disease-specific survival. Luo et al.’s study of invasive lung ADC stage IB patients (11) showed that MPA/SPA classification was a predictive factor for adjuvant chemotherapy benefit in terms of disease-specific survival. Hung et al. (8) reported that the SPA morphological subtype was predictive of treatment benefit for patients undergoing adjuvant chemotherapy.
Although the morphological subgroups have been reported to be associated with prognosis and adjuvant chemotherapy response in lung ADC patients, the underlying molecular mechanisms that lead to the morphological differences among the subgroups is largely unknown. Tsuta et al. (12) examined the mutation status of KRAS and EGFR, and ALK rearrangements in 757 ADC patients, and showed that EGFR mutations were prevalent in PPA, while ALK rearrangements were prevalent in MPA and APA. In a study with 19 lung ADC patients, Vinayanuwattikun et al. (13) reported no apparent difference in the patterns of mutated genes or somatic copy number alterations (CNA) across 3 groups, LPA, Non-LPA and adenocarcinoma in situ (AIS)/minimally invasive adenocarcinoma (MIA). Zhang et al. compared 4 SPA patients with 4 APA patients and showed that differentially expressed genes were enriched in pathways of RNA polymerase activity and p53 inactivation (14). Zabeck et al. also reported distinct transcriptomic differences using a cohort of 48 invasive lung ADC patients (15). Although these studies provide valuable insights into the underlying molecular mechanisms, they are largely limited by the small number of genes being examined or the small sample size. A study of genome-wide molecular profiles in a large ADC patient cohort is greatly needed for a comprehensive investigation of the molecular mechanisms underlying the morphological subgroups.
In this study we used the comprehensive molecular profiling data from The Cancer Genome Atlas (TCGA) lung ADC (LUAD) dataset (16), including DNA mutation, CNAs, mRNA expression and protein abundance, to characterize the molecular patterns of these morphological subgroups. Our analysis showed that the protein abundance and mRNA expression, but not the patterns of gene mutations or CNAs, were significantly associated with the morphological subgroups of invasive lung ADCs. FOXM1 is likely an important molecular biomarker associated with different morphological subgroups. Moreover, we found that both the gene expression and protein abundance of PD-L1 were associated with the malignancy of the morphological subgroups. These results were validated in an independent cohort. Our work provides insights into the molecular mechanisms underlying the ADC morphological subgroups and provides hints for future subgroup-specific therapies.
Methods
Statement of ethics approval
This study is a computational study of existing datasets, so the Ethics Approval is not required.
Source of data
The discovery cohort was originally from TCGA-LUAD (16). The mutation annotation, mRNA expression and protein abundance datasets used in this study were downloaded from the third-party website Synapse in November 2015 (17). The CNA dataset was obtained from Firehose in November 2016 (18). The protein abundance was measured by reverse phase protein array (RPPA), mRNA expression was measured by RNA-seq, DNA mutation was measured by exon-seq, and CNAs were measured by single nucleotide polymorphisms (SNP) array.
Morphological subgroup classification of the TCGA LUAD patient cohort was performed by Drs. William D. Travis and Adi Gazdar by examining pathology slides according to the IASLC/ATS/ERS classification of lung ADCs (1). In total, 212 patients with both morphological classification and molecular profiling data were selected as the discovery cohort (Table S1). The validation cohort was from the Clinical Lung Cancer Genome Project (CLCGP) and Network Genomic Medicine (NGM) (19). In total, 38 patients with both subgroup classification and mRNA profiling data were selected as the validation cohort (Table S2). Due to the small sample size of the validation cohort, 5 subgroups were combined into 2 categories for analysis, non-solid predominant ADCs (Non-SPAs, n=27) and solid predominant ADCs (SPAs, n=11), since these two sub-types are the most clinically important sub-groups.
Table S1. Number of patients in each omics dataset in the discovery cohort.
| Dataset | LPA | PPA | APA | MPA | SPA | Total |
|---|---|---|---|---|---|---|
| Pathological classification | 13 | 27 | 82 | 26 | 64 | 212 |
| Protein abundance | 12 | 22 | 57 | 18 | 52 | 161 |
| mRNA expression | 13 | 27 | 82 | 26 | 63 | 211 |
| Mutation | 13 | 26 | 82 | 25 | 63 | 209 |
| Copy number alteration | 13 | 27 | 81 | 25 | 64 | 210 |
LPA, lepidic predominant ADC; PPA, papillary predominant ADC; APA, acinar predominant ADC; MPA, micropapillary predominant ADC; SPA, solid predominant ADC.
Table S2. Number of patients in each omics dataset in the validation cohort.
| Dataset | LPA | PPA | APA | MPA | SPA | Total |
|---|---|---|---|---|---|---|
| Pathological classification | 4 | 40 | 68 | 23 | 61 | 196 |
| mRNA expression | 2 | 9 | 11 | 5 | 11 | 38 |
LPA, lepidic predominant ADC; PPA, papillary predominant ADC; APA, acinar predominant ADC; MPA, micropapillary predominant ADC; SPA, solid predominant ADC.
Pathway analysis
The pathway analysis was performed using DAVID Bioinformatics Resources (version 6.8) (https://david.ncifcrf.gov/) with the default settings (20,21). The categories included molecular function (MF), biological process (BP) and cellular component (CC) categories from Gene Ontology (GOTERM). Fisher’s exact tests were performed to assess the enrichment of each pathway using DAVID. Bonferroni P value adjustment was used to control the multiple comparisons issue.
The adenocarcinomas-squamous cell carcinomas (ADC-SCC) score
The degree of differentiation for each ADC patient was estimated by using an adenocarcinoma-squamous cell carcinoma (ADC-SCC) score derived from a 42-gene signature, which was differentially expressed in ADCs and SCCs (22). Based on the original study (22), the higher the ADC-SCC score (in absolute value), the more differentiated the ADCs.
Single sample gene set enrichment analysis
Single sample Gene Set Enrichment Analysis (ssGSEA) (23) and immune cell gene sets (24) were used to evaluate the immune cell activity in the discovery cohort. The enrichment score generated by ssGSEA indicates the activity level of the biological process represented by the gene set. In the ssGSEA, the alpha value was set to 0.25 according to the original reference (23). This calculation was repeated for each gene set and each sample. We used the immune cell type-specific gene sets (24) to estimate the levels of immune cell activities.
Associations between molecular profiles and morphological subgroups
Welch’s ANOVA was used to test whether the mean was the same across different morphological subgroups for the copy number, mRNA expression and protein abundance of each gene. Compared with the classical ANOVA method which assumes homogeneity of variance, Welch’s ANOVA does not rely on the assumption of homogeneity of variance, therefore it is a better fit for this study as some LPA morphological subgroups have relatively small sample size, and the equal variance assumption is hard to test. In addition, we performed classical ANOVA test with and without adjustment for stage, in order to investigate whether the stage of ADCs affects the results. The Fisher’s exact test was used to test whether the proportion of each mutated gene was the same across subgroups. The Jonckheere-Terpstra test was used to test the monotonic trend of molecular features. Bonferroni p-value adjustment was used to control the multiple comparisons issue. Results with Bonferroni-adjusted P value ≤0.05 were considered statistically significant.
Permutation of morphological subgroup labels to estimate the false discovery rate (FDR)
In order to construct a negative control dataset to estimate the FDR in the analysis, the original morphological subgroup labels of patients were randomly assigned to the patients. Welch’s ANOVA was performed for each antibody in the protein abundance dataset based on the new assignment. This process was repeated 100 times. The averaged frequency of p-values in each bin was calculated. Theoretically, if the P values are completely random and independent, they will follow a uniform distribution between 0 and 1, i.e., the average number of P values in each bin should be close to each other.
Computational environment
All computations were conducted in the R environment, version 3.3.2 (RStudio Team 2016; R Core Team 2017). R packages “clinfun” (version 1.0.15), “GSVA” (version 1.22.4), “survival” (version 2.40-1) and “beeswarm” (version 0.2.3) were used.
Results
Patient characteristics
Among the 212 patients in the discovery cohort (TCGA LUAD dataset), 13 (6.1%) patients were diagnosed with LPAs, 27 (12.7%) with PPAs, 82 (38.7%) with APAs, 26 (12.3%) with MPAs and 64 (30.2%) with SPAs. Among the 38 patients in the validation cohort (the CLCGP and NGM dataset), 2 (5.3%) were diagnosed with LPAs, 9 (23.7%) with PPAs, 11 (28.9%) with APAs, 5 (13.2%) with MPAs and 11 (28.9%) with SPAs. The Non-SPAs accounted for 71.1% of the validation cohort. The median overall survival of the discovery cohort was 13.2 months [low quartile (LQ)–high quartile (HQ): 3–30 months], and it was 18 months (LQ–HQ: 15–29 months) in the validation cohort (Table 1).
Table 1. Characteristics of the discovery and validation cohorts.
| Characteristics | Discovery cohort | Validation cohort |
|---|---|---|
| Number of patients | 212 | 38 |
| Gender (%) | ||
| Male | 90 (42.5) | 18 (47.4) |
| Female | 122 (57.5) | 20 (52.6) |
| Age at diagnosis, years, median [LQ–HQ] | 67 [59, 72] | 66 [57, 74] |
| Smoking status (%) | ||
| Current smoker | 39 (18.4) | 26 (68.4) |
| Former | 133 (62.7) | 6 (15.8) |
| Never | 29 (13.7) | 5 (13.2) |
| NA | 11 (5.2) | 1 (2.6) |
| Morphological subgroup (%) | ||
| Lepidic predominant | 13 (6.1) | 2 (5.3) |
| Papillary predominant | 27 (12.7) | 9 (23.7) |
| Acinar predominant | 82 (38.7) | 11 (28.9) |
| Micropapillary predominant | 26 (12.3) | 5 (13.2) |
| Solid predominant | 64 (30.2) | 11 (28.9) |
| Follow-up, months, median [LQ–HQ] | 13.2 [3, 30] | 18 [15, 29] |
| Vital status (%) | ||
| Alive | 151 (71.2) | 29 (76.3) |
| Deceased | 61 (28.8) | 9 (23.7) |
| Stage* (%) | ||
| I | 3 (1.4) | 0 (0) |
| IA | 51 (24.0) | 6 (15.8) |
| IB | 62 (29.2) | 14 (36.8) |
| IIA | 15 (7.1) | 1 (2.6) |
| IIB | 28 (13.2) | 4 (10.5) |
| IIIA | 33 (15.6) | 5 (13.2) |
| IIIB | 8 (3.8) | 8 (21.1) |
| IV | 12 (5.7) | 0 (0) |
Discovery cohort is from The Cancer Genome Atlas (TCGA) – lung ADC (LUAD) dataset. Validation cohort is generated by the Clinical Lung Cancer Genome Project (CLCGP) and Network Genomic Medicine (NGM). *, American Joint Committee on Cancer (AJCC) pathologic stage for the discovery cohort and the Union for International Cancer Control (UICC) stage for the validation cohort. LQ, low quartile; HQ, high quartile.
Overall molecular differences across morphological subgroups
The mutation, CNA, mRNA expression and protein abundance for each gene was tested across different morphological subgroups. No gene mutation rates or copy number values were statistically different across the five morphological subgroups (Figure S1A,B), for example, EGFR, KRAS, ALK and STK11 were not different. In total, 414 mRNAs in the RNA-sequencing dataset and 8 antibodies in the RPPA dataset showed significant statistical difference across the five subgroups (Figure S1C,D). The pathway analysis of these 414 differentially expressed mRNAs unveiled a strong association with the cell division process, including mitotic nuclear division, sister chromatid cohesion and DNA replication (Table S3).
Table S3. Top 10 terms in the pathway analysis with 414 mRNA hits identified from the mRNA expression dataset.
| Category | Term | Fisher’s exact test P value | Bonferroni-adjusted P value |
|---|---|---|---|
| GOTERM_BP_DIRECT | Cell division | 1.70E-36 | 1.51E-33 |
| GOTERM_BP_DIRECT | Mitotic nuclear division | 9.50E-32 | 8.46E-29 |
| GOTERM_BP_DIRECT | Sister chromatid cohesion | 4.30E-27 | 3.83E-24 |
| GOTERM_BP_DIRECT | DNA replication | 1.30E-24 | 1.16E-21 |
| GOTERM_CC_DIRECT | Condensed chromosome kinetochore | 1.00E-21 | 8.90E-19 |
| GOTERM_BP_DIRECT | G1/S transition of mitotic cell cycle | 1.80E-18 | 1.60E-15 |
| GOTERM_CC_DIRECT | Kinetochore | 2.00E-17 | 1.78E-14 |
| GOTERM_CC_DIRECT | Midbody | 3.20E-17 | 2.85E-14 |
| GOTERM_BP_DIRECT | DNA replication initiation | 3.70E-17 | 3.29E-14 |
| GOTERM_CC_DIRECT | Chromosome, centromeric region | 1.90E-15 | 1.69E-12 |
BP, biological process; CC, cellular components.
Proteins with differential abundances across morphological subgroups
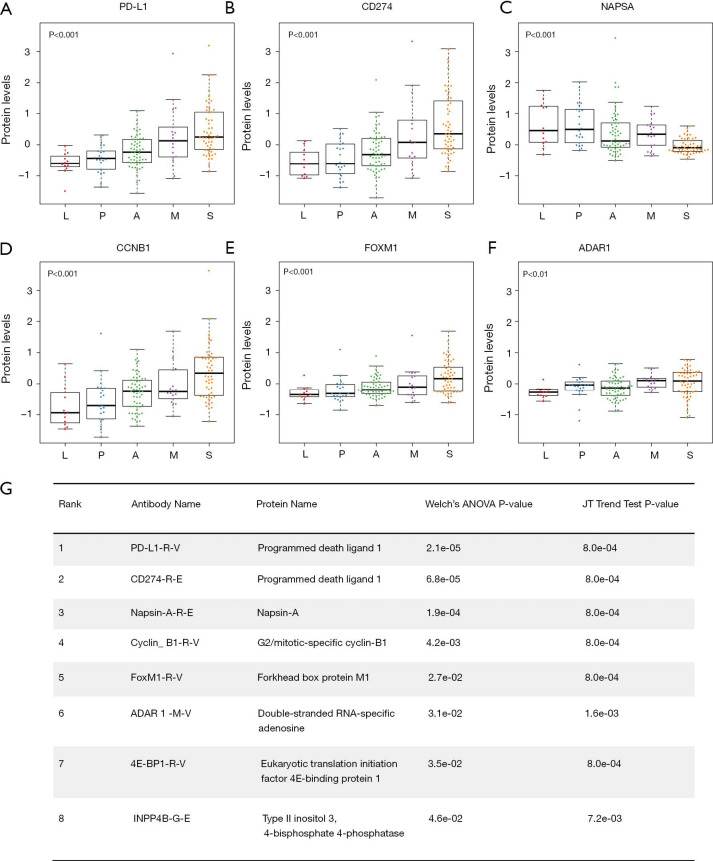
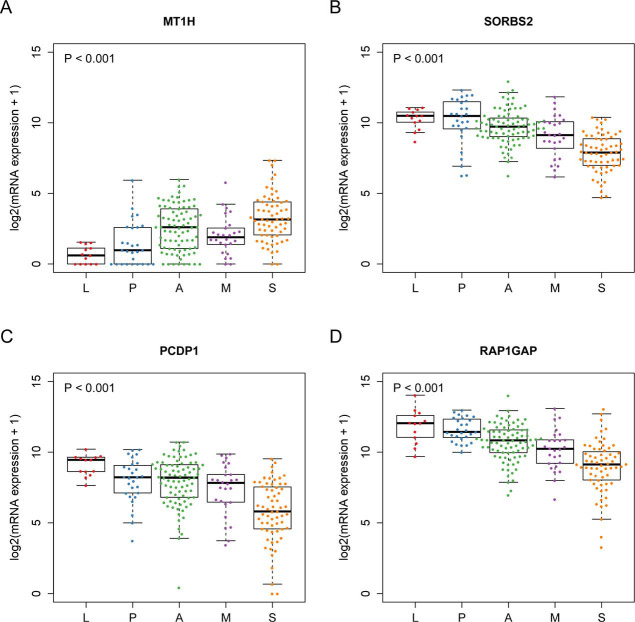
The top two hits identified in the RPPA dataset (ranked by the P values of Welch’s ANOVA) were PD-L1-R-V and CD274-R-E. They are two different antibodies targeting the same protein programmed death ligand 1 (PD-L1). Both PD-L1-R-V and CD274-R-E showed a significant monotonic increasing trend from LPAs, PPAs, APAs, MPAs to SPAs (Jonckheere-Terpstra test, P<0.001, Figure 1A,B). The third hit, Napsin-A (NAPSA), was a protease to process the pulmonary surfactant protein B (Figure 1C). NAPSA was used as a marker for distinguishing primary lung ADCs and as a prognostic factor (25,26). The fourth and fifth hits were Cyclin-B1 (CCNB1) and Forkhead box protein M1 (FOXM1), respectively (Figure 1D,E). CCNB1 is a G2/mitotic-specific cyclin regulating cell cycles. It has been reported to be involved in multiple human cancers (27-30). The expression of CCNB1 can be regulated by FOXM1, a transcriptional factor (31-33). FOXM1 regulates the expression of cell cycle genes that are essential for DNA replication and mitosis. FOXM1 was reported as an oncogene for lung ADCs (31,34,35). These top hits identified in the protein abundance dataset showed significant monotonic (either increasing or decreasing) trends (Jonckheere-Terpstra test, Bonferroni adjustment, P<0.01, Figure 1). Moreover, the top hits identified in the mRNA sequencing dataset demonstrated the same tendency (Jonckheere-Terpstra test, P<0.001, Figure S2). In addition, we have compared the protein abundances across morphological subgroups adjusting for stage, and the results were similar to those without adjusting for stage (Table S4).
Figure 1.
Top hits identified in the RPPA dataset. (A,B,C,D,E,F) Protein levels of PD-L1, CD274, NAPSA, CCNB1, FOXM1 and ADAR1. P value, Jonckheere-Terpstra test. (G) The rank, antibody name, protein name, Welch’s ANOVA P values and Jonckheere-Terpstra test P values for each hit identified from the RPPA dataset. Bonferroni method was used to adjust the Welch’s ANOVA P values. L, lepidic predominant ADC; P, papillary predominant ADC; A, acinar predominant ADC; M, micropapillary predominant ADC; S, solid predominant ADC; JT, Jonckheere-Terpstra; RPPA, reverse phase protein array.
Figure S2.
mRNA expressions of the top 4 hits identified Welch’s ANOVA in the mRNA expression dataset. (A) Metallothionein 1H (MT1H); (B) sorbin and SH3 domain containing 2 (SORBS2); (C) cilia and flagella associated protein 221 (PCDP1); (D) RAP1 GTPase activating protein (RAP1GAP). P value, Jonckheere-Terpstra test.
Table S4. Compare the P values from different analysis methods, with and without adjustment of stage.
| Antibody name | P value | Welch ANOVA P value with Bonferroni adjustment | ||
|---|---|---|---|---|
| Welch ANOVA | ANOVA | ANOVA adjusted by stage | ||
| PD-L1-R-V | 8.6E-08 | 5.0E-09 | 5.7E-09 | 2.1E-05 |
| CD274-R-E | 2.9E-07 | 1.1E-08 | 1.2E-08 | 6.8E-05 |
| Napsin-A-R-E | 8.0E-07 | 4.0E-06 | 4.4E-06 | 1.9E-04 |
| Cyclin-B1-R-V | 1.8E-05 | 4.9E-08 | 4.1E-08 | 4.2E-03 |
| FoxM1-R-V | 1.1E-04 | 1.7E-05 | 1.6E-05 | 2.7E-02 |
| ADAR1-M-V | 1.3E-04 | 8.8E-03 | 9.1E-03 | 3.1E-02 |
| 4E-BP1-R-V | 1.5E-04 | 4.3E-06 | 4.4E-06 | 3.5E-02 |
| INPP4B-G-E | 1.9E-04 | 1.9E-02 | 1.8E-02 | 4.6E-02 |
Morphological subgroups were associated with the degree of differentiation
NAPSA is one of the genes most frequently used to demonstrate ADC differentiation in non-small cell lung cancer (NSCLC) (36-38). The protein level and mRNA expression of NAPSA decreased from LPAs to SPAs (Jonckheere-Terpstra test, protein level P<0.001, mRNA expression P<0.001, Figure 1C and Figure S3A), indicating the decreasing trend of ADC differentiation. The protein level and mRNA expression of NK2 homeobox 1 (NKX2-1), a thyroid-specific transcription factor used as an ADC differentiation indicator, showed a similar decreasing tendency across subgroups (Jonckheere-Terpstra test, protein level P<0.01, mRNA expression P<0.001, Figure S3B,C). Moreover, we estimated the degree of differentiation using ADC-SCC scores (22) (see “Methods” section). Similar to the results for NAPSA and NKX2-1, the degrees of differentiation (i.e., ADC-SCC scores) monotonically decreased from LPAs to SPAs (Jonckheere-Terpstra test, P<0.001, Figure S3D).
FOXM1: a transcription factor associated with ADC morphological subgroups
Our results showed that morphological differences among subgroups were associated with mRNA and protein expression, but not with gene mutations or CNA patterns. This implies that transcription regulation may be a key process where the morphological difference may appear. Coincidentally, FOXM1, the fifth hit from the RPPA dataset, is a transcription factor, while CCNB1, the fourth hit, is one of the FOXM1 downstream targets (31-33) (Figure 1D,E). Moreover, the permutation results (Figure S4) indicate that the FDR is less than 0.05. As result, the possibility of both FOMX1 and CCNB1 being false positive hits is low.
Figure S4.
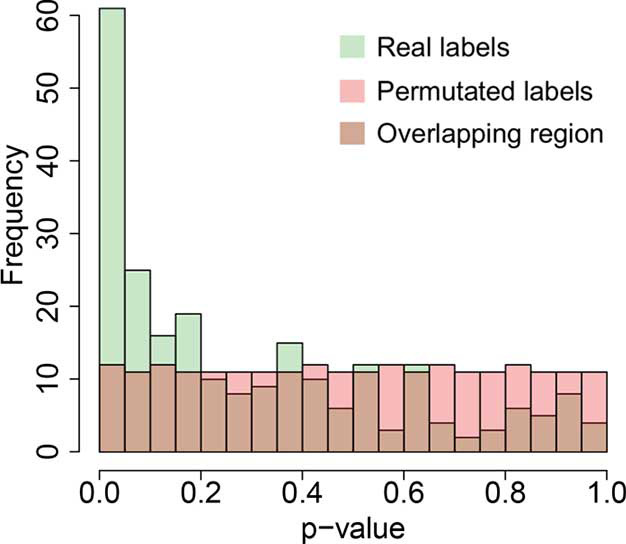
The histograms of Welch’s ANOVA P values in the RPPA dataset (238 antibodies) with real labels and permutated labels. Green, the histogram of the Welch’s ANOVA P values in the RPPA dataset with real labels; Pink, the histogram of the Welch’s ANOVA P values in the RPPA dataset with permutated labels; Brown, the overlapped region of the above two histograms. RPPA, reverse phase protein array.
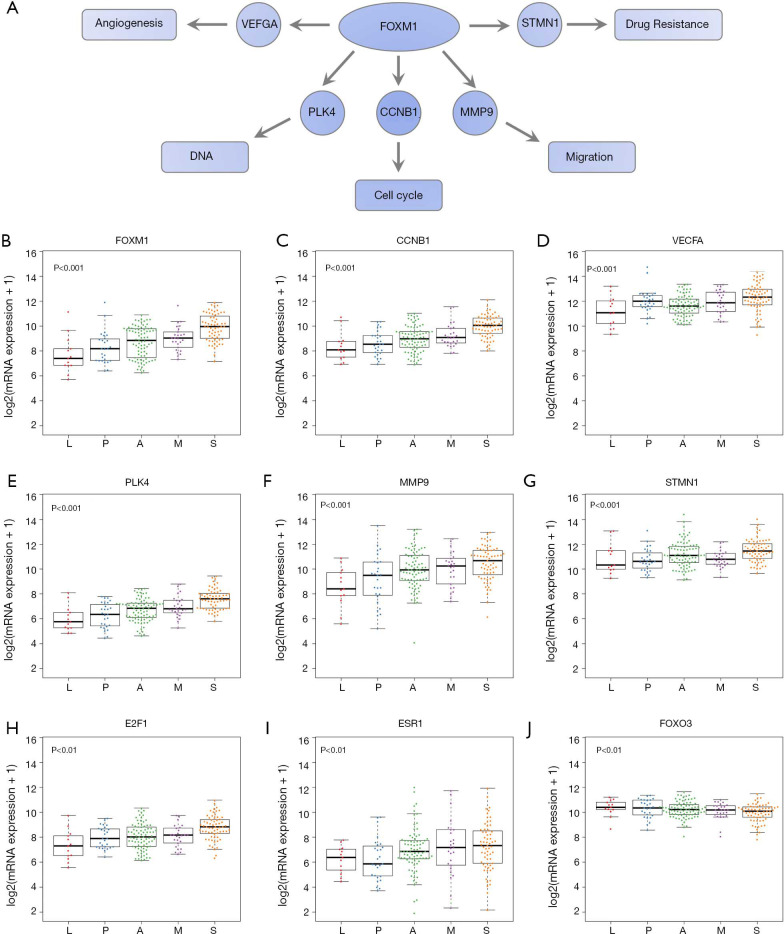
To test our hypothesis that FOXM1 may play an important role in the morphological differences among different subgroups, we examined the mRNA expressions of FOXM1 and its downstream targets VEGFA, PLK4, MMP9 and STMN (31-33) (Figure 2A) in the discovery cohort. The mRNA expressions of VEGFA, PLK4, MMP9 and STMN were consistent with FOXM1, significantly increasing from LPAs to SPAs (Jonckheere-Terpstra test, P<0.001, Figure 2B,C,D,E,F,G). It has been reported that E2F and ESR1 facilitate the expression of FOXM1, but FOXO3A inhibits FOXM1 (31,39,40). The mRNA expressions of E2F and ESR1 were positively associated with FOXM1, significantly increasing from LPAs to SPAs (Jonckheere-Terpstra test, P<0.01 Figure 2H,I), while FOXO3A showed a decreasing trend (Jonckheere-Terpstra test, P<0.01, Figure 2J). Moreover, FOXM1 expression was negatively associated with patient survival in the meta-analysis (P<0.001, Figure 3) across 21 datasets (2,968 lung ADC patients in total). Similarly, CCNB1, a downstream target of FOXM1, was also negatively associated with patient survival in the meta-analysis (P<0.001, Figure S5).
Figure 2.
mRNA expressions of FOXM1, its downstream and upstream molecules. (A) A scheme of FOXM1 and part of its downstream targets involved in cancer. (B) mRNA expression of FOXM1. (C,D,E,F,G) mRNA expressions of FOXM1 downstream targets CCNB1, VEGFA, PLK4, MMP9 and STMN1. (H,I,J) mRNA expressions of FOXM1 upstream molecules E2F1, ESR1 and FOXO3. P value, Jonckheere-Terpstra test. L, lepidic predominant ADC; P, papillary predominant ADC; A, acinar predominant ADC; M, micropapillary predominant ADC; S, solid predominant ADC.
Figure 3.
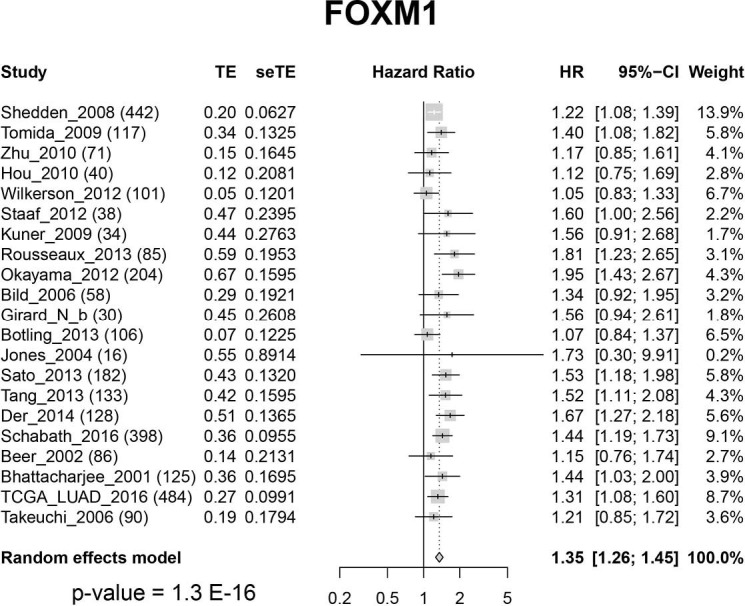
Forest-plot of FOXM1 gene expression: meta-analysis of the effect of FOXM1 gene expression on patient overall survival outcome across 21 datasets (2,968 lung ADC patients in total). CI, confidence interval; HR, hazard ratio; seTE, standard error of treatment estimate; TE, estimated treatment effect.
Figure S5.
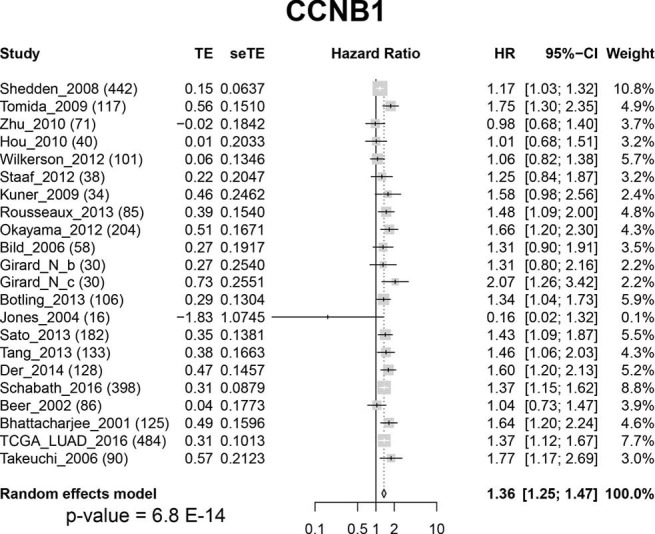
Forest-plot of CCNB1 gene expression: meta-analysis of the effect of CCNB1 gene expression on patient overall survival outcome across 22 datasets (2,998 lung ADC patients in total). CI, confidence interval; HR, hazard ratio; seTE, standard error of treatment estimate; TE, estimated treatment effect.
Validating our findings in the validation cohort
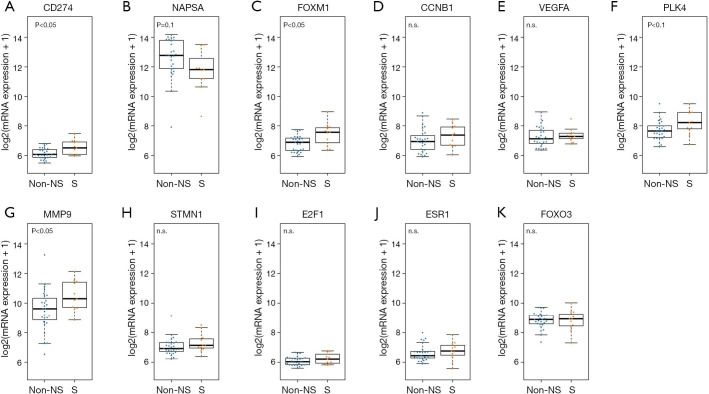
The mRNA expression dataset from the CLCGP and NGM Cohorts was used to validate the results in the TCGA cohort (see “Methods” section). In the validation cohort, PD-L1 was highly expressed in SPAs compared to Non-SPAs (t-test, P<0.05, Figure 4A). SPAs showed lower mRNA levels of NAPSA (Figure 4B), but a higher mRNA level of FOMX1 compared to Non-SPAs (t-test, P<0.05, Figure 4C). Although the difference was not statistically significant, the trends of FOXM1 downstream targets (31-33) (CCNB1, VEGFA, PLK4, MMP9 and STMN1) and upstream molecules (31,39,40) (E2F1 and ESR1) were consistent with the results in the discovery cohort (Figure 4D,E,F,G,H,I,J,K).
Figure 4.
mRNA expression results in the validation cohort. (A,B,C) mRNA expressions of PD-L1, NAPSA and FOMX1; (D,E,F,G,H) mRNA expressions of FOXM1 downstream targets CCNB1, VEGFA, PLK4, MMP9 and STMN1; (I,J,K) mRNA expressions of FOXM1 upstream molecules E2F1, ESR1 and FOXO3. P value, t-test. Non-S, non-solid predominant ADC; S, solid predominant ADC.
Mutation status across morphological subgroups
Table S5 summarizes the association between ADC morphological subgroups and mutation status of 19 selected genes. Among the 19 genes, only TP53 mutation showed numerical differences across the 5 ADC morphological subgroups (P=0.023). The patients with SPAs had higher TP53 mutation rate (63.5%) compared with other morphological subgroups (30.8%, 34.6%, 41.5% and 40% for lepidic, papillary, acinar, micropapillary, respectively). The mutation of other genes showed no significant differences across morphological subgroups.
Table S5. Association between ADC subtype and mutation status of selected genes (the P value is calculated based on Fisher’s exact test) and is without any multiple hypothesis adjustment.
| Gene | # of patients with mutation in each ADC subtype | Total # of patients with mutation | P value | ||||
|---|---|---|---|---|---|---|---|
| L (%) | P (%) | A (%) | M (%) | S (%) | |||
| TP53 | 4 (30.8) | 9 (34.6) | 34 (41.5) | 10 (40.0) | 40 (63.5) | 97 (46.4) | 0.023 |
| ALK | 2 (15.4) | 3 (11.5) | 2 (2.4) | 2 (8.0) | 8 (12.7) | 17 (8.1) | 0.064 |
| EGFR | 1 (7.7) | 2 (7.7) | 22 (26.8) | 4 (16.0) | 7 (11.1) | 36 (17.2) | 0.068 |
| SMAD4 | 0 (0) | 0 (0) | 4 (4.9) | 4 (16.0) | 1 (1.6) | 9 (4.3) | 0.069 |
| PIK3CA | 3 (23.1) | 2 (7.7) | 4 (4.9) | 3 (12.0) | 3 (4.8) | 15 (7.2) | 0.125 |
| BRAF | 2 (15.4) | 6 (23.1) | 5 (6.1) | 2 (8.0) | 7 (11.1) | 22 (10.5) | 0.141 |
| STK11 | 5 (38.5) | 7 (26.9) | 12 (14.6) | 3 (12.0) | 13 (20.6) | 40 (19.1) | 0.191 |
| ERBB2 | 0 (0) | 1 (3.8) | 1 (1.2) | 2 (8.0) | 3 (4.8) | 7 (3.3) | 0.345 |
| LRP1B | 5 (38.5) | 6 (23.1) | 27 (32.9) | 5 (20.0) | 25 (39.7) | 68 (32.5) | 0.348 |
| EML4 | 0 (0) | 0 (0) | 2 (2.4) | 2 (8.0) | 4 (6.3) | 8 (3.8) | 0.409 |
| CTNNB1 | 0 (0) | 2 (7.7) | 2 (2.4) | 1 (4.0) | 4 (6.3) | 9 (4.3) | 0.590 |
| INHBA | 1 (7.7) | 1 (3.8) | 4 (4.9) | 3 (12.0) | 6 (9.5) | 15 (7.2) | 0.593 |
| AKT1 | 0 (0) | 0 (0) | 0 (0) | 0 (0.0) | 1 (1.6) | 1 (0.5) | 0.608 |
| FGFR3 | 0 (0) | 0 (0) | 0 (0) | 0 (0.0) | 1 (1.6) | 1 (0.5) | 0.608 |
| KRAS | 4 (30.8) | 9 (34.6) | 22 (26.8) | 9 (36.0) | 14 (22.2) | 58 (27.8) | 0.608 |
| MTOR | 1 (7.7) | 0 (0) | 5 (6.1) | 2 (8.0) | 3 (4.8) | 11 (5.3) | 0.612 |
| ROS1 | 1 (7.7) | 1 (3.8) | 2 (2.4) | 1 (4.0) | 4 (6.3) | 9 (4.3) | 0.618 |
| MAP2K1 | 0 (0) | 0 (0) | 2 (2.4) | 1 (4.0) | 1 (1.6) | 4 (1.9) | 0.773 |
| MET | 1 (7.7) | 1 (3.8) | 7 (8.5) | 1 (4.0) | 5 (7.9) | 15 (7.2) | 0.940 |
L, lepidic predominant ADC; P, papillary predominant ADC; A, acinar predominant ADC; M, micropapillary predominant ADC; S, solid predominant ADC.
Discussion
Our results showed that mRNA and protein expression, but not gene mutation rates or CNAs, were associated with lung ADC morphological subgroups (Figure S1). These results indicated that the different morphological subgroups may share similar genomic backgrounds, while gene expression regulation components such as transcription factors may play an important role in morphological differentiation in lung ADCs. Furthermore, our analysis suggested a transcription factor, FOXM1, as a potential molecule functioning in the divergences of tumor morphology (Figures 2-4 and Figure S1). Although FOXM1 was reported to be associated with lung cancer genesis (31,34,35), our study also reports the strong association and thus potential function of FOXM1 in divergent lung ADC morphological patterns. Further experimental validation of the functional roles of FOXM1 in ADC subtypes will be important.
Figure S1.
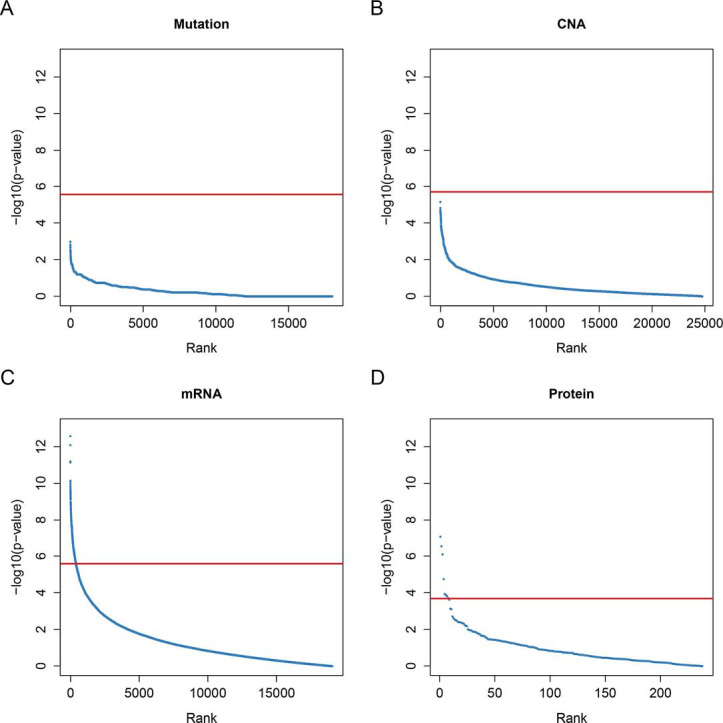
P value plots of each omics dataset. Each dot represents the tested P value of each gene/copy number value/mRNA expression/protein abundance. (A) Fisher’s exact test of gene mutation proportions; (B) Welch’s ANOVA P values of CNAs; (C) Welch’s ANOVA P values of mRNA expressions; (D) Welch’s ANOVA P values of protein abundance. Red line, Bonferroni adjusted P=0.05. CNA, copy number alteration.
PD-L1 is an important target for immunotherapy (41,42). However, it is hard to predict which patients will respond to immune checkpoint blockade therapies (CBTs) (43,44). In this study, we observed the higher expression of PD-L1 in MPAs and SPAs (Figure 1A,B) compared to other subgroups. Therefore, MPAs and SPAs may be the subgroups that respond better to CBTs. Since multiple types of cells could express PD-L1 in the tumor microenvironment, such as macrophages, dendritic cells and tumor cells (45,46), we further evaluated whether the high expression of PD-L1 was actually from tumor cells by using a computational approach, ssGSEA (23), to evaluate the activity level of the macrophages and dendritic cells in each sample. The absence of significant differential activity levels across subgroups in both macrophages and dendritic cells (Figure S6A,B) suggests that the differential expression of PD-L1 likely came from tumor cells. Further evidence is still required to pinpoint that tumor cells are the cause of the PD-L1 differential expression across subgroups. This question could be further addressed using the data from single cell sequencing, if available, to rule out the confounding effects of other type of cells.
The degree of NSCLC differentiation is associated with disease progression and clinical outcomes. Our study shows that the lung ADC morphological subgroups are associated with the degree of differentiation. Both the protein abundances and mRNA expressions of NAPSA and NKX2-1 suggest a decreasing differentiation trend from LPAs, PPAs, APAs, MPAs to SPAs, which was supported by the ADC-SCC scores (Figure 1C and Figure S3). This tendency could also explain the previously reported outcome results of subgroups: the more differentiated the ADCs were, the better outcomes the patients had (6-9).
Figure S3.
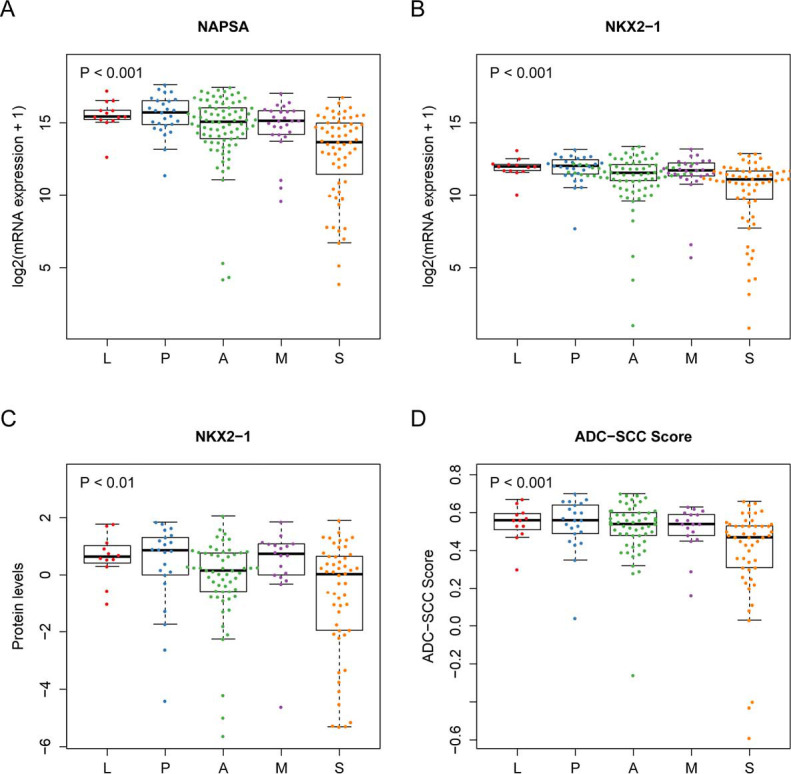
The differentiation status of invasive ADC subgroups. (A) mRNA expression of NAPSA; (B,C) mRNA expression and protein level of NKX2-1; (D) the estimated ADC-SCC scores. P value, Jonckheere-Terpstra test. L, lepidic predominant ADC; P, papillary predominant ADC; A, acinar predominant ADC; M, micropapillary predominant ADC; S, solid predominant ADC.
One limitation of this work is the accuracy of the subgroup classification. The materials provided by TCGA for the pathological classification were less than those a pathologist usually would have in a real clinical setting. Thus, if the materials were not representative, the subgroup classification may be not accurate. However, the result consistency across different omics datasets and the validation results in the independent cohort indicate the high quality of this pathological classification.
Another limitation of this work is that the results were based on statistical analysis of existing datasets. In addition, the sample size, especially for the validation dataset, is relatively small. In order to further validate the findings from this study, data from perspectival collected larger patient cohorts will be very helpful. Furthermore, experimental validation will be needed to pinpoint the underlying mechanisms.
In the current stage, the morphological classification requires experienced pathologists to examine the tumor tissue slide in details. It would be helpful to develop some computerized tools using molecular features or pathology image to assist pathologist in morphological classification. It will also be interesting to test whether the molecular markers identified in this study could facilitate the diagnosis of different types of lung ADCs in clinics.
Figure S6.
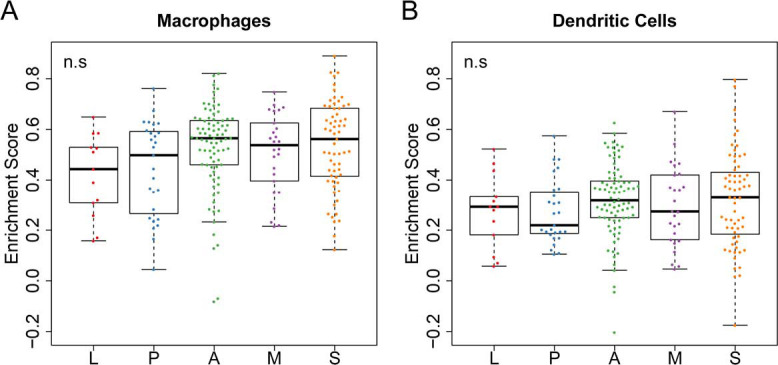
Immune cell activity enrichment scores in the discovery cohort. (A,B) the estimated enrichment score of macrophages and dendritic cells. P value, Welch’s ANOVA. L, lepidic predominant ADC; P, papillary predominant ADC; A, acinar predominant ADC; M, micropapillary predominant ADC; S, solid predominant ADC.
Supplementary
The article’s supplementary files as
Acknowledgments
We thank the late Dr. Adi Gazdar for suggestions and comments. We thank Jessie Norris for helping us to edit this manuscript.
Funding: This work was partially supported by the National Institutes of Health (5R01CA152301, P50CA70907, 1R01GM115473, P30CA142543 and 1R01CA172211), and the Cancer Prevention and Research Institute of Texas (RP190107 and RP180805).
Ethical Statement: The authors are accountable for all aspects of the work in ensuring that questions related to the accuracy or integrity of any part of the work are appropriately investigated and resolved. This study is a computational study of existing datasets, so the Ethics Approval is not required.
Footnotes
Conflicts of Interest: All authors have completed the ICMJE uniform disclosure form (available at http://dx.doi.org/10.21037/tlcr-19-321). JM serves as an unpaid editorial board member of Translational Lung Cancer Research. The other authors have no conflicts of interest to declare.
References
- 1.Travis WD, Brambilla E, Noguchi M, et al. International association for the study of lung cancer/american thoracic society/european respiratory society international multidisciplinary classification of lung adenocarcinoma. J Thorac Oncol 2011;6:244-85. 10.1097/JTO.0b013e318206a221 [DOI] [PMC free article] [PubMed] [Google Scholar]
- 2.Bray F, Ferlay J, Soerjomataram I, et al. Global cancer statistics 2018: GLOBOCAN estimates of incidence and mortality worldwide for 36 cancers in 185 countries. CA Cancer J Clin 2018;68:394-424. 10.3322/caac.21492 [DOI] [PubMed] [Google Scholar]
- 3.Siegel RL, Miller KD, Jemal A. Cancer statistics, 2019. CA Cancer J Clin 2019;69:7-34. 10.3322/caac.21551 [DOI] [PubMed] [Google Scholar]
- 4.Zappa C, Mousa SA. Non-small cell lung cancer: current treatment and future advances. Transl Lung Cancer Res 2016;5:288. 10.21037/tlcr.2016.06.07 [DOI] [PMC free article] [PubMed] [Google Scholar]
- 5.Tang ER, Schreiner AM, Pua BB. Advances in lung adenocarcinoma classification: a summary of the new international multidisciplinary classification system (IASLC/ATS/ERS). J Thorac Dis 2014;6:S489-501. [DOI] [PMC free article] [PubMed] [Google Scholar]
- 6.Gu J, Lu C, Guo J, et al. Prognostic significance of the IASLC/ATS/ERS classification in Chinese patients-A single institution retrospective study of 292 lung adenocarcinoma. J Surg Oncol 2013;107:474-80. 10.1002/jso.23259 [DOI] [PubMed] [Google Scholar]
- 7.Wainer Z, Russell P, Wright G, et al. Does Lung Adenocarcinoma Subtype Predict Patient Survival? A Clinicopathologic Study Based On The New International Association For The Study Of Lung Cancer/american Thoracic Society/european Respiratory Society International Multidisciplinary Lung Adenocarcinoma Classification: cs08. ANZ J Surg 2012;82:26. [DOI] [PubMed] [Google Scholar]
- 8.Hung JJ, Yeh YC, Jeng WJ, et al. Predictive value of the international association for the study of lung cancer/American Thoracic Society/European Respiratory Society classification of lung adenocarcinoma in tumor recurrence and patient survival. J Clin Oncol 2014;32:2357-64. 10.1200/JCO.2013.50.1049 [DOI] [PubMed] [Google Scholar]
- 9.Yoshizawa A, Sumiyoshi S, Sonobe M, et al. Validation of the IASLC/ATS/ERS lung adenocarcinoma classification for prognosis and association with EGFR and KRAS gene mutations: analysis of 440 Japanese patients. J Thorac Oncol 2013;8:52-61. 10.1097/JTO.0b013e3182769aa8 [DOI] [PubMed] [Google Scholar]
- 10.Tsao MS, Marguet S, Le Teuff G, et al. Subtype Classification of Lung Adenocarcinoma Predicts Benefit From Adjuvant Chemotherapy in Patients Undergoing Complete Resection. J Clin Oncol 2015;33:3439-46. 10.1200/JCO.2014.58.8335 [DOI] [PMC free article] [PubMed] [Google Scholar]
- 11.Luo J, Huang Q, Wang R, et al. Prognostic and predictive value of the novel classification of lung adenocarcinoma in patients with stage IB. J Cancer Res Clin Oncol 2016;142:2031-40. 10.1007/s00432-016-2192-6 [DOI] [PMC free article] [PubMed] [Google Scholar]
- 12.Tsuta K, Kawago M, Inoue E, et al. The utility of the proposed IASLC/ATS/ERS lung adenocarcinoma subtypes for disease prognosis and correlation of driver gene alterations. Lung Cancer 2013;81:371-6. 10.1016/j.lungcan.2013.06.012 [DOI] [PubMed] [Google Scholar]
- 13.Vinayanuwattikun C, Le Calvez-Kelm F, Abedi-Ardekani B, et al. Elucidating Genomic Characteristics of Lung Cancer Progression from In Situ to Invasive Adenocarcinoma. Sci Rep 2016;6:31628. 10.1038/srep31628 [DOI] [PMC free article] [PubMed] [Google Scholar]
- 14.Zhang J, Shao J, Zhu L, et al. Molecular profiling identifies prognostic markers of stage IA lung adenocarcinoma. Oncotarget 2017;8:74846. 10.18632/oncotarget.20420 [DOI] [PMC free article] [PubMed] [Google Scholar]
- 15.Zabeck H, Dienemann H, Hoffmann H, et al. Molecular signatures in IASLC/ATS/ERS classified growth patterns of lung adenocarcinoma. PLoS One 2018;13:e0206132. 10.1371/journal.pone.0206132 [DOI] [PMC free article] [PubMed] [Google Scholar]
- 16.The Cancer Genome Atlas Research Network . Comprehensive molecular profiling of lung adenocarcinoma. Nature 2014;511:543-50. 10.1038/nature13385 [DOI] [PMC free article] [PubMed] [Google Scholar]
- 17.Ellrott K. TCGA_Pancancer. LUAD [Dataset]. Synapse, 2015. [Google Scholar]
- 18.Broad Institute TCGA Genome Data Analysis Center. Analysis-ready standardized TCGA data from Broad GDAC Firehose 2016_01_28 run [Dataset]. Broad Institute of MIT and Harvard, 2016. [Google Scholar]
- 19.Clinical Lung Cancer Genome Project (CLCGP) Network Genomic Medicine (NGM) . A genomics-based classification of human lung tumors. Sci Transl Med 2013;5:209ra153. [DOI] [PMC free article] [PubMed] [Google Scholar]
- 20.Huang da W , Sherman BT, Lempicki RA. Bioinformatics enrichment tools: paths toward the comprehensive functional analysis of large gene lists. Nucleic Acids Res 2009;37:1-13. 10.1093/nar/gkn923 [DOI] [PMC free article] [PubMed] [Google Scholar]
- 21.Huang da W , Sherman BT, Lempicki RA. Systematic and integrative analysis of large gene lists using DAVID bioinformatics resources. Nat Protoc 2009;4:44-57. 10.1038/nprot.2008.211 [DOI] [PubMed] [Google Scholar]
- 22.Girard L, Rodriguez-Canales J, Behrens C, et al. An Expression Signature as an Aid to the Histologic Classification of Non-Small Cell Lung Cancer. Clin Cancer Res 2016;22:4880-9. 10.1158/1078-0432.CCR-15-2900 [DOI] [PMC free article] [PubMed] [Google Scholar]
- 23.Barbie DA, Tamayo P, Boehm JS, et al. Systematic RNA interference reveals that oncogenic KRAS-driven cancers require TBK1. Nature 2009;462:108-12. 10.1038/nature08460 [DOI] [PMC free article] [PubMed] [Google Scholar]
- 24.Wang T, Lu R, Kapur P, et al. An Empirical Approach Leveraging Tumorgrafts to Dissect the Tumor Microenvironment in Renal Cell Carcinoma Identifies Missing Link to Prognostic Inflammatory Factors. Cancer Discov 2018;8:1142-55. 10.1158/2159-8290.CD-17-1246 [DOI] [PMC free article] [PubMed] [Google Scholar]
- 25.Uchida A, Samukawa T, Kumamoto T, et al. Napsin A levels in epithelial lining fluid as a diagnostic biomarker of primary lung adenocarcinoma. BMC Pulm Med 2017;17:195. 10.1186/s12890-017-0534-z [DOI] [PMC free article] [PubMed] [Google Scholar]
- 26.Lee JG, Kim S, Shim HS. Napsin A is an independent prognostic factor in surgically resected adenocarcinoma of the lung. Lung Cancer 2012;77:156-61. 10.1016/j.lungcan.2012.02.013 [DOI] [PubMed] [Google Scholar]
- 27.Sabbaghi M, Gil-Gomez G, Guardia C, et al. Defective Cyclin B1 Induction in Trastuzumab-emtansine (T-DM1) Acquired Resistance in HER2-positive Breast Cancer. Clin Cancer Res 2017;23:7006-19. 10.1158/1078-0432.CCR-17-0696 [DOI] [PubMed] [Google Scholar]
- 28.Zhao P, Zhang P, Hu W, et al. Upregulation of cyclin B1 plays potential roles in the invasiveness of pituitary adenomas. J Clin Neurosci 2017;43:267-73. 10.1016/j.jocn.2017.05.005 [DOI] [PubMed] [Google Scholar]
- 29.Chai N, Xie HH, Yin JP, et al. FOXM1 promotes proliferation in human hepatocellular carcinoma cells by transcriptional activation of CCNB1. Biochem Biophys Res Commun 2018;500:924-9. 10.1016/j.bbrc.2018.04.201 [DOI] [PubMed] [Google Scholar]
- 30.Nurse P. Universal control mechanism regulating onset of M-phase. Nature 1990;344:503. 10.1038/344503a0 [DOI] [PubMed] [Google Scholar]
- 31.Lam EW, Brosens JJ, Gomes AR, et al. Forkhead box proteins: tuning forks for transcriptional harmony. Nat Rev Cancer 2013;13:482-95. 10.1038/nrc3539 [DOI] [PubMed] [Google Scholar]
- 32.Tan X, Fu Y, Chen L, et al. Abstract 3062: miR-671-5p promotes epithelial-to-mesenchymal transition by downregulating FOXM1 expression in breast cancer. Cancer Res 2015;75:3062. [DOI] [PMC free article] [PubMed] [Google Scholar]
- 33.Katoh M, Igarashi M, Fukuda H, et al. Cancer genetics and genomics of human FOX family genes. Cancer Lett 2013;328:198-206. 10.1016/j.canlet.2012.09.017 [DOI] [PubMed] [Google Scholar]
- 34.Wang IC, Meliton L, Ren X, et al. Deletion of Forkhead Box M1 transcription factor from respiratory epithelial cells inhibits pulmonary tumorigenesis. PLoS One 2009;4:e6609. 10.1371/journal.pone.0006609 [DOI] [PMC free article] [PubMed] [Google Scholar]
- 35.Kim IM, Ackerson T, Ramakrishna S, et al. The Forkhead Box m1 transcription factor stimulates the proliferation of tumor cells during development of lung cancer. Cancer Res 2006;66:2153-61. 10.1158/0008-5472.CAN-05-3003 [DOI] [PubMed] [Google Scholar]
- 36.Chang DR, Martinez Alanis D, Miller RK, et al. Lung epithelial branching program antagonizes alveolar differentiation. Proc Natl Acad Sci U S A 2013;110:18042-51. 10.1073/pnas.1311760110 [DOI] [PMC free article] [PubMed] [Google Scholar]
- 37.Zhan C, Yan L, Wang L, et al. Identification of immunohistochemical markers for distinguishing lung adenocarcinoma from squamous cell carcinoma. J Thorac Dis 2015;7:1398. [DOI] [PMC free article] [PubMed] [Google Scholar]
- 38.Travis WD, Rekhtman N, Riley GJ, et al. Pathologic diagnosis of advanced lung cancer based on small biopsies and cytology: a paradigm shift. J Thorac Oncol 2010;5:411-4. 10.1097/JTO.0b013e3181d57f6e [DOI] [PubMed] [Google Scholar]
- 39.Gomes AR, Zhao F, Lam EW. Role and regulation of the forkhead transcription factors FOXO3a and FOXM1 in carcinogenesis and drug resistance. Chin J Cancer 2013;32:365-70. 10.5732/cjc.012.10277 [DOI] [PMC free article] [PubMed] [Google Scholar]
- 40.Millour J, de Olano N, Horimoto Y, et al. ATM and p53 regulate FOXM1 expression via E2F in breast cancer epirubicin treatment and resistance. Mol Cancer Ther 2011;10:1046-58. 10.1158/1535-7163.MCT-11-0024 [DOI] [PMC free article] [PubMed] [Google Scholar]
- 41.Goodman A, Patel SP, Kurzrock R. PD-1-PD-L1 immune-checkpoint blockade in B-cell lymphomas. Nat Rev Clin Oncol 2017;14:203-20. 10.1038/nrclinonc.2016.168 [DOI] [PubMed] [Google Scholar]
- 42.Topalian SL, Hodi FS, Brahmer JR, et al. Safety, activity, and immune correlates of anti-PD-1 antibody in cancer. N Engl J Med 2012;366:2443-54. 10.1056/NEJMoa1200690 [DOI] [PMC free article] [PubMed] [Google Scholar]
- 43.Nishino M, Ramaiya NH, Hatabu H, et al. Monitoring immune-checkpoint blockade: response evaluation and biomarker development. Nat Rev Clin Oncol 2017;14:655-68. 10.1038/nrclinonc.2017.88 [DOI] [PMC free article] [PubMed] [Google Scholar]
- 44.Michot JM, Bigenwald C, Champiat S, et al. Immune-related adverse events with immune checkpoint blockade: a comprehensive review. Eur J Cancer 2016;54:139-48. 10.1016/j.ejca.2015.11.016 [DOI] [PubMed] [Google Scholar]
- 45.Tang F, Zheng P. Tumor cells versus host immune cells: whose PD-L1 contributes to PD-1/PD-L1 blockade mediated cancer immunotherapy? Cell Biosci 2018;8:34. 10.1186/s13578-018-0232-4 [DOI] [PMC free article] [PubMed] [Google Scholar]
- 46.Veglia F, Gabrilovich DI. Dendritic cells in cancer: the role revisited. Curr Opin Immunol 2017;45:43-51. 10.1016/j.coi.2017.01.002 [DOI] [PMC free article] [PubMed] [Google Scholar]
Associated Data
This section collects any data citations, data availability statements, or supplementary materials included in this article.
Supplementary Materials
The article’s supplementary files as


