Abstract
Background
PD-L1 tumor expression has been associated with poor prognosis in a variety of solid tumors, including lung cancer, and represents a validated target for immune checkpoint inhibition in advanced malignances. It remains unknown, however, if PD-L1 can be used to predict survival in early stage, surgically treated cancers. This meta-analysis compares PD-L1 tumor expression and long term survival after surgical resection in early non-small cell lung cancer (NSCLC).
Methods
PubMed was searched to identify eligible studies that compared survival of surgically resected stage I–III NSCLC patients according to PD-L1 tumor expression. Included studies were grouped according to measurement criteria of PD-L1 expression: 1%, 5%, 50% cutoffs or H-score. Meta-analysis was performed using a linear mixed-effects model to determine overall survival (OS). I2 was used as a measure of heterogeneity.
Results
There were 40 eligible studies, including 10,380 patients. Regardless of cut-off used, higher PD-L1 tumor expression was associated with worse OS [hazard ratio (HR)1%: 1.59, 95% confidence interval (CI), 1.17–2.17; HR5%: 1.44, 95% CI, 1.03–2.00; HR50%: 1.52, 95% CI, 1.02–2.25, HRH-score: 1.34, 95% CI, 1.04–1.73]. Study heterogeneity was low and not statistically significant under all PD-L1 cutoffs.
Conclusions
PD-L1 expression is consistently associated with worse survival, regardless of how it is quantified. In addition to acting as a prognostic biomarker, PD-L1 may also be used in future as a predictive biomarker for patients most likely to benefit from adjuvant immunotherapy.
Keywords: Carcinoma, non-small cell lung, costimulatory protein, programmed death-ligand 1 (PD-L1), immunotherapy
Introduction
While resection of early stage non-small cell lung cancer (NSCLC) presents the best opportunity for meaningful long-term survival and cure, there remains significant risk of cancer recurrence for 30–40% of operable patients (1,2). Efforts to improve post-surgical outcomes using adjuvant chemotherapy have only been marginally effective for selected patients, and for those patients whose cancers do recur prognosis is generally bleak (3,4). It is therefore of great clinical consequence that we identify biomarkers that can predict surgical outcomes for NSCLC, and which could also potentially determine which patients would be most likely to benefit from additional systemic therapy.
Programmed death-ligand 1 (PD-L1) is one such promising biomarker. Upon expression on the surface of cancer cells, PD-L1 interacts with its receptor PD-1 to suppress T cell activation (5). As a result, the tumor is able to escape the anti-tumor immune response (6). PD-L1 tumor expression has been associated with poor prognosis in a variety of solid tumors, including lung cancer (7); these results, however, require further validation. It remains unknown, for example, if PD-L1 can be used to predict survival in early-stage, surgically treated cancers. PD-L1 is also a validated target for immune checkpoint inhibition; select advanced lung cancers treated with this form of immunotherapy will have dramatic and durable responses (8,9). Tumors with high PD-L1 expression may benefit from immune checkpoint inhibition to prevent recurrence after surgical resection, although the predictive value of PD-L1 for neoadjuvant and adjuvant immunotherapy efficacy is still under investigation (10).
Here we conduct a meta-analysis to evaluate the association between PD-L1 tumor expression and overall survival (OS) in early-stage NSCLC in the hope of validating the use of PD-L1 as a clinical predictor of survival. Furthermore, to address the heterogeneity of measurement of PD-L1 expression, we stratified the analysis according to different PD-L1 positive vs. negative expression cutoffs, to assess whether a more conservative cutoff impacts the prognostic value of PD-L1. We also performed sensitivity analyses based on antibody type, stage, and histology. We present the following article in accordance with the PRISMA Reporting Checklist (available at http://dx.doi.org/10.21037/tlcr-19-638).
Methods
Search strategy
We conducted a systematic literature search of the National Library of Medicine database to identify all original, retrospective observational studies reporting on the association between PD-L1 tumor expression and OS for NSCLC patients. The following keywords were included in the search strategy: “PD-L1”, “lung cancer” and “survival”, similar to our previous work (11). There were no date restrictions, and the search was finalized in May of 2019. The cited references of each study were also reviewed and evaluated for eligibility. Reported PD-L1 level was the exposure of interest and OS the outcome of interest.
Selection criteria
Articles eligibility assessment was performed in 2 stages. Articles were first screened for relevancy within the scope of the project by independent review of the titles and abstracts conducted by two different reviewers (ST and DS). Those articles that met eligibility qualification then underwent further scrutiny through full text review to ensure they met all established eligibility criteria. Disagreements in screening and selection were adjudicated by group consensus at each stage involving a third reviewer (ET). Studies were considered eligible for inclusion in this systematic review if they reported on: (I) human subjects, (II) stage I–III NSCLC patients, (III) at least 10 patients, (IV) follow-up of at least 4 years. Additionally, articles needed to assess PD-L1 tumor expression with a positive vs. negative cutoff value, either 1%, 5%, 50% staining or an H-score, and to use PD-L1 expression to predict OS.
Data extraction
Relevant descriptive information was extracted from each study to create a standardized tabular summary, including author, year of publication, number of patients, PD-L1 cutoff value, the proportion of patients with high PD-L1 expression, sex, tumor stage and histology. OS data was extracted as a hazard ratio (HR) and 95% confidence interval (CI). For study quality analysis, we utilized a modified version of the Center for Disease Control and Prevention’s Quality Assessment Tool for Observational Cohort and Cross-Sectional Studies (https://www.nhlbi.nih.gov/health-topics/study-quality-assessment-tools), with the highest score possible being 11. Scoring was assessed independently by two reviewers (ST and DS), and the average quality scores is reported in Table 1. A breakdown of the quality assessment is provided in Table S1.
Table 1. Characteristics of included studies.
| Study/year | Patients (n) | Cutoff | Antibody used | High PD-L1 (%) | Male (%) | Smoking history (%) | Stage (%) | Histology (%) | Quality score |
|---|---|---|---|---|---|---|---|---|---|
| Chen, 2012 (12) | 120 | H-score | Rabbit polyclonal | 58 | 75 | NR | I: 9 | ADC: 42 | 8 |
| II: 26 | SCC: 42 | ||||||||
| III: 63 | Other: 17 | ||||||||
| Zhang, 2014 (13) | 143 | H-score | Rabbit polyclonal (SAB2900365; Sigma-Aldrich) | 49 | 41 | Never: 66 | I: 46 | ADC: 100 | 8 |
| Ever: 34 | II & III: 54 | ||||||||
| Azuma, 2014 (14) | 164 | H-score | Rabbit polyclonal (Lifespan) | 50 | 55 | Never: 58 | I: 41 | ADC: 70 | 7 |
| Ever: 42 | II: 28 | SCC: 30 | |||||||
| III: 31 | |||||||||
| Cooper, 2015 (15) | 678 | 50% | Mouse monoclonal (clone22C3; Merck) | 7 | 70 | NR | I: 50 | ADC: 41 | 8 |
| II & III: 50 | SCC: 40 | ||||||||
| Other: 19 | |||||||||
| Schmidt, 2015 (16) | 321 | 5% | Rabbit monoclonal (1:500; clone E1L3N; Cell Signaling Technology #13684) | 24 | 78 | Never: 19 | I: 58 | ADC: 39 | 7 |
| Ever: 78 | II: 26 | SCC: 46 | |||||||
| III: 16 | Other: 15 | ||||||||
| Tokito, 2016 (17) | 74 | 5% | Rabbit monoclonal (clone EPR1161; Abcam) | 47 | 86 | Never: 8 | III: 100 | ADC: 46 | 8 |
| Ever: 92 | SCC: 54 | ||||||||
| Yang, 2016 (18) | 105 | 5% | Rabbit polyclonal (1:120; Proteintech Group Inc.; catalog number: 66248-1-Ig) | 56 | 85 | Never: 25 | I: 100 | SCC: 100 | 8 |
| Ever: 75 | |||||||||
| Inoue, 2016 (19) | 654 | H-score | Rabbit monoclonal (1:100; clone E1L3N; Cell Signaling Technology #13684) | 31 | 68 | Never: 30 | I: 64 | ADC: 66 | 7 |
| Ever: 68 | II: 17 | SCC: 27 | |||||||
| III: 19 | Other: 7 | ||||||||
| Ameratunga, 2016 (20) | 527 | 50% | Rabbit monoclonal (clone E1L3N; Cell Signaling Technology #13684) | 24 | 69 | Never: 7 | NR | ADC: 55 | 7 |
| Ever: 87 | SCC: 35 | ||||||||
| Other: 10 | |||||||||
| Parra, 2016 (21) | 254 | H-score | Rabbit monoclonal (1:100; clone E1L3N; Cell Signaling Technology #13684) | 67 | 55 | Never: 12 | I: 50 | ADC: 57 | 8 |
| Ever: 88 | II: 30 | SCC: 43 | |||||||
| III: 20 | |||||||||
| Song, 2016 (22) | 385 | 5% | Rabbit polyclonal antibody (1:100; Proteintech Group Inc.; catalog number: 66248-1-Ig) | 48 | 51 | Never: 61 | I: 31 | ADC: 100 | 8 |
| Ever: 39 | II: 21 | ||||||||
| III: 48 | |||||||||
| Takada, 2016 (23) | 417 | 1% | Rabbit monoclonal (dilution 1:100; clone SP142; Spring Bioscience) | 35 | 49 | Never: 52 | I: 73 | ADC: 100 | 8 |
| Ever: 48 | II: 15 | ||||||||
| III: 12 | |||||||||
| Song, 2016 (24) | 76 | H-score | Rabbit polyclonal antibody (Proteintech Group Inc.; catalog number: 66248-1-Ig) | 38 | 67 | Never: 42 | I & II: 46 | SCC: 100 | 7 |
| Former: 58 | III: 54 | ||||||||
| Zhang, 2016 (25) | 92 | H-score | Rabbit monoclonal (1:500; Abcam) | 60 | 84 | NR | I & II: 50 | ADC: 39 | 6 |
| III: 50 | SCC: 59 | ||||||||
| Other: 2 | |||||||||
| Teng, 2016 (26) | 126 | 5% | Rabbit monoclonal (M4424, Spring Bioscience, CA, 0.19 μm/mL) | 20 | 67 | NR | I: 100 | ADC: 45 | 6 |
| SCC: 33 | |||||||||
| Other: 22 | |||||||||
| Ma, 2016 (27) | 209 | H-score | Rabbit monoclonal (1:500; Abcam) | 45 | 76 | Never: 24 | I: 31 | ADC: 47 | 7 |
| Ever: 76 | II & III: 69 | SCC: 49 | |||||||
| Other: 4 | |||||||||
| Ohue, 2016 (28) | 120 | H-score | Rabbit polyclonal (1:400; ProSci Incorporated) | 44 | NR | Never or Light: 59 | I: 52 | ADC: 100 | 6 |
| Heavy: 41 | II & III: 48 | ||||||||
| Tsao, 2017 (29) | 982 (478*) | 1%; 50% | Rabbit monoclonal (clone E1L3N; Cell Signaling Technology #13684) | (1%) 49; (50%) 22 | 73 | NR | I: 46 | ADC: 41 | 8 |
| II: 37 | SCC: 45 | ||||||||
| III: 17 | Other: 14 | ||||||||
| Takada, 2017 (30) | 205 | 1%; 5%; 50% | Rabbit monoclonal (1:100; clone SP142; Spring Bioscience | (1%) 52; (5%) 35; (50%) 18 | 83 | <30 pack years: 15 | I: 53 | SCC: 100 | 8 |
| >30 pack years: 85 | II: 36 | ||||||||
| III: 12 | |||||||||
| Igawa, 2017 (31) | 229 | H-score | Rabbit polyclonal (clone SP263, Ventana Medical Systems) | 52 | 65 | Never/Former/Light: 39 | I: 57 | SCC: 20 | 7 |
| Heavy: 61 | II: 21 | Non-SCC: 80 | |||||||
| III: 22 | |||||||||
| Takada, 2017 (32) | 499 | 1% | Rabbit monoclonal (1:100; clone SP142; Spring Bioscience) | 38 | 55 | Never: 45 | I: 79 | ADC: 84 | 8 |
| Ever: 55 | II: 16 | SCC: 16 | |||||||
| III: 13 | |||||||||
| Okita, 2017 (33) | 91 | H-score | Mouse monoclonal (1:100; clone SP142; Spring Bioscience) | 14 | 65 | Never: 37 | Ia: 38 | ADC: 78 | 8 |
| Ever: 63 | Ib-III:62 | SCC: 22 | |||||||
| Hirai, 2018 (34) | 94 | 1%; 5%; 50% | Rabbit monoclonal (clone E1L3N; Cell Signaling Technology #13684) | (1%) 22; (5%) 16; (50%) 5 | 56 | Never: 40 | I: 100 | ADC: 100 | 8 |
| Ever: 60 | |||||||||
| Lin, 2017 (35) | 122 | H-score | Rabbit polyclonal (clone GTX104763; Genetex) | 56 | 65 | Never: 60 | I: 37 | ADC: 57 | 7 |
| Ever: 40 | II: 19 | SCC: 43 | |||||||
| III: 44 | |||||||||
| Zhang, 2017 (36) | 84 | 5% | Rabbit monoclonal (1:500; clone 28-8; Abcam) | 58 | 77 | Never: 27 | I: 36 | SCC: 100 | 7 |
| Ever: 73 | II: 39 | ||||||||
| III: 25 | |||||||||
| Toyokawa, 2018 (37) | 283 | 5% | Rabbit monoclonal antibody (1:100; clone SP142; Spring Bioscience) | 16 | 47 | Never: 52 | I: 83 | ADC: 100 | 7 |
| Ever: 48 | II: 8 | ||||||||
| III: 9 | |||||||||
| Mazzaschi, 2018 (38) | 100 | H-score | Rabbit monoclonal | NR | 74 | Never: 9 | I: 35 | ADC: 42 | 7 |
| Ever: 91 | II: 41 | SCC: 58 | |||||||
| III: 24 | |||||||||
| Lin, 2017 (39) | 170 | 1% | Mouse monoclonal (22C3; code SK006, Merck & Co., Inc.) | 35 | 69 | Never: 57 | I: 30 | ADC: 55 | 6 |
| Ever: 43 | II: 25 | SCC: 45 | |||||||
| III: 45 | |||||||||
| Cao, 2017 (40) | 364 | 50% | Rabbit monoclonal (clone E1L3N; Cell Signaling Technology #13684) | 22 | 63 | Heavy: 44 | I: 48 | ADC: 57 | 8 |
| II: 20 | SCC: 43 | ||||||||
| III: 32 | |||||||||
| Cui, 2017 (41) | 126 | 5%; 50% | Rabbit monoclonal (clone E1L3N; Cell Signaling Technology #13684) | (5%) 34; (50%) 8 | 72 | Never: 41 | I: 100 | ADC: 50 | 8 |
| Ever: 59 | Non-ADC: 50 | ||||||||
| Sepesi, 2017 (42) | 113 | 5%; H-score | Rabbit monoclonal (1:100; clone E1L3N; Cell Signaling Technology #13684) | (5%) 23; H-score 25 | 45 | Never: 11 | I: 100 | ADC: 70 | 8 |
| Ever: 89 | SCC: 30 | ||||||||
| Vrankar, 2018 (43) | 43 | 5% | Rabbit monoclonal (clone SP142; Ventana Medical Systems, Roche Group) | 16 | 84 | Never/Former: 50 | III: 100 | SCC: 60 | 8 |
| Current: 50 | ADC & Other: 30 | ||||||||
| Kobayashi, 2018 (44) | 211 | 5% | Rabbit polyclonal antibody (1:400; LifeSpan BioScience) | 49 | 66 | Never: 24 | I: 55 | ADC: 59 | 8 |
| Ever: 76 | II & III: 45 | SCC: 41 | |||||||
| Kim, 2018 (45) | 387 (340)* | 1% | Mouse monoclonal (22C3; code SK006, Merck & Co., Inc.) | 25 | 62 | Never: 43 | I: 52 | ADC: 69 | 8 |
| Ever: 57 | II: 24 | SCC: 31 | |||||||
| III: 21 | |||||||||
| Zaric, 2018 (46) | 161 | 1% | Rabbit monoclonal (clone E1L3N; Cell Signaling Technology #13684) | 37 | 56 | Never: 12 | I: 34 | ADC: 100 | 8 |
| Ever: 98 | II: 42 | ||||||||
| III: 47 | |||||||||
| Li, 2019 (47) | 241 | 50% | Rabbit monoclonal (clone SP263, CAT No. 740-4907; Ventana Medical Systems, Roche Group) | 15 | 44 | Never: 60 | I: 36 | ADC: 95 | 7 |
| Ever: 40 | II: 17 | SCC: 3 | |||||||
| III: 47 | Other: 2 | ||||||||
| Nishihira, 2019 (48) | 72 | 1%; 50% | Mouse monoclonal (22C3; code SK006, Merck & Co., Inc.) | (1%) 61; (50%) 11 | 93 | <30 pack years: 14 | I: 49 | SCC: 100 | 8 |
| >30 pack years: 86 | II: 26 | ||||||||
| III: 24 | |||||||||
| Han, 2019 (49) | 403 | 1% | Mouse monoclonal (22C3; code SK006, Merck & Co., Inc.) | 16 | 47 | Never: 60 | I: 58 | ADC: 100 | 8 |
| Ever: 40 | II: 21 | ||||||||
| III: 21 | |||||||||
| Takanda, 2019 (50) | 202 | 1% | Rabbit monoclonal, (1:100; clone SP142; Spring Bioscience) | 52 | 83 | <30 pack years: 15 | I: 53 | SCC: 100 | 7 |
| >30 pack years: 85 | II: 36 | ||||||||
| III: 11 | |||||||||
| Takamori, 2019 (51) | 433 | 1% | Rabbit monoclonal, (1:100; clone SP142; Spring Bioscience) | 34 | 50 | Never: 52 | I: 74 | ADC: 100 | 8 |
| Ever: 48 | II & III: 26 |
*, number of patients used in the present analysis. ADC, adenocarcinoma; SCC, squamous cell carcinoma; NR, not reported. Quality scores were calculated from the U.S. Department of Health & Human Services Quality Assessment Tool for Observational Cohort and Cross-Sectional Studies: https://www.nhlbi.nih.gov/health-topics/study-quality-assessment-tools.
Table S1. Study quality Assessment Criteria.
| Assessment criteria | # (%) of Studies that met this criteria^ |
|---|---|
| 1) Was the research question or objective in this paper clearly stated? | 40 (100%) |
| 2) Was the study population clearly specified and defined? | 40 (100%) |
| 3) Were all the subjects selected or recruited from the same or similar populations (including the same time period)? Were inclusion and exclusion criteria for being in the study prespecified and applied uniformly to all participants? | 20 (50%) |
| 4) Was a sample size justification, power description, or variance and effect estimates provided? | 40 (100%) |
| 5) For the analyses in this paper, were the exposure(s) of interest measured prior to the outcome(s) being measured? | 0 (0%) |
| 6) Was the timeframe sufficient so that one could reasonably expect to see an association between exposure and outcome if it existed? | 40 (100%) |
| 7) For exposures that can vary in amount or level, did the study examine different levels of the exposure as related to the outcome (e.g., categories of exposure, or exposure measured as continuous variable)? | 6 (15%) |
| 8) Were the exposure measures (independent variables) clearly defined, valid, reliable, and implemented consistently across all study participants? | 40 (100%) |
| 9) Were the outcome measures (dependent variables) clearly defined, valid, reliable, and implemented consistently across all study participants? | 40 (100%) |
| 10) Were the outcome assessors blinded to the exposure status of participants? | 0 (0%) |
| 11) Were key potential confounding variables measured and adjusted statistically for their impact on the relationship between exposure(s) and outcome(s)? | 29 (73%) |
Our study quality assessment was based on a modified version of the Center for Disease Control and Prevention’s Quality Assessment Tool for Observational Cohort and Cross-Sectional Studies, which can be found at https://www.nhlbi.nih.gov/health-topics/study-quality-assessment-tools. ^, percentages out of the 40 total included studies in our meta-analysis.
Statistical methods
A meta-analysis was conducted using a linear mixed-effects model to determine the meta-estimate of the average effect for OS (52). The presence of heterogeneity across studies was tested with the Q statistics and I2, with I2 >50% representing a high degree of heterogeneity (53). The results of the meta-analyses were graphically summarized using forest plots. Funnel plots were used to investigate publication bias, and can be found in the Supplementary Materials. The metafor package of R Studio software is a composite of functions designed for conducting meta-analyses (54), and was used for this analysis (version 3.2.2; R Foundation for Statistical Computing, Vienna, Austria) (54).
Overall and subgroup meta-analyses
In the overall analysis of all 40 eligible articles, there were 5 articles that reported results for multiple PD-L1 cutoff values, the cutoff of 50% was the preferentially chosen, being the most commonly used. Articles were then assessed according to specific PD-L1 cutoffs (1%, 5%, 50% or H-score). A number of sensitivity analyses were also performed; (I) According to antibody clonal type (rabbit monoclonal), (II) by stage (stage I–II), and (III) by histology (adenocarcinoma and squamous cell carcinoma, assessed separately). Articles using rabbit monoclonal antibodies were assessed independently; this antibody type was chosen as rabbit antibodies are the most commonly used, with monoclonal antibodies being the “gold standard” over polyclonal antibodies due to their increased specificity and batch-to-batch reproductivity (55). Stage I–IIIA patients subgroup analysis was performed because some stage III patients (stage IIIB specifically) would have undergone surgery likely for palliative and not curative reasons. Lastly, we stratified the studies reporting only adenocarcinoma or squamous cell patients to get a better idea if histology is associated with PD-L1 in the tumor microenvironment.
Role of the funding source
The funder of the study had no role in study design, data collection, data analysis, data interpretation, or writing of the report. The corresponding author had full access to all the data in the study and had final responsibility for the decision to submit for publication.
Results
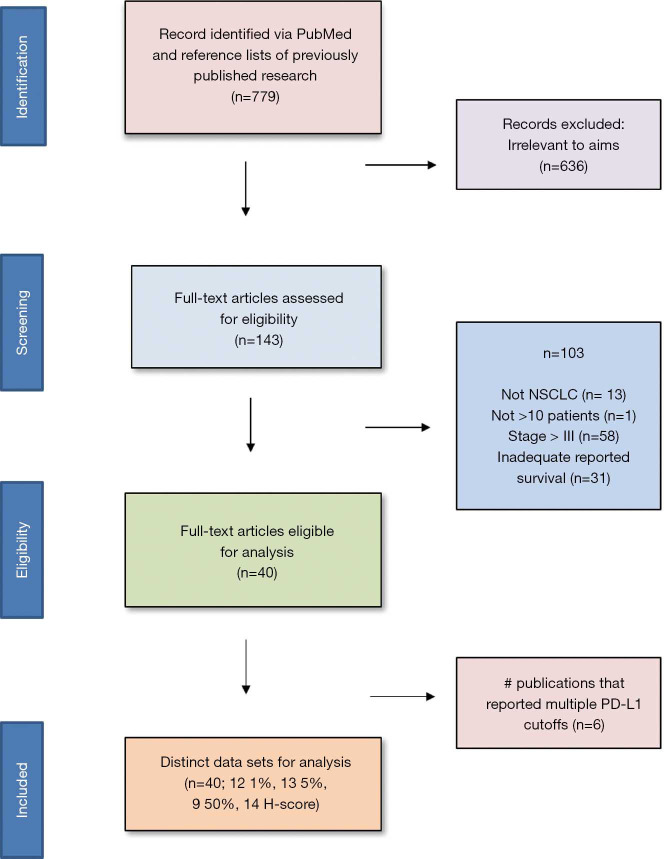
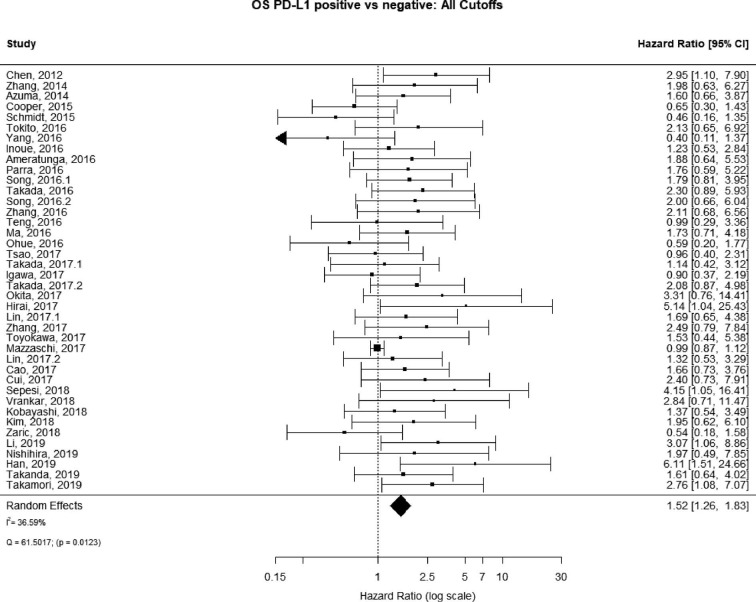
The PubMed search yielded 779 potential articles that were identified and screened for relevance, 636 of which did not meet the scope of this study’s aims. The full text of the remaining 143 were reviewed; of these 40 were found to be eligible, accounting for 10,380 patients [see Figure 1 for Preferred Reporting Items for Systematic Reviews and Meta-analyses (PRISMA) guidelines]. Publication years ranged from 2012–2019. The average quality score was 7/11, with a range of 6–7 and a standard deviation of 1 (Table 1). For these 40 studies, PD-L1 positivity was associated with an increased risk of death (HRmeta =1.53; 95% CI, 1.26–1.83), although there was significant heterogeneity (I2=36.59; Q=61.50, P=0.0123) (Figure 2). Funnel plots did not suggest any publication bias (Figure S1).
Figure 1.
Preferred Reporting Items for Systematic Reviews and Meta-Analyses (PRISMA) flowchart for search selection strategy.
Figure 2.
Overall survival (OS) according to PD-L1 tumor expression; n: 10,380.
Figure S1.
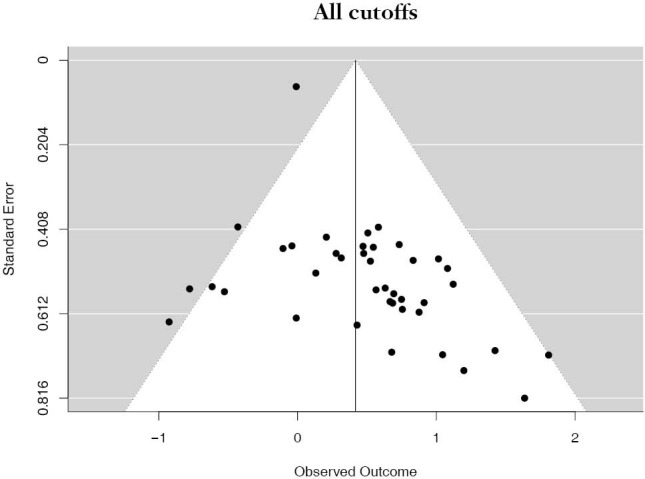
Funnel plot of studies all cutoffs.
1% PD-L1 cutoff
There were 12 studies that reported on PD-L1 positivity using a 1% cutoff, accounting for 4,262 unique patients. Positive PD-L1 tumor expression was associated with worse OS summary estimates (HRmeta =1.59; 95% CI, 1.17–2.17). Study heterogeneity was low and not statistically significant (I2 =13.22%; Q=12.68, P=0.3150) (Figure 3). The funnel plot was not suggestive of publication bias (Figure S2).
Figure 3.
Overall survival (OS) according to PD-L1 tumor expression (1% cutoff); n: 4,262.
Figure S2.
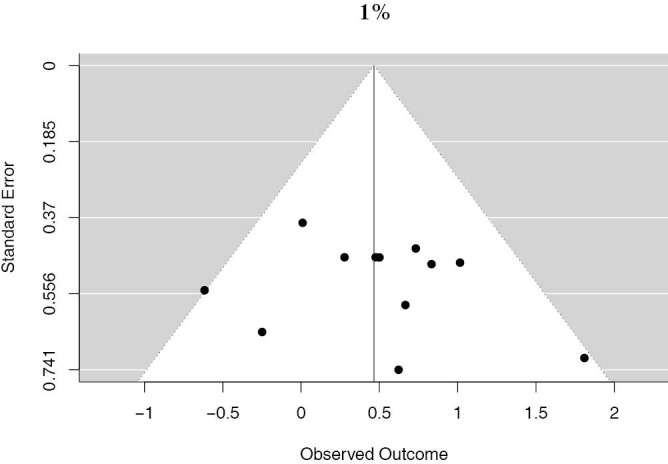
Funnel plot of studies reporting the 1% PD-L1 cutoff.
5% PD-L1 cutoff
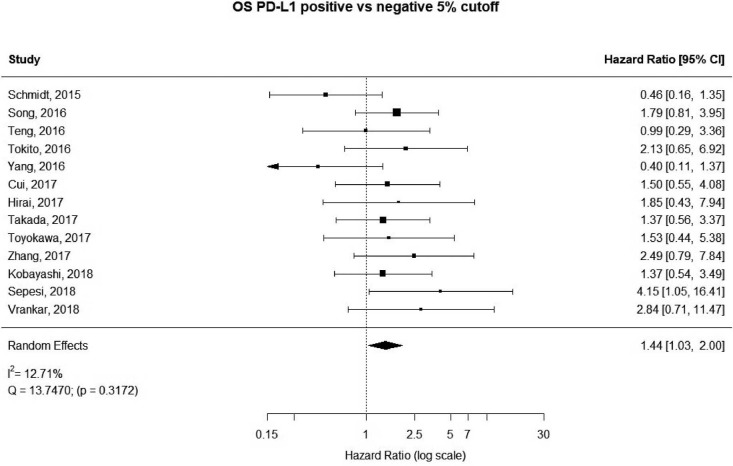
13 studies utilized a 5% staining intensity as a positive vs. negative cut off, representing 1,987 unique patients. With this alternative cut off, positive PD-L1 tumor expression was found to be associated with worse OS (HRmeta =1.44; 95% CI, 1.03–2.00). There was not statistically significant heterogeneity between studies (I2 =12.71%; Q=13.75, P=0.3172), nor evidence of publication bias (Figure 4; Figure S3).
Figure 4.
Overall survival (OS) according to PD-L1 tumor expression (50% cutoff); n: 1,987.
Figure S3.
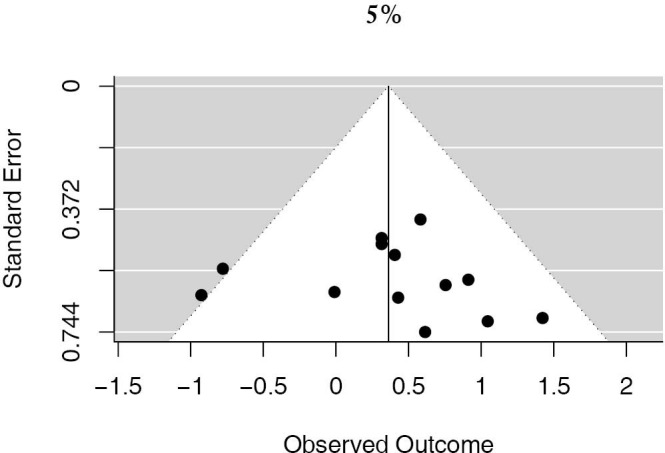
Funnel plot of studies reporting the 5% PD-L1 cutoff.
50% PD-L1 cutoff
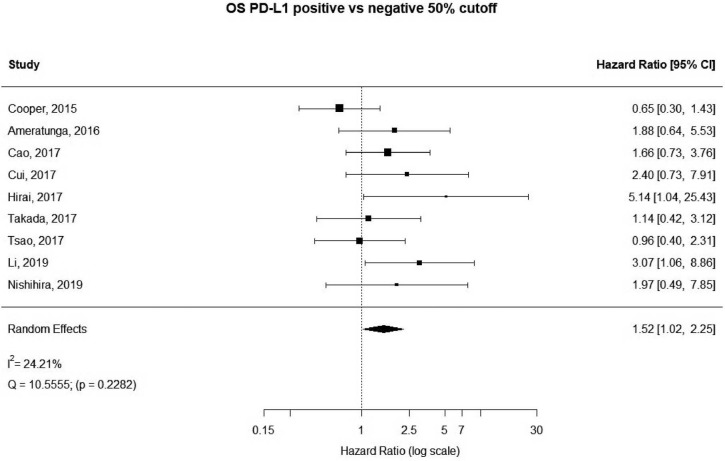
A more stringent cut off value of 50% was used in 9 studies, accounting for 3,289 unique patients. Positive PD-L1 expression was associated with worse OS (HR meta =1.52; 95% CI, 1.02–2.25). The heterogeneity between studies was greater, though not statistically significant (I2 =24.21%; Q=10.56, P=0.2282) (Figure 5). No publication bias was observed (Figure S4).
Figure 5.
Overall survival (OS) according to PD-L1 tumor expression (50% cutoff); n: 3,289.
Figure S4.

Funnel plot of studies reporting the 50% PD-L1 cutoff.
H-scores
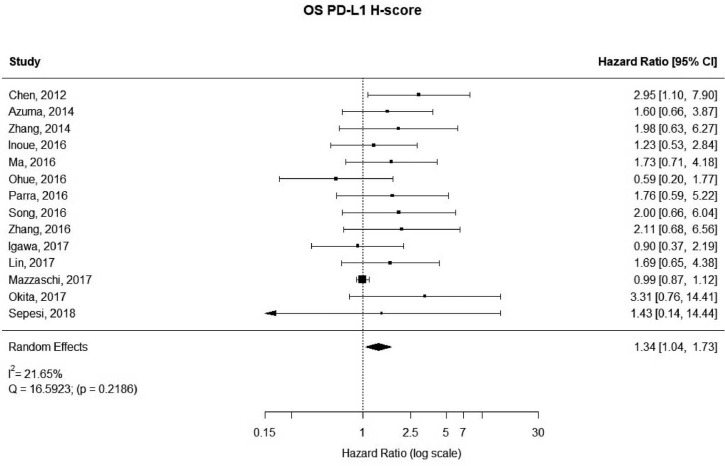
There were 14 studies that used H-scores to quantify PD-L1 tumor expression; these studies accounted for 2,487 patients. Even when using H-scores, positive PD-L1 tumor expression was associated with worse outcomes (HRmeta =1.34; 95% CI, 1.04–1.73). Study heterogeneity was not statistically significant (I2 =21.65%; Q=16.59, P=0.2186); the funnel plot did appear to suggest publication bias (Figure 6; Figure S5).
Figure 6.
Overall survival (OS) according to PD-L1 tumor expression (H-score); n: 2,487.
Figure S5.
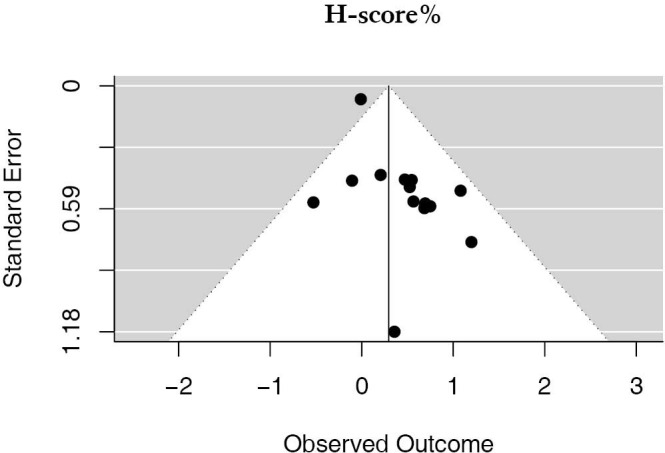
Funnel plot of studies reporting the H-score.
Studies using rabbit monoclonal antibody
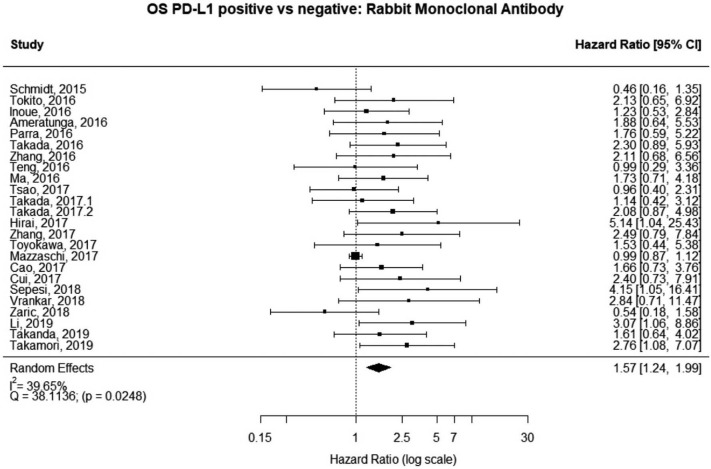
The majority of studies (60%, n=6,604) used some brand of rabbit monoclonal PD-L1 antibody, as reported in Table 1. In the analysis of this subset of studies, PD-L1 expression was positively correlated with worse survival (HRmeta =1.57; 95% CI, 1.24–1.99). There was, however, statistically significant heterogeneity (I2 =39.65%; Q=38.11, P=0.0248) between studies, but little evidence of publication bias (Figure 7; Figure S6).
Figure 7.
Overall survival (OS) according to PD-L1 tumor expression (Rabbit Monoclonal Antibody); n: 6,604.
Figure S6.

Funnel plot of studies using rabbit monoclonal antibody.
Stage I–II patients
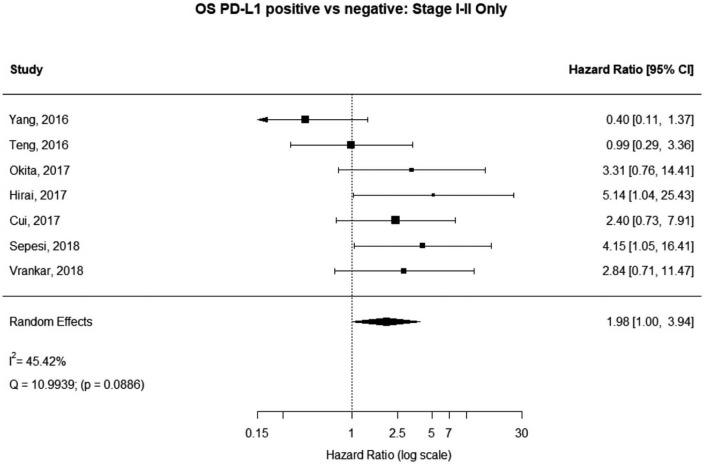
Seven (n=698) of the included studies reported on patients with disease stage I–II. Among these, PD-L1 positive tumors were associated with impaired survival (HRmeta =1.98 95% CI, 1.00–3.94). There was large but not statistically significant heterogeneity between studies (I2 =45.42%; Q=10.99, P=0.0886), with some suggestion of publication bias (Figure 8; Figure S7).
Figure 8.
Overall survival (OS) according to PD-L1 tumor expression (Stage I–II); n: 698.
Figure S7.
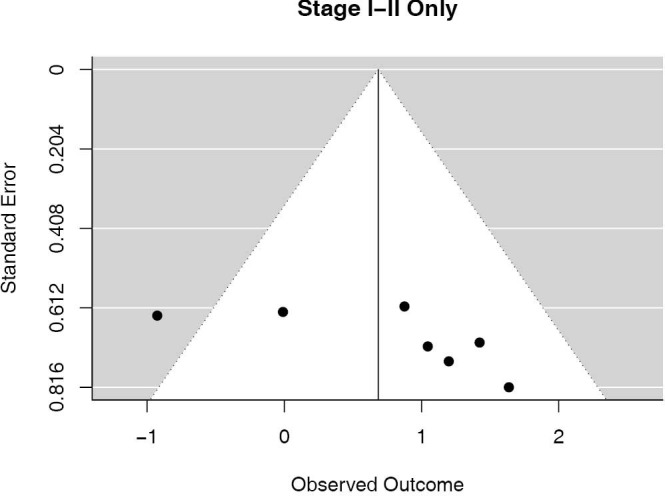
Funnel plot of studies stage I–II only.
Histology
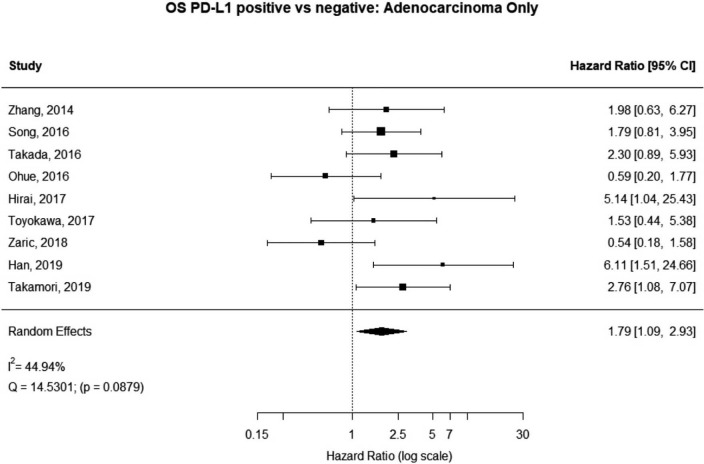
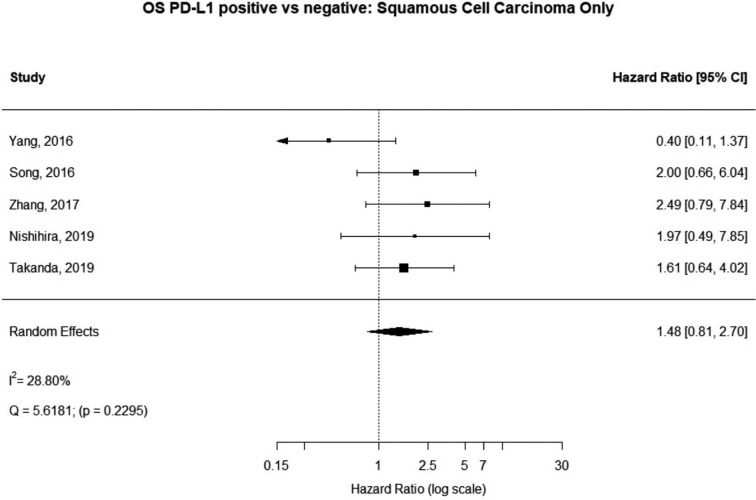
Some studies were limited to patients with a specific NSCLC histological type; 9 studies (n=2,439) reported HRs for patients with adenocarcinoma and 5 (n=539) studies reported for patients with squamous cell carcinoma. For adenocarcinoma, there was a statistically significant relationship between high PD-L1 and mortality (HRmeta =1.79; 95% CI, 1.09–2.93). There was some heterogeneity between studies but this was not statistically significant (I2=44.94%; Q=38.11, P=0.0879), but no publication bias. Among squamous cell patients, those with positive PD-L1 tumors appeared to have worse survival (HRmeta =1.48; 95% CI, 0.81–2.70) but these results were not statistically significant. There did not appear to be any significant heterogeneity between these studies (I2 =28.80%; Q=5.62, P=0.2295), but some evidence of publication bias (Figures 9,10; Figures S8,S9, respectively).
Figure 9.
Overall survival (OS) according to PD-L1 tumor expression (Adenocarcinoma); n: 2,439.
Figure 10.
Overall survival (OS) according to PD-L1 tumor expression (Squamous Cell Carcinoma); n:539.
Figure S8.
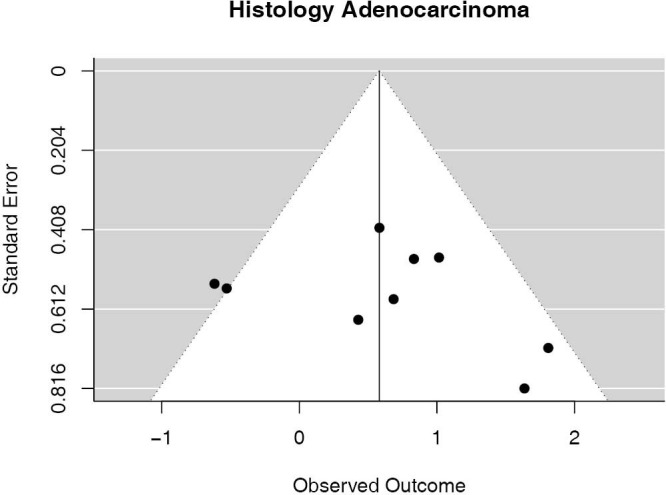
Funnel plot of studies histology adenocarcinoma.
Figure S9.
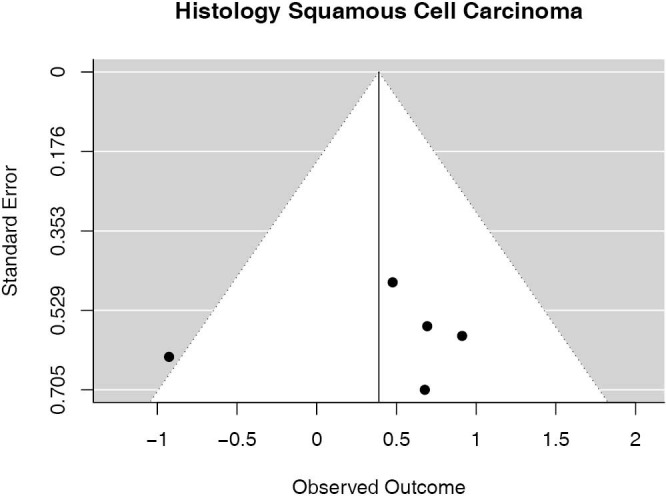
Plot of studies histology squamous cell carcinoma.
Discussion
In the present study we show that PD-L1 tumor expression is associated with worse overall survival in early-stage NSCLC patients. By addressing this question using a meta-analysis we had the methodological advantage of overcoming the limitation of smaller sample sizes of individual studies. This is especially important given that the frequency of PD-L1 positive NSCLC tumors in a sample is known to vary greatly, between 20–54% (56). We observed similar variations in positive PD-L1 expression frequency in the studies included in our meta-analysis. Such variation may be in part due to the limitations of measuring PD-L1 expression using immunohistochemistry (IHC), the intra-tumor heterogeneity of PD-L1 expression, the fact that time to fixation in formaldehyde can modify the level of PD-L1 expression, and the wide variety of PD-L1 antibodies, which may differ in their affinity for PD-L1, and may recognize different epitopes (57).
Our results are consistent with other meta-analyses investigating the prognostic impact of PD-L1 tumor expression in NSCLC, all of which have found PD-L1 positivity to be inversely associated with survival (58-62). However, this is the first meta-analysis to focus only on resectable NSCLC tumors, and to exclude studies with tumors of patients diagnosed with metastatic disease. Our results are therefore an important contribution to literature and show that PD-L1 tumor expression may be useful in predicting which early-stage NSCLC patients are at highest risk of worse survival. Future research should take our work further by evaluating PD-L1 tumor expression at the time of surgery and assessing subsequent survival.
Moreover, we are the first study to investigate differences in reported PD-L1 cutoff values. Studies utilizing IHC are known to make use of different positive thresholds (1% to 50%), and sometimes go even further than just staining percentage by integrating staining intensity (H-score), yet the biological significance and clinical outcomes of utilizing these different parameters is unexplored (57). Our results indicate that regardless of how PD-L1 positivity is defined, PD-L1 tumor expression is indicative of worse survival in early-stage NSCLC.
This association between PD-L1 positivity and worse OS was seen in sensitivity analyses stratified by antibody type, stage, and histology. For those studies using rabbit monoclonal antibody, stage I–II patients, and adenocarcinoma this association was statistically significant. Among studies including squamous cell cancer, PD-L1 positive tumors were associated with worse survival, but this result was not statistically significant. Future research will be needed to investigate whether there is something biologically unique about PD-L1 positive squamous cell tumors or if this was an artifact due to the small pooled sample size of these studies. There are a few limitations of this study; this is a meta-analysis of published data, and as such does not allow for adjustment for clinically important confounders. Most importantly we do not know and could not account for the possible additional medical treatment of the patients included in the analysis, as the level of PD-L1 expression is known to be modulated by anti-cancer therapies including radiotherapy, chemotherapy and targeted therapy (57). There are few published studies reporting on cancer recurrence as the endpoint, and thus this re-analysis of published data could not be performed, but only the association between PD-L1 and OS could be studied. We recommend that studies should be conducted on disease-free survival of early-stage NSCLC patients based on PD-L1 expression. As mentioned, this analysis includes available published studies, which are all retrospective in nature, with the exposure of interest measured retrospectivity; however, due to the biological nature of the exposure (PD-L1 levels) and its method of assessment (IHC staining) there is no concern over recall bias or reverse causality. The included studies were, none-the-less, overall quantified as low quality, with the average quality score of 7/11. Failure to report specific inclusion and exclusion criteria as well as failure to blind researchers to the exposure status of study participants were the two most problematic quality criteria not met. Moreover, most studies did not assess the role of PD-L1 levels using multiple cutoffs. Future analyses looking at PD-L1 as a biomarker should take these quality measures into account, which would in turn strengthen any future meta-analyses on this topic. Lastly, although there did not appear to be significant heterogeneity among the studies included in our analyses, we cannot exclude publication bias for some cut off measures (H-score), and this may impact the results. However, we observed that PD-L1 was associated with worse survival across multiple sensitivity analyses, suggesting that this is a true association and not the result of bias or unmeasurable confounders.
Furthermore, it should be noted that PD-L1 expression is highly dynamic in the tumor microenvironment, and varies based on tumor-host immune cell interactions (63). The biological mechanisms by which PD-L1 tumor expression varies, be they epigenetic, metabolomic, or cytokine-related, and the consequent effects on PD-L1 prognostic value warrants future study.
The utility of PD-L1 expression may extend beyond its use in identifying patients at greatest risk of recurrence and death. PD-L1 expression is an important marker of treatment response to PD-L1/PD-1 immune checkpoint inhibition (64,65). Therefore, early-stage NSCLC patients with positive PD-L1 expression measured in their resected tumor samples may be ideal candidates for adjuvant immunotherapy. The value of adjuvant immunotherapy for NSCLC is still being investigated in the clinical trial setting, but such research should address how effective PD-L1 expression is in predicting adjuvant immunotherapy efficacy.
Conclusions
PD-L1 appears to be a strong prognostic biomarker for early-stage NSCLC survival, and should be the focus of future research, especially in regards to how feasible it is to use as a predictive biomarker for adjuvant immunotherapy. PD-L1 can be quickly, easily, and cheaply measured in tumor samples removed during surgery, and so may represent an optimal tool reducing mortality from NSCLC.
Supplementary
The article’s supplementary files as
Acknowledgments
Funding: Rajwanth Veluswamy was partially supported by Mount Sinai internal grant KL02539874.
Ethics Statement: The authors are accountable for all aspects of the work in ensuring that questions related to the accuracy or integrity of any part of the work are appropriately investigated and resolved.
Footnotes
Reporting Checklist: The authors have completed the PRISMA Reporting Checklist. Available at http://dx.doi.org/10.21037/tlcr-19-638
Conflicts of Interest: All authors have completed the ICMJE uniform disclosure form (available at http://dx.doi.org/10.21037/tlcr-19-638). Dr. Veluswamy has received research funding from the Lung Cancer Research Foundation; has received a CTSA KL2 Scholars Award and a BMS IIT grant; has participated on scientific advisory boards for Merck, BMS, and AstraZeneca; and was on the Speakers Bureau (unbranded) for AstraZeneca. The other authors have no conflicts of interest to declare.
References
- 1.Uramoto H, Tanaka F. Recurrence after surgery in patients with NSCLC. Transl Lung Cancer Res 2014;3:242-9. [DOI] [PMC free article] [PubMed] [Google Scholar]
- 2.Kelsey CR, Marks LB, Hollis D, et al. Local recurrence after surgery for early stage lung cancer: an 11-year experience with 975 patients. Cancer 2009;115:5218-27. 10.1002/cncr.24625 [DOI] [PubMed] [Google Scholar]
- 3.Burdett S, Pignon JP, Tierney J, et al. Adjuvant chemotherapy for resected early-stage non-small cell lung cancer. Cochrane Database Syst Rev 2015;(3):CD011430. [DOI] [PMC free article] [PubMed] [Google Scholar]
- 4.Sugimura H, Nichols FC, Yang P, et al. Survival after recurrent nonsmall-cell lung cancer after complete pulmonary resection. Ann Thorac Surg 2007;83:409-17; discussion 417-8. 10.1016/j.athoracsur.2006.08.046 [DOI] [PubMed] [Google Scholar]
- 5.Wojas-Krawczyk K, Kalinka E, Grenda A, et al. Beyond PD-L1 Markers for Lung Cancer Immunotherapy. Int J Mol Sci 2019;20:1915. 10.3390/ijms20081915 [DOI] [PMC free article] [PubMed] [Google Scholar]
- 6.Bremnes RM, Busund L-T, Kilvær TL, et al. The Role of Tumor-Infiltrating Lymphocytes in Development, Progression, and Prognosis of Non-Small Cell Lung Cancer. J Thorac Oncol 2016;11:789-800. 10.1016/j.jtho.2016.01.015 [DOI] [PubMed] [Google Scholar]
- 7.Wu P, Wu D, Li L, et al. PD-L1 and Survival in Solid Tumors: A Meta-Analysis. PLoS One 2015;10:e0131403. 10.1371/journal.pone.0131403 [DOI] [PMC free article] [PubMed] [Google Scholar]
- 8.Huang Q, Zhang H, Hai J, et al. Impact of PD-L1 expression, driver mutations and clinical characteristics on survival after anti-PD-1/PD-L1 immunotherapy versus chemotherapy in non-small-cell lung cancer: A meta-analysis of randomized trials. Oncoimmunology 2018;7:e1396403. 10.1080/2162402X.2017.1396403 [DOI] [PMC free article] [PubMed] [Google Scholar]
- 9.Sacher AG, Gandhi L. Biomarkers for the Clinical Use of PD-1/PD-L1 Inhibitors in Non-Small-Cell Lung Cancer: A Review. JAMA Oncol 2016;2:1217-22. 10.1001/jamaoncol.2016.0639 [DOI] [PubMed] [Google Scholar]
- 10.Zhang B, Liu Y, Zhou S, et al. Predictive effect of PD-L1 expression for immune checkpoint inhibitor (PD-1/PD-L1 inhibitors) treatment for non-small cell lung cancer: A meta-analysis. Int Immunopharmacol 2020;80:106214. 10.1016/j.intimp.2020.106214 [DOI] [PubMed] [Google Scholar]
- 11.Tuminello S, Veluswamy R, Lieberman-Cribbin W, et al. Prognostic value of immune cells in the tumor microenvironment of early-stage lung cancer: a meta-analysis. Oncotarget 2019;10:7142-55. 10.18632/oncotarget.27392 [DOI] [PMC free article] [PubMed] [Google Scholar]
- 12.Chen YB, Mu CY, Huang JA. Clinical significance of programmed death-1 ligand-1 expression in patients with non-small cell lung cancer: a 5-year-follow-up study. Tumori 2012;98:751-5. 10.1177/030089161209800612 [DOI] [PubMed] [Google Scholar]
- 13.Zhang Y, Wang L, Li Y, et al. Protein expression of programmed death 1 ligand 1 and ligand 2 independently predict poor prognosis in surgically resected lung adenocarcinoma. Onco Targets Ther 2014;7:567-73. 10.2147/OTT.S59959 [DOI] [PMC free article] [PubMed] [Google Scholar]
- 14.Azuma K, Ota K, Kawahara A, et al. Association of PD-L1 overexpression with activating EGFR mutations in surgically resected nonsmall-cell lung cancer. Ann Oncol 2014;25:1935-40. 10.1093/annonc/mdu242 [DOI] [PubMed] [Google Scholar]
- 15.Cooper WA, Tran T, Vilain RE, et al. PD-L1 expression is a favorable prognostic factor in early stage non-small cell carcinoma. Lung Cancer 2015;89:181-8. 10.1016/j.lungcan.2015.05.007 [DOI] [PubMed] [Google Scholar]
- 16.Schmidt LH, Kümmel A, Görlich D, et al. PD-1 and PD-L1 Expression in NSCLC Indicate a Favorable Prognosis in Defined Subgroups. PLoS One 2015;10:e0136023. 10.1371/journal.pone.0136023 [DOI] [PMC free article] [PubMed] [Google Scholar]
- 17.Tokito T, Azuma K, Kawahara A, et al. Predictive relevance of PD-L1 expression combined with CD8+ TIL density in stage III non-small cell lung cancer patients receiving concurrent chemoradiotherapy. Eur J Cancer 2016;55:7-14. 10.1016/j.ejca.2015.11.020 [DOI] [PubMed] [Google Scholar]
- 18.Yang C-Y, Lin M-W, Chang Y-L, et al. Programmed cell death-ligand 1 expression is associated with a favourable immune microenvironment and better overall survival in stage I pulmonary squamous cell carcinoma. Eur J Cancer 2016;57:91-103. 10.1016/j.ejca.2015.12.033 [DOI] [PubMed] [Google Scholar]
- 19.Inoue Y, Yoshimura K, Mori K, et al. Clinical significance of PD-L1 and PD-L2 copy number gains in non-small-cell lung cancer. Oncotarget 2016;7:32113-28. 10.18632/oncotarget.8528 [DOI] [PMC free article] [PubMed] [Google Scholar]
- 20.Ameratunga M, Asadi K, Lin X, et al. PD-L1 and Tumor Infiltrating Lymphocytes as Prognostic Markers in Resected NSCLC. PLoS One 2016;11:e0153954. 10.1371/journal.pone.0153954 [DOI] [PMC free article] [PubMed] [Google Scholar]
- 21.Parra ER, Behrens C, Rodriguez-Canales J, et al. Image Analysis-based Assessment of PD-L1 and Tumor-Associated Immune Cells Density Supports Distinct Intratumoral Microenvironment Groups in Non-small Cell Lung Carcinoma Patients. Clin Cancer Res 2016;22:6278-89. 10.1158/1078-0432.CCR-15-2443 [DOI] [PMC free article] [PubMed] [Google Scholar]
- 22.Song Z, Yu X, Cheng G, et al. Programmed death-ligand 1 expression associated with molecular characteristics in surgically resected lung adenocarcinoma. J Transl Med 2016;14:188. 10.1186/s12967-016-0943-4 [DOI] [PMC free article] [PubMed] [Google Scholar]
- 23.Takada K, Okamoto T, Shoji F, et al. Clinical Significance of PD-L1 Protein Expression in Surgically Resected Primary Lung Adenocarcinoma. J Thorac Oncol 2016;11:1879-90. 10.1016/j.jtho.2016.06.006 [DOI] [PubMed] [Google Scholar]
- 24.Song Z, Yu X, Zhang Y. Altered expression of programmed death-ligand 1 after neo-adjuvant chemotherapy in patients with lung squamous cell carcinoma. Lung Cancer 2016;99:166-71. 10.1016/j.lungcan.2016.07.013 [DOI] [PubMed] [Google Scholar]
- 25.Zhang P, Ma Y, Lv C, et al. Upregulation of programmed cell death ligand 1 promotes resistance response in non-small-cell lung cancer patients treated with neo-adjuvant chemotherapy. Cancer Sci 2016;107:1563-71. 10.1111/cas.13072 [DOI] [PMC free article] [PubMed] [Google Scholar]
- 26.Teng F, Meng X, Wang X, et al. Expressions of CD8+TILs, PD-L1 and Foxp3+TILs in stage I NSCLC guiding adjuvant chemotherapy decisions. Oncotarget 2016;7:64318-29. 10.18632/oncotarget.11793 [DOI] [PMC free article] [PubMed] [Google Scholar]
- 27.Ma Y, Zhang P, An G, et al. Induction of Patient-Derived Xenograft Formation and Clinical Significance of Programmed Cell Death Ligand 1 (PD-L1) in Lung Cancer Patients. Med Sci Monit 2016;22:4017-25. 10.12659/MSM.900661 [DOI] [PMC free article] [PubMed] [Google Scholar]
- 28.Ohue Y, Kurose K, Nozawa R, et al. Survival of Lung Adenocarcinoma Patients Predicted from Expression of PD-L1, Galectin-9, and XAGE1 (GAGED2a) on Tumor Cells and Tumor-Infiltrating T Cells. Cancer Immunol Res 2016;4:1049-60. 10.1158/2326-6066.CIR-15-0266 [DOI] [PubMed] [Google Scholar]
- 29.Tsao M-S, Le Teuff G, Shepherd FA, et al. PD-L1 protein expression assessed by immunohistochemistry is neither prognostic nor predictive of benefit from adjuvant chemotherapy in resected non-small cell lung cancer. Ann Oncol 2017;28:882-9. 10.1093/annonc/mdx003 [DOI] [PMC free article] [PubMed] [Google Scholar]
- 30.Takada K, Okamoto T, Toyokawa G, et al. The expression of PD-L1 protein as a prognostic factor in lung squamous cell carcinoma. Lung Cancer 2017;104:7-15. 10.1016/j.lungcan.2016.12.006 [DOI] [PubMed] [Google Scholar]
- 31.Igawa S, Sato Y, Ryuge S, et al. Impact of PD-L1 Expression in Patients with Surgically Resected Non-Small-Cell Lung Cancer. Oncology 2017;92:283-90. 10.1159/000458412 [DOI] [PubMed] [Google Scholar]
- 32.Takada K, Toyokawa G, Okamoto T, et al. A Comprehensive Analysis of Programmed Cell Death Ligand-1 Expression With the Clone SP142 Antibody in Non-Small-Cell Lung Cancer Patients. Clin Lung Cancer 2017;18:572-582.e1. 10.1016/j.cllc.2017.02.004 [DOI] [PubMed] [Google Scholar]
- 33.Okita R, Maeda A, Shimizu K, et al. PD-L1 overexpression is partially regulated by EGFR/HER2 signaling and associated with poor prognosis in patients with non-small-cell lung cancer. Cancer Immunol Immunother 2017;66:865-76. 10.1007/s00262-017-1986-y [DOI] [PMC free article] [PubMed] [Google Scholar]
- 34.Hirai A, Yoneda K, Shimajiri S, et al. Prognostic impact of programmed death-ligand 1 expression in correlation with human leukocyte antigen class I expression status in stage I adenocarcinoma of the lung. J Thorac Cardiovasc Surg 2018;155:382-392.e1. 10.1016/j.jtcvs.2017.05.106 [DOI] [PubMed] [Google Scholar]
- 35.Lin PL, Cheng YM, Wu DW, et al. A combination of anti-PD-L1 mAb plus Lm-LLO-E6 vaccine efficiently suppresses tumor growth and metastasis in HPV-infected cancers. Cancer Med 2017;6:2052-62. 10.1002/cam4.1143 [DOI] [PMC free article] [PubMed] [Google Scholar]
- 36.Zhang M, Wang D, Sun Q, et al. Prognostic significance of PD-L1 expression and 18F-FDG PET/CT in surgical pulmonary squamous cell carcinoma. Oncotarget 2017;8:51630-40. 10.18632/oncotarget.18257 [DOI] [PMC free article] [PubMed] [Google Scholar]
- 37.Toyokawa G, Shimokawa M, Kozuma Y, et al. Invasive features of small-sized lung adenocarcinoma adjoining emphysematous bullae. Eur J Cardiothorac Surg 2018;53:372-8. 10.1093/ejcts/ezx295 [DOI] [PubMed] [Google Scholar]
- 38.Mazzaschi G, Madeddu D, Falco A, et al. Low PD-1 Expression in Cytotoxic CD8+ Tumor-Infiltrating Lymphocytes Confers an Immune-Privileged Tissue Microenvironment in NSCLC with a Prognostic and Predictive Value. Clin Cancer Res 2018;24:407-19. 10.1158/1078-0432.CCR-17-2156 [DOI] [PubMed] [Google Scholar]
- 39.Lin G, Fan X, Zhu W, et al. Prognostic significance of PD-L1 expression and tumor infiltrating lymphocyte in surgically resectable non-small cell lung cancer. Oncotarget 2017;8:83986-94. 10.18632/oncotarget.20233 [DOI] [PMC free article] [PubMed] [Google Scholar]
- 40.Cao L, Wang X, Li S, et al. PD-L1 is a Prognostic Biomarker in Resected NSCLC Patients with Moderate/high Smoking History and Elevated Serum SCCA Level. J Cancer 2017;8:3251-60. 10.7150/jca.21118 [DOI] [PMC free article] [PubMed] [Google Scholar]
- 41.Cui S, Su X, Dong L, et al. Programmed cell death ligand 1 protein levels predicted survival of non-small cell lung cancer. J Cancer 2017;8:4075-82. 10.7150/jca.21415 [DOI] [PMC free article] [PubMed] [Google Scholar]
- 42.Sepesi B, Cuentas EP, Canales JR, et al. Programmed Death Cell Ligand 1 (PD-L1) Is Associated With Survival in Stage I Non-Small Cell Lung Cancer. Semin Thorac Cardiovasc Surg 2017;29:408-15. 10.1053/j.semtcvs.2017.05.008 [DOI] [PubMed] [Google Scholar]
- 43.Vrankar M, Zwitter M, Kern I, Stanic K. PD-L1 expression can be regarded as prognostic factor for survival of non-small cell lung cancer patients after chemoradiotherapy. Neoplasma 2018;65:140-6. 10.4149/neo_2018_170206N77 [DOI] [PubMed] [Google Scholar]
- 44.Kobayashi K, Seike M, Zou F, et al. Prognostic Significance of NSCLC and Response to EGFR-TKIs of EGFR-Mutated NSCLC Based on PD-L1 Expression. Anticancer Res. 2018;38:753-62. [DOI] [PubMed] [Google Scholar]
- 45.Kim H, Kwon HJ, Park SY, et al. Clinicopathological analysis and prognostic significance of programmed cell death-ligand 1 protein and mRNA expression in non-small cell lung cancer. PLoS One 2018;13:e0198634. 10.1371/journal.pone.0198634 [DOI] [PMC free article] [PubMed] [Google Scholar]
- 46.Zaric B, Brcic L, Buder A, et al. PD-1 and PD-L1 Protein Expression Predict Survival in Completely Resected Lung Adenocarcinoma. Clin Lung Cancer. 2018;19:e957-63. 10.1016/j.cllc.2018.08.014 [DOI] [PubMed] [Google Scholar]
- 47.Li W, Song P, Guo L, et al. Clinical significance of ≥ 50% PD-L1 expression with the SP263 monoclonal antibody in non-small cell lung cancer patients. Thorac Cancer 2019;10:175-82. 10.1111/1759-7714.12929 [DOI] [PMC free article] [PubMed] [Google Scholar]
- 48.Nishihira M, Nakazato Y, Maeda S, et al. Impact of tumor infiltrating lymphocytes and lymphoid follicle formation on patient survival following surgery for lung squamous cell carcinoma. Thorac Cancer 2019;10:219-25. 10.1111/1759-7714.12935 [DOI] [PMC free article] [PubMed] [Google Scholar]
- 49.Han YB, Kwon HJ, Park SY, et al. Human Leukocyte Antigen Class I and Programmed Death-Ligand 1 Coexpression Is an Independent Poor Prognostic Factor in Adenocarcinoma of the Lung. J Pathol Transl Med 2019;53:86-93. 10.4132/jptm.2018.12.26 [DOI] [PMC free article] [PubMed] [Google Scholar]
- 50.Takada K, Kohashi K, Shimokawa M, et al. Co-expression of IDO1 and PD-L1 in lung squamous cell carcinoma: Potential targets of novel combination therapy. Lung Cancer 2019;128:26-32. 10.1016/j.lungcan.2018.12.008 [DOI] [PubMed] [Google Scholar]
- 51.Takamori S, Takada K, Azuma K, et al. Prognostic Impact of Programmed Death-Ligand 2 Expression in Primary Lung Adenocarcinoma Patients. Ann Surg Oncol 2019;26:1916-24. 10.1245/s10434-019-07231-z [DOI] [PubMed] [Google Scholar]
- 52.DerSimonian R, Laird N. Meta-analysis in clinical trials. Control Clin Trials. 1986;7:177-88. 10.1016/0197-2456(86)90046-2 [DOI] [PubMed] [Google Scholar]
- 53.Higgins JPT, Thompson SG. Quantifying heterogeneity in a meta-analysis. Stat Med 2002;21:1539-58. 10.1002/sim.1186 [DOI] [PubMed] [Google Scholar]
- 54.Viechtbauer W. metafor: Meta-Analysis Package for R [Internet]. 2019 [cited 2019 May 29]. Available online: https://CRAN.R-project.org/package=metafor
- 55.Polyclonal vs. monoclonal antibodies [Internet]. [cited 2020 May 4]. Available online: https://www.ptglab.com/news/blog/polyclonal-vs-monoclonal-antibodies/
- 56.Kerr KM, Tsao M-S, Nicholson AG, et al. Programmed Death-Ligand 1 Immunohistochemistry in Lung Cancer: In what state is this art? J Thorac Oncol 2015;10:985-9. 10.1097/JTO.0000000000000526 [DOI] [PubMed] [Google Scholar]
- 57.Ilie M, Hofman V, Dietel M, et al. Assessment of the PD-L1 status by immunohistochemistry: challenges and perspectives for therapeutic strategies in lung cancer patients. Virchows Arch 2016;468:511-25. 10.1007/s00428-016-1910-4 [DOI] [PubMed] [Google Scholar]
- 58.Soo RA, Chen Z, Yan Teng RS, et al. Prognostic significance of immune cells in non-small cell lung cancer: meta-analysis. Oncotarget 2018;9:24801-20. 10.18632/oncotarget.24835 [DOI] [PMC free article] [PubMed] [Google Scholar]
- 59.Pan ZK, Ye F, Wu X, et al. Clinicopathological and prognostic significance of programmed cell death ligand1 (PD-L1) expression in patients with non-small cell lung cancer: a meta-analysis. J Thorac Dis 2015;7:462-70. [DOI] [PMC free article] [PubMed] [Google Scholar]
- 60.Zhou ZJ, Zhan P, Song Y. PD-L1 over-expression and survival in patients with non-small cell lung cancer: a meta-analysis. Transl Lung Cancer Res 2015;4:203-8. 10.1016/j.lungcan.2015.06.005 [DOI] [PMC free article] [PubMed] [Google Scholar]
- 61.Wang A, Wang HY, Liu Y, et al. The prognostic value of PD-L1 expression for non-small cell lung cancer patients: a meta-analysis. Eur J Surg Oncol 2015;41:450-6. 10.1016/j.ejso.2015.01.020 [DOI] [PubMed] [Google Scholar]
- 62.Ma J, Chi D, Wang Y, et al. Prognostic value of PD-L1 expression in resected lung adenocarcinoma and potential molecular mechanisms. J Cancer 2018;9:3489-99. 10.7150/jca.26155 [DOI] [PMC free article] [PubMed] [Google Scholar]
- 63.Cottrell TR, Taube JM. PD-L1 and Emerging Biomarkers in PD-1/PD-L1 Blockade Therapy. Cancer J 2018;24:41-6. 10.1097/PPO.0000000000000301 [DOI] [PMC free article] [PubMed] [Google Scholar]
- 64.Topalian SL, Hodi FS, Brahmer JR, et al. Safety, activity, and immune correlates of anti-PD-1 antibody in cancer. N Engl J Med 2012;366:2443-54. 10.1056/NEJMoa1200690 [DOI] [PMC free article] [PubMed] [Google Scholar]
- 65.Brahmer JR, Tykodi SS, Chow LQM, et al. Safety and activity of anti-PD-L1 antibody in patients with advanced cancer. N Engl J Med 2012;366:2455-65. 10.1056/NEJMoa1200694 [DOI] [PMC free article] [PubMed] [Google Scholar]
Associated Data
This section collects any data citations, data availability statements, or supplementary materials included in this article.
Supplementary Materials
The article’s supplementary files as


