

Abstract
This chapter reviews the historical development of indicators to identify severe maternal morbidity/maternal near miss (SMM/MNM), and their use for public health surveillance, research, and clinical audit. While there has been progress toward identifying standard definitions for SMM/MNM within countries, there remain inconsistencies in the definition of SMM/MNM indicators and their application between countries. Using these indicators to screen for events that then trigger a clinical audit may both under identify select SMM/MNM (false negative)and over identify select SMM/MNM (false positive). Thus, indicators which support the efficient identification of SMM/MNM for the purpose of facility-based clinical audits are still needed.
Keywords: pregnancy, morbidity, mortality, history, surveillance
A Brief History of Severe Maternal Morbidity (SMM) and Maternal Near Miss (MNN)
Maternal mortality is a globally accepted indicator of access to quality maternal and obstetric care. However, maternal mortality is a relatively rare event and these events are at the tip of the iceberg when considering all severe complications. To enhance examination of this rare event, SMM was proposed as a complementary indicator of access to quality maternal and obstetric care in 1991.1 The term maternal near miss (MNM) is often used interchangeable with SMM.2 For the remainder of the manuscript, this indicator will be referred to as SMM/MNM.
The World Health Organization (WHO) published the first systematic review on SMM/MNM in 2004.2 The review showed wide variations in how SMM/MNM is defined across studies and recommended the development of uniform criteria for identifying SMM/MNM. In 2009, a WHO technical working group defined SMM/MNM as “a complication that occurred during pregnancy, childbirth or within 42 days of termination of pregnancy in women who nearly died but survived.”3 WHO updated this definition in 2011 to support a focus on MNM as an initiating event for conducting facility-level audits that would be comparable across different settings and time, and that could be used for facility and health system quality improvement.4 The 2011 SMM/MNM definition includes 5 disease-specific, 4 management, and 7 organ dysfunction-based criteria (Table 1).
TABLE 1.
Definitions of SMM/MNM Proposed by World Health Organiztion2
| Major SMM/MNM Groupings | ||
|---|---|---|
| Disease-specific | Management-based | Organ Dysfunction-based |
| Severe preeclampsia | Admission to ICU | Cardiovascular dysfunction |
| Eclampsia | Use of blood products | Respiratory dysfunction |
| Severe postpartum hemorrhage | Laparotomy | Renal dysfunction |
| Sepsis or severe systematic infection | Uterine artery embolization | Hepatic dysfunction |
| Ruptured uterus | Neurological dysfunction | |
| Coagulation/hematologic dysfunction | ||
| Uterine dysfunction | ||
ICU indicates intensive care unit; MNM, maternal near miss; SMM, severe maternal morbidity.
Implementing SMM/MNM Indicators
As these 2011 criteria were applied to studies in developing countries, investigators determined that modification of the SMM/MNM criteria was necessary.5,6 Disease-specific and management-based criteria were the most successfully used indicators. Organ dysfunction-based criteria were less successful because they required more complex laboratory and clinical monitoring and because a large proportion of childbirths in these settings occurred outside of hospitals. In sub-Saharan Africa, 17% to 75% of births occur outside of hospitals.7
Applying organ dysfunction-based criteria in developing country settings is also challenging. In a multicounty study, which included the Netherlands, Malawi, and Tanzania, organ dysfunction-based criteria identified only 40.3% of SMM/MNM events.8
However, disease and management-based criteria alone or together may be sufficient for monitoring SMM/MNM. In this same multicountry study of > 3000 women (7.8% from Tanzania, 12.2% from Malawi, and 80.0% from the Netherlands), disease-based criteria alone identified ~50% of SMM/MNM events in Tanzania, 87% in Malawi, and 91% in the Netherlands. Using management-based criteria alone 86% of SMM/MNM events in Tanzania, 45% in Malawi, and 83% in the Netherlands were identified.8
A 2012 systematic review on SMM/MNM included 82 cross-sectional facility-level studies from 46 countries.9 These studies were carried out before or soon after WHO introduced the 2004 criteria. For disease-based criteria, the rates ranged from 60 to 1458 per 10,000 deliveries, and for management-based criteria, rates ranged from 4 to 454.9 Most studies included occurred in health facilities in different geographic locations with distinct population characteristics. Across studies, the SMM/MNM definitions applied varied widely.
From 2014 through 2016, the Global Network’s Maternal and Newborn Health Registry carried out a prospective, population-based, observational study on SMM/MNM in 6 countries.6 These countries included the Democratic Republic of the Congo, Guatemala, India, Kenya, Pakistan, and Zambia. WHO criteria were modified to minimize indicators dependent upon tests and procedures. Rates of SMM/MNM ranged from 40 per 10,000 live births in Nagpur, India to 820 in Pakistan. Approximately 20% of women experienced ≥ 2 SMM/MNM criterion during delivery.6
In a 2012 systematic review, emergency peripartum hysterectomy (EPH) was used in 33 studies as an indicator of SMM/MNM.9 The EPH rate ranged from 4 to 26 per 10,000 deliveries. A second systematic review and meta-analysis, focused solely on EPH, was published in 2016.10 This review included 128 studies (11 population-based and 117 facility-based studies) published from 1980 through 2015. In this review, the EPH rate was 10 per 10,000 deliveries (range, 2 to 101).10 EPH rates increased over time, regardless of study design, geographical location, study size, or study population characteristics. Placental abnormalities were the most common factor leading to peripartum hysterectomy. In the pooled analysis, women with a previous cesarean section delivery had 7.5 times the odds of EPH, and women delivered by cesarean section in the current pregnancy had 11.4 times the odds of experiencing EPH compared with women who did not deliver by cesarean section. The EPH rate in 5 Nordic countries (Denmark, Norway, Finland, Sweden, and Iceland) was reported in a study using data from national medical birth registers and national hospital discharge registers.11 During 2009–2012 the 5 country EPH rate was 3.5 per 10,000 births, ranging from 2.9 in Norway to 5.1 in Finland.11
In the 2012 systematic review of SMM/MNM indicator use, intensive care unit (ICU) admission was used as an indicator of SMM/MNM in 18 studies.9 The range of ICU admission rates among these studies ranged from 4 to 454 per 10,000 deliveries. One explanation for the wide range of ICU admission rates is that admission to an ICU relies on the availability of a critical care facility, health care personnel, and emergency transportation. The availability of these resources vary by the general structure of the health systems between countries and geographic regions. Other explanations for the high variations in ICU admission rates are the care capabilities and capacity of facilities, care flow, admission criteria, patient volume, patient population, and severity of the patient conditions.12
Maryland13 and Texas14 have reported state-level rates of ICU admission among delivery hospitalizations. The ICU admission rate per 10,000 delivery hospitalizations ranged from 42 in Maryland (1998–2008) to 321 in Texas (2001–2010).13,14 In the Texas study, ICU admissions varied between prenatal, delivery, and postpartum periods. ICU admissions during the prenatal period were 4.5 times higher than during delivery hospitalizations and ICU admissions during the postpartum period were 3.0 times higher than during delivery hospitalizations. ICU admission rates also varied by pregnancy outcome. Women whose pregnancy ended in an induced abortion had an ICU admission rate of 6 per 10,000 delivery hospitalizations, women whose pregnancy ended in a live birth had an ICU admission rate of 296, and women whose pregnancy ended in stillbirth had a rate of 859. The most common conditions associated with ICU admissions in the Maryland study were pregnancy-related hypertensive disease (29.9% of admissions), hemorrhage (18.8%), and cardiomyopathy/other cardiac disease (18.3%). The conditions associated with ICU admissions identified in this Maryland study overlapped with conditions identified in a New Jersey study (1997–2005).15 In New Jersey, conditions associated with a significantly higher adjusted odds of ICU admission were preeclampsia [adjusted odds ratio (aOR): 2.8], eclampsia (aOR: 6.8), placenta previa (aOR: 3.0), and placental abruption (aOR: 8.9).
Surveillance of SMM/MNM in Developed Countries: Examples and Challenges
In economically developed countries most childbirths occur in hospitals with advanced health information-technology systems, and as such, population-based data on SMM/MNM are typically available at the national level. The International Classification of Diseases or similar coding systems are usually used to identify SMM/MNM from hospital discharge records in these settings. Surveillance of SMM/MNM has been successfully implemented in economically developed countries including the United Kingdom, Canada, Sweden, the Netherlands, and the United States.
In the United Kingdom, maternal morbidity outcomes during childbirth are measured using an English Maternal Morbidity Outcome Indicator (EMMOI). Routine hospital data from the Hospital Episode Statistics database of the Health and Social Care Information Centre are used for this purpose.16 The EMMOI (17 diagnoses and 9 procedures) is based on the Australian Maternal Morbidity Outcome Indicator as well as on published literature on maternal morbidity and mortality in the United Kingdom.17 However, selection criteria for inclusion of SMM/MNM indicators included in EMMOI were primarily driven by the quality of routine hospital data. For example, data on blood transfusion and “repair of ruptured or inverted uterus” were not included for identifying postpartum hemorrhage (PPH) because evidence suggested the quality of data for these variables was low. The estimated rate of transfusion of blood and blood products in the data decreased 60-fold, even while the estimated PPH rate doubled between 2003–2004 and 2012–2013. Researchers also justified excluding “repair of ruptured or inverted uterus” to identify PPH, because a substantial proportion of hospital records with uterine rupture were missing this coded information or there was substantial fluctuation in the rates of uterine repair across the years.
From 2003 to 2013, the EMMOI rate increased from 33 per 10,000 deliveries in 2003–2004 to 47 in 2012–2013.16 This increase was mainly driven by increases in sepsis, uterine rupture, assisted ventilation (including tracheostomy), and repair of bladder or cystostomy. In 2012–2013 sepsis, uterine rupture, eclampsia, repair of bladder, and evacuation of hematoma were the 5 most common SMM/MNM indicators in the United Kingdom. The lower overall rate of SMM/MNM compared with those reported from studies in other economically developed countries may be explained by the UK exclusion of blood transfusion as an SMM/MNM indicator.
In Canada, the Discharge Abstract Database of the Canadian Institute for Health Information, a database of all hospital discharges in Canada (except Quebec) is used for surveillance of SMM/MNM.18 Delivery hospitalizations, and among them SMM/MNM events, are identified using the International Statistical Classification of Diseases and Related Health Problems, 10th revision Canada (ICD-10-CA) and Canadian Classification of Health Interventions (CCI) codes for diagnoses and procedures, respectively. Development of the Canadian SMM/MNM indicators was based on current clinical knowledge and the Australian Maternal Morbidity Outcome Indicator (AMMOI). Thus, the Canadian SMM/MNM indictors overlap with the AMMOI and the EMMOI. However, in Canada, additional demographic and clinical information are also extracted from medical charts (eg, maternal age, parity, and details related to blood transfusion). These additional variables supported the inclusion of several combined indicators related to blood-transfusion: PPH+blood transfusion, PPH+embolization or ligation of pelvic vessels, and PPH+hysterectomy. Results from a 2003–2007 study using the Discharge Abstract Database of the Canadian Institute for Health Information demonstrated that the SMM/MNM rate varied between Canadian provinces or territories, from 113 per 10,000 deliveries to 225.18 In the most recent report that uses the Canadian data (2014–2015), the overall SMM/MNM rate was 142 per 10,000 deliveries, with blood transfusion the most common SMM/MNM indicator (with a rate of 80 per 10,000 deliveries).19
In Sweden, all hospital delivery units report to the Swedish Medical Birth Register and the Swedish Hospital Discharge Register. Using the unique personal identification number assigned to each Swedish citizen at birth or upon immigration, data can be linked between these 2 databases. In the Swedish Medical Birth Register, data on the course of pregnancy and delivery are prospectively collected beginning with a woman’s first prenatal visit. The Swedish Hospital Discharge Register contains information on hospital admissions and discharges. In a nationwide study using the Swedish data, the overall rate of SMM/MNM during 1998–2007 was 29 per 10,000 deliveries.20 Restrictions and exclusions used by the researchers may explain the lower rate in Sweden compared with other countries described earlier. Researchers restricted the study population to singleton deliveries with a gestational age ≥ 28 weeks and excluded blood transfusions or procedures to control hemorrhage (eg, embolization or ligation of pelvic vessels or suturing of uterus). The most common diagnostic group was either uterine rupture or obstetric laparotomy, or both (11.8 per 10,000 deliveries), followed by preeclampsia (including hemolysis, elevated liver enzyme and low platelet count and disseminated intravascular coagulation) and eclampsia (6.8), and cardiac events (4.3).
In the Netherlands, SMM/MNM surveillance is based on data from a nationwide prospective population-based cohort study.21 This study is also known as the national study into ethnic determinants of maternal morbidity in the Netherlands (LEMMoN). SMM/MNM events were identified using the national electronic surveillance system of the Netherlands Surveillance Centre for Obstetrics and Gynaecology.21 Data were obtained through multiple sources including maternity computer databases, labor ward diaries, staff reports, intensive care admission registers, blood transfusion registers, discharge data, and personal communication. All 98 hospitals with a maternity unit in the Netherlands participated in the survey from August 2004 until August 2006. Only those women who delivered in hospitals under the care of obstetricians (59% of all births) were included, that is, those women with high-risk pregnancies and those with low-risk pregnancies but developed complications. As all severe complications during pregnancy were included in the numerator, and only deliveries ≥ 24 weeks were included in the denominator, the indicator was expressed as a ratio rather than a rate. SMM/MNM indicators were categorized into 5 groups: ICU or coronary unit admission, uterine rupture, eclampsia/hemolysis, elevated liver enzyme and low platelet count, major obstetric hemorrhage, and miscellaneous. SMM/MNM indicators from the miscellaneous group included acute fatty liver of pregnancy, severe early preeclampsia not requiring ICU admission, and pulmonary embolism. The overall SMM/MNM ratio was 71 per 10,000 deliveries. Major obstetric hemorrhage (45/10,000) and eclampsia (6.2/10,000) were the most common indicators.
In the United States, the Centers for Disease Prevention and Control (CDC) uses a large all-payer hospital inpatient care database, the Nationwide Inpatient Sample,22 for SMM/MNM surveillance. CDC SMM/MNM indicators are based on 3 guiding principles: (1) state level availability of data in most states, territories, and large metropolitan areas; (2) presence of an established evidence-base in the literature; and (3) quality of the indicator was sufficient for population level surveillance and the planning and evaluation of public health interventions. The 2009 list of SMM/MNM had 25 indicators that together comprised the initial CDC SMM/MNM index.23 A validation study of the CDC SMM/MNM index, using 67,468 deliveries across 16 California hospitals, found a specificity of 0.77, sensitivity of 0.99, and positive predictive value of 0.44.24
In 2015, CDC, the American College of Obstetricians and Gynecologists (ACOG), and the Alliance for Innovation on Maternal Health updated the 2009 set of 25 CDC SMM/MNM indicators.23 Updates were based on results from available validation studies, feedback from stakeholders, and the need to transition from ICD-9-CM to ICD-10-CM/PCS. The updated CDC SMM/MNM index included 21 indicators. On the basis of the revised 21 indicator index, rates for the majority of SMM/MNM indicators increased in the United States between 1993 and 2014.24 Exceptions to the increase were severe complications of anesthesia, heart failure, eclampsia, puerperal cerebrovascular disorders, and amniotic fluid embolism. The largest relative increases (≥ 200%) in SMM/MNM indicators were observed for acute myocardial infarction, aneurysm, blood transfusion, acute renal failure, and adult respiratory distress syndrome. About 18,000 (in 1993) and 55,000 (in 2014), or 0.5% and 1.4% of all delivery hospitalizations, respectively, had at least 1 SMM/MNM. Annually updated SMM/MNM rates for the United States, a list of SMM/MNM indicators included in the index, and other details can be found at the CDC Web site.25
A description of SMM/MNM surveillance efforts and the current published rates of selected SMM/MNM indicators at the country level are summarized in Table 2 and Table 3, respectively. SMM/MNM surveillance systems in economically developed countries perform well in tracking temporal trends and identifying geographic, racial-ethnic, and other disparities within a country, but the lack of a uniform definition for SMM/MNM creates wide variations in rates. Variation exists because countries apply different exclusion criteria for SMM/MNM definitions (eg, blood transfusions, dialysis, and uterine rupture) and delivery populations (eg, cut-off for gestational age, multiple gestations, stillbirths and/or fetal births). Additional challenges to comparability relate to availability and reliability of data elements across national data sets. The selection of indicators is often dependent on the quality of the administrative data. While it is valuable to identify opportunities to reduce differences between countries in the application of SMM/MNM indicators for surveillance, consistent and complete accounting for SMM/MNM events alone is unlikely to bring us closer to preventing SMM/MNM.
TABLE 2.
Surveillance of Severe Maternal Morbidity or Maternal Near Miss at the Country Level in Developed Countries
| United Kingdom | Canada | Sweden | The Netherlands | United States | |
|---|---|---|---|---|---|
| Data | Hospital Episode Statistics database of the Health, and Social Care Information Centre | Discharge Abstract Database of the Canadian Institute for Health Information | Swedish Medical Birth Register | Maternity computer databases, labor ward diaries, staff reports, intensive care admission registers, blood transfusion registers, discharge data, and personal communication | National Inpatient Sample |
| Indicators | 26 indicators: 17 diagnoses 9 procedures | 25 indicators: 13 diagnoses, 8 procedures, 4 mixed (combined diagnoses and procedures) | 7 indicators: 6 diagnoses, 1 mixed | 5 indicators: 1 management-based, 2 diagnoses, 3 mixed | 21 indicators: 16 diagnoses, 5 procedures |
| Identification | International Statistical Classification of Diseases and Related Health Problems, 10th revision (ICD-10), and Procedures used by clinical coders within National Health Service (NHS) hospitals | International Statistical Classification of Diseases and Related Health Problems, 10th revision Canada (ICD-10-CA), and Canadian Classification of Health Interventions (CCI) | International Statistical Classification of Diseases and Related Health Problems, 10th revision (ICD-10), and Coded surgical procedures according to the Nordic Medical Statistics Committee | Anonymized data consisting of a case record form with photocopies of relevant parts of the patient file | International Classification of Diseases, Ninth Revision, Clinical Modification (ICD-9-CM), and International Classification of Diseases, Tenth Revision, Clinical Modification (ICD-10-CM) |
| Population | Women who experienced a childbirth episode | All deliveries | Singleton deliveries, and gestational age ≥ 28 wk | Gestational age ≥ 24 wk, and women with high-risk pregnancies and those with low-risk pregnancies who develop complications | Deliveries that did not end in abortion or miscarriage, and severity criteria can be applied to restrict population, using ICD-9-CM diagnoses, to only hospitalizations with in-hospital mortality, nonroutine disposition, without transfer to another hospital, and length of stay ≥ 3–5 d depending on delivery method |
| Denominator | 10,000 birth hospitalizations | 1000 deliveries | 1000 deliveries | 1000 deliveries | 10,000 delivery hospitalizations |
TABLE 3.
Country Level Rates of Select SMM/MNM Indicators From Developed Countries (Reported as Per 10,000)
| Country | |||||
|---|---|---|---|---|---|
| SMM/MNM Indicator | United Kingdom (2012–2013) | Canada (2007) | Sweden (1998–2007) | The Netherlands (2004–2006) | United States (2014) |
| Eclampsia | 5.6 | 5.7 | 6.8 includes preeclampsia | 6.2 | 2.2 with severity criteria 6.6 without severity criteria |
| Cardiac arrest or failure, myocardial infarction, or pulmonary edema | 0.5 | 9.4 | 4.3 | NA | 1.1 cardiac arrest, fibrillation/conversion of cardiac rhythm 2.4 acute congestive heart failure or pulmonary edema |
| Uterine rupture | 5.8 | 2.3 before labor 7.8 during labor | 11.8 | 6.1 | NA |
| Sepsis | 10.3 | 8.8 | 1.8 | NA | 4.2 with severity criteria 6.8 without severity criteria |
| Blood transfusion (whole blood: platelet-plasma, and red cell) | NA | 71 | NA | NA | 122 |
| Assisted ventilation through tracheostomy or endotracheal tube | 2.6 | 4.7 | NA | NA | 7.8 |
| Hysterectomy | 2.2 | 11.6 | 1.6 | NA | 10.7 |
| ICU admissions or admissions to coronary units, other than for standard postoperative recovery | NA | NA | NA | 24 | NA |
| Repair of bladder, urethra or intestine | 3.9 | 6.4 | NA | NA | NA |
ICU indicates intensive care unit; MNM, maternal near miss; NA, not available; SMM, severe maternal morbidity.
Preventing SMM/MNM: Clinical Audits
At the facility level, effective prevention strategies for SMM/MNM can be identified through carrying out clinical audits (Fig. 1). To date, a uniform, comprehensive definition of SMM/MNM that can be used to initiate a clinical audit has not been widely accepted in the United States. ACOG and the Society for Maternal-Fetal Medicine (SMFM) have proposed 2 criteria (transfusion of ≥ 4 units of blood and ICU admission) to initially identify cases of SMM/MNM for health care institution audits. Facilities may use these criteria in conjunction with their own criteria (Fig. 2).26
FIGURE 1.
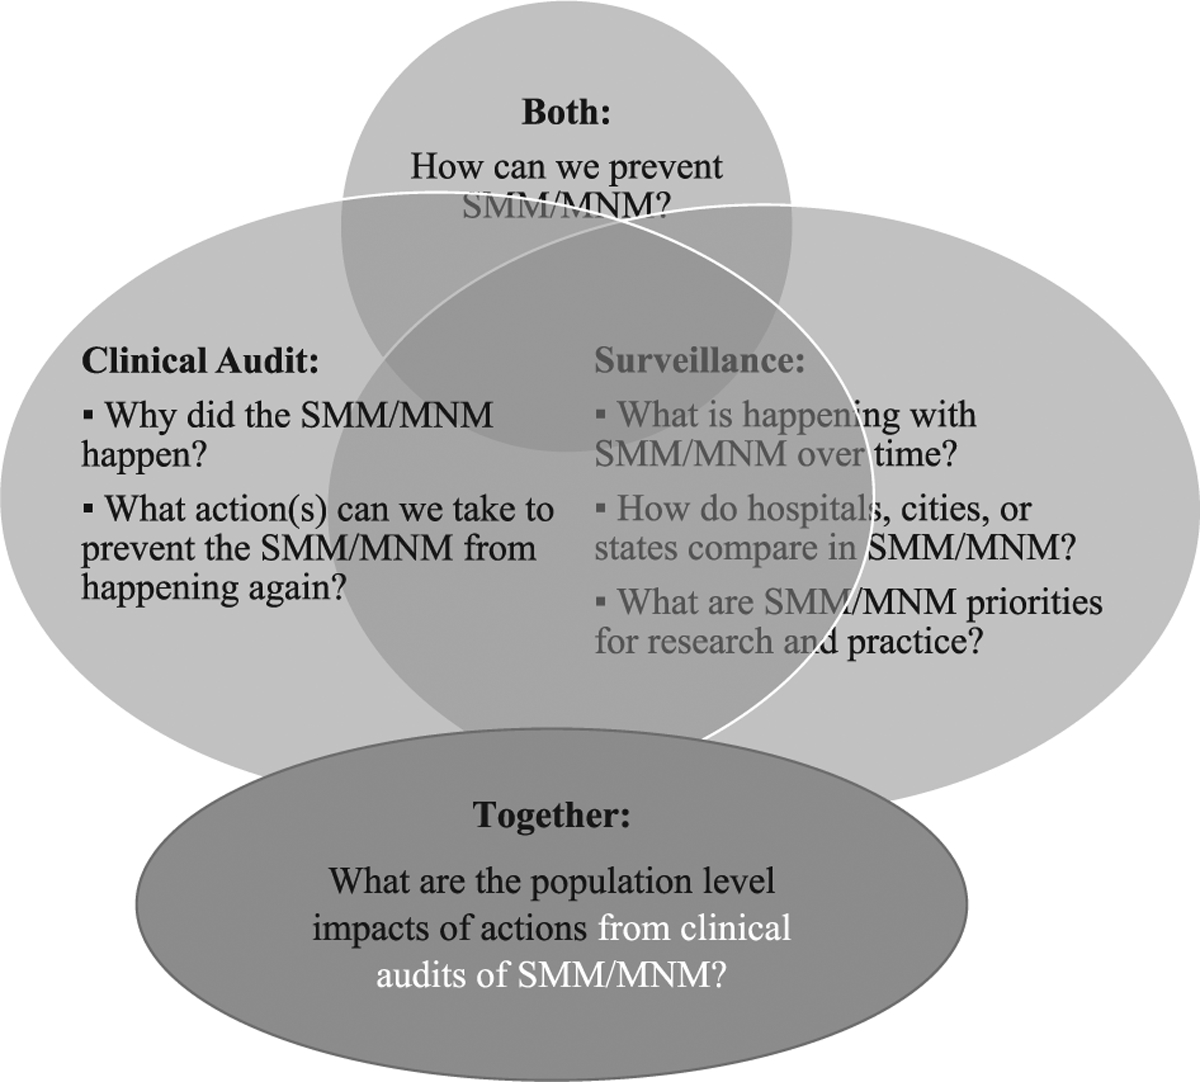
Relationship and practical use of severe maternal morbidity/maternal near miss (SMM/MNM) surveillance and clinical audit.
FIGURE 2.
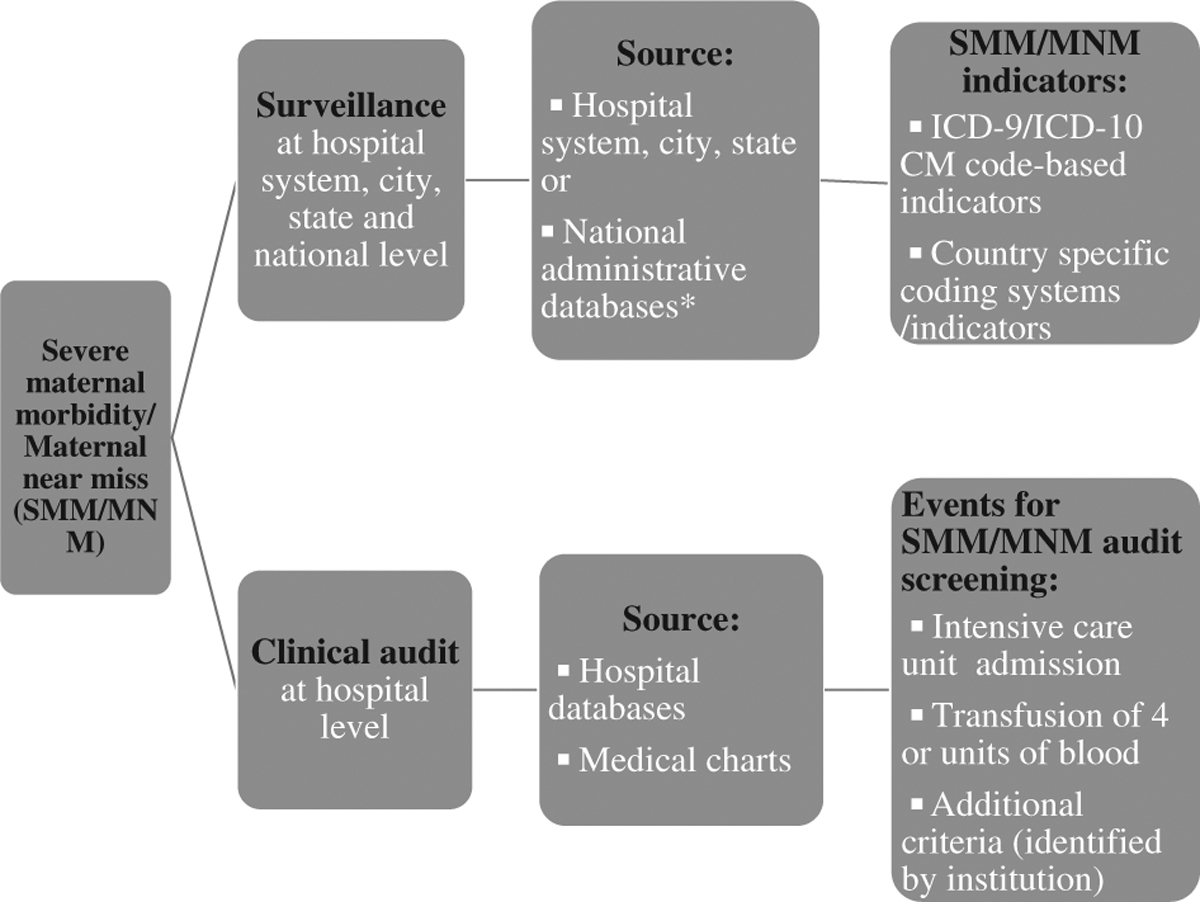
Severe maternal morbidity/maternal near miss (SMM/MNM) surveillance compared with clinical audit.
A retrospective cohort study at a large teaching hospital in California used these proposed ACOG/SMFM criteria to screen all delivery hospitalizations for potential SMM/MNM events.27 To improve case identification, the investigators also added criteria: presence of a SMM/MNM based on ICD-9-CM indicators proposed by the CDC, prolonged length of stay (> 4 d for a vaginal delivery and > 6 d for a cesarean delivery), and hospital readmission within 30 days of discharge. Consensus clinical conditions developed by Main et al24 were used to identify true SMM/MNM cases using medical charts. Of the 16,323 deliveries, 386 (2%) screened positive for SMM/MNM after applying the 5 criteria to hospital medical records. When medical chart review was completed for these 386 deliveries, only 45% were identified as true SMM/MNM events. The lack of specificity for transfusion of 4 or more units of blood in the administrative data led to a large overinclusion of potential SMM/MNM events. In contrast, the ICU admission criteria missed 60% to 70% of true SMM/MNM events. One explanation for why ICU admission data misses identifying many true SMM/MNM events is that these severe acute conditions make transfer to an ICU impossible.13 The over identification of true SMM/MNM events using transfusion of ≥ 4 units of blood, combined with the under identification using ICU admission, suggests that there remains a need to develop a more efficient and effective screening approach for initiating facility-based SMM/MNM audits.
Another current need is for the investigation of SMM/MNM hospitalizations that occur outside of delivery hospitalizations (hospitalizations that occur during pregnancy and/or postpartum periods). Studies on obstetric ICU admissions indicate that the contribution of nondelivery hospitalizations may be substantial, and including these events in clinical audits may expand learning about facility quality improvement opportunities.13,14,28 Some facilities may already be challenged to complete clinical audits for those events that screened positive based on delivery hospitalization criteria. For those facilities, an approach based on the severity and frequency of specific complications could support the development of secondary screening criteria.29 The application of these secondary criteria should produce a smaller set of events, making clinical audits more feasible. In the future, these criteria could be modified to provide measures of both the availability and the utilization of emergent and critical obstetric care; and ideally, quality obstetric care.
Acknowledgments
The findings and conclusions in this report are those of the authors and do not necessarily represent the official position of the Centers for Disease Control and Prevention.
Footnotes
The authors declare that they have nothing to disclose.
References
- 1.Stones W, Lim W, Al-Azzawi F, et al. An investigation of maternal morbidity with identification of life-threatening “near miss” episodes. Health Trends. 1991;23:13–15. [PubMed] [Google Scholar]
- 2.Minkauskiene M, Nadisauskiene R, Padaiga Z, et al. Systematic review on the incidence and prevalence of severe maternal morbidity. Medic-ina Kaunas. 2004;40:299–309. [PubMed] [Google Scholar]
- 3.Pattinson R, Say L, Souza JP, et al. WHO working group on maternal mortality and morbidity classifications. WHO maternal death and near-miss classifications. Bull World Health Organ. 2009;87:734. [DOI] [PMC free article] [PubMed] [Google Scholar]
- 4.World Health Organization (WHO), Department of Reproductive Health and Research. Evaluating the Quality of Care for Severe Pregnancy Complications: The WHO Near-miss Approach for Maternal Health. Geneva: World Health Organization; 2011. [Google Scholar]
- 5.Nelissen E, Mduma E, Broerse J, et al. Applicability of the WHO maternal near miss criteria in a low-resource setting. PLoS One. 2013;8: e61248. [DOI] [PMC free article] [PubMed] [Google Scholar]
- 6.Goldenberg RL, Saleem S, Ali S, et al. Maternal near miss in low-resource areas. Int J Gynaecol Obstet. 2017;138:347–355. [DOI] [PMC free article] [PubMed] [Google Scholar]
- 7.Chinkhumba J, De Allegri M, Muula AS, et al. Maternal and perinatal mortality by place of delivery in sub-Saharan Africa: a meta-analysis of population-based cohort studies. BMC Public Health. 2014;14:1014–1023. [DOI] [PMC free article] [PubMed] [Google Scholar]
- 8.Witteveen T, Bezstarosti H, de Koning I, et al. Validating the WHO maternal near miss tool: comparing high- and low-resource settings. BMC Pregnancy Childbirth. 2017;17:194–203. [DOI] [PMC free article] [PubMed] [Google Scholar]
- 9.Tunçalp O, Hindin MJ, Souza JP, et al. The prevalence of maternal near miss: a systematic review. BJOG. 2012;119:653–661. [DOI] [PubMed] [Google Scholar]
- 10.van den Akker T, Brobbel C, Dekkers OM, et al. Prevalence, indications, risk indicators, and outcomes of emergency peripartum hysterectomy worldwide: a systematic review and meta-analysis. Obstet Gynecol. 2016;128:1281–1294. [DOI] [PubMed] [Google Scholar]
- 11.Jakobsson M, Tapper AM, Colmorn LB, et al. Emergency peripartum hysterectomy: results from the prospective Nordic Obstetric Surveillance Study (NOSS). Acta Obstet Gynecol Scand. 2015;94:745–754. [DOI] [PubMed] [Google Scholar]
- 12.Persad G, Wertheimer A, Emanuel EJ. Principles for allocation of scarce medical interventions. Lancet. 2009;373:423–431. [DOI] [PubMed] [Google Scholar]
- 13.Wanderer JP, Leffert LR, Mhyre JM, et al. Epidemiology of obstetric-related ICU admissions in Maryland: 1999–2008. Crit Car Med. 2013;41:1844–1852. [DOI] [PMC free article] [PubMed] [Google Scholar]
- 14.Oud L. Epidemiology of pregnancy-associated ICU utilization in Texas: 2001–2010. J Clin Med Res. 2017;9:143–153. [DOI] [PMC free article] [PubMed] [Google Scholar]
- 15.Madan I, Puri I, Jain NJ, et al. Characteristics of obstetric intensive care unit admissions in New Jersey. J Matern Fetal Neonatal Med. 2009;22: 785–790. [DOI] [PubMed] [Google Scholar]
- 16.Nair M, Kurinczuk JJ, Knight M. Establishing a national maternal morbidity outcome indicator in England: a population-based study using routine hospital data. PLoS One. 2016;11:e0153370. [DOI] [PMC free article] [PubMed] [Google Scholar]
- 17.Roberts CL, Cameron CA, Bell JC, et al. Measuring maternal morbidity in routinely collected health data. Development and validation of a maternal morbidity outcome indicator. Med Care. 2008;46:786–794. [DOI] [PubMed] [Google Scholar]
- 18.Liu S, Joseph KS, Bartholomew S, et al. Temporal trends and regional variations in severe maternal morbidity in Canada, 2003 to 2007. J Obstet Gynaecol Can. 2010;32:847–855. [DOI] [PubMed] [Google Scholar]
- 19.Cook JL, Majd M, Blake J, et al. Measuring maternal mortality and morbidity in Canada. J Obstet Gynaecol Can. 2017;39:1028–1037. [DOI] [PubMed] [Google Scholar]
- 20.Wahlberg A, Rööst M, Haglund B, et al. Increased risk of severe maternal morbidity (near-miss) among immigrant women in Sweden: a population register-based study. BJOG. 2013;120: 1605–1611. [DOI] [PubMed] [Google Scholar]
- 21.Zwart J, Richters J, Öry F, et al. Severe maternal morbidity during pregnancy, delivery and puerperium in the Netherlands: a nationwide population-based study of 371000 pregnancies. BJOG. 2008;115:842–850. [DOI] [PubMed] [Google Scholar]
- 22.Healthcare Cost and Utilization Project (HCUP). Nationwide Inpatient Sample (NIS) database documentation. Agency for Healthcare Research and Quality, Rockville, MD: 2018. Available at: www.hcup-us.ahrq.gov/db/nation/nis/nisdbdocumentation.jsp. Accessed February 26, 2018. [Google Scholar]
- 23.Callaghan WM, Creanga AA, Kuklina EV. Severe maternal morbidity among delivery and postpartum hospitalizations in the United States. Obstet Gynecol. 2012;120:1029–1036. [DOI] [PubMed] [Google Scholar]
- 24.Main EK, Abreo A, McNulty J, et al. Measuring severe maternal morbidity: validation of potential measures. Am J Obstet Gynecol. 2016;214:643; e1–10. [DOI] [PubMed] [Google Scholar]
- 25.Severe maternal morbidity in the United States. Centers for disease control and prevention, Atlanta, GA: 2018. Available at: www.cdc.gov/reproductivehealth/maternalinfanthealth/severematernalmorbidity.html. Accessed January 1, 2018. [Google Scholar]
- 26.Obstetric Care Consensus No 5 summary: severe maternal morbidity: screening and review. Obstet Gynecol. 2016;128:670–671. [DOI] [PubMed] [Google Scholar]
- 27.Ozimek JA, Eddins RM, Greene N, et al. Opportunities for improvement in care among women with severe maternal morbidity. Am J Obstet Gynecol. 2016;215:509. e1–6. [DOI] [PubMed] [Google Scholar]
- 28.Farr A, Lenz-Gebhart A, Einig S, et al. Outcomes and trends of peripartum maternal admission to the intensive care unit. Wien Klin Wochenschr. 2017;129:605–611. [DOI] [PMC free article] [PubMed] [Google Scholar]
- 29.Thornton RH, Miransky J, Killen AR, et al. Analysis and prioritization of near-miss adverse events in a radiology department. AJR Am J Roentgenol. 2011;196:1120–1124. [DOI] [PubMed] [Google Scholar]