
Figure 1. Risk of Adverse Cardiovascular Outcomes in Heart Failure-Stratified by Race and NT-proBNP Levels.
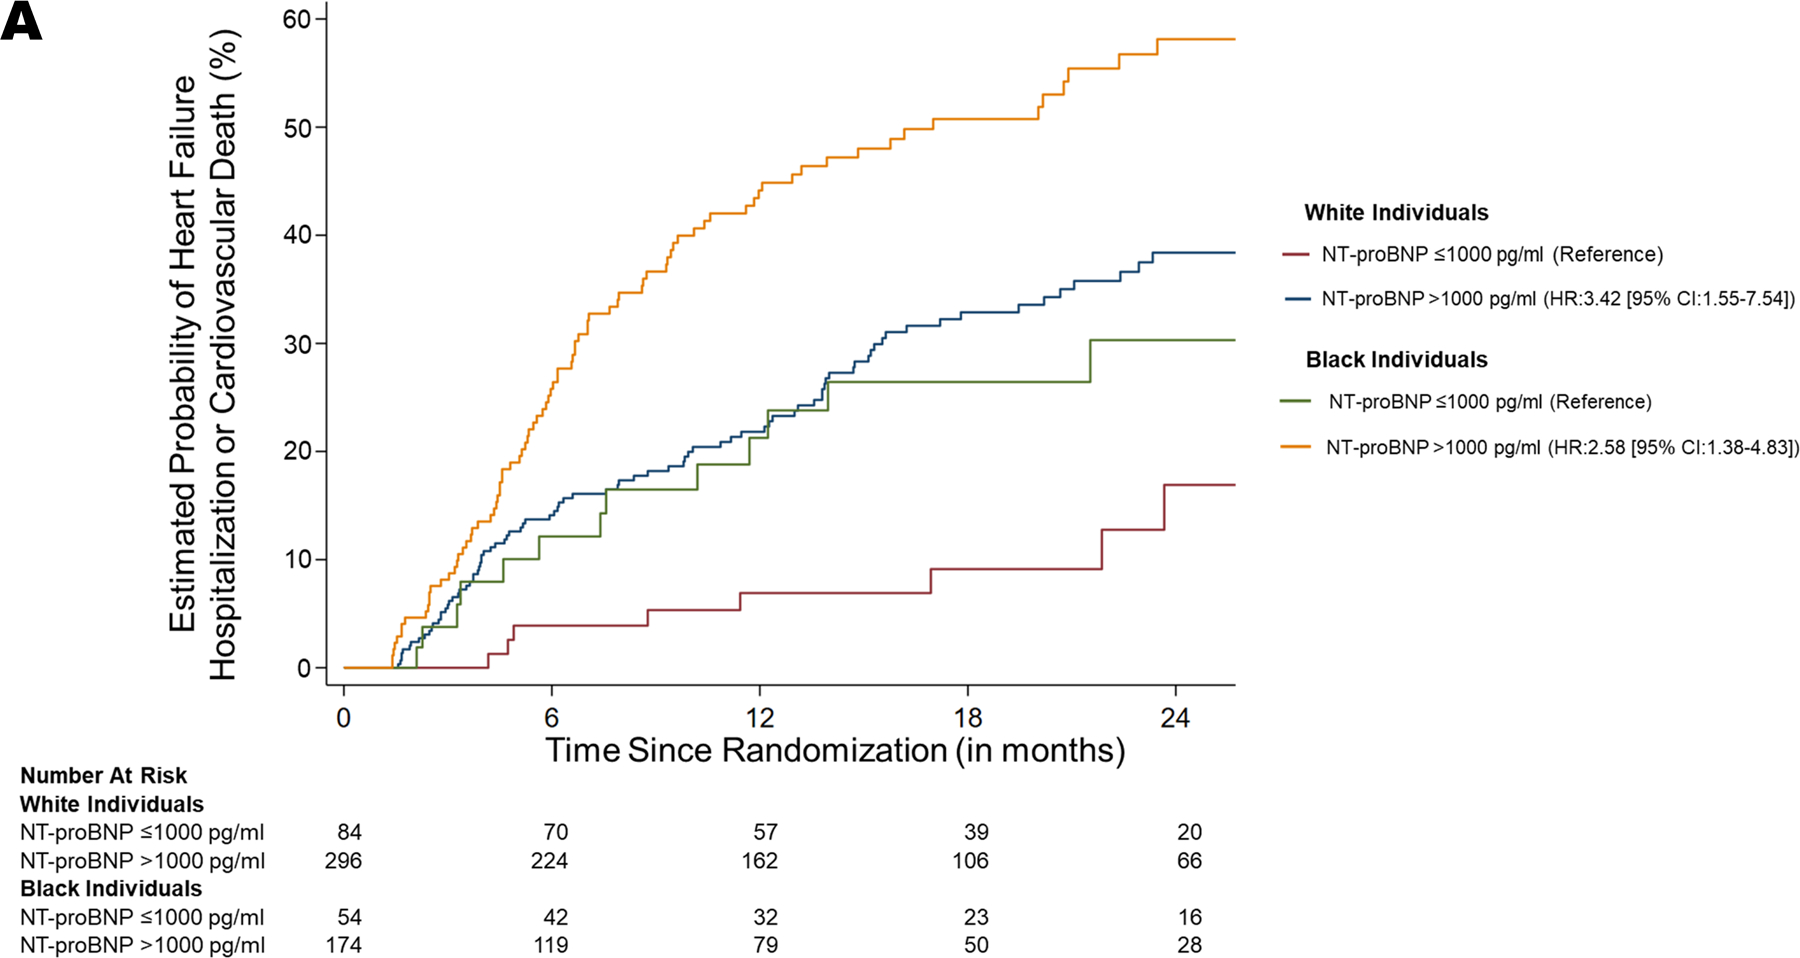
A. Risk of Heart Failure Hospitalization or Cardiovascular Death
Kaplan Meier curves depicting the probability of heart failure hospitalization or death due to cardiovascular causes, stratified by race, and NT-proBNP levels achieved. The curves in red (NT-proBNP ≤1000 pg/mL) and blue (NT-proBNP >1000 pg/mL) represents White patients. The curves in green (NT-proBNP ≤1000 pg/mL) and yellow (NT-proBNP >1000 pg/mL) represents Black patients.
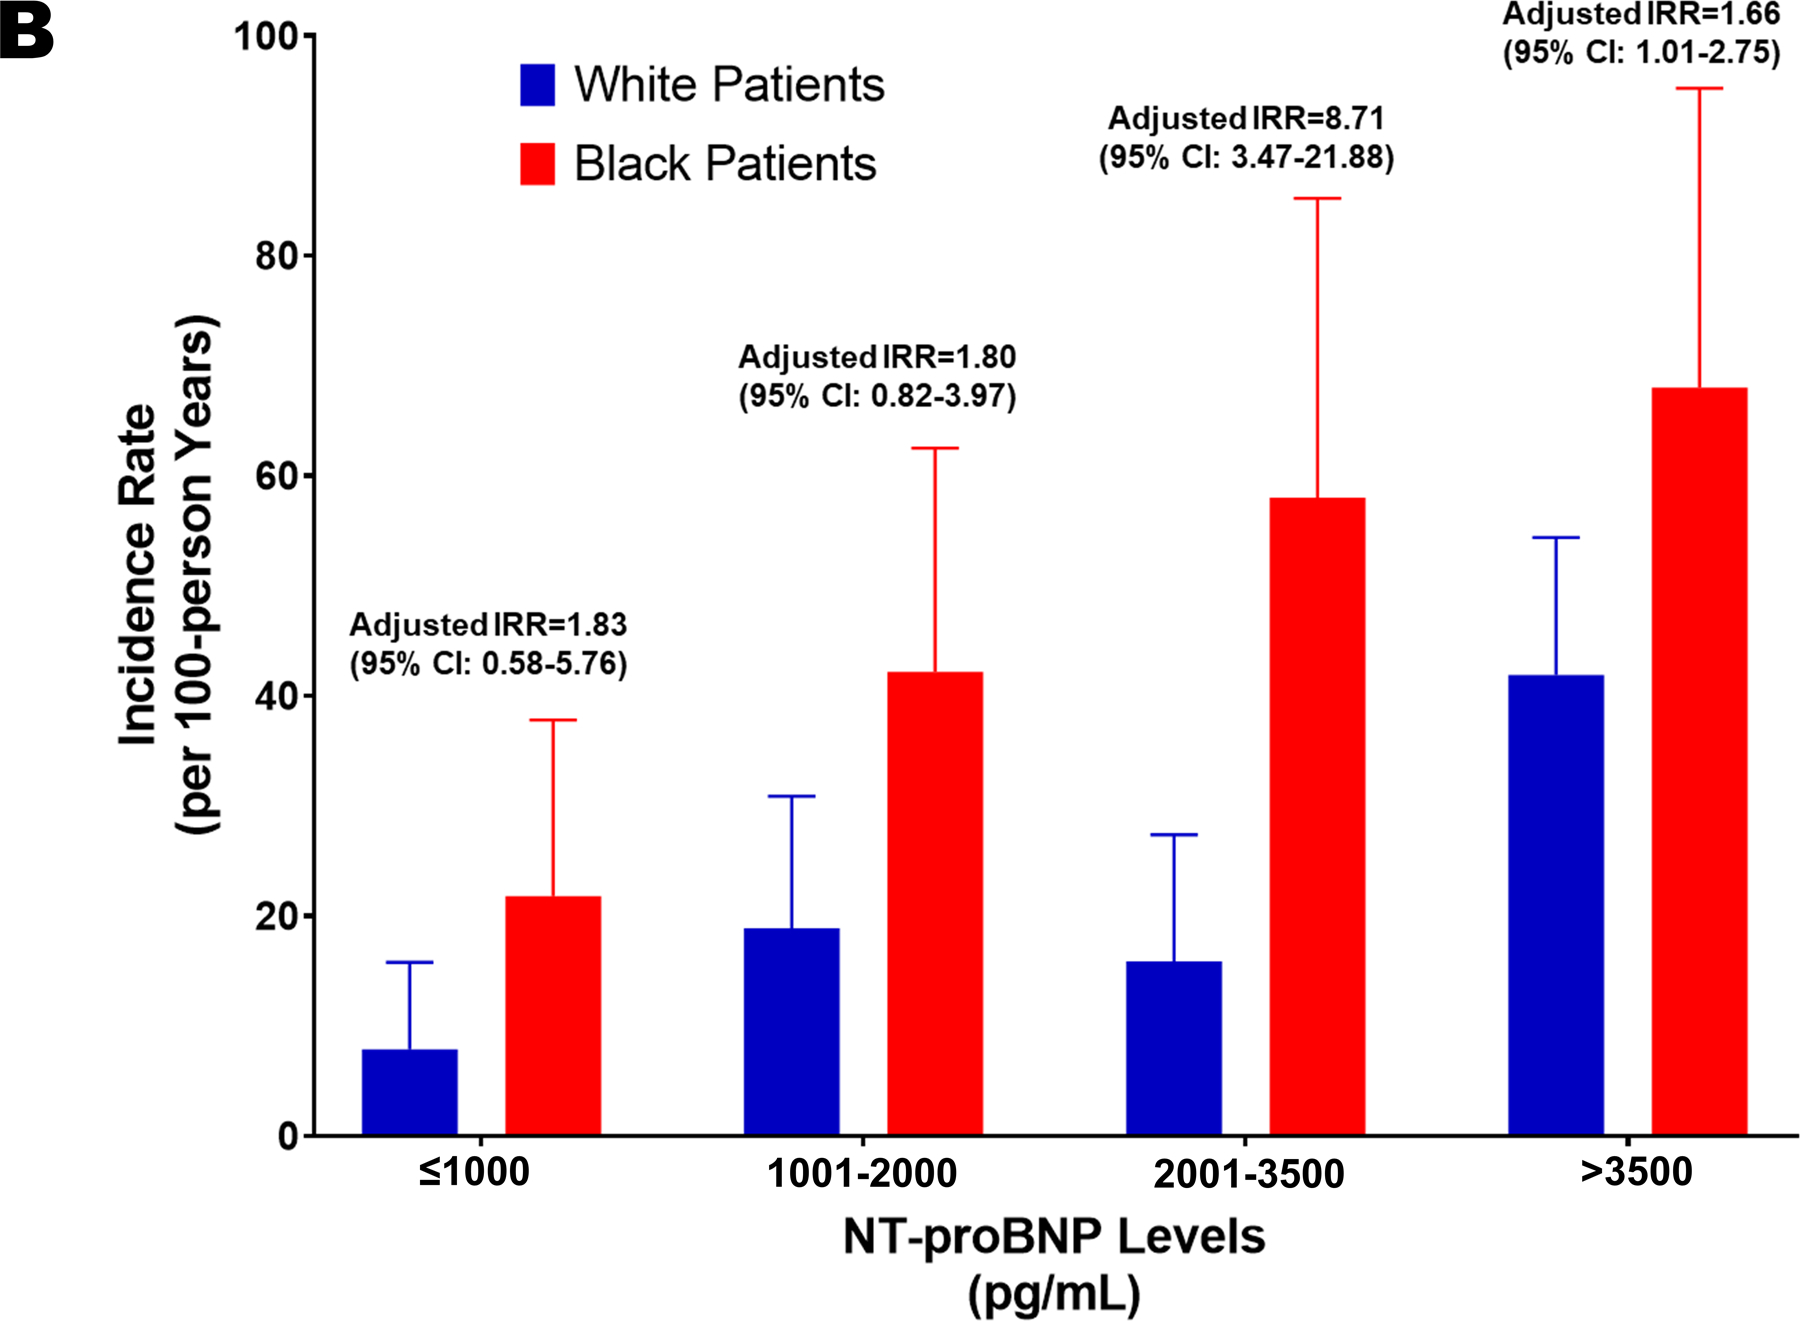
B. Rates of Heart Failure Hospitalization or Cardiovascular Death Across NT-proBNP Level Categories at 6-weeks
The bars in blue represent White patients, and the bars in red represent the Black patients. The error bars represent 95% CI. IRR: Incidence Rate Ratio.