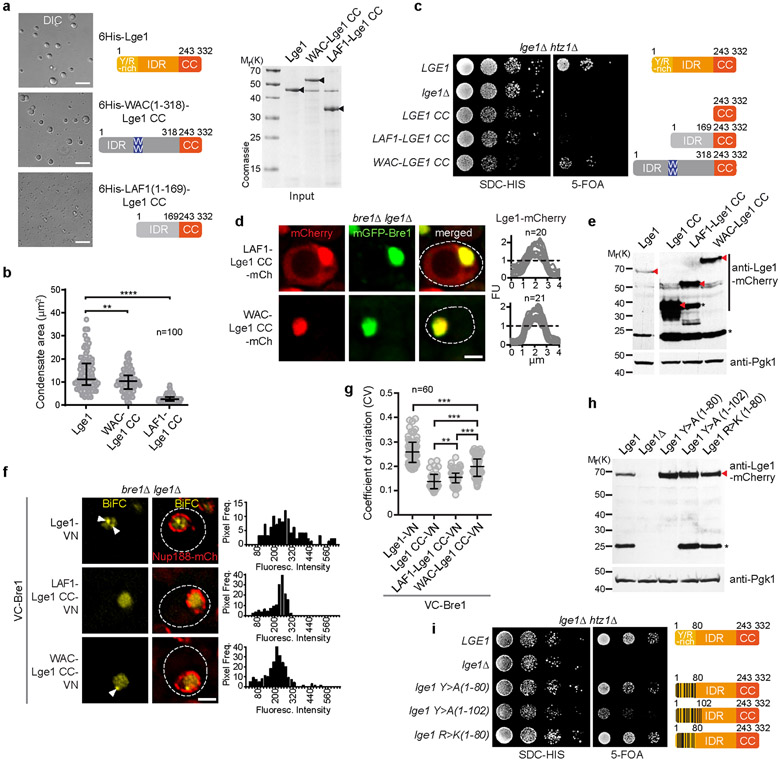
Extended Data Figure 10. Specific features of yeast Lge1 and human WAC contribute to H2BK123ub and cell viability.
a. The WAC and LAF1 IDRs promote LLPS. Phase-separation assay of recombinant 6His-Lge1 and the fusion constructs 6His-WAC(1-318)-Lge1 CC and 6His-LAF1(1-169)-Lge1 CC (both proteins 5 μM; buffer 20 mM Tris pH 7.5, 100 mM NaCl, 1 mM DTT, 20 °C). Scale bar, 10 μm. Protein inputs are shown on the right (black arrows), b. Quantification of condensate sizes (μm2) in a. n = number of condensates. Dot plot showing median and interquartile range. **p-value = 0.004, ****p-value < 0.0001 determined by two-sided Mann-Whitney test. c. A synthetic genetic approach was used to interrogate the functionality of Lge1 LLPS in vivo. Cells were inviable when LGE1 and HTZ1 were deleted, indicating a functional relationship. Double deletion strains harboring a wild-type LGE1 cover plasmid (URA marker) were co-transformed with the indicated plasmids (HIS marker). Growth was followed on SDC-HIS (loading control) and on SDC+5-fluoroorotic acid (5-FOA), which shuffles out the URA cover plasmid. Cells were spotted in 10-fold serial dilutions and incubated for two (SDC-HIS) or three days (5-FOA) at 30 °C. d. Live imaging of bre1Δ lge1Δ cells expressing mGFP-Bre1 and WAC(1-318)-Lge1 CC-mCherry or LAF1(1-169)-Lge1 CC-mCherry shows protein import into the nucleus. Dashed white line indicates the cell contour. Fluorescence intensity of mCherry construct was quantified across a line spanning the nucleus. For comparison, the FU value = 1 is marked with a horizontal dashed line, n = number of cells. FU, arbitrary fluorescence units. Scale bar, 2 μm. e. Cell lysates of strains in c and d were analyzed by SDS-PAGE and immunoblotting with anti-mCherry antibody. Anti-Pgk1 serves as a loading control, asterisks indicate degradation products. Red arrowheads indicate Lge1 constructs according to their predicted sizes, f. Live imaging of bre1Δ lge1Δcells expressing VC-Bre1 and WAC (1-318)- Lge1 CC-VN or LAF1(1-169)- Lge1 CC-VN constructs from LGE1 endogenous promoter. Arrowheads label nuclear BiFC puncta, Nup188-mCherry the nuclear envelope, dashed lines the cell contours. Histograms represent pixel frequency of fluorescent intensity values. Scale bar, 2 μm. g. Coefficient of variation (CV) of the fluorescence intensity distribution of BiFC signals in f and Fig. 3e. The higher the CV, the greater the heterogeneity of the BiFC signal. A propensity for LLPS is suggested by an increased CV of the WAC (1-318)- Lge1 CC-VN construct. Dot plot showing median and interquartile range.n= number of cells. **p-value = 0.0024, ***p-value < 0.001 determined by two-sided Mann-Whitney test. h. Expression levels of Lge1-mCherry constructs used in i. Cells lysates were analyzed by SDS-PAGE and immunoblotting with anti-mCherry antibody. Anti-Pgk1 serves as a loading control. Asterisk indicates degradation products. Red arrowhead indicates Lge1 constructs, i. Genetic interaction analysis, set up as in c with the indicated plasmids. See SF2 for uncropped gels and western blots.

