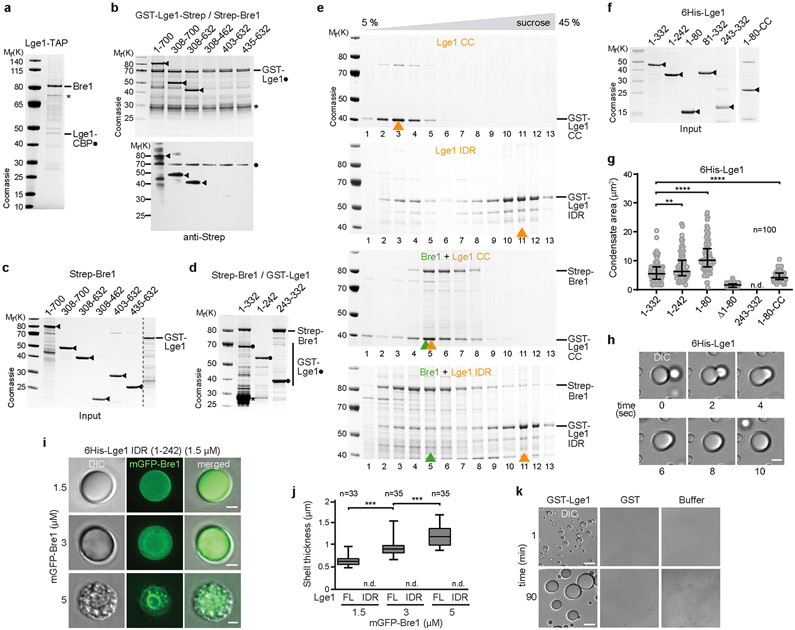
Extended Data Figure 1. Lge1 interaction with Bre1 and LLPS.
a. Bre1 co-purifies with Lge1. Lge1-TAP was tandem affinity-purified from yeast. Bre1 and Lge1-CBP were confirmed by mass spectrometry. Asterisk indicates a Bre1 degradation product. b. Bre1 interacts with Lge1 in vitro. Binding assay using recombinant GST-Lge1-Strep as bait (black dot) with Strep-Bre1 constructs (arrowheads) (1:3 molar ratio). Proteins were analyzed by Coomassie staining and anti-Strep immunoblotting. Input proteins are shown in c. d. Same setup as in b. Black dots indicate immobilized Lge1 constructs, asterisk a degradation product. e. Sucrose gradient sedimentation assays (5 %−45 %) of recombinant Strep-Bre1 and GST-Lge1 proteins. Main peak fractions are highlighted (arrowheads). f. Input protein for 6His-Lge1 constructs used in phase separation assays. g. Quantification of condensate sizes in Fig. 1c. n = number of condensates. Dot plots with median and interquartile range. **p-value = 0.0189, ****p-value < 0.0001 determined by two-sided Mann-Whitney test. n.d., not determinable. h. Analysis of condensate growth using DIC imaging (6His-Lge1; 5 μM). Scale bar, 2 μm. See also Video S1. i. Increasing amounts of mGFP-Bre1 were added to preformed 6His-Lge1 IDR condensates, lacking Lge1 CC. Note that the unrestricted diffusion of Bre1 (5 μM) into Lge1 IDR condensates caused their interior to collapse into coarse aggregates. Scale bar, 2 μm. j. Quantification of mGFP-Bre1 shell thickness in Fig. 1d and Extended Fig. 1i. Box-whisker plot shows median, interquartile range, minimum and maximum values. ***p-value < 0.001 determined with two-sided T-test (1.5 μm-3 μm: t= 7.6, df= 67; 3 μm-5 μm: t=14, df=69). n = number of condensates. n.d., not determinable. k. GST-Lge1 used in Fig. 1b phase separates in vitro. Recombinant GST-Lge1 (7 μM), GST (7 μM) and buffer only (20 mM Tris pH 7.5, 10 mM KCl, 5 mM MgCl2) were visualized by DIC microscopy at 20 °C for the indicated times (min). Scale bar, 10 μm. See SF2 for uncropped gels and western blots.

