

Abstract
Purpose:
“Lock-in” programs (LIPs) are used by health insurers to address potential substance (e.g., opioid) misuse among beneficiaries. We sought to (1) examine heterogeneity in trajectories of dispensed opioids (in terms of average daily morphine milligram equivalents (MMEs)) over time: prior to, during, and following release from a LIP; and (2) assess associations between trajectory patterns and beneficiary characteristics.
Methods:
Medicaid claims were linked to Prescription Drug Monitoring Program records for a cohort of beneficiaries enrolled in the North Carolina Medicaid LIP (n=2,701). Using latent class growth analyses, we estimated trajectories of average daily MMEs of opioids dispensed to beneficiaries across specific time periods of interest.
Results:
Five trajectory patterns appeared to sufficiently describe underlying heterogeneity. Starting values and slopes varied across the five trajectory groups, which followed these overall patterns: (1) start at a high level of MMEs, end at a high level of MMEs (13.1% of cohort); (2) start medium, end medium (13.2%); (3) start medium, end low (21.5%); (4) start low, end medium (22.6%); and (5) start low, end low (29.6%). We observed strong associations between patterns and beneficiaries’ demographics, substance use-related characteristics, comorbid conditions, and healthcare utilization.
Conclusions:
In its current form, the Medicaid “lock-in” program (LIP) appeared to have limited impact on beneficiaries’ opioid trajectories. However, strong associations between trajectory patterns and beneficiary characteristics provide insight into potential LIP design modifications that might improve program impact (e.g., LIP integration of substance use disorder assessment and referral to treatment, assessment and support for alternate pain therapies).
Keywords: controlled substance, latent class, lock-in, Medicaid, opioid, trajectory
Introduction
More than half a million people lost their lives to a drug overdose in the United States between 2000 and 2015, as opioid overdose death rates more than tripled.1 In response to these rapidly escalating rates, numerous policies and programs have been implemented.2 Health insurance sector strategies have included prior authorizations, maximum quantity limits per prescription, formulary controls, letters to high prescribing physicians, and beneficiary “lock-in” programs (LIPs).3 LIPs are increasingly used across the country by various health plans with the goal of identifying beneficiaries demonstrating potential overutilization of prescription drugs and controlling their access.4,5 LIPs typically require beneficiaries to use a single prescriber and/or pharmacy to obtain opioids and other specific prescription drugs (e.g., benzodiazepines) for a specified period of time, such as one year.
We previously reported that North Carolina’s (NC) Medicaid LIP was associated with reductions in numbers of controlled substance prescriptions, including opioids, dispensed per person per month both while enrolled in the LIP and following release from the program, as compared to a period prior to lock-in.6 However, average dosages of opioids dispensed (in terms of average daily morphine milligram equivalents (MMEs)) to beneficiaries were elevated during LIP enrollment and in the period soon after release from the program.
While understanding the average impact of the program across the LIP-enrolled population is important, this approach can also mask heterogeneous patterns of LIP response. Indeed, prior research indicates that trajectories of substance use vary markedly across populations.7–12 Analyzing variation in opioid dispensing patterns across the LIP-enrolled population can help us better understand who responds to LIPs, and in turn help more effectively target limited program resources. In this study, we (1) described heterogeneity in trajectories of dispensed average daily MMEs in a LIP-enrolled beneficiary population, and (2) examined beneficiary characteristics associated with trajectory patterns.
Methods
We analyzed Medicaid claims linked to Prescription Drug Monitoring Program (PDMP) records for a cohort of beneficiaries enrolled in the NC Medicaid LIP between October 2010 and September 2012 (n= 2,701). Using latent class growth analyses (LCGA)13, we estimated trajectories of average daily MMEs of opioids dispensed across months prior to, during, and after release from the LIP. We then examined associations between trajectory patterns and beneficiary characteristics.
Data Sources
As previously described,6,14 data included NC Medicaid claims linked to records from the NC Controlled Substance Reporting System (CSRS), NC’s PDMP. Data were deterministically linked for those enrolled in the LIP during the first two years of its operation through a Centers for Disease Control and Prevention grant supporting the intensive linkage.14 NC Medicaid data included beneficiaries’ demographic characteristics, periods of Medicaid enrollment, adjudicated pharmacy and medical claims, and assigned LIP enrollment and release dates. NC CSRS records included data on all controlled substances (schedules II-V) dispensed to LIP beneficiaries, regardless of source of payment (e.g., Medicaid-reimbursed, out-of-pocket). Specific CSRS prescription-related data elements included National Drug Code, days’ supply, quantity received, date dispensed, and identifiers for prescribers and pharmacies.
This study was approved by the University of North Carolina at Chapel Hill’s Institutional Review Board.
NC Medicaid LIP
The NC Medicaid LIP originated in October 2010.15 Medicaid beneficiaries were eligible for the LIP if they met any of the following criteria within two consecutive calendar months: (1) filling more than six opioid prescriptions, (2) filling more than six benzodiazepine prescriptions, or (3) filling opioid or benzodiazepine prescriptions that were written by more than three different prescribers.15 Each month a vendor, working with the state, determined who was eligible for the LIP by examining Medicaid prescription dispensing information for the previous two months. The vendor then prioritized eligible beneficiaries using a proprietary algorithm combined with a review by pharmacists. Beneficiaries in hospice care, with cancer, in a skilled nursing facility, dually eligible for Medicaid and Medicare, or <18 years were generally not considered for LIP enrollment. Based on the prioritization process, approximately 200 of the highest ranking beneficiaries were recommended to the state for LIP enrollment each month. Once approved, the approximately 200 beneficiaries were notified of their selection for mandatory program enrollment and were informed that LIP enrollment restricted them, for a one-year period, to using one prescriber and one pharmacy location to obtain opioid and benzodiazepine prescriptions. Beneficiaries were given 30 days to select a preferred prescriber and pharmacy before restrictions began; those who did not were assigned one of each.
Study Cohort
We established and followed a historical cohort of adults between the ages of 18 and 64 years who were initially enrolled in the LIP between October 2010 and September 2012. Beneficiaries in our cohort were followed from the first day that they received an opioid prescription on or after October 1, 2009 (the first date for which we had data), throughout their period of lock-in, and up to one year post-program release or until June 30, 2013 (the last date for which we had data). Because we were particularly interested in understanding different trajectory paths during and after lock-in, we required cohort beneficiaries to have either remained continuously enrolled in the LIP (and therefore also Medicaid) for their assigned one-year LIP period or to have remained continuously enrolled in the LIP through June 2013, the last month for which we had data (i.e., administrative censoring). We defined continuous enrollment as no more than a 7-day gap in Medicaid coverage. Less than 1% of beneficiaries enrolled in the LIP were enrolled for longer than a year; they were not included in this study.
Measures
Outcome Measure
We examined trajectories of average daily MMEs of dispensed opioids. Average daily MME is a research measure used to compare diverse opioid medication regimens using morphine equivalents as a standardized unit.16 To calculate the average daily MME of a given opioid prescription, we multiplied the drug’s strength by the quantity received and a medication-specific MME conversion factor and divided by the days’ supply received.17 The average daily MME for each prescription was then applied to all days for which the prescription was to be taken, according to the days’ supply. If a beneficiary had more than one opioid prescription active on a given day, the MMEs for all prescriptions to be taken on that day were summed. We included MMEs from all sources of payment. Prescriptions for medication-assisted treatment (MAT) for opioid use disorders were not included. For modeling purposes, we averaged each beneficiary’s average daily MMEs across each calendar month. This monthly average measure was then log transformed to obtain an approximately normal distribution for improved model estimation.11
Covariate Measures
Covariates included demographics, substance use-related characteristics, comorbid conditions, and overall healthcare utilization.6 Demographic characteristics were assessed at the time of LIP enrollment and included age, gender, race, urbanicity of the beneficiary’s county of residence, and Medicaid eligibility category (e.g., qualified based on disability, as a parent of a dependent child). Substance-use related characteristics, comorbid conditions, and healthcare utilization were assessed using a one-year lookback period from the date of LIP enrollment and included history of alcohol or other substance use-related disorders, history of MAT, history of an overdose, number of unique pharmacies visited, number of emergency department visits, number of inpatient admissions, history of specific pain-related diagnoses (e.g., arthritis, back), history of specific mental health-related diagnoses (e.g., depression, anxiety), and Charlson comorbidity index. Specific information on claims-related codes used to define characteristics have been previously documented and is available in the online appendix.6
Analysis
Overview of Statistical Models
We used an application of finite mixture modeling, LCGA, to estimate trajectories of average daily MMEs of opioids dispensed to beneficiaries across specific time periods of interest (prior to lock-in, during lock-in, and following release from lock-in). LCGA models identify clusters of individuals that follow approximately the same trajectory for an outcome of interest and can be used as a tool for approximating a complex, unknown distribution of trajectories across the larger population.13,18,19
As a preliminary step, it was necessary to determine how to model the functional form of change in average daily MMEs dispensed over time. We considered and evaluated several model functional forms, using an unconditional LCGA model. We determined that a five piece, linear piecewise specification (i.e., a model with five linear pieces joined by four knots) provided the best fit. Knots (i.e., points at which slopes were permitted to change) were placed at natural and observed change points, including at the first month of lock-in and at the first month of program release. Additionally, extensive previous analyses revealed a specific spike period with a sharp rise in dispensed opioid prescriptions (and corresponding MMEs), beginning approximately six months prior to lock-in.6 The spike generally peaked three months prior to enrollment with a decline thereafter; therefore, knots were also placed at three and six months prior to lock-in. The spike period appeared to represent the trigger for LIP enrollment for many of these beneficiaries. The large spike is likely due to the fact that the cohort included those who were selected into the LIP (and therefore, were the highest users of prescribed opioids at a specific point in time). The de-escalation period is then regarded as a subsequent regression to the mean.
We then conducted a series of analyses to determine how many discrete classes were needed to adequately summarize heterogeneity in growth trajectories. We evaluated one through eight class solutions. Full details on the model selection process and criteria used to determine the number of meaningful trajectory classes can be found in the online appendix. All models were fit in Mplus, version 7.4.
Covariate Associations with Trajectory Classes
LCGA models produce probabilities of belonging to each trajectory class for each beneficiary. Using these posterior probabilities, we estimated the prevalence of beneficiary characteristics within each trajectory class. For each class, we calculated weighted (i.e., weights were posterior probabilities) counts and percentages for categorical covariates and means (with corresponding 25th, 50th, and 75th percentiles) for continuous covariates.
To provide a clearer depiction of covariate relationships with latent classes, we also calculated and graphed standardized differences using the largest class as the reference class. Standardized differences provide a measure of the similarity or dissimilarity of two groups with respect to specific covariates Additional details on these calculations can be found in the online appendix. All analyses of covariate associations with trajectory class were completed in SAS 9.4.
Results
Between October 2010 and September 2012, 2,701 beneficiaries were enrolled in the LIP and remained enrolled in the LIP for a full one-year period (or remained continuously enrolled prior to being administratively censored in June 2013). Beneficiaries were largely female (70%), white (74%), and had a mean age of 39 years (Table 1). Nearly one-third (32.2%) had a substance use disorder diagnosis in the year prior to LIP enrollment, and beneficiaries had on average 10 emergency department visits in the prior year, although the distribution was skewed (mean= 9.9; median= 6). Beneficiaries also exhibited a high prevalence of pain and mental health-related diagnoses (e.g., 83% back pain diagnosis; 62% depression diagnosis) in the year prior to program enrollment.
TABLE 1.
Characteristics of cohort of beneficiaries enrolled in the North Carolina Medicaid “lock-in” program, October 2009-June 2013, and by latent class of log average daily morphine milligram equivalents (MMEs) of dispensed opioid trajectories
| Total Cohort (n=2,701) |
Start high, end high (C1) (n=353.0; 13.1%)† |
Start medium, end medium (C2) (n=357.6; 13.2%)† |
Start medium, end low (C3) (n=581.3; 21.5%)† |
Start low, end medium (C4) (n=609.4; 22.6%)† |
Start low, end low (C5) (n=799.8; 29.6%)† |
|
|---|---|---|---|---|---|---|
| N (%) for categorical variables; Mean (25th pct, median, 75th pct) for continuous variables | ||||||
| DEMOGRAPHICS ‡ | ||||||
| Age (years) | 38.7 (30, 38, 47) | 43.6 (37, 44, 52) | 43.6 (36, 44, 51) | 39.5 (31, 39, 47) | 38.6 (31, 38, 46) | 33.9 (27, 32, 40) |
| Gender | ||||||
| Women | 1,896 (70.2) | 216.2 (61.3) | 233.3 (65.3) | 386.9 (66.6) | 446.3 (73.2) | 613.3 (76.7) |
| Men | 805 (29.8) | 136.8 (38.8) | 124.2 (34.7) | 194.4 (33.4) | 163.1 (26.8) | 186.5 (23.3) |
| Race | ||||||
| White | 1,999 (74.0) | 268.0 (75.9) | 246.4 (68.9) | 424.8 (73.1) | 433.4 (71.1) | 626.4 (78.3) |
| Black | 550 (20.4) | 66.9 (19.0) | 86.3 (24.1) | 116.6 (20.1) | 133.6 (21.9) | 146.5 (18.3) |
| Other | 152 (5.6) | 18.0 (5.1) | 24.9 (7.0) | 39.9 (6.9) | 42.3 (7.0) | 26.9 (3.4) |
| Urbanicity of county of residence | ||||||
| Counties in metro areas of ≥ 1 mill. pop. | 675 (25.0) | 65.9 (18.7) | 86.1 (24.1) | 137.5 (23.7) | 161.4 (26.5) | 224.1 (28.0) |
| Counties in metro areas of < 1 mill. pop. | 1,268 (47.0) | 180.8 (51.3) | 162.3 (45.4) | 269.7 (46.4) | 276.9 (45.4) | 378.3 (47.3) |
| Nonmetro, urban pop. of ≥ 20,000 | 444 (16.4) | 54.2 (15.4) | 73.3 (20.5) | 102.8 (17.7) | 111.7 (18.3) | 102.0 (12.8) |
| Nonmetro, urban pop. of <20,000 or rural pop. | 314 (11.6) | 51.9 (14.7) | 35.9 (10.1) | 71.4 (12.3) | 59.3 (9.7) | 95.4 (11.9) |
| Medicaid eligibility category | ||||||
| Aid to families with dependent children | 1,389 (51.4) | 119.4 (33.8) | 135.5 (37.9) | 267.0 (45.9) | 347.9 (57.1) | 519.2 (64.9) |
| Aid to disabled | 1,282 (47.5) | 232.5 (65.9) | 219.0 (61.3) | 311.2 (53.5) | 259.6 (42.6) | 259.7 (32.5) |
| Aid for other reasons (e.g., aid to blind) | 30 (1.1) | 1 (0.3) | 3.0 (0.8) | 3.2 (0.6) | 1.9 (0.3) | 20.9 (2.6) |
| SUBSTANCE USE-RELATED§ | ||||||
| Alcohol-related disorder | 174 (6.4) | 18.5 (5.3) | 30.8 (8.6) | 38.4 (6.6) | 35.0 (5.7) | 51.2 (6.4) |
| Other substance-related disorder | 870 (32.2) | 110.3 (31.2) | 82.7 (23.1) | 214.7 (36.9) | 171.9 (28.2) | 290.4 (36.3) |
| Medication-assisted treatment (MAT) | 273 (10.1) | 7.5 (2.1) | 4.1 (1.1) | 43.8 (7.5) | 37.7 (6.2) | 180.0 (22.5) |
| Medication or drug-related overdose | 193 (7.2) | 29.8 (8.4) | 23.1 (6.5) | 58.2 (10.0) | 33.0 (5.4) | 49.0 (6.1) |
| HEALTH CARE UTILIZATION § | ||||||
| Number of unique pharmacies from which Medicaid-reimbursed prescriptions were obtained |
4.2 (2, 4, 6) | 3.7 (2, 3, 5) | 4.0 (2, 4, 5) | 4.4 (3, 4, 6) | 4.3 (3, 4, 6) | 4.2 (3, 4, 5) |
| Emergency department visits | 9.9 (3, 6, 13) | 5.5 (1, 3, 7) | 9.4 (2, 5, 12) | 10.8 (3, 7, 14) | 10.3 (3, 7, 13) | 11.3 (4, 8, 14) |
| Inpatient admissions | 1.3 (0, 1, 2) | 1.6 (0, 1, 2) | 1.5 (0, 1, 2) | 1.6 (0, 1, 2) | 1.2 (0, 1, 2) | 1.0 (0, 1, 1) |
| PAIN-RELATED DIAGNOSES § | ||||||
| Any joint pain or arthritis | 2,452 (90.8) | 325.4 (92.2) | 338.9 (94.8) | 549.3 (94.5) | 571.7 (93.8) | 666.7 (83.4) |
| Back pain | 2,253 (83.4) | 308.4 (87.4) | 309.0 (86.4) | 504.3 (86.8) | 535.0 (87.8) | 596.3 (74.6) |
| Neck pain | 1,124 (41.6) | 141.4 (40.1) | 165.4 (46.3) | 252.9 (43.5) | 277.3 (45.5) | 287.1 (35.9) |
| Headache/migraine pain | 589 (21.8) | 63.3 (17.9) | 80.1 (22.4) | 131.6 (22.6) | 146.5 (24.0) | 167.5 (21.0) |
| Fibromyalgia, chronic pain, or fatigue | 1,443 (53.4) | 261.1 (74.0) | 230.8 (64.5) | 363.1 (62.5) | 353.5 (58.0) | 234.6 (29.3) |
| Rheumatoid arthritis or osteoarthritis | 706 (26.1) | 144.5 (41.0) | 139.0 (38.9) | 168.0 (28.9) | 160.0 (26.3) | 94.4 (11.8) |
| Sickle cell | 50 (1.9) | 17.3 (4.9) | 9.8 (2.7) | 11.7 (2.0) | 10.0 (1.6) | 1.2 (0.2) |
| MENTAL HEALTH-RELATED DIAGNOSES § | ||||||
| Depression | 1,675 (62.0) | 193.6 (54.9) | 221.6 (62.0) | 364.0 (62.6) | 388.0 (63.7) | 508.8 (63.5) |
| Anxiety disorder | 1,184 (43.8) | 123.2 (34.9) | 136.6 (38.2) | 288.6 (49.6) | 275.7 (45.2) | 360.0 (45.0) |
| Other serious mental health disorder (e.g., bipolar, schizophrenia) | 751 (27.8) | 59.5 (16.9) | 71.6 (20.0) | 189.1 (32.5) | 172.9 (28.4) | 257.9 (32.3) |
| COMORBID CONDITION INDEX§ | ||||||
| Mean Charlson comorbidity index | 0.92 (0, 0, 1) | 1.31 (0, 1, 2) | 1.20 (0, 1, 2) | 0.98 (0, 0, 1) | 0.93 (0, 0, 1) | 0.57 (0, 0, 1) |
pct= percentile; C= class
Counts, percentages, and means are weighted by beneficiaries’ posterior probabilities for belonging to a given class
Assessed at the time of “lock-in” program enrollment
Assessed using a one-year lookback period from the date of “lock-in” program enrollment
Trajectories
We used several model fit criteria to determine the ideal number of latent classes to describe heterogeneity in trajectories of MMEs of dispensed opioids (see online appendix for details). The five class solution was ultimately selected as the best solution. The final model had high entropy (0.97) with most beneficiaries having a very high probability of belonging to one specific class and low probabilities of belonging to others (Table A3, online appendix).
All five trajectories demonstrated a large spike in average daily MMEs of opioids dispensed during the six months prior to LIP enrollment (Figure 1). As described above, this escalation period is assumed to be the primary trigger for LIP enrollment. We characterize the five trajectory classes (C) according to their MME levels prior to the spike and following LIP release as follows:
FIGURE 1.

Trajectories† of log of average daily morphine milligram equivalents (MME) of opioids dispensed to beneficiaries enrolled in the North Carolina Medicaid “lock-in” program per month, October 2009-June 2013 (n=2,701)
† Estimated means from five class, five-piece linear piecewise latent class growth analysis model C=Class. Percentages are latent class proportions based on posterior probabilities. Grey vertical lines indicate where knots were placed in the piecewise model. Pre-spike period= more than 6 months prior to “lock-in” program enrollment; Spike period= 0–6 months prior to “lock-in” program enrollment; “Lock-in” program period= 12-month enrollment period; Post-release period= 12 months after disenrollment from the “lock-in” program
C1) start high (approx. >90 avg. daily MMEs), end high (13.1% of the cohort),
C2) start medium (approx. 20–89 avg. daily MMEs), end medium (13.2%),
C3) start medium, end low (approx. <20 avg. daily MMEs) (21.5%),
C4) start low, end medium (22.6%), and,
C5) start low, end low (29.6%).
More than half (56%) of the LIP-enrolled cohort appeared to cluster around trajectory patterns characterized by a relatively stable level of daily MMEs prior to, during, and following the LIP (i.e., C1, C2, and C5). Prior to becoming eligible (i.e. pre-spike) these three trajectory groups were at high, medium, and low levels of MMEs respectively, and all three were at essentially the same levels following LIP release.
On the other hand, trajectories C3 and C4 were characterized by considerable change across periods. Compared to their pre-spike period, C4 (23%) had an unexpected increase in MME dosage during lock-in and following release. Of the five groups, only C3 (22%) exhibited a decline in dispensed MMEs during the lock-in period. However, this decline was evident prior to the point of actual LIP enrollment and, therefore, a causal association remains questionable.
Covariate Associations with Trajectories
Covariate similarities and differences were summarized (Tables 1 & 2; Figure 2). Comparisons of particular interest are presented below.
TABLE 2.
Key characteristics of beneficiaries enrolled in the North Carolina Medicaid “lock-in” program by latent class (n=2,701)
| Latent class number/description | Summary of key characteristics associated with trajectory pattern |
|---|---|
| C1: Start high, end high | Older than C3–5; highest proportion of men; highest prevalence receiving Medicaid due to a disability; lower prevalence of MAT compared to C3–5; lowest mean ED visits; highest prevalence of severe pain diagnoses; lowest prevalence of mental health disorders; highest mean comorbidity index |
| C2: Start medium, end medium | Similar to C1 in many characteristics (e.g., age, gender, Medicaid eligibility category, pain diagnoses); different than C1 in greater use of ED; slightly lower prevalence of other substance-related disorder diagnoses |
| C3: Start medium, end low | Younger than C1&2; less disability than C1&2; greater use of MAT than C1&2; highest prevalence of other substance use-related disorders and overdose; greater use of ED than C1&2 and similar to C4&5; higher prevalence of mental health disorders than C1&2 and similar to C4&5 |
| C4: Start low, end medium | Similar in age to C3, older than C5; larger proportion of women than C1–3, similar to C5; lower prevalence of disability than C1–3, more than C5; similar use of MAT to C3 but lower than C5; similar prevalence of pain diagnoses to C3, higher than C5; similar prevalence of mental health diagnoses to C3&5; higher mean comorbidity index than C5, similar to C3 |
| C5: Start low, end low | Younger than C1–C4; highest prevalence of women; lowest prevalence of disability; very high prevalence of MAT (highest of any class); highest use of EDs; lowest prevalence of severe pain diagnoses; high prevalence of mental health disorders, similar to C3&4 and higher than C1&2; lowest comorbidity index |
C= class (trajectory); MAT= medication-assisted treatment; ED= emergency department
FIGURE 2.
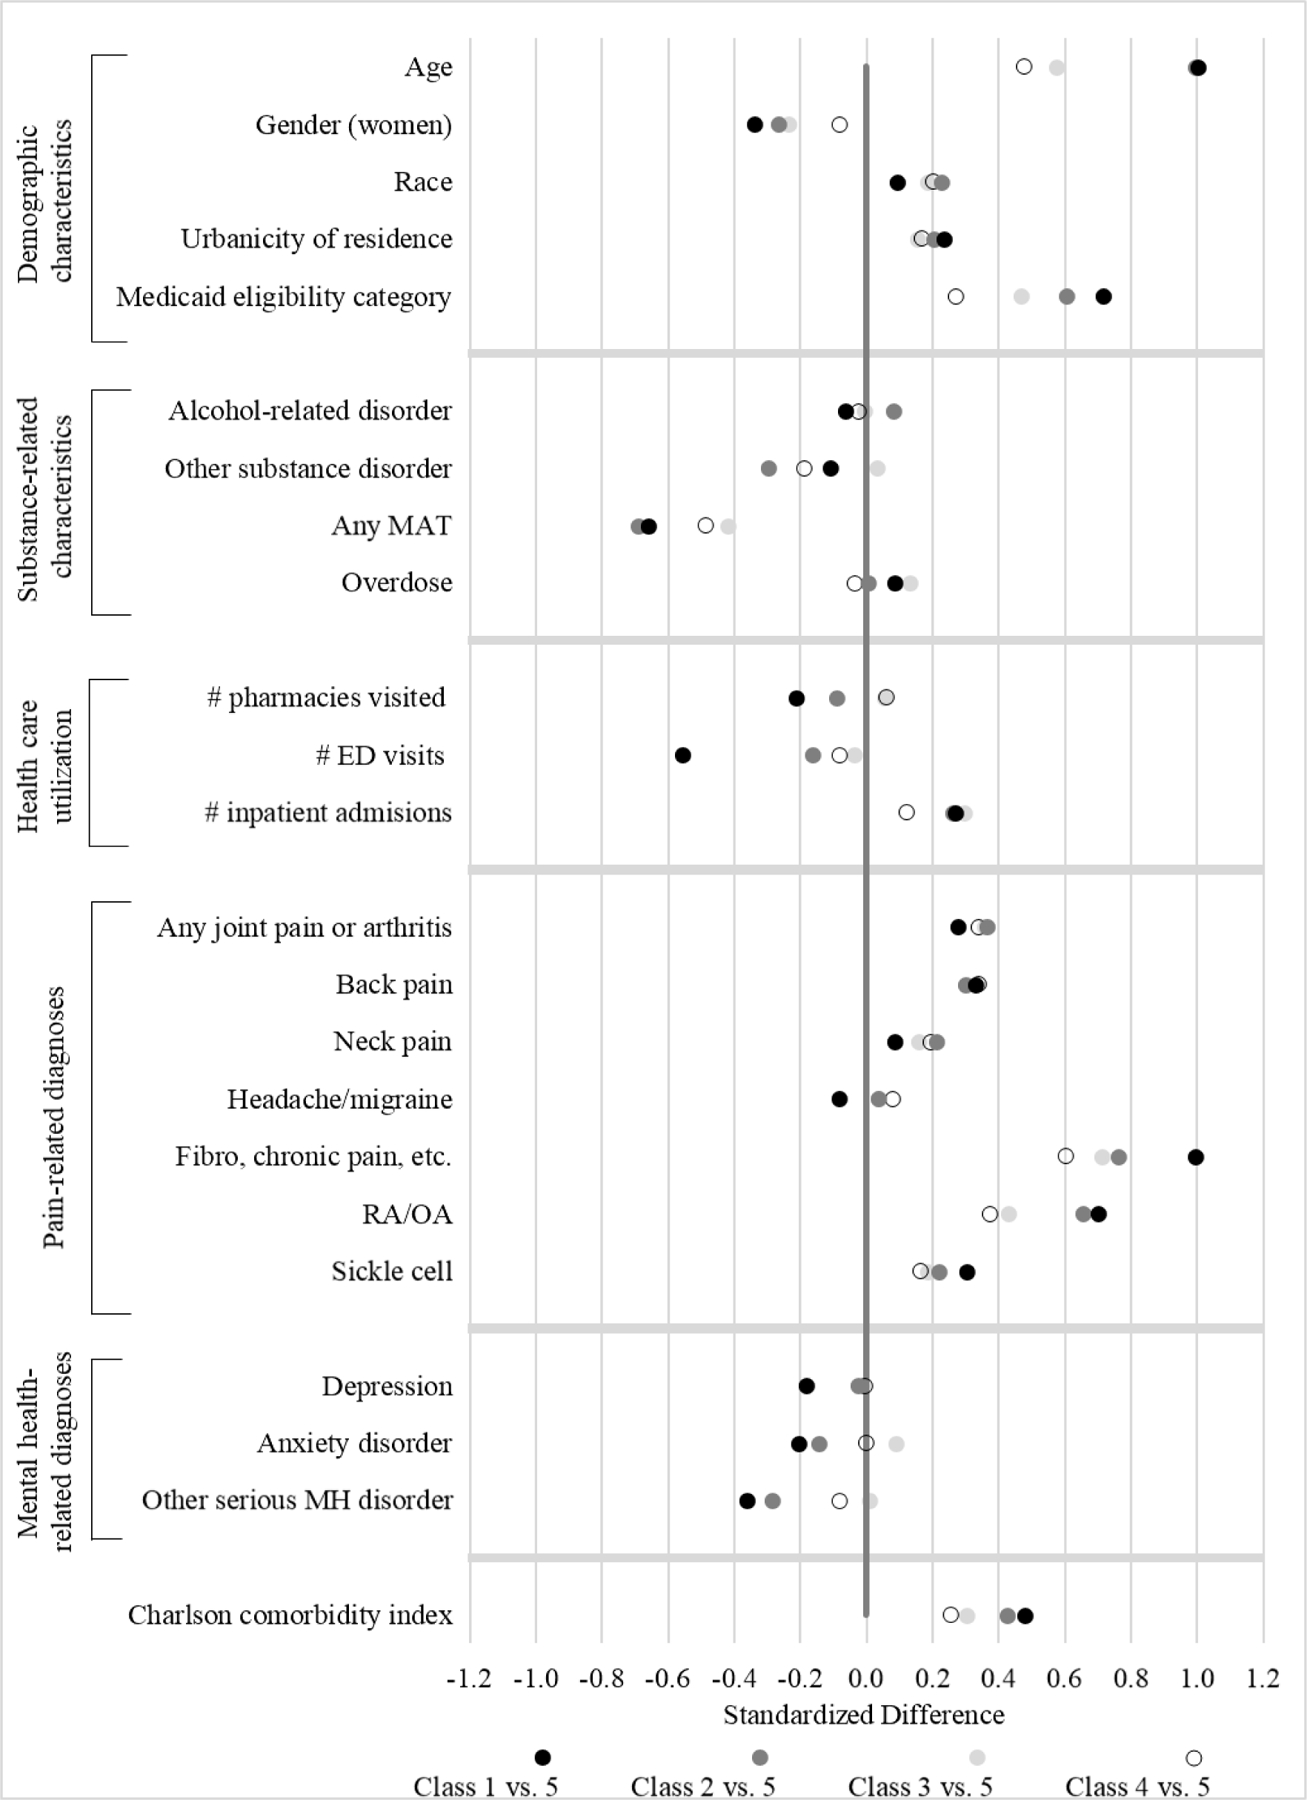
Standardized differences† in North Carolina Medicaid “lock-in” program-enrolled beneficiary characteristics by latent class, using class 5 (i.e., “start low, end low” class) as the reference group
MAT= medication-assisted treatment; ED= emergency department; RA/OA= rheumatoid arthritis/osteoarthritis; MH= mental health; Class 1= start high, end high; Class 2= start medium, end medium; Class 3= start medium, end low; Class 4= start low, end medium; Class 5= start low, end low
† Refer to online appendix for details on standardized difference calculations. Briefly, standardized differences provide a measure of the similarity or dissimilarity of two groups with respect to specific covariates. For example, for “other substance disorders,” the figure indicates that beneficiaries who clustered around Classes 1, 2, and 4 have a lower prevalence of substance disorders than those who clustered around Class 5, and beneficiaries who clustered around Class 3 have a somewhat higher prevalence of substance disorders than those who clustered around Class 5.
C1 and C2 (sustained high or medium MMEs) compared to C5 (sustained low MMEs):
Approximately one quarter of our cohort tended to obtain average daily MMEs in high or medium dosage amounts across all time periods (i.e., C1 and C2). Despite their different MME levels, beneficiaries that clustered around these two trajectories tended to be similar in terms of their covariate profiles. They were older, on average, than other trajectory classes, and tended to have higher levels of chronic pain, disability, and comorbidity. At the other extreme, beneficiaries following C5, a trajectory characterized by sustained low levels of MME dispensing, were the youngest of all classes, had the lowest levels of chronic pain, comorbidity, and disability, and had the highest levels of addiction treatment.
C2 and C3 (both began at medium MMEs, C3 declined while C2 remained level):
C2 and C3 were relatively similar in pre-spike levels of dispensed MMEs but differed considerably with respect to post-spike trajectories. C3 exhibited a large decline in MMEs following the spike in opioid dispensing, in contrast to C2’s sustained levels. While beneficiaries who tended to follow these patterns were generally similar in terms of average covariate characteristics, beneficiaries clustered around a C3 trajectory had the highest prevalence of overdose events and substance-related disorder diagnoses prior to LIP enrollment, as well as a relatively high prevalence of MAT and mental health disorder diagnoses.
C4 and C5 (both began at low MMEs, C4 elevated while C5 remained low):
C4 and C5 were similar in pre-spike levels of dispensed MMEs. However, C5 returned to a low level of MME dispensing following the spike, while C4 remained at a heightened level following the spike. Most striking was the difference in MAT use associated with these two trajectories: C5 had the highest use of MAT, nearly four times that of C4. Other notable differences included a higher prevalence of beneficiaries receiving Medicaid benefits due to a disability, a higher prevalence of severe pain diagnoses, and a higher mean comorbidity index among beneficiaries following a C4 trajectory.
Discussion
Among a beneficiary population receiving large numbers of opioid prescriptions and continuously enrolled in a Medicaid LIP, considerable heterogeneity existed in the trajectories of opioid dosages (MMEs) dispensed prior to, during, and following release from the program. We found that five trajectory patterns provided a suitable summary of the underlying heterogeneity in MME trajectories and that there were notable associations between trajectory patterns and beneficiaries’ characteristics.
Covariate Associations with Trajectories
While previous research has demonstrated considerable heterogeneity in classes of controlled substance users,7–12 this is the first study to examine opioid dispensing trajectories within a specific population of beneficiaries included in an intervention aimed at reducing potential overutilization. Therefore, there is little research to which we can compare our findings. From a broad perspective, studies have identified similar covariates, including mental health disorders, severity of pain conditions, and healthcare utilization, associated with dissimilar classes of controlled substance users.8,20
Key covariate differences between C2 and C3 suggest that declines in C3 opioid dispensing post-spike could be attributed to the higher prevalence of overdose events and MAT in this class. Specifically, overdose events could have served as an impetus for MAT and the observed decline in MMEs prior to and during enrollment for some beneficiaries clustering around C3. However, additional research is needed to more closely examine the temporality of these associations and to also examine the extent to which mental health disorders and associated treatment may or may not have contributed to the declining pattern. Given that the decline began prior to enrollment in the LIP, beneficiaries clustered around the C3 pattern might have followed a declining pattern post-spike, irrespective of LIP enrollment. Initial sensitivity analyses revealed the declining pattern was not unique to those enrolled in the LIP but may have also occurred among those eligible for the program but not prioritized for enrollment. However, additional work is needed to further understand the potential contribution of the LIP and other factors to the declining pattern.
Compared with beneficiaries in C5, those following a C4 pattern tended to have a greater prevalence of pain conditions, disability, and comorbidity. If these beneficiaries experienced an onset of new pain conditions, disabilities, and/or comorbidities just prior to meeting LIP eligibility, this might help explain why they escalated and remained elevated at the time that they did, rather than returning to MME dispensing levels similar to pre-spike levels, like C5. Additionally, while it seems likely that the large proportion of MAT may have factored into the re-stabilization to low levels of dispensed MMEs observed in the C5 trajectory, the majority of beneficiaries clustered around this class did not use MAT. Additional work is needed to understand factors driving the observed spike, and reasons why certain beneficiaries re-stabilize post-spike while others do not.
LIP Implications
LIPs are generally implemented to reduce potential overutilization of opioids; however, our findings suggest limited impact on average trajectories of MMEs dispensed to beneficiaries over LIP-related periods. The only class that exhibited a decline in dispensed MMEs during the lock-in period was C3; however, this decline was evident prior to the point of actual LIP enrollment.
Our findings, combined with early evidence from promising LIP designs,21 suggest that there may be modifications LIPs can make to operate more effectively and improve beneficiary outcomes. For example, given our finding of a strong association of MAT history with generally low MME trajectory patterns, LIP administrators could consider comprehensively integrating a range of substance use disorder assessment and treatment services throughout LIP pre-enrollment and enrollment periods. Additionally, we found that those receiving Medicaid benefits due to a disability tended to follow paths characterized by higher levels of dispensed MMEs across periods. A focused effort, as part of the LIP, to assess beneficiaries who receive Medicaid benefits due to a disability and remain at persistently high levels of MMEs for potential opioid tapering, utilization of alternative or complementary pain therapy approaches, and possession of naloxone might improve beneficiary outcomes and reduce overdose risk.22 While some Medicaid LIPs provide beneficiaries with additional services, most programs do not.23 Additional work is need to understand which LIP models, including which integrated services, can help both improve the complex health needs of enrolled beneficiaries and reduce health care costs from beneficiary and Medicaid perspectives in the short and long-term.
Limitations
Our findings should be viewed in light of four limitations. First, we used LCGA as an exploratory tool to begin to examine potential underlying heterogeneity in trajectories of dispensed opioid dosages obtained across LIP-related periods. Research suggests that these methods can be vulnerable to model misspecification, and while we used several model selection and diagnostic criteria, further analyses in similar LIP populations should be conducted to examine the consistency of findings.24,25 Second, while the linked Medicaid claims-CSRS database likely captured nearly all opioids dispensed to these patients, there are some gaps in understanding patients’ complete opioid acquisition. We do not have information on opioid prescriptions acquired across state lines, from pharmacies located on military bases or veterans’ administration hospitals, or obtained through illicit sources. Third, the presence of diagnoses in the year prior to LIP enrollment may be underestimated. However, research suggests that inclusion of any available data in a lookback period to assess presence of covariates results in less misclassification than restricting the data to a common lookback period for all persons.26 Fourth, we only examined beneficiaries with continuous enrollment in the LIP. It is important to note that many beneficiaries do not remain enrolled in LIPs for the entire program period, and future research is needed on causes of program drop out, coverage lapses, and care disruptions among LIP populations.27,28
Conclusions
Understanding heterogeneous patterns in amounts of dispensed opioids and corresponding associations with beneficiary characteristics can provide insight into the design and implementation of LIPs. Our findings suggest that greater assessment of substance use disorders and subsequent referral to MAT may lead some beneficiaries to follow lower risk opioid dispensing trajectories. Additionally, administrators might consider assessing beneficiaries found to follow persistently high MME trajectories, including those with disabilities, severe pain diagnoses, and high levels of comorbidity, for uptake of alternate pain therapy services (e.g., physical therapy, biofeedback) and other overdose risk reduction strategies (e.g., access to naloxone). Finally, additional research is warranted to understand factors that drive spikes in opioid dispensing and whether certain beneficiaries experience isolated spikes due to legitimate changes in providers or a brief episode in breakthrough pain, as opposed to repeated spikes in opioid dispensing behaviors, which could be indicative of potential diversion or illegitimate use. Such research, as well as work to identify other intervention components that could beneficially alter opioid trajectories, may help improve LIP designs and ultimately beneficiaries’ outcomes.
Supplementary Material
Take Home Messages/ Key Points:
“Lock-in” programs are used by health plans across the country with the goal of identifying beneficiaries demonstrating potential overutilization of prescription drugs (e.g., opioids) and controlling their access.
Analyzing variation in opioid dispensing patterns across a “lock-in”-enrolled population can help us better understand underlying heterogeneity in program impacts, and in turn help more effectively target program resources.
Five patterns provided a suitable summary of the heterogeneity in opioid dispensing trajectories.
Overall, the program appeared to have a limited impact on trajectory patterns.
However, strong associations between trajectory patterns and beneficiaries’ demographics, substance use-related characteristics, comorbid conditions, and healthcare utilization provide insight into potential program design modifications that might improve impact.
Acknowledgements
The authors thank the NC Division of Medical Assistance and the Division of Mental Health, Developmental Disabilities, and Substance Abuse for their support in obtaining the data. This research was supported by Cooperative Agreement U01 CE002160-01 from the National Center for Injury Prevention and Control at the Centers for Disease Control and Prevention (NCIPC/CDC) and award R49-CE001495 to the University of North Carolina for an Injury Control Research Center from NCIPC/CDC. Dr. Naumann received fellowship support from the University of North Carolina’s Royster Society of Fellows. Dr. Gottfredson received support through an award from NIH (K01 DA035153). Dr. Lund received support from the National Cancer Institute (K12CA120780).
Footnotes
Prior Postings or Presentations: This work is original and has not been published, nor is it currently under consideration for publication elsewhere. This work has not been presented at a scientific conference.
References
- 1.Centers for Disease Control and Prevention (CDC). Wide-ranging Online Data for Epidemiologic Research: National Vital Statistics System mortality data. Atlanta, GA: CDC; 2016. [Google Scholar]
- 2.Haegerich TM, Paulozzi LJ, Manns BJ, Jones CM. What we know, and don’t know, about the impact of state policy and systems-level interventions on prescription drug overdose. Drug Alcohol Depend. 2014;145:34–47. [DOI] [PMC free article] [PubMed] [Google Scholar]
- 3.Alexander GC, Frattaroli S, Gielen AC. The prescription opioid epidemic: an evidence-based apporach. Baltimore, MD: John Hopkins Bloomberg School of Public Health; 2015. [Google Scholar]
- 4.Centers for Disease Control and Prevention (CDC). Patient review and restriction programs: lessons learned from state Medicaid programs. Atlanta, GA: CDC Expert Panel Meeting Report; 2012. [Google Scholar]
- 5.Roberts AW, Skinner AC. Assessing the present state and potential of Medicaid controlled substance lock-in programs. J Manag Care Spec Pharm. 2014;20:439–446c. [DOI] [PMC free article] [PubMed] [Google Scholar]
- 6.Naumann RB, Marshall SW, Lund JL, Gottfredson NC, Ringwalt CL, Skinner AC. Evaluating short- and long-term impacts of a Medicaid “lock-in” program on opioid and benzodiazepine prescriptions dispensed to beneficiaries. Drug Alcohol Depend. 2018;182:112–119. [DOI] [PMC free article] [PubMed] [Google Scholar]
- 7.Liu LC, Hedeker D, Segawa E, Flay BR. Evaluation of longitudinal intervention effects: an example of latent growth mixture models for ordinal drug-use outcomes. J Drug Issues. 2010;40:27–43. [Google Scholar]
- 8.Yeh HH, Chen CY, Fang SY, Chang IS, Wu EC, Lin KM. Five-year trajectories of long-term benzodiazepine use by adolescents: patient, provider, and medication factors. Psychiat Serv. 2011;62:900–907. [DOI] [PubMed] [Google Scholar]
- 9.Kertesz SG, Khodneva Y, Richman J, et al. Trajectories of drug use and mortality outcomes among adults followed over 18 years. J Gen Intern Med. 2012;27:808–816. [DOI] [PMC free article] [PubMed] [Google Scholar]
- 10.Lopez-Castro T, Hu MC, Papini S, Ruglass LM, Hien DA. Pathways to change: Use trajectories following trauma-informed treatment of women with co-occurring post-traumatic stress disorder and substance use disorders. Drug Alcohol Rev. 2015;34:242–251. [DOI] [PMC free article] [PubMed] [Google Scholar]
- 11.Huang D, Brecht ML, Hara M, Hser YI. Influences of a covariate on growth mixture modeling. J Drug Issues. 2010;40:173–194. [DOI] [PMC free article] [PubMed] [Google Scholar]
- 12.Nosyk B, Guh DP, Sun H, et al. Health related quality of life trajectories of patients in opioid substitution treatment. Drug Alcohol Depend. 2011;118:259–264. [DOI] [PubMed] [Google Scholar]
- 13.Nagin DS. Analyzing developmental trajectories: a semi-parametric, group-based approach. Psychol Methods. 1999;4:139–177. [DOI] [PubMed] [Google Scholar]
- 14.Roberts AW, Farley JF, Holmes GM, et al. Controlled substance lock-in programs: examining an unintended consequence of a prescription drug abuse policy. Health Aff. 2016;35:1884–1892. [DOI] [PMC free article] [PubMed] [Google Scholar]
- 15.North Carolina Medicaid. Implementation of a recipient management lock-in program North Carolina Medicaid Pharmacy Newsletter. Raleigh, NC; 2010. [Google Scholar]
- 16.Prescription Drug Monitoring Program Training and Technical Assistance Center, Brandeis University. Calculating Daily Morphine Milligram Equivalents: Technical Assistance Guide No.01–13. Waltham, MA: Brandeis University; 2013. [Google Scholar]
- 17.Centers for Disease Control and Prevention (CDC). CDC’s compilation of opioid analgesic formulations with morphine milligram equivalent conversion factors, 2015 version. Atlanta, GA: CDC; 2015. [Google Scholar]
- 18.Nagin DS. Group-based trajectory modeling: an overview. Ann Nutr Metab. 2014;65:205–210. [DOI] [PubMed] [Google Scholar]
- 19.Nagin DS, Odgers CL. Group-based trajectory modeling in clinical research. Annu Rev Clin Psycho. 2010;6:109–138. [DOI] [PubMed] [Google Scholar]
- 20.Banta-Green CJ, Merrill JO, Doyle SR, Boudreau DM, Calsyn DA. Opioid use behaviors, mental health and pain—development of a typology of chronic pain patients. Drug Alcohol Depend. 2009;104:34–42. [DOI] [PMC free article] [PubMed] [Google Scholar]
- 21.Association for Community Affiliated Plans (ACAP). Strategies to reduce prescription drug abuse: lessons learned from the ACAP SUD collaborative. Washington (DC): ACAP; 2015. [Google Scholar]
- 22.Dowell D, Haegerich TM, Chou R. CDC guideline for prescribing opioids for chronic pain—United States, 2016. MMWR Recomm Rep. 2016;65:1–49. [DOI] [PubMed] [Google Scholar]
- 23.The Pew Charitable Trusts. Curbing prescription drug abuse with patient review and restriction programs: learning from Medicaid agencies. Philadelphia, PA: The Pew Charitable Trusts, 2016. [Google Scholar]
- 24.Bauer DJ. Observations on the use of growth mixture models in psychological research. Multivar Behav Res. 2007;42:757–786. [Google Scholar]
- 25.Bauer DJ, Curran PJ. The integration of continuous and discrete latent variable models: potential problems and promising opportunities. Psychol Methods. 2004;9:3–29. [DOI] [PubMed] [Google Scholar]
- 26.Brunelli SM, Gagne JJ, Huybrechts KF, et al. Estimation using all available covariate information versus a fixed look-back window for dichotomous covariates. Pharmacoepidemiol Drug Saf. 2013;22:542–550. [DOI] [PMC free article] [PubMed] [Google Scholar]
- 27.Dreyer TRF, Michalski T, Williams BC. Patient outcomes in a Medicaid managed care lock-in program. J Manag Care Spec Pharm 2015;21:1006–1012. [DOI] [PMC free article] [PubMed] [Google Scholar]
- 28.Naumann RB, Marshall SW, Lund JL, Skinner AC, Ringwalt C, Gottfredson NC. Healthcare utilization and comorbidity history of North Carolina Medicaid beneficiaries eligible, enrolled, and retained in a controlled substance “lock-in” program. NC Med J. 2018, Under Review. [DOI] [PMC free article] [PubMed] [Google Scholar]
Associated Data
This section collects any data citations, data availability statements, or supplementary materials included in this article.