Abstract
Biosorption using natural waste has emerged as a potential and promising strategy for removal of toxic dyes from wastewaters in comparison to conventional ones. Herein, the Codium decorticatum alga (CDA) was biologically identified and used as a biosorbent for anionic and cationic dyes from aqueous solutions. SEM analysis showed a rough surface with an irregular edge and shape while hydroxyl, amine, sulfur and carboxyl functional groups were identified using FTIR analysis. TGA/DTG confirmed the stability of CDA and the adsorption process. Batch studies were conducted to investigate the effect of operational factors such as initial pH, biosorbent dosage, temperature, initial concentration, and solid/liquid contact time on the biosorption of crystal violet (CV) and Congo red (CR) dyes. For both CV and CR dyes, the biosorption kinetics was accurately described by the pseudo-second-order model and the Langmuir isotherm was found to be best fitted for equilibrium data. Maximum uptake capacities have attained up to 278.46 mg/g for CV and 191.01 mg/g for CR. The CV and CR dye biosorption mechanism was ultimately manifested through the electrostatic interactions. The regeneration study showed that the CDA presents excellent reuse performance up to four consecutive cycles. The process optimization was performed using the response surface methodology based on Box–Behnken design (RSM-BDD). Accordingly, the optimum predicted removal efficiencies using RSM-BBD for CV and CR were obtained, respectively, at 96.9 and 89.8% using a CDA dose of 1.5 g/L, dye concentration of 20 mg/L, pH of 10 for CV, and pH of 4 for CR. Overall, CDA behaves as an efficient, recyclable, cheap, and eco-friendly adsorbent for cleaning-up of dyed effluents.
1. Introduction
The overwhelming discharge into wastewater, as well as clean water, is expected to provoke diseases and perturbations of the ecosystem (flora and fauna) from domestic and industrial wastes.1,2 Since then, many researchers around the world have confirmed that heavy metals and dyes are frequently released into the aquatic environment.3 Dyes are potentially employed for large industrial applications such as textiles, papers, foods, and plastics. In an aquatic medium, dyes present a real threat to the ecosystem due to their toxic effects. Dyes are mutagenic and carcinogenic agents and attack the whole food chain.4 Additionally, dyes could be released into common wastewater and affect the growth of plants and germination by irrigation agriculture.5,6 Several techniques, such as ultrafiltration,7 coagulation,8 photocatalysis,9 osmosis,10 and adsorption,11 were used to get rid of dyes or reduce their toxicity. In this context, the development of low-cost and efficient methods to remove the contaminants from water is required. Biosorption processes utilizing natural materials have gained much attention from many scientists around the world owing to their biodegradability and nontoxicity.12,13 Natural minerals,14−17 plants, fruit seeds,18,19 and marine algae are generally used in this case. A marine algal biosorbent is a potential material for dye removal due to its high affinity because of the richness of algal surface chemistry by reactive heteroatom-containing functional groups (e.g., hydroxyl, carboxyl, sulfate, and amine). Indeed, several species, such as Ulva lactuca,20Caulerpa stapeliiformis,21Chlorella vulgaris,22Systoceira stricta,23Spirogyra,24 are used as biosorbents for efficient elimination of colored compounds from drinking and contaminated waters.
In the Moroccan coast, marine algal diversity was widely studied. About 612 seaweed species were identified and isolated.25−28 In this locality, a few species in particular Gelidium corneum (Hudson) J.V. Lamouroux 1813 and Gelidium microdon Kützing 1849 were overexploiting due to their cosmetic29 and pharmaceutical uses.30,31 However, other species show a massive growth (bloom), large geographic distribution, and an annually massive stranding generally at the beginning of autumn such as the Codium genus, especially Codium tomentosum and Codium decorticatum, which unfortunately did not have local valorization. To the best of our knowledge, despite the full availability of the stranded C. decorticatum alga (CDA), it has never been isolated and used as a biosorbent for wastewater treatment.
Therefore, the main objective of this research work is to investigate CDA, biologically identified and used for the first time as an inexpensive and eco-friendly adsorbent material for the decoloration of synthetic dyes from aquatic media. The biosorbent was collected as marine waste in Agadir bays and characterized in detail. Crystal violet (CV) and Congo red (CR) were chosen as cationic and anionic model dyes, respectively, to get an insight into the adsorption ability of CDA to remove different types of textile dyes. Indeed, these persistent colored compounds can pose a serious environmental concern due to their potential harmfulness to human beings and biodiversity.32 Batch experiments were carried out to study the influence of several variables, including pH, contact time, biosorbent dose, dye concentration, and temperature on the performance of CV and CR dye biosorption. The response surface methodology (RSM) is a useful modeling tool to accurately evaluate the impacts of independent variables and their mutual interactions on the response. In comparison to the traditional single-factor-at-a-time method, RSM allows us to predict the optimum conditions for a response as well as minimize the number and cost of experimental runs.33 The kinetics, equilibrium isotherm, and recyclability were also investigated. The biosorption behavior of CV and CR dyes on the CDA was optimized by RSM. The influences of physicochemical parameters such as pH, initial dye concentration, and adsorbent dose on removal efficiency were investigated as key factors using Box–Behnken Design (BBD).34,35
2. Results and Discussion
2.1. Biological Identification of Algae
C. decorticatum (Woodward) M. Howe 1911 is a green alga belonging to the phylum Chlorophyta, subphylum Chlorophytina, class Ulvophyceae, order Bryopsidales, family Codiaceae, and the genus Codium.
The thallus was spongy, dichotomus, and measured 30 to 50 cm in length (Figure 2A,B). The branches were generally cylindrical except the flattened ramification nodes. The urticles were generally clavate, rarely cylindrical, and contained a very small chloroplast (Figure 2D,E). The urticle maximum diameter and length measured, respectively, 108–343 (216.75 ± 32.50 μm) and 585–900 μm (730.15 ± 49.78 μm). The ametangia was laterally pedicellate and fusiform (Figure 2E,G).
Figure 2.
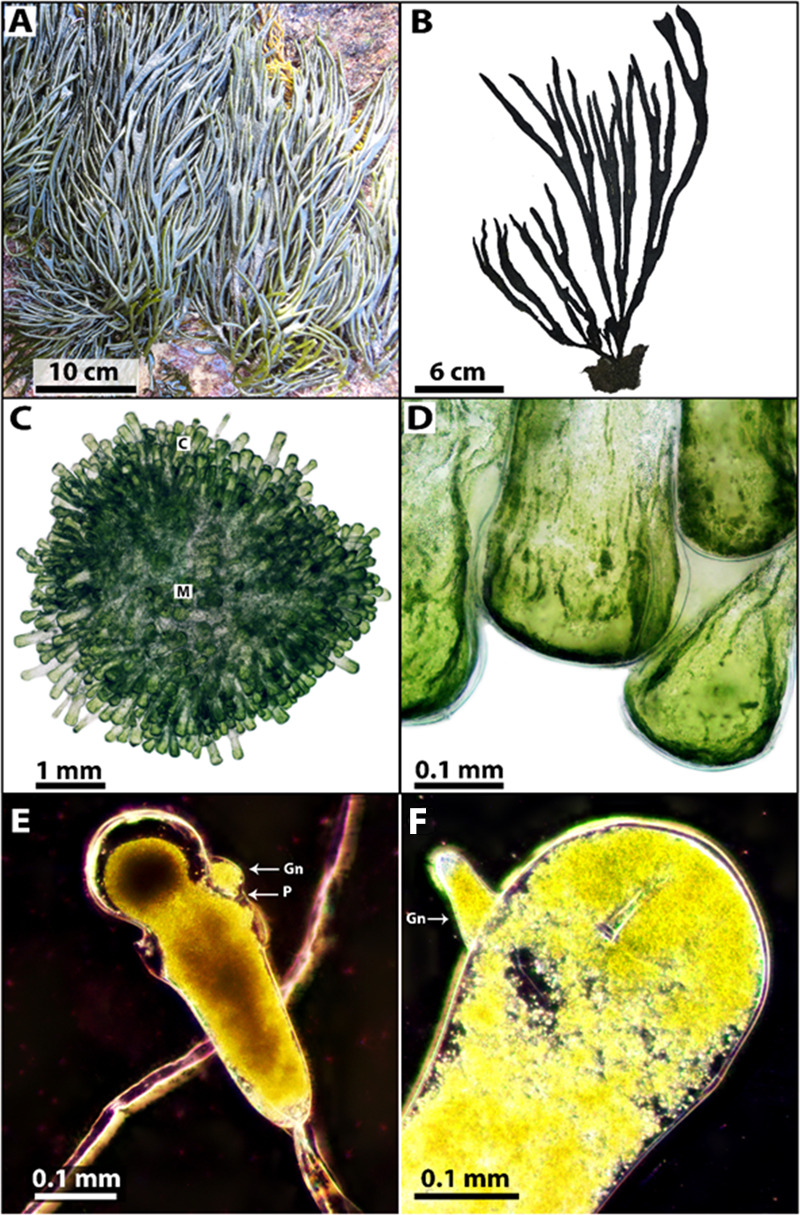
(A) General growth form of the plant on the rocky coast. (B) Ramification type. (C) Cross section of the apical branch: (M) medullary region, (C) cortex region. (D) Part of the urticle. (E,F) Urticles with gametangia (Gn) and pedicel (P).
2.2. Physicochemical Identification of Algae
Scanning electron microscopy (SEM) was carried out to demonstrate the surface morphology of CDA. Figure 3 shows the SEM micrographs of CDA at different magnifications. According to SEM analysis, heterogeneous particles were disclosed at low magnifications. At high magnification, the surface exhibits different surface morphologies with the existence of quasi-spherical splatters. These irregular structures provide high trapping surfaces that promote uptake of CR and CV dyes.
Figure 3.
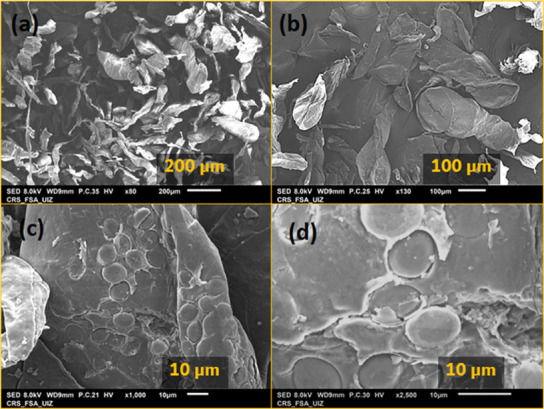
SEM micrographs of CDA at different scales: (a) 80×, (b) 130×, (c) 1000×, and (d) 2500× μm.
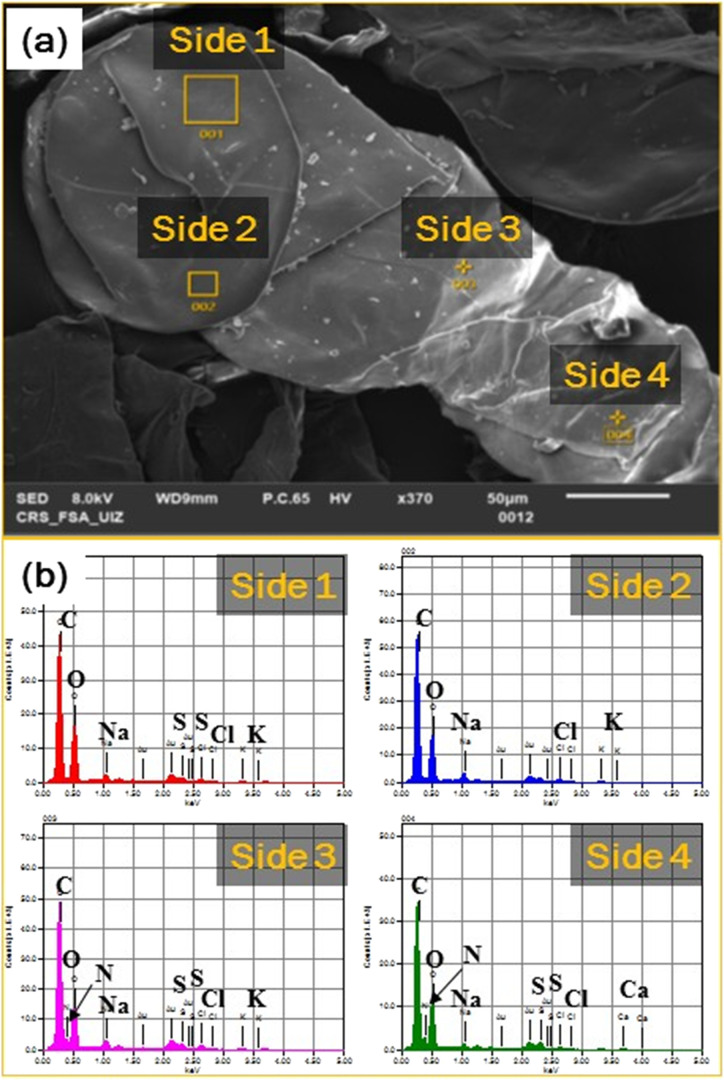
SEM coupled to EDS analysis was also conducted for one chosen caption at (130×). As we can see in Figure 4, four sides were chemically analyzed. According to the analysis, carbon and oxygen peaks are more dominant followed by sulfur peaks and finally potassium, sodium, nitrogen, and chloride peaks. Besides, this finding suggests the presence of such functional groups that could contribute to the adsorption of CR and CV dyes.
Figure 4.
(a) Analyzed SEM micrograph and (b) elemental distribution by EDS analysis of CDA.
The CDA biosorbent was examined using FTIR spectroscopy analysis to exhibit the functional groups existing on the surface. As shown in Figure 5a, numerous main peaks between 400 and 4000 cm–1 were detected. The large band at 3293 cm–1 is attributed to the O–H and N–H groups. The band at 2921 cm–1 is attributed to the C–H stretching band. The bands at 1640 and 1540 cm–1 correspond to carbonyl stretching of amide. However, the peaks at 1379 and 1245 correspond to the −CH2–, −CH3, and sulfur groups, respectively. Finally, the intense band at 1022 cm–1 is attributed to the C–O group.36,37
Figure 5.
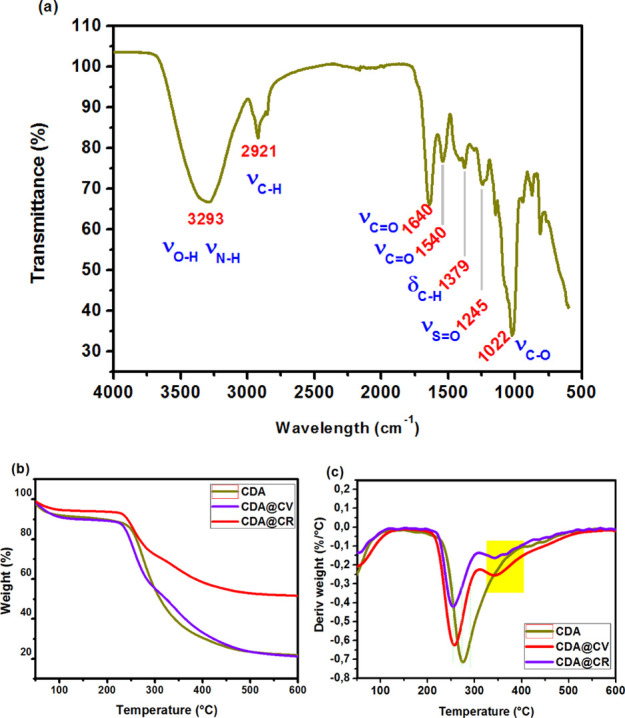
(a) FTIR analysis of dried CDA. (b) TGA and (c) DTG analysis of CDA before and after biosorption of CV and CR dyes.
The thermal behavior of CDA before and after biosorption was studied by TGA analysis and is shown in Figure 5b,c. CDA after biosorption of CV and CR is denoted as CDA@CR and CDA@CV, respectively. For CDA before biosorption, an individual mass loss appears between 254 and 275 °C. However, one more slight weight loss appears at 346 and 344 °C for CDA@CR and CDA@CV, respectively, due to dye decomposition (Table 3).
Table 3. DTG Details of CDA before and after Biosorption of CV and CR.
| material | 1st loss temperature (°C) | 2nd stage loss temperature (°C) |
|---|---|---|
| CDA | 275 | |
| CDA@CR | 256 | 346 |
| CDA@CV | 254 | 344 |
2.3. Biosorption Studies
2.3.1. Point-of-Zero Charge (pHPZC)
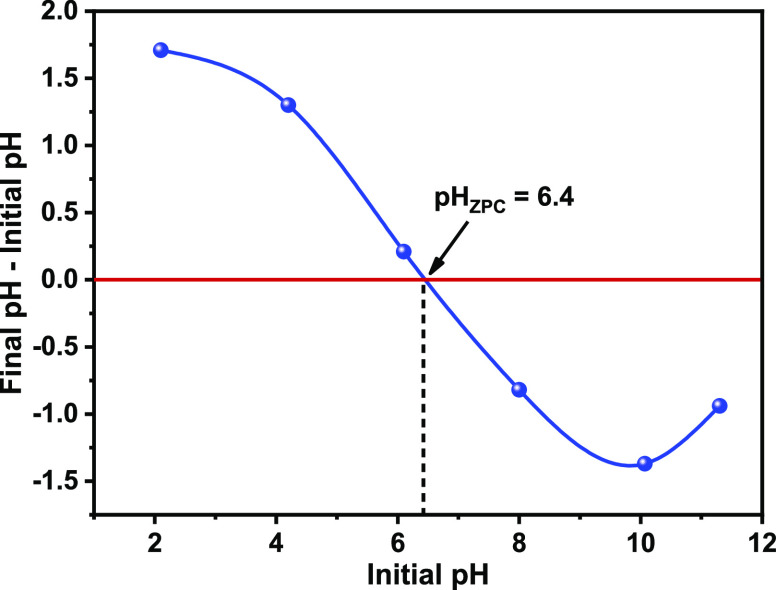
pHPZC is such an essential property that allows us to gain insight into the biosorption ability regarding the surface charge of the biosorbent.38 At pHPZC, the biosorbent presents a neutral charge on its surface. According to Figure 6, the pHPZC value of the CDA biosorbent is 6.4 ± 0.1; therefore, the biosorbent surface is positively charged below this value because of the protonation of functional groups (OH and NH2).16 Meanwhile, at pH > 6.4, the surface charge of CDA is negative, originating from −OH, −COOH, and −SO32– function deprotonation. Thus, uptake of cationic dyes, e.g., CV, onto the CDA biosorbent is electrostatically favorable at higher pH (pH > pHPZC). At pH < pHPZC, the biosorption of anionic species onto the CDA surface will be more favored owing to the existence of active functional groups that are positively charged.
Figure 6.
Point-of-zero charge (pHPZC) of CDA.
2.3.2. Influence of pH
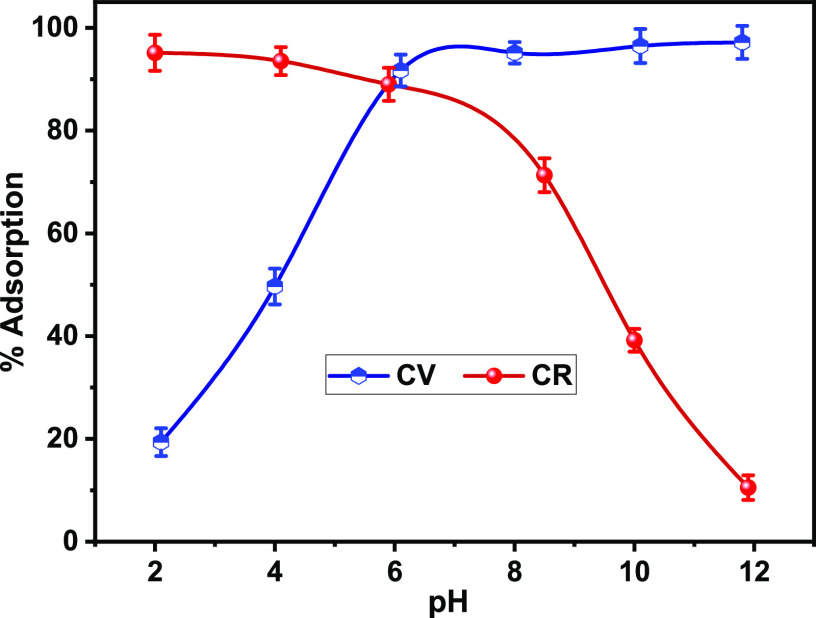
The medium pH, as it is well known, plays an indispensable role in the biosorption process; correspondingly, we have evaluated the influence of this factor on CV and CR dye biosorption onto the CDA biosorbent by varying the pH from 2.0 to 11.8, using an optimum sorbent dose of 1 g/L for 120 min at ambient temperature. From Figure 7, it could be noted that the increase of medium pH from 2.1 to 11.8 leads to an enhancement in CV uptake from 19.36 to 97.16% and a decrease in CR uptake from 95.14 to 10.52%. These behaviors could be rationalized based on the electrostatic interaction view.39 Thus, CV (cationic dye) was expected to be removed more favorably than CR (anionic dye) in alkaline pH (pH > pHPZC) because the surface of CDA is negatively charged. Consequently, an attractive electrostatic force occurs between the CV molecule and negative active sites present in the superficies of the CDA biosorbent, while repulsive interactions between CR and negative functional groups reduce its removal rate. Likewise, the removal of CR was in favor at acidic pH values. Moreover, FTIR analysis confirmed the existence of functional groups (−COOH, −SO32–, and −OH) that are foreseeable to interact more with CV in a basic medium. This suggestion will be thoroughly discussed in the mechanism part. As a result, we have considered the pH = 6 to work in this study as it showed high decolorization for both dyes.
Figure 7.
Removal efficiencies for the CV and CR dyes on CDA at different pH values. Conditions: dye concentration = 20 mg/L; equilibrium time = 120 min; adsorbent dose =1 g/L; temperature = 25 °C.
2.3.3. Influence of the CDA Dose
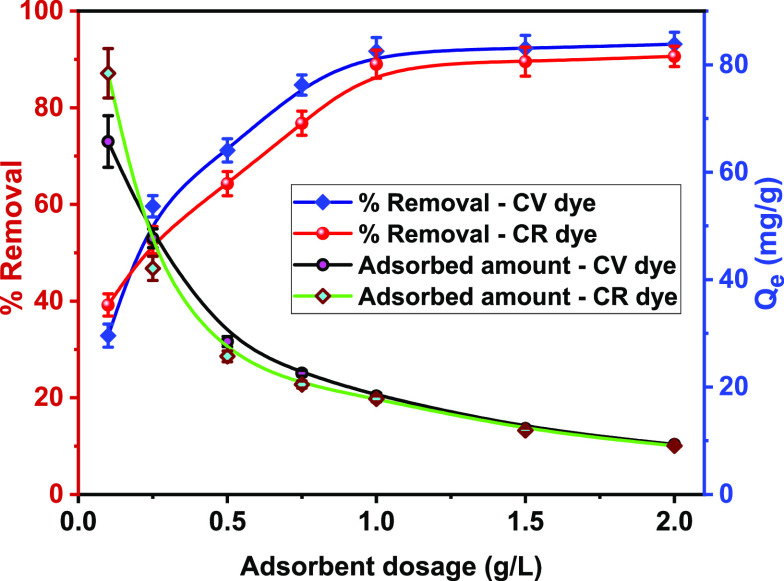
The adsorbent dosage is a crucial factor influencing the biosorption efficiency. The effect of CDA biosorbent dosage on CV and CR removal displayed in Figure 8 shows that the removal of two dyes increases (from 32.85 to 91.69% for CV and from 39.20 to 89.01% for CR) with increasing solid/liquid ratio from 0.1 to 1.0 g/L. This is eventually caused by the high availability of binding sites for CV and CR biosorption when we increase the CDA biosorbent dose.40 However, the CV and CR removal efficiencies remain almost unchangeable, with a further increase in the CDA dose beyond 1.0 g/L. This behavior could be explained by the large amounts of CDA biosorbent that can cause a hindrance effect on the CV and CR dye molecules to access the available binding sites, which is induced by the agglomeration phenomenon of CDA particles.41 Besides, it was found that the adsorbed amount substantially decreases with increasing CDA dose from 0.1 to 2.0 g/L for both CV and CR dyes. This adsorption trend was probably caused by the aggregation of CDA particles at a higher adsorbent dose, which would reduce the number of active surface sites.42 Overall, the best dose of the CDA biosorbent was found to be 1.0 g/L mentioning that the removal efficiency of CV was higher than that of the CR dye for each studied biosorbent dose. These findings show that the CDA surface has a better binding affinity to CV than to CR.
Figure 8.
Removal efficiencies for the CV and CR dyes on CDA at different adsorbent dose values. Conditions: equilibrium time = 120 min; pH = 6; dye concentration = 20 mg/L; temperature = 25 °C.
2.3.4. Kinetics
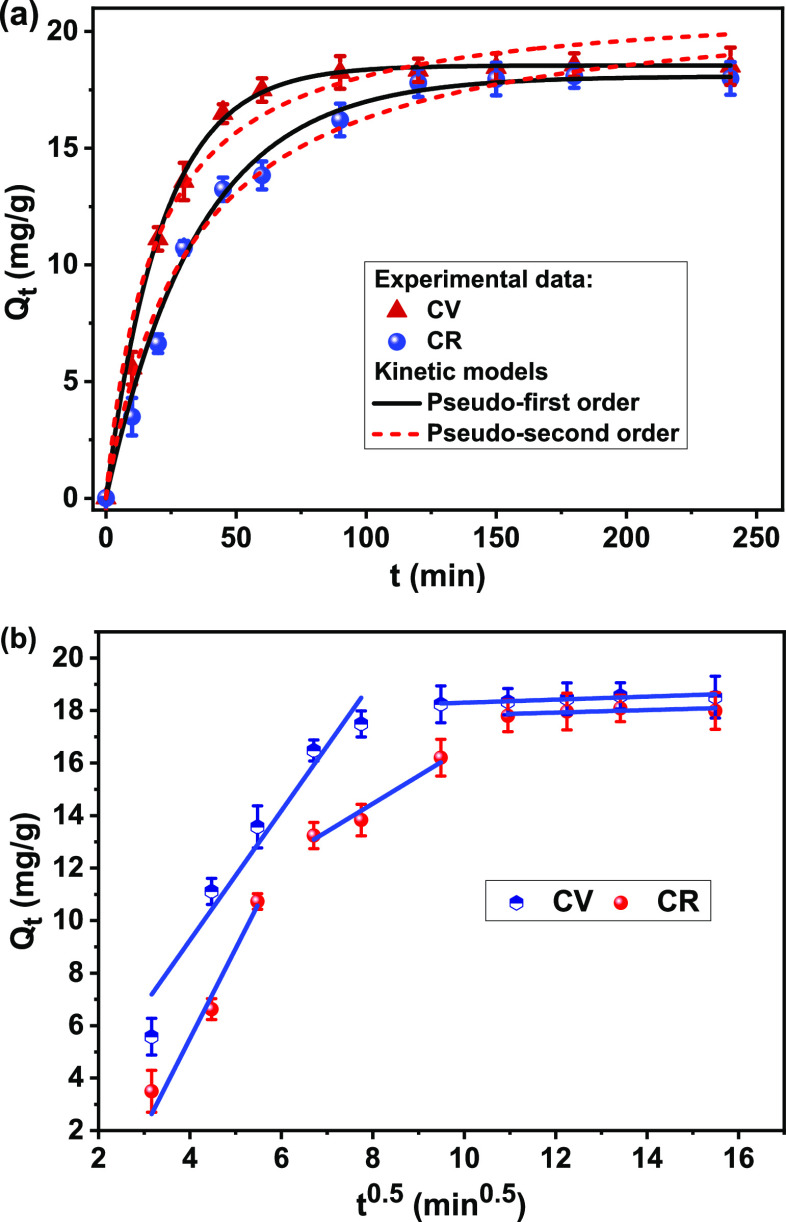
Figure 9a presents the influence of contact time upon the CV and CR uptake. The result demonstrated that the biosorption process implied two main reaction stages for CV, a rapid one within 60 min followed by a slow continuous biosorption reaction; meanwhile, three stages could be considered for the CR dye, an initial fast uptake up to 70% within 60 min followed by a moderate uptake, and then, the system reaches the steady state. Besides, the large amount of vacant biosorption sites present on CDA at the beginning explains the rapid process.43 Then, the biosorption of CV and CR dyes on the actives sites becomes more and more limited, which may impede the dye molecules to gain access to the biosorption sites, due to repulsive effects of adsorbed dye molecules on the CDA surface with those present in the aqua matrix. A similar suggestion was reported by Ohki et al.38 for CV adsorption on the Tectona grandis sawdust. In addition, the increase of contact time can cause a drastic decrease in the concentration gradient driving force, leading to an increase in the mass transfer resistance of CV and CR dyes from the solution to the CDA surface. Thus, the biosorption rate decreased continuously until the biosorption equilibrium is achieved within 120 min for both CV and CR dyes.
Figure 9.
Biosorption kinetics of CV and CR dyes onto CDA. (a) Nonlinear curves of the PFO and PSO models and (b) multilinear plots of the IPD model. Conditions: dye concentration = 20 mg/L; pH = 6; adsorbent dose =1 g/L; temperature = 25 °C.
To draw insight into the dynamics and the behavior of the biosorption process, pseudo-first-order, pseudo-second-order, and intraparticle diffusion models were applied (Figure 9). Table 4 summarizes the obtained results showing that the experimental data for both CV and CR dyes have a satisfactory fitness with the pseudo-first-order model, reflected by high determination coefficients. Besides, the calculated Qe,cal.1 values are very near to the ones experimentally determined (Qe,exp), which is an additional argument supporting the validity of the pseudo-first-order law to predict the biosorption kinetics of CV and CR dyes on the CDA.
Table 4. Constants of Kinetic Models for Biosorption of CV and CR Dyes on the CDA Biosorbent.
| kinetic models | parameters | CV | CR |
|---|---|---|---|
| Qe,exp | 18.34 | 17.80 | |
| pseudo-first-order | R2 | 0.999 | 0.994 |
| k1 (1/min) | 0.046 | 0.028 | |
| Qe,cal.1 (mg/g) | 18.54 | 18.08 | |
| pseudo-pseudo-order | R2 | 0.976 | 0.983 |
| k2 (mg/g·min) | 0.0026 | 0.0014 | |
| Qe,cal.2 (mg/g) | 21.40 | 21.55 | |
| intraparticle diffusion | kint.1 (mg/g·min0.5) | 2.579 | 3.429 |
| kint.2 (mg/g·min0.5) | 0.050 | 1.059 | |
| kint.3 (mg/g·min0.5) | 0.040 |
The diffusion mechanism was also investigated by applying the intraparticle diffusion model. The fitting parameters are presented in Table 4. From Figure 9b, it can be seen that the plotted intraparticle diffusion model for the CV dye did not pass through the origin and showed two linear portions; this stipulates that intraparticle diffusion of CV dye species is not only the rate-controlling step in the biosorption process.44 Thence, the first linear section presents film diffusion, while the second section shows the diffusion of CV molecules onto the CDA biosorbent along the pore-wall surface. The same mass transfer trend was demonstrated by Zhang et al.41 for adsorption of the CV dye on the orange peel and magnetized orange peel. In the case of CR dye biosorption, the intraparticle diffusion plot presents a multilinear profile (three linear regions), indicating that the CR dye biosorption process involves three successive stages.45 The initial one likely corresponds to the mass transfer of CR molecules from the liquid phase to the external surface of the CDA biosorbent. In the second stage, the CR dye molecules gradually diffuse into the pores of CDA (intraparticle diffusion). The third stage is attributed to the equilibrium state of CR biosorption onto the CDA surface. From Table 4, it is relevant to note that the values of rate constants (kint) decreased when moving from the first stage to the last one for both dyes (kint.1 > kint.2 for CV and kint.1 > kint.2 > kint.3 for CR). This finding reveals that the increase in biosorption time could inhibit the diffusion of CV and CR dyes due to a decrease in the residual dye concentration in the liquid phase.46 Besides, the boundary layer effect is of paramount importance in the biosorption of both tested synthetic dyes on the CDA.40
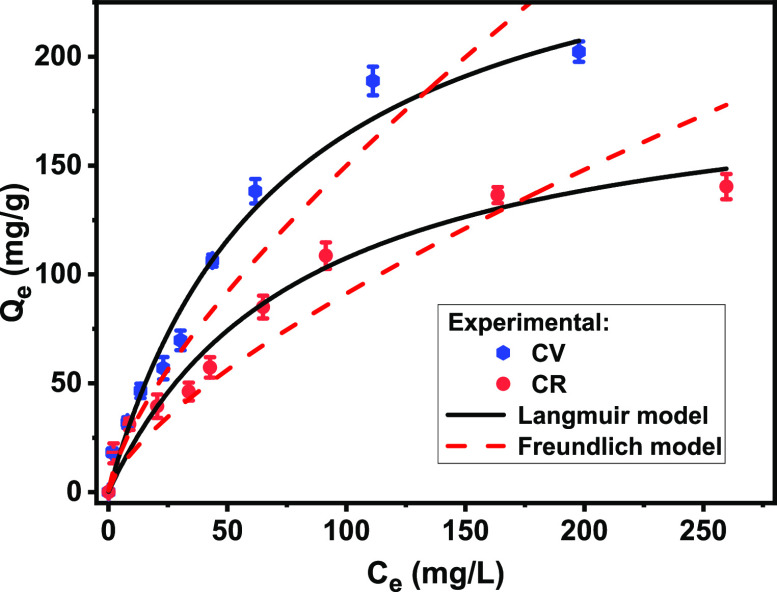
2.3.5. Biosorption Equilibrium
The fitting plots of Langmuir and Freundlich isotherm models for CV and CR biosorption on the CDA biosorbent are depicted in Figure 10. The isotherm parameters were graphically generated by nonlinear regression and are summarized in Table 5. Rendering R2 values (R2 = 0.996), the Langmuir model tailored better than the Freundlich model to experimental data for the biosorption of both dyes. In addition, it is notable that the theoretical maximum uptake capacities (calculated from the Langmuir isotherm) were satisfactorily adjusted to the practical values, confirming the Langmuir model adequacy for describing CV and CR biosorption onto CDA. Thus, we can say that the biosorption of both CV and CR onto the biosorbent is monolayer coverage on the energetically homogeneous binding sites according to the Langmuir model assumption. Besides, the comparison of obtained Qms for CV and CR demonstrates the high efficiency of CDA toward the cationic dye (Qm(CV) = 278.36 mg/g) compared to the anionic dye (Qm(CR) = 191.01 mg/g). This biosorption behavior could be rationalized by the strong affinity of the CDA surface toward the CV dye compared to the CR dye.
Figure 10.
Nonlinear regression of Langmuir and Freundlich models for CV and CR dye biosorption onto CDA. Conditions: equilibrium time = 120 min; pH = 6; adsorbent dose =1 g/L; temperature = 25 °C.
Table 5. Equilibrium Parameters of Langmuir and Freundlich Isotherms for CV and CR Dye Uptake onto CDA.
| isotherm | parameters | CV dye | CR dye |
|---|---|---|---|
| Langmuir | R2 | 0.986 | 0.984 |
| KL (L/mg) | 0.014 | 0.012 | |
| Qm (mg/g) | 283.18 | 195.06 | |
| RL | 0.152 ≤ RL ≤ 0.781 | 0.172 ≤ RL ≤ 0.806 | |
| Freundlich | R2 | 0.937 | 0.948 |
| nf | 1.41 | 1.43 | |
| Kf (mg/g) · (mg/L)−1/nf | 5.79 | 3.63 |
The maximum uptake capacity of CDA was compared to those of other materials available so far in the published literature to ensure a rich insight into the biosorption performance of our biosorbent material. From Table 6, it can conclude that CDA is revealed to have the highest ability to clean up wastewaters containing anionic and cationic dyes. Considering other criteria such as low cost, good mechanical properties, recyclability, and sustainability, CDA can be considered as a potential candidate for practical use in textile effluent decontamination.
Table 6. Comparison between Maximum CV and CR Dye Uptake Capacities for CDA and Other Materials Available in the Literature.
| maximum adsorption capacity (mg/g) |
|||
|---|---|---|---|
| adsorbent | CV | CR | ref |
| T. grandis sawdust | 131.58 | (32) | |
| diatomite earth and carbon | 87.05 | (64) | |
| bone char | 20.42 | (65) | |
| chitosan aniline composite | 100.6 | (66) | |
| peat | 8.16 | (67) | |
| yeast-treated peat | 17.95 | ||
| tea dust | 175.4 | (65) | |
| CS-NDIO | 104.66 | (68) | |
| IKaol | 5.74 | (69) | |
| DDAB-IKao | 83.0 | ||
| polyaniline | 250.01 | (70) | |
| polypyrrole | 66.66 | ||
| PANi/Bi2WO6 | 142.92 | (71) | |
| banana peel powder | 164.6 | (72) | |
| Fe3O4@SiO2-Cu-BTC | 64.4 | (73) | |
| natural clinoptilolite | 16.92 | (74) | |
| modified clinoptilolite | 200 | ||
| ZnO nanoparticles | 71.4 | (75) | |
| ZnCl2 activated carbon | 142.85 | 83.33 | (39) |
| CDA | 278.36 | 191.01 | current work |
2.3.6. Thermodynamic Study
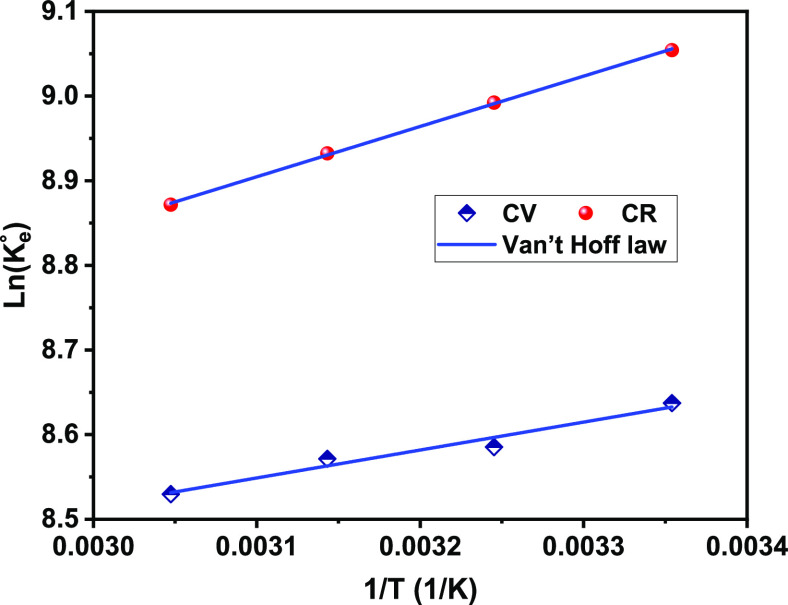
The van’t Hoff equation for biosorption of CV and CR dyes onto CDA is plotted in Figure 11, and the values of corresponding thermodynamic parameters are set in Table 7. The free energies exhibit negative (ΔG°) values in the studied temperature range, indicating that CV and CR were favorably and spontaneously adsorbed on the CDA surface. Furthermore, it was observed that the ΔG° values decreased with the rise of temperature from 298 to 328 K, which means that the biosorption process is more favorable at high temperatures. Moreover, the low biosorption-energy values revealed that the biosorption proceeded via a typical physisorption mechanism involving weak dye–CDA bonding.47,48 The negative ΔH° quantities (−2.742 and −4.941 kJ/mol for CV and CR dyes, respectively) demonstrate that the biosorption of both dyes onto the CDA biosorbent is exothermic. The ΔH° magnitudes are less than 40 kJ/mol, thereby further confirming the physical nature of the biosorption process.49 The ΔS° > 0 reflects an increase in the adsorbed dye disorder (degree of freedom) at the adsorbent–liquid interface of the CDA.
Figure 11.
Van’t Hoff plots for CV and CR dye uptake on the CDA suface.
Table 7. Values of Thermodynamic Constants for CV and CR Dye Biosorption onto the CDA Biosorbent.
| CV | CR | ||
|---|---|---|---|
| ΔH° (kJ/mol) | –2.742 | –4.941 | |
| ΔS° (J/mol·K) | 58.72 | 62.57 | |
| ΔG° (kJ/mol) | 298 K | –20.249 | –23.597 |
| 308 K | –20.837 | –24.222 | |
| 318 K | –21.424 | –24.848 | |
| 328 K | –22.011 | –25.474 | |
2.3.7. Regeneration
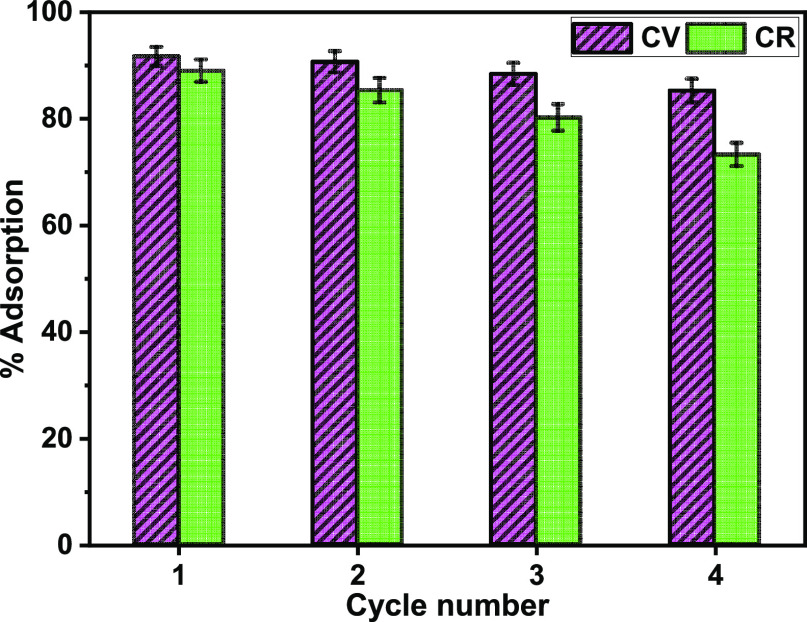
The evaluation of the reusability and recovery of the biosorbent is mostly required in the application of biosorption processes. The effect of eluent concentration on regeneration time and desorption efficiency of CV and CR dyes was investigated. From Table 8, it is observed that both CV and CR dyes were preferentially eluted with the increase in the concentration of HCl and NaOH eluents, respectively. This eluent concentration-dependent desorption efficiency can be ascribed to the increase in driving force for the recovery of CV and CR dyes loaded on the CDA biosorbent.50 Moreover, it is interesting to notice that the equilibrium desorption times become shorter with increasing eluent concentration from 0.1 to 1.0 M. This is probable since the mass diffusion rates of NaOH and HCl eluents across the pores of CDA improved when their concentrations were increased. Nonetheless, at low eluent concentration, the H+ and OH– ions required more time to diffuse and desorb the CV and CR adsorbed on the internal surface of CDA. Thus, to save time and costs of the CDA regeneration process, desorption experiments were performed for 60 min using 1 M of NaOH and HCl as the optimum eluent concentration for CR and CV, respectively. The recycling efficiency of the CDA biosorbent was examined for the decoloration of CV and CR for four cycles. From the results displayed in Figure 12, the CDA biosorbent has a high regeneration capacity for CV compared to CR. However, the uptake abilities decreased from 91.69 to 85.29% for CV and from 89.01 to 73.21% for CR dyes after four cycles. These findings are in agreement with the uncompleted recovery of CV and CR dyes adsorbed on the CDA surface. In this appraisal, we can conclude that the CDA biosorbent presents excellent reuse performance for both cationic and anionic dyes, which makes the CDA material highly promising as a recyclable and efficient biosorbent for purification of textile effluents.
Table 8. Effect of Eluent Concentration on the Regeneration Equilibrium Time and Desorption Performances of CV and CR Dyes.
| dye | eluent concentration | desorption equilibrium time (min) | desorption performance (%) |
|---|---|---|---|
| CV | 0.1 M (HCl) | 120 | 83.46 |
| 0.5 M (HCl) | 60 | 94.15 | |
| 1 M (HCl) | 60 | 98.02 | |
| CR | 0.1 M (NaOH) | 120 | 74.82 |
| 0.5 M (NaOH) | 90 | 86.33 | |
| 1 M (NaOH) | 60 | 90.41 |
Figure 12.
Removal of CV and CR dyes by CDA up to the 4th cycle.
2.3.8. Mechanism Proposal
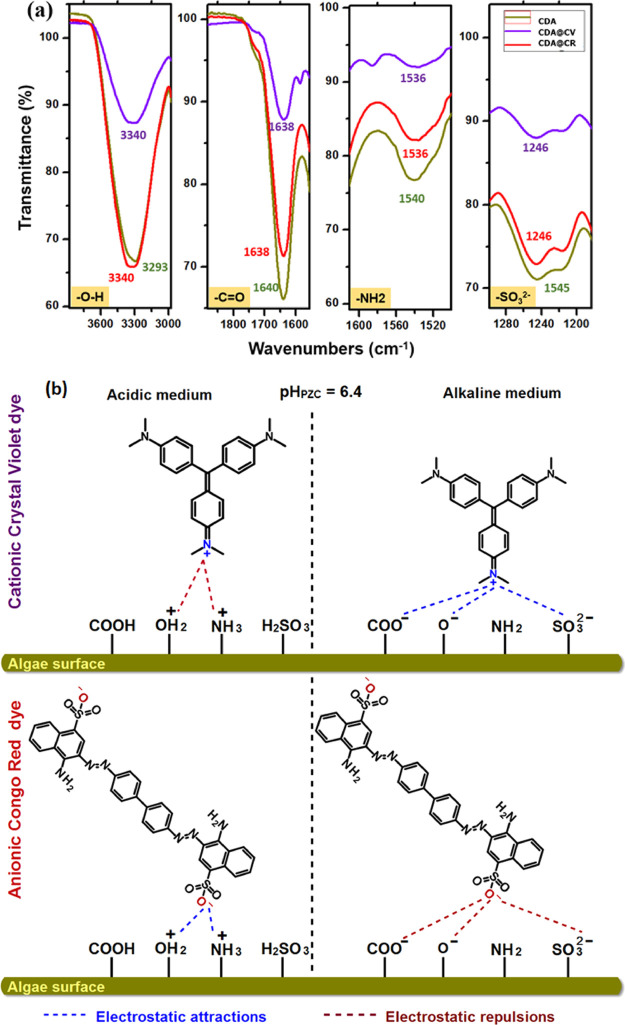
The biosorption mechanism of CV and CR has been further investigated by FTIR analysis. For the first time, CDA spectra before and after removal of CV and CR were taken to detect how functional groups of CDA interact with anionic and cationic dyes during the biosorption process. Figure 13a exhibits that the main functional groups on the CDA surface may be responsible for dye uptake. As previously noted, −OH, −C=O, −NH2 (amide), and SO32– are the main functional groups existing on the CDA surface. The broad peak observed at 3293 cm–1 was shifted to 3340 cm–1 after both CV and CR biosorption, which confirms that hydroxyl groups contribute to the biosorption. The intensity was decreased in the case of CDA@CV. These results explain that CV (positive charge) and CR (negative charge) interact with the hydroxyl groups on the CDA surface through oxygen and hydrogen bonding, respectively (Figure 13a). For the C=O, −NH2, and SO32– groups, a slight shift of 2–4 cm–1 was detected. Based on the study of the pH effect, it was found that the electrostatic interactions mainly governed the uptake mechanism of CV and CR dye molecules on the CDA surface. Thermodynamically, the binding energies indeed suggested that the physisorption process occurs during the removal of both anionic CR and cationic CV dyes, which is in good correlation with the formation of intermolecular electrostatic bonding at the solid/liquid interface. The schematic illustration depicted in Figure 13b shows the proposed biosorption mechanism.
Figure 13.
(a) Main functional groups by FTIR spectroscopy analysis of CDA before and after biosorption of CV and CR dyes. (b) Schematic presentation of the biosorption mechanism.
To further confirm the biosorption of CV and CR by CDA algae, SEM-EDS analysis was conducted to compare chemical composition (Figure S1). According to the analysis, carbon and oxygen peaks are more dominant followed by sulfur peaks and finally nitrogen, potassium, sodium, and chloride peaks. However, after CV and CR biosorption, the main element contents (carbon and oxygen) were notably increased, whereas the content of sulfur decreased, which suggests that this element plays a role in the biosorption process.38
2.4. RSM Statistical Optimization of the Biosorption Process
2.4.1. BBD Model Analysis
To evaluate the influence of selected key parameters on the biosorption efficiency of CV and CR dyes onto CDA, two second-order polynomial quadratic models were statistically established, employing RSM-BBD based on the observed experimental data. In this regard, the fitted RSM-BBD model equations for CV and CR dye removal are given in eqs 1 and 2 using coded units.
For the CV cationic dye
| 1 |
For the CR anionic dye
| 2 |
Based on ANOVA results (Table 9), the high statistical significance and usefulness of developed model equations for CV and CR biosorption were confirmed by a low p-value (less than 0.0001) as well as high adequate precision values (higher than 4).51,52 Furthermore, the determination coefficient (R2) values (higher than 0.99 for both CV and CR dyes) showed that less than 1% of the total variations of CV and CR removal efficiencies do not coincide with developed models. The high values of adjusted R2 demonstrate the higher predictive capability of RSM-BBD-based models for the CV and CR biosorption process. The difference between the values of adjusted R2 and predicted R2 is less than 0.2, which indicates a stronger consistency between actual and statistically predicted responses. Furthermore, the P values of lack-of-fit revealed that the lack-of-fit is significant, indicating good fitting of the developed models to the actual data for both CV and CR dyes. Additionally, the distribution of experimental data versus predicted values corresponding to the biosorption efficiencies of CV and CR dyes is given in Figure 14. As one can see, all points were distributed around the average line with minor deviation, suggesting good fitness of the generated quadratic models to the actual results. Thus, the designed models for predicting CV and CR dye removal were judged to be adequate.
Table 9. ANOVA Results for CV and CR Dye Biosorption onto CDA.
| response | source | sum of squares | degree of freedom | mean square | F-value | probability (prob > F) |
|---|---|---|---|---|---|---|
| CV dye removal | model | 7026.00 | 9 | 780.67 | 540.53 | <0.0001 (significant) |
| A - C0 | 826.41 | 1 | 826.41 | 572.20 | <0.0001 | |
| B - pH | 4128.68 | 1 | 4128.68 | 2858.67 | <0.0001 | |
| C - adsorbent dose | 553.61 | 1 | 553.61 | 383.32 | <0.0001 | |
| AB | 0.29 | 1 | 0.29 | 0.2019 | 0.6668 | |
| AC | 18.97 | 1 | 18.97 | 13.13 | 0.0085 | |
| BC | 174.50 | 1 | 174.50 | 120.83 | <0.0001 | |
| A2 | 35.16 | 1 | 35.16 | 24.35 | 0.0017 | |
| B2 | 1234.41 | 1 | 1234.41 | 845.70 | <0.0001 | |
| C2 | 9.22 | 1 | 9.22 | 6.38 | 0.0394 | |
| residual | 10.11 | 7 | 1.44 | |||
| lack-of-fit | 9.79 | 3 | 3.26 | 40.94 | 0.0018 | |
| pure error | 0.32 | 4 | 0.08 | |||
| cor total | 7036.11 | 16 | ||||
| R2 = 0.9986; Adj. R2 = 0.9967; Pred. R2 = 0.9777; Adeq precision = 74.68 | ||||||
| CR dye removal | model | 7677.99 | 9 | 853.11 | 79.62 | <0.0001 (significant) |
| A - C0 | 1348.62 | 1 | 1348.62 | 125.86 | <0.0001 | |
| B- pH | 3956.50 | 1 | 3956.50 | 369.25 | <0.0001 | |
| C - adsorbent dose | 1507.01 | 1 | 1507.01 | 140.65 | <0.0001 | |
| AB | 2.04 | 1 | 2.04 | 0.19 | 0.6754 | |
| AC | 20.57 | 1 | 20.57 | 1.92 | 0.2085 | |
| BC | 87.89 | 1 | 87.89 | 8.20 | 0.0242 | |
| A2 | 609.50 | 1 | 609.50 | 56.88 | 0.0001 | |
| B2 | 92.16 | 1 | 92.16 | 8.60 | 0.0219 | |
| C2 | 62.38 | 1 | 62.38 | 5.82 | 0.0466 | |
| residual | 75.00 | 7 | 10.71 | |||
| lack-of-fit | 72.15 | 3 | 24.05 | 33.66 | 0.0027 | |
| pure error | 2.86 | 4 | 0.71 | |||
| cor total | 7753.00 | 16 | ||||
| R2 = 0.9903; Adj. R2 = 0.9779; Pred. R2 = 0.8505; Adeq precision = 30.03 | ||||||
Figure 14.
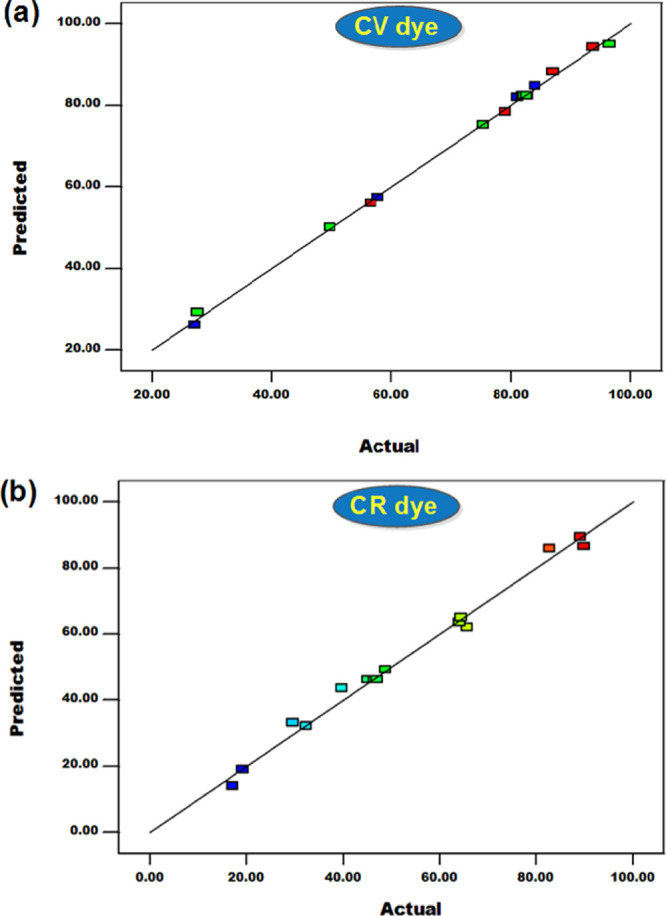
Plots of actual versus predicted values of the removal efficiency for (a) CV and (b) CR dyes on the CDA.
The significance of model terms was examined using their p-values at a confidence level of 95% (p-value <0.05). All model terms had shown a profound effect on the CV biosorption process, except the reciprocate interaction between initial CV concentration and pH. For CR dye removal, all linear coefficients (A, B, and C), one interaction coefficient (BC), and all quadratic coefficients (A2, B2, and C2) possess a significant influence on the biosorption efficiency. The AB and AC interaction terms are found to be statically insignificant. From eq 1, the positive sign of B (direct effect of pH), C (direct effect of adsorbent dose), AB (reciprocate effect between initial CV concentration and pH), and AC (reciprocate effect between initial CV concentration and adsorbent dose) terms reveals a synergistic effect in the increase of CV dye removal. In the case of CR biosorption, a synergistic effect of C, AB, AC, A2, and C2 terms in eq 2 was highlighted by their positive coefficient values. The other model terms exhibited antagonistic effects. The ability of each input operational factor to affect the biosorption process was investigated based on the model coefficient values. As expected, the forcefulness of the considered factors in the CV dye biosorption process may be graded as follows: pH > CV concentration > adsorbent dose. For CR, the importance of the influential process parameters was increased as pH > adsorbent dose > CR concentration. The interactive effect between CDA dosage and pH exhibits the most significant impact on the removal of both CR and CV dyes.
2.4.2. Binary Effects of Input Variables on Removal Efficiency
3D graphical illustrations were plotted to visualize the effects of input variables on the CV and CR dye biosorption process as well as to determine the optimal conditions. The surface curves versus any two variables were generated by keeping the third variable at its central point. The interaction effects of dye concentration and pH on the CV and CR uptake on the CDA are presented in Figure 15a,b. For both CV and CR dyes, it was seen that the removal efficiency reduces when the dye concentration increases from 20 to 60 mg/L. This biosorption behavior probably results in the saturation of binding sites at higher initial concentrations of CV and CR dyes. The pH of solution strongly influenced the removal efficiency of CV and CR dyes. The removal of the CR dye as an anionic compound is favorable in the acidic medium due to the positive charge of the CDA surface. In contrast, the CV cationic dye was adsorbed more effectively under basic conditions as a result of the strong, attractive electrostatic forces between CV molecules and the adsorbent surface. Under the optimum conditions (pH 10 for CV dye, pH 4 for CR, and 20 mg/L dye concentration), the CV and CR dyes were decolorized by CDA up to 96.9 and 89.8%, respectively. The binary influence of CDA dosage and dye concentration is illustrated in Figure 15c,d. As shown, the CV and CR dyes tend to have relatively similar behavior. The biosorption efficiency increased with increasing CDA dosage (increase in the active sites) and decreasing dye concentration. The optimal CV (85.8%) and CR (94.4%) decoloration was found at a high CDA dose (1.5 g/L) and low initial concentration (20 mg/L). The simultaneous effects of pH and CDA dose on the removal efficiencies of CV and CR dyes are exhibited in Figure 15e,f. As Figure 15e shows, the simultaneous increase in both CDA dose and pH leads to a significant improvement of the CV dye decolorization percentage. The optimal percent CV dye removal (about 90%) was achieved at a pH value of 10 and CDA biosorbent dosage of 1.5 g/L. From Figure 15f, in a strongly alkaline solution (pH 10), the removal of CV is slightly influenced by increasing the CDA amount added. However, the CR dye removal percentage was remarkably increased with the increase in the adsorbent dose under acidic conditions (pH 2) and reached its maximum value (83.5%).
Figure 15.

3D surface plots illustrating binary combined effects of input variables on the dye decoloration percentage: (a) dye concentration and pH (CV); (b) dye concentration and pH (CR); (c) dye concentration and CDA dose (CV); (d) dye concentration and CDA dose (CR); (e) pH and CDA dose (CV) and (f) pH and CDA dose (CR).
Overall, the optimized conditions were a concentration of 20 mg/L, pH of 10 for the CV dye, pH of 4 for the CR dye, and a biosorbent dose of 1.5 g/L. In optimal conditions, the predicted points of highest removal efficiencies were found to be 96.9 and 89.8% for CV and CR, respectively. The experimental values of the removal percentage were obtained to be 96.46% for CV and 89.12% for CR, indicating that the designed RSM-BBD model is reliable to reasonably predict the biosorption process.
3. Materials and Methods
3.1. Chemicals
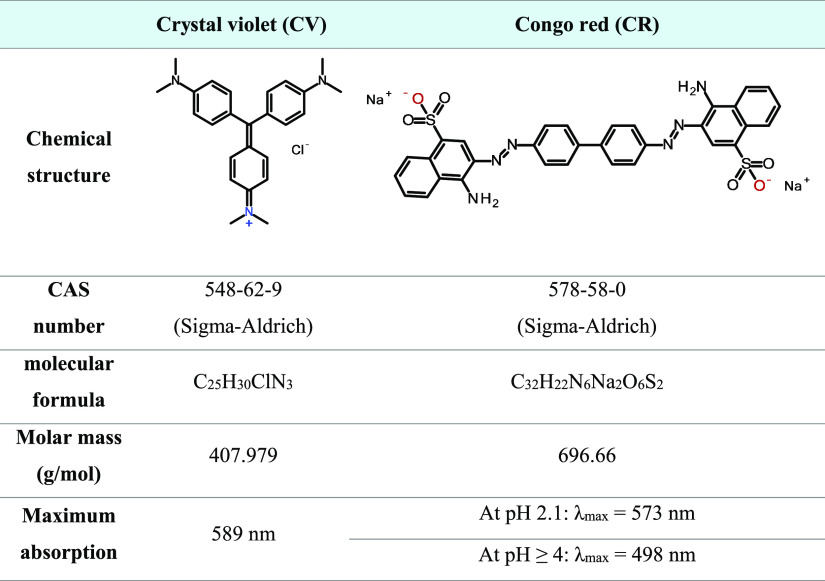
Crystal violet and Congo red dyes were selected as the model pollutants in this work. NaOH and HCl were used as pH adjusters and desorption eluents. All the reagents used were of high purity received from Sigma Aldrich. Table 1 shows the chemical structures, molecular formula, molar masses, and maximum absorption of both CV and CR dyes.
Table 1. Chemical Properties of CV and CR Dyes.
3.2. Collection and Identification of Algae
The seaweed was collected by hand in shallow water in spring 2019 (April 6, 2019) from Agadir bay in Cap Ghir 30°38′57.8″N 9°53′17.7″W). The samples were cleaned with local seawater, then conserved in plastic bottles containing seawater, and immediately transported in iceboxes. The collected algae were thoroughly washed with seawater to remove epiphyte and epifauna. Salt excess, sand, and adhering impurities were eliminated by washing with distilled water. Collected seaweeds were dried in a drying oven at 40 ° C for 48 h, crushed, and sieved with 160 μm mesh to obtain uniform particles (Figure 1). Fresh and dry weights of the material were also measured. A fragment of each individual was kept in 5% formaldehyde seawater and absolute ethanol and then was disposed with personal collections for further studies [JAO-UIZ (C1 & C2)]. The identification of Codium species was based on morphological and anatomical details following the keys reported in the literature.53,54 Both details were photographed with a Panasonic Lumix FZ28 camera and light microscope (Olympus CX41) connected to a camera (ToupCam) using ToupView software v.3.7.3317.
Figure 1.
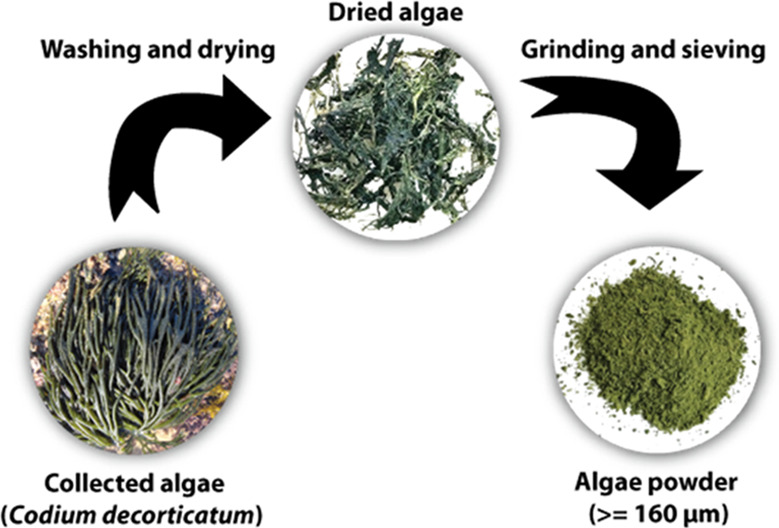
Process of biological material preparation.
3.3. Characterization
Fourier transform infrared (FTIR) spectroscopy measurements were taken using a Thermo Scientific Nicolet iS10 spectrometer equipped with an ATR accessory in the range of 400–4000 cm–1. The scanning electron microscopy (SEM) pictures were captured using a JEOL JSM-IT 100 microscope equipped with a microanalyzer (EDAX) at 120 kV. Thermogravimetric analysis was conducted using TGA from TA Instruments. The pH of the point of zero charge (pHPZC) of CDA was identified by potentiometric titration according to the procedure reported by Tahir et al.55 The experimental measurement of the pHPZC value was conducted by suspending 0.15 g of CDA in a series of 50 mL of NaCl (0.01 M) electrolytic solution. The solution pH (pHi) was adjusted over the range of 2–12 using hydrochloric acid and sodium hydroxide solutions. The mixtures were stirred for 48 h at room temperature. The final pH (pHf) was determined, and the pHPZC of CDA was identified as the pH value when the adsorbent surface proton charge is neutral (pHf = pHi).
3.4. Batch Biosorption Procedure and Data Analysis
The batch biosorption tests were performed by adding an appropriate amount of CDA into glass beakers containing 50 mL of CV or CR dyes. All biosorption experiments of CV and CR dyes onto CDA were carried out separately using monocomponent dye solutions. The impact of operational factors like pH of the solution (from 2.1 to 11.8), CDA dose (from 0.1 to 2 g/L), initial dye concentration (from 20 to 400 mg/L), biosorption time (from 0 to 240 min), and temperature (from 25 to 55 °C) has been studied on the extent of CV and CR dye removal. The initial pH was adjusted by adding a few drops of concentrated HCl or NaOH solutions. After each biosorption experiment, the adsorbent was separated by filtration on a 0.45 μm membrane filter. A UV-2300 spectrophotometer was used to quantify the dye concentration of the filtrate at the maximum absorption wavelengths of CV and CR dyes presented in Table 1. The uptake capacity (Qe) and removal efficiency (%R) were calculated using
| 3 |
| 4 |
where C0 and Ce are dye concentrations (mg/L) before and after biosorption, respectively, m (g) is the mass of the CDA, and V (L) is the volume of adsorbate solution.
In the present study, the experimental kinetic data for adsorption of CV and CR dyes on the CDA surface were analyzed using pseudo-first-order,56 pseudo-second-order,57 and intraparticle diffusion58 models, which are expressed according to the following equations:
| 5 |
| 6 |
| 7 |
In eqs 5–7, Qt (mg/g) is the experimental uptake capacity at time t (min); Qe (mg/g) is the theoretical biosorption capacity at equilibrium calculated by kinetic models; β (mg/g) is the intraparticle diffusion model constant related to the thickness of the boundary layer; k1 (1/min), k2 (mg/g·min), and kint (mg/g·min0.5) are the biosorption rate constants of pseudo-first-order, pseudo-second-order, and intraparticle diffusion, respectively.
Langmuir and Freundlich isotherms were used to describe the interactions between the CV and CR dyes and the CDA biosorbent when the adsorbent–adsorbate equilibrium is reached. The Langmuir isotherm model is based on the assumption that the biosorption mechanism occurs as a monolayer coverage of adsorbate molecules on the same binding sites distributed homogeneously throughout the adsorbent surface, without intermolecular interactions between adsorbed species.59 The Freundlich isotherm model suggests that the biosorption process tends to be multiple layers over the heterogeneous adsorbent surface with different affinities of active sites.60 The following formulas give the expressions of Langmuir and Freundlich models
| 8 |
| 9 |
In eqs 8 and 9, Ce (mg/L) is the equilibrium dye concentration, Qe (mg/g) is the equilibrium uptake capacity, Qm (mg/g) represents the maximum monolayer uptake capacity, KL (L/mg) is the Langmuir constant, KF is the equilibrium constant of the Freundlich isotherm related to uptake capacity, and nf is the factor heterogeneity.
The values of crucial thermodynamic parameters such as Gibbs free energy change (ΔG°), enthalpy change (ΔH°), and entropy change (ΔS°) are determined by applying the van’t Hoff law (eq 10) to biosorption experimental data at different temperatures.44
| 10 |
The equilibrium constant (Ke°) was expressed as61,62
| 11 |
where KL (L/mg) is the Langmuir equilibrium constant, R is the universal gas constant (8.314 J/K·mol), T is the investigated temperature in Kelvin, M(Adsorbate) is the molecular weight of the dye, γ represents the coefficient of activity, and [Adsorbate]° denotes the standard concentration of the solute (1 mol/L).
3.5. Design of Experiments and Statistical Analysis
The statistical modeling of CV and CR dye biosorption processes on the CDA was performed using RSM implemented in Expert Design 8.0.4.1 software. BBD is one of the most widely employed designs in RSM modeling. BBD is an adequate second-order design in a three-level approach, which may be an efficient, inexpensive, and promising alternative to central composite design (CCD) because BBD requires fewer experimental runs than a CCD to investigate an engineering process.42 Based on preliminary experiments from the conventional single-factor-at-a-time study, the output response (dye removal efficiency) was statistically investigated using RSM based on three-level BBD as a function of three critical parameters like initial pH, initial dye concentration, and adsorbent dose. For each dye, a design matrix of 17 biosorption tests and corresponding responses are given in Table 2. Five replications were conducted at the center points of the design for predicting standard error. The biosorption process optimization of CV and CR dyes onto CDA was carried out using the following second-order polynomial model63
| 12 |
Table 2. Experimental Levels of Selected Influential Process Parameters and Three-Factor BBD Matrix for CV and CR Dye Removal.
| |
level |
|||
|---|---|---|---|---|
| variable name | unit | lowest (−1) | middle (0) | highest (+1) |
| A: dye concentration | mg/L | 20 | 40 | 60 |
| B: pH | 4 | 7 | 10 | |
| C: adsorbent dose | g/L | 0.5 | 1.0 | 1.5 |
| experimental R (%) |
|||||
|---|---|---|---|---|---|
| run number | A | B | C | CV | CR |
| 1 | –1 | –1 | 0 | 49.82 | 89.12 |
| 2 | +1 | –1 | 0 | 27.64 | 65.74 |
| 3 | –1 | +1 | 0 | 96.46 | 39.78 |
| 4 | +1 | +1 | 0 | 75.36 | 19.26 |
| 5 | –1 | 0 | –1 | 81.15 | 64.11 |
| 6 | +1 | 0 | –1 | 57.78 | 29.59 |
| 7 | –1 | 0 | +1 | 93.79 | 89.88 |
| 8 | +1 | 0 | +1 | 79.13 | 64.43 |
| 9 | 0 | –1 | –1 | 27.14 | 48.83 |
| 10 | 0 | +1 | –1 | 84.04 | 17.16 |
| 11 | 0 | –1 | +1 | 56.63 | 82.80 |
| 12 | 0 | +1 | +1 | 87.11 | 32.38 |
| 13 | 0 | 0 | 0 | 82.16 | 46.67 |
| 14 | 0 | 0 | 0 | 82.66 | 45.35 |
| 15 | 0 | 0 | 0 | 82.02 | 45.10 |
| 16 | 0 | 0 | 0 | 82.22 | 46.48 |
| 17 | 0 | 0 | 0 | 82.60 | 47.01 |
In eq 12, Y is the response model (dye removal percentage), α0 presents the constant-coefficient, αi (linear coefficient) presents the direct effect, αii (quadratic coefficient) presents the higher-order effect, and αij (interaction coefficient) presents the reciprocate effect.
The nonlinear response surface regression was employed to fit the above-presented model to the experimental data as well as to determine the values of model terms. The validity of the developed models was evaluated using analysis of variance (ANOVA). The significance of the proposed polynomial model was tested using a significant probability value (p-value) at a confidence interval of 95%. Additionally, the determination coefficient (R2) value must be nearly 1 to confirm the appropriateness of the proposed model for describing the biosorption process. The response surfaces were generated and plotted in three dimensions (3D) to visualize the relationship between the process parameters and response as well as to identify the optimum conditions.
3.6. Regeneration Study
The regeneration of the CDA was performed using different concentrations (0.1, 0.5, and 1.0 M) of HCl and NaOH solutions as eluents for desorption of cationic CV and anionic CR dyes, respectively. Desorption experiments were conducted by mixing 0.5 g of dye-loaded CDA with 50 mL of eluent at 25 °C. The regeneration equilibrium time was investigated as a function of eluent concentration. The regeneration performance is calculated using the following equation
| 13 |
The regenerated CDA biosorbent was separated, then thoroughly washed with water, and finally dried at 60 °C for 3 h. The recovered material was further subjected to biosorption experiments. This regeneration procedure was repeated up to four successive cycles. The loss of adsorbent mass after each regeneration cycle was taken into account by the same adsorbent/solution ratio for further use for biosorption.
4. Conclusions
In this study, the C. decorticatum algae was successfully isolated, biologically identified, and then used as a reusable and cost-effective biosorbent of CV and CR dyes in aqueous media. FTIR analysis exhibited that the chemical structure of isolated CDA contains several functional groups such as hydroxyl, amine, sulfur, and carboxyl groups. These functional groups play a critical role in anionic and cationic dye uptaking due to the electrostatic affinities. The regeneration study reveals that the CDA acts as a recyclable biosorbent for CV and CR dye removal. The biosorption process was statistically modeled and optimized using RSM based on BBD. The established quadratic models for CV and CR dye removal by CDA have good predictability and reliability regarding experimental data. Accordingly, the optimum predicted removal efficiencies for CV and CR were obtained, respectively, at 96.9 and 89.8% using a CDA dose of 1.5 g/L, dye concentration of 20 mg/L, pH of 10 for CV, and pH of 4 for CR. Finally, the CDA material could be employed for an effective clean-up of dye contamination due to its high biosorption capacity, sustainability, good reusability, economic benefit, easy availability, and renewable nature.
Acknowledgments
We thank Professor Elgherib Redouane, responsible of SEM analysis in the research center, Faculty of Sciences, Ibn Zohr University, Agadir, Morocco. Many thanks to Professor Rosa M Viejo, Universidad Rey Juan Carlos, Móstoles, Spain, for the biological data. Many thanks to Chakib Tilsaghani and Ismail Bennani from Moroccan Foundation for Advanced Science, Innovation and Research for their technical services.
Supporting Information Available
The Supporting Information is available free of charge at https://pubs.acs.org/doi/10.1021/acsomega.0c02311.
Figure S1: SEM-EDS spectra of CDA after adsorption of (a) CR and (b) CV dyes (PDF)
The authors declare no competing financial interest.
Supplementary Material
References
- Landrigan P. J.; Fuller R.; Fisher S.; Suk W. A.; Sly P.; Chiles T. C.; et al. Pollution and children’s health. Sci. Total Environ. 2019, 650, 2389–2394. 10.1016/j.scitotenv.2018.09.375. [DOI] [PubMed] [Google Scholar]
- Mitra A.Estuarine pollution in the lower Gangetic delta: Threats and management; Springer: 2019, 10.1007/978-3-319-93305-4. [DOI] [Google Scholar]
- Altaf A.; Noor S.; Sharif Q. M.; Najeebullah M. Different techniques recently used for the treatment of textile dyeing effluents: A review. J. Chem. Soc. Pak. 2010, 32, 115–116. [Google Scholar]
- Lellis B.; Fávaro-Polonio C. Z.; Pamphile J. A.; Polonio J. C. Effects of textile dyes on health and the environment and bioremediation potential of living organisms. Biotechnol. Res. Innovation 2019, 275. 10.1016/j.biori.2019.09.001. [DOI] [Google Scholar]
- Rehman K.; Shahzad T.; Sahar A.; Hussain S.; Mahmood F.; Siddique M. H.; et al. Effect of Reactive Black 5 azo dye on soil processes related to C and N cycling. PeerJ 2018, 6, e4802 10.7717/peerj.4802. [DOI] [PMC free article] [PubMed] [Google Scholar]
- Imran M.; Crowley D. E.; Khalid A.; Hussain S.; Mumtaz M. W.; Arshad M. Microbial biotechnology for decolorization of textile wastewaters. Rev. Environ. Sci. BioTechnol. 2015, 14, 73–92. 10.1007/s11157-014-9344-4. [DOI] [Google Scholar]
- Saffaj N.; Loukili H.; Younssi S. A.; Albizane A.; Bouhria M.; Persin M.; et al. Filtration of solution containing heavy metals and dyes by means of ultrafiltration membranes deposited on support made of Moroccan clay. Desalination 2004, 168, 301–306. 10.1016/j.desal.2004.07.013. [DOI] [Google Scholar]
- Riera-Torres M.; Gutiérrez-Bouzán C.; Crespi M. Combination of coagulation–flocculation and nanofiltration techniques for dye removal and water reuse in textile effluents. Desalination 2010, 252, 53–59. 10.1016/j.desal.2009.11.002. [DOI] [Google Scholar]
- Davis R. J.; Gainer J. L.; O’Neal G.; Wu I.-W. Photocatalytic decolorization of wastewater dyes. Water Environ. Res. 1994, 66, 50–53. 10.2175/WER.66.1.8. [DOI] [Google Scholar]
- Koyuncu I. Reactive dye removal in dye/salt mixtures by nanofiltration membranes containing vinylsulphone dyes: effects of feed concentration and cross flow velocity. Desalination 2002, 143, 243–253. 10.1016/S0011-9164(02)00263-1. [DOI] [Google Scholar]
- Anfar Z.; Zbair M.; Ahsaine H. A.; Abdellaoui Y.; El Fakir A. A.; Amaterz E. H.; et al. Preparation and Characterization of Porous Carbon@ZnO-NPs for Organic Compounds Removal: Classical Adsorption Versus Ultrasound Assisted Adsorption. ChemistrySelect 2019, 4, 4981–4994. 10.1002/slct.201901043. [DOI] [Google Scholar]
- Asgher M. Biosorption of reactive dyes: a review. Water, Air, Soil Pollut. 2012, 223, 2417–2435. 10.1007/s11270-011-1034-z. [DOI] [Google Scholar]
- Veglio’ F.; Beolchini F. Removal of metals by biosorption: a review. Hydrometallurgy 1997, 44, 301–316. 10.1016/S0304-386X(96)00059-X. [DOI] [Google Scholar]
- Alshameri A.; He H.; Zhu J.; Xi Y.; Zhu R.; Ma L.; et al. Adsorption of ammonium by different natural clay minerals: Characterization, kinetics and adsorption isotherms. Appl. Clay Sci. 2018, 159, 83–93. 10.1016/j.clay.2017.11.007. [DOI] [Google Scholar]
- Errais E.; Duplay J.; Darragi F.; M’Rabet I.; Aubert A.; Huber F.; et al. Efficient anionic dye adsorption on natural untreated clay: Kinetic study and thermodynamic parameters. Desalination 2011, 275, 74–81. 10.1016/j.desal.2011.02.031. [DOI] [Google Scholar]
- Abdellaoui Y.; Olguín M. T.; Abatal M.; Ali B.; Díaz Méndez S. E.; Santiago A. A. Comparison of the divalent heavy metals (Pb, Cu and Cd) adsorption behavior by montmorillonite-KSF and their calcium- and sodium-forms. Superlattices Microstruct. 2018, 165. 10.1016/j.spmi.2017.11.061. [DOI] [Google Scholar]
- Abdellaoui Y.; Olguin M. T.; Abatal M.; Bassam A.; Giácoman-Vallejo G. Relationship between Si/Al ratio and the sorption of Cd(II) by natural and modified clinoptilolite-rich tuff with sulfuric acid. Desalin. Water Treat. 2019, 150, 157–165. 10.5004/dwt.2019.23792. [DOI] [Google Scholar]
- Boeykens S. P.; Redondo N.; Obeso R. A.; Caracciolo N.; Vázquez C. Chromium and Lead adsorption by avocado seed biomass study through the use of Total Reflection X-Ray Fluorescence analysis. Appl. Radiat. Isot. 2019, 153, 108809. 10.1016/j.apradiso.2019.108809. [DOI] [PubMed] [Google Scholar]
- Amela K.; Hassen M. A.; Kerroum D. Isotherm and kinetics study of biosorption of cationic dye onto banana peel. Energy Procedia 2012, 19, 286–295. 10.1016/j.egypro.2012.05.208. [DOI] [Google Scholar]
- El Nemr A.; Abdelwahab O.; Khaled A.; El Sikaily A. Biosorption of Direct Yellow 12 from aqueous solution using green alga Ulva lactuca. Chem. Ecol. 2006, 22, 253–266. 10.1080/02757540600812875. [DOI] [Google Scholar]
- Aravindhan R.; Rao J. R.; Nair B. U. Removal of basic yellow dye from aqueous solution by sorption on green alga Caulerpa scalpelliformis. J. Hazard. Mater. 2007, 142, 68–76. 10.1016/j.jhazmat.2006.07.058. [DOI] [PubMed] [Google Scholar]
- Aksu Z.; Tezer S. Biosorption of reactive dyes on the green alga Chlorella vulgaris. Process Biochem. 2005, 40, 1347–1361. 10.1016/j.procbio.2004.06.007. [DOI] [Google Scholar]
- Salima A.; Benaouda B.; Noureddine B.; Duclaux L. Application of Ulva lactuca and Systoceira stricta algae-based activated carbons to hazardous cationic dyes removal from industrial effluents. Water Res. 2013, 47, 3375–3388. 10.1016/j.watres.2013.03.038. [DOI] [PubMed] [Google Scholar]
- Khataee A. R.; Vafaei F.; Jannatkhah M. Biosorption of three textile dyes from contaminated water by filamentous green algal Spirogyra sp.: Kinetic, isotherm and thermodynamic studies. Int. Biodeterior. Biodegrad. 2013, 83, 33–40. 10.1016/j.ibiod.2013.04.004. [DOI] [Google Scholar]
- Benhissoune S.; Boudouresque C.-F.; Perret-Boudouresque M.; Verlaque M. A checklist of the seaweeds of the Mediterranean and Atlantic coasts of Morocco. IV. Rhodophyceae - Ceramiales. Bot. Mar. 2003, 46, 55–68. 10.1515/BOT.2003.008. [DOI] [Google Scholar]
- Benhissoune S.; Boudouresque C.-F.; Verlaque M. A checklist of the seaweeds of the Mediterranean and Atlantic coasts of Morocco. II. Phaeophyceae. Bot. Mar. 2002, 45, 217–230. 10.1515/BOT.2002.021. [DOI] [Google Scholar]
- Benhissoune S.; Boudouresque C.-F.; Verlaque M. A check-list of marine seaweeds of the Mediterranean and Atlantic coasts of Morocco. I. Chlorophyceae wille s. l.. Bot. Mar. 2001, 44, 171–182. 10.1515/BOT.2001.023. [DOI] [Google Scholar]
- El Achaby M.; Kassab Z.; Aboulkas A.; Gaillard C.; Barakat A. Reuse of red algae waste for the production of cellulose nanocrystals and its application in polymer nanocomposites. Int. J. Biol. Macromol. 2018, 106, 681–691. 10.1016/j.ijbiomac.2017.08.067. [DOI] [PubMed] [Google Scholar]
- McHugh D. J. Worldwide distribution of commercial resources of seaweeds including Gelidium. Hydrobiologia 1991, 221, 19–29. 10.1007/BF00028359. [DOI] [Google Scholar]
- Paiva L.; Lima E.; Neto A. I.; Marcone M.; Baptista J. Nutritional and Functional Bioactivity Value of Selected Azorean Macroalgae: Ulva compressa, Ulva rigida, Gelidium microdon, and Pterocladiella capillacea. J. Food Sci. 2017, 82, 1757–1764. 10.1111/1750-3841.13778. [DOI] [PubMed] [Google Scholar]
- Abdala Díaz R. T.; Casas Arrojo V.; Arrojo Agudo M. A.; Cárdenas C.; Dobretsov S.; Figueroa F. L. Immunomodulatory and Antioxidant Activities of Sulfated Polysaccharides from Laminaria ochroleuca, Porphyra umbilicalis, and Gelidium corneum. Mar. Biotechnol. 2019, 577. 10.1007/s10126-019-09905-x. [DOI] [PubMed] [Google Scholar]
- Klančnik A.; Piskernik S.; Jeršek B.; Možina S. S. Evaluation of diffusion and dilution methods to determine the antibacterial activity of plant extracts. J. Microbiol. Methods 2010, 81, 121–126. 10.1016/j.mimet.2010.02.004. [DOI] [PubMed] [Google Scholar]
- Mondal N. K.; Samanta A.; Dutta S.; Chattoraj S. Optimization of Cr (VI) biosorption onto Aspergillus niger using 3-level Box-Behnken design: equilibrium, kinetic, thermodynamic and regeneration studies. J. Genet. Eng. Biotechnol. 2017, 15, 151–160. 10.1016/j.jgeb.2017.01.006. [DOI] [PMC free article] [PubMed] [Google Scholar]
- Ahmadi A.; Heidarzadeh S.; Mokhtari A. R.; Darezereshki E.; Harouni H. A. Optimization of heavy metal removal from aqueous solutions by maghemite (γ-Fe2O3) nanoparticles using response surface methodology. J. Geochem. Explor. 2014, 147, 151–158. 10.1016/j.gexplo.2014.10.005. [DOI] [Google Scholar]
- Narenderan S. T.; Meyyanathan S. N.; Karri V. V. S. R. Experimental design in pesticide extraction methods: A review. Food Chem. 2019, 384. 10.1016/j.foodchem.2019.03.045. [DOI] [PubMed] [Google Scholar]
- Amini M.; Younesi H.; Bahramifar N.; Lorestani A. A. Z.; Ghorbani F.; Daneshi A.; et al. Application of response surface methodology for optimization of lead biosorption in an aqueous solution by Aspergillus niger. J. Hazard. Mater. 2008, 154, 694–702. 10.1016/j.jhazmat.2007.10.114. [DOI] [PubMed] [Google Scholar]
- Tran H. T.; Vu N. D.; Matsukawa M.; Okajima M.; Kaneko T.; Ohki K.; et al. Heavy metal biosorption from aqueous solutions by algae inhabiting rice paddies in Vietnam. J. Environ. Chem. Eng. 2016, 4, 2529–2535. 10.1016/j.jece.2016.04.038. [DOI] [Google Scholar]
- Ohki K.; Le N. Q. T.; Yoshikawa S.; Kanesaki Y.; Okajima M.; Kaneko T.; et al. Exopolysaccharide production by a unicellular freshwater cyanobacterium Cyanothece sp. isolated from a rice field in Vietnam. J. Appl. Phycol. 2014, 26, 265–272. 10.1007/s10811-013-0094-4. [DOI] [Google Scholar]
- Mashkoor F.; Nasar A.; Inamuddin; Asiri A. M. Exploring the reusability of synthetically contaminated wastewater containing crystal violet dye using Tectona grandis sawdust as a very low-cost adsorbent. Sci. Rep. 2018, 8, 8314. 10.1038/s41598-018-26655-3. [DOI] [PMC free article] [PubMed] [Google Scholar]
- Doke K. M.; Yusufi M.; Joseph R. D.; Khan E. M. Comparative adsorption of crystal violet and congo red onto ZnCl2 activated carbon. J. Dispersion Sci. Technol. 2016, 37, 1671–1681. 10.1080/01932691.2015.1124342. [DOI] [Google Scholar]
- Zhang X.; Li Y.; Li M.; Zheng H.; Du Q.; Li H.; et al. Preparation of improved gluten material and its adsorption behavior for congo red from aqueous solution. J. Colloid Interface Sci. 2019, 556, 249–257. 10.1016/j.jcis.2019.08.037. [DOI] [PubMed] [Google Scholar]
- Ahmed M.; Mashkoor F.; Nasar A. Development, characterization, and utilization of magnetized orange peel waste as a novel adsorbent for the confiscation of crystal violet dye from aqueous solution. Groundwater Sustainable Dev. 2020, 10, 100322. 10.1016/j.gsd.2019.100322. [DOI] [Google Scholar]
- Laabd M.; Chafai H.; Aarab N.; El Jaouhari A.; Bazzaoui M.; Kabli H.; et al. Polyaniline films for efficient removal of aromatic acids from water. Environ. Chem. Lett. 2016, 14, 395–400. 10.1007/s10311-016-0569-z. [DOI] [Google Scholar]
- Zolgharnein J.; Rastgordani M. Optimization of simultaneous removal of binary mixture of indigo carmine and methyl orange dyes by cobalt hydroxide nano-particles through Taguchi method. J. Mol. Liq. 2018, 262, 405–414. 10.1016/j.molliq.2018.04.038. [DOI] [Google Scholar]
- Hu H.; Liu J.; Xu Z.; Zhang L.; Cheng B.; Ho W. Hierarchical porous Ni/Co-LDH hollow dodecahedron with excellent adsorption property for Congo red and Cr(VI) ions. Appl. Surf. Sci. 2019, 478, 981–990. 10.1016/j.apsusc.2019.02.008. [DOI] [Google Scholar]
- Yusof N. H.; Foo K. Y.; Wilson L. D.; Hameed B. H.; Hussin M. H.; Sabar S. Microwave-Assisted Synthesis of Polyethyleneimine Grafted Chitosan Beads for the Adsorption of Acid Red 27. J. Polym. Environ. 2020, 28, 542–552. 10.1007/s10924-019-01628-3. [DOI] [Google Scholar]
- Boukhalfa N.; Boutahala M.; Djebri N.; Idris A. Kinetics, thermodynamics, equilibrium isotherms, and reusability studies of cationic dye adsorption by magnetic alginate/oxidized multiwalled carbon nanotubes composites. Int. J. Biol. Macromol. 2019, 123, 539–548. 10.1016/j.ijbiomac.2018.11.102. [DOI] [PubMed] [Google Scholar]
- Djebri N.; Boutahala M.; Chelali N.-E.; Boukhalfa N.; Zeroual L. Enhanced removal of cationic dye by calcium alginate/organobentonite beads: Modeling, kinetics, equilibriums, thermodynamic and reusability studies. Int. J. Biol. Macromol. 2016, 92, 1277–1287. 10.1016/j.ijbiomac.2016.08.013. [DOI] [PubMed] [Google Scholar]
- Fu J.; Zhu J.; Wang Z.; Wang Y.; Wang S.; Yan R.; et al. Highly-efficient and selective adsorption of anionic dyes onto hollow polymer microcapsules having a high surface-density of amino groups : Isotherms , kinetics , thermodynamics and mechanism. J. Colloid Interface Sci. 2019, 542, 123–135. 10.1016/j.jcis.2019.01.131. [DOI] [PubMed] [Google Scholar]
- Meh A. L. M.; Marjanovic L.; Mbianda X. Y. Statistical Optimization, Kinetic and Isotherm Studies on Selective Adsorption of Silver and Gold Cyanocomplexes Using Aminoguanidyl- Chitosan Imprinted Polymers. J. Adv. Chem. Eng. 2016, 06. 10.4172/2090-4568.1000149. [DOI] [Google Scholar]
- Mohajeri S.; Aziz H. A.; Isa M. H.; Zahed M. A.; Adlan M. N. Statistical optimization of process parameters for landfill leachate treatment using electro-Fenton technique. J. Hazard. Mater. 2010, 176, 749–758. 10.1016/j.jhazmat.2009.11.099. [DOI] [PubMed] [Google Scholar]
- Rasheed S.; Hashmi I.; Kim J. K.; Zhou Q.; Campos L. C. Species-specific interaction of trihalomethane (THM) precursors in a scaled-up distribution network using response surface methodology (RSM). Environ. Technol. 2018, 39, 346–355. 10.1080/09593330.2017.1301564. [DOI] [PubMed] [Google Scholar]
- Zhang Y.; Li J.; Cheng X.; Bian W.; Chen G.; Li Y.; et al. Efficient removal of crystal violet by diatomite and carbon in the fixed bed column: influence of different glucose/diatomite. RSC Adv. 2016, 6, 51337–51346. 10.1039/C6RA07862A. [DOI] [Google Scholar]
- Cruz M. A. P.; Guimarães L. C. M.; da Costa Júnior E. F.; Rocha S. D. F.; Mesquita P. D. L. Adsorption of crystal violet from aqueous solution in continuous flow system using bone char. Chem. Eng. Commun. 2019, 372–381. 10.1080/00986445.2019.1596899. [DOI] [Google Scholar]
- Tahir N.; Bhatti H. N.; Iqbal M.; Noreen S. Biopolymers composites with peanut hull waste biomass and application for Crystal Violet adsorption. Int. J. Biol. Macromol. 2017, 94, 210–220. 10.1016/j.ijbiomac.2016.10.013. [DOI] [PubMed] [Google Scholar]
- Zehra T.; Priyantha N.; Lim L. B. L. Removal of crystal violet dye from aqueous solution using yeast-treated peat as adsorbent: thermodynamics, kinetics, and equilibrium studies. Environ. Earth Sci. 2016, 75, 357. 10.1007/s12665-016-5255-8. [DOI] [Google Scholar]
- Nasab S. G.; Semnani A.; Teimouri A.; Yazd M. J.; Isfahani T. M.; Habibollahi S. Decolorization of crystal violet from aqueous solutions by a novel adsorbent chitosan/nanodiopside using response surface methodology and artificial neural network-genetic algorithm. Int. J. Biol. Macromol. 2019, 124, 429–443. 10.1016/j.ijbiomac.2018.11.148. [DOI] [PubMed] [Google Scholar]
- Omer O. S.; Hussein B. H. M.; Ouf A. M.; Hussein M. A.; Mgaidi A. An organified mixture of illite-kaolinite for the removal of Congo red from wastewater. J. Taibah Univ. Sci. 2018, 12, 858–866. 10.1080/16583655.2018.1540179. [DOI] [Google Scholar]
- Chafai H.; Laabd M.; Elbariji S.; Bazzaoui M.; Albourine A. Study of congo red adsorption on the polyaniline and polypyrrole. J. Dispersion Sci. Technol. 2017, 38, 832–836. 10.1080/01932691.2016.1207185. [DOI] [Google Scholar]
- Laabd M.; Ahsaine H. A.; El Jaouhari A.; Bakiz B.; Bazzaoui M.; Ezahri M.; et al. Congo red removal by PANi/Bi2WO6 nanocomposites: kinetic, equilibrium and thermodynamic studies. J. Environ. Chem. Eng. 2016, 4, 3096–3105. 10.1016/j.jece.2016.06.024. [DOI] [Google Scholar]
- Munagapati V. S.; Yarramuthi V.; Kim Y.; Lee K. M.; Kim D.-S. Removal of anionic dyes (Reactive Black 5 and Congo Red) from aqueous solutions using Banana Peel Powder as an adsorbent. Ecotoxicol. Environ. Saf. 2018, 148, 601–607. 10.1016/j.ecoenv.2017.10.075. [DOI] [PubMed] [Google Scholar]
- Xu Y.; Jin J.; Li X.; Han Y.; Meng H.; Song C.; et al. Magnetization of a Cu (II)-1,3,5-benzenetricarboxylate metal-organic framework for efficient solid-phase extraction of Congo Red. Microchim. Acta 2015, 182, 2313–2320. 10.1007/s00604-015-1572-y. [DOI] [Google Scholar]
- Mahmoodi N. M.; Saffar-Dastgerdi M. H. Zeolite nanoparticle as a superior adsorbent with high capacity: Synthesis, surface modification and pollutant adsorption ability from wastewater. Microchem. J. 2019, 145, 74–83. 10.1016/j.microc.2018.10.018. [DOI] [Google Scholar]
- Kataria N.; Garg V. K. Removal of Congo red and Brilliant green dyes from aqueous solution using flower shaped ZnO nanoparticles. J. Environ. Chem. Eng. 2017, 5, 5420–5428. 10.1016/j.jece.2017.10.035. [DOI] [Google Scholar]
- Silva P. C. The dichotomous species of Codium in Britain. J. Mar. Biol. Assoc. U. K. 1955, 34, 565–577. 10.1017/S0025315400008821. [DOI] [Google Scholar]
- de Oliveira-Carvalho M. d. F.; Pereira S. M. B.; Pedroche F. F. Taxonomy and distribution of the green algal genus Codium (Bryopsidales, Chlorophyta) in Brazil. Nova Hedwigia 2010, 91, 87–109. 10.1127/0029-5035/2010/0091-0087. [DOI] [Google Scholar]
- Prahas D.; Kartika Y.; Indraswati N.; Ismadji S. Activated carbon from jackfruit peel waste by H3PO4 chemical activation: Pore structure and surface chemistry characterization. Chem. Eng. J. 2008, 140, 32–42. 10.1016/j.cej.2007.08.032. [DOI] [Google Scholar]
- Lagergren S. Zur theorie der sogenannten adsorption geloster stoffe. K. Sven. Vetenskapsakad. Handl. 1898, 24, 1–39. [Google Scholar]
- Ho Y. S.; Mckay G. KINETIC MODELS FOR THE SORPTION OF DYE FROM AQUEOUS SOLUTION BY WOOD. Process Saf. Environ. Prot. 1998, 76, 183–191. 10.1205/095758298529326. [DOI] [Google Scholar]
- Weber W. J.; Morris J. C. Kinetics of Adsorption on Carbon from Solutions. J. Sanit. Eng. Div. 1963, 89, 31–60. [Google Scholar]
- Langmuir I. the Adsorption of Gases on Plane Surfaces of Glass, Mica and Platinum. J. Am. Chem. Soc. 1918, 40, 1361–1403. 10.1021/ja02242a004. [DOI] [Google Scholar]
- Freundlich H. M. F. Over the Adsorption in Solution. J. Phys. Chem. 1906, 57, 1100–1107. [Google Scholar]
- Laabd M.; El Jaouhari A.; Bazzaoui M.; Albourine A.; El Jazouli H. Adsorption of Benzene-Polycarboxylic Acids on the Electrosynthesized Polyaniline Films: Experimental and DFT Calculation. J. Polym. Environ. 2017, 25, 359–369. 10.1007/s10924-016-0814-3. [DOI] [Google Scholar]
- Lima E. C.; Hosseini-Bandegharaei A.; Moreno-Piraján J. C.; Anastopoulos I. A critical review of the estimation of the thermodynamic parameters on adsorption equilibria. Wrong use of equilibrium constant in the Van’t Hoof equation for calculation of thermodynamic parameters of adsorption. J. Mol. Liq. 2019, 273, 425–434. 10.1016/j.molliq.2018.10.048. [DOI] [Google Scholar]
- Kumar S. C.; Sivakumar M.; Ruckmani K. Microwave-assisted extraction of polysaccharides from Cyphomandra betacea and its biological activities. Int. J. Biol. Macromol. 2016, 92, 682–693. 10.1016/j.ijbiomac.2016.07.062. [DOI] [PubMed] [Google Scholar]
Associated Data
This section collects any data citations, data availability statements, or supplementary materials included in this article.


