

Abstract
The relative body masses of predators and their prey strongly affect the predators' ecology. An accurate estimate of the mass of an extinct predator is therefore key to revealing its biology and the structure of the ecosystem it inhabited. Until its extinction, the thylacine was the largest extant carnivorous marsupial, but little data exist regarding its body mass, with an average of 29.5 kg the most commonly used estimate. According to the costs of carnivory model, this estimate predicts that thylacines would have focused on prey subequal to or larger than themselves; however, many studies of their functional morphology suggest a diet of smaller animals. Here, we present new body mass estimates for 93 adult thylacines, including two taxidermy specimens and four complete mounted skeletons, representing 40 known-sex specimens, using three-dimensional volumetric model-informed regressions. We demonstrate that prior estimates substantially overestimated average adult thylacine body mass. We show mixed-sex population mean (16.7 kg), mean male (19.7 kg), and mean female (13.7 kg) body masses well below prior estimates, and below the 21 kg costs of carnivory threshold. Our data show that the thylacine did not violate the costs of carnivory. The thylacine instead occupied the 14.5–21 kg predator/prey range characterized by small-prey predators capable of occasionally switching to relatively large-bodied prey if necessary.
Keywords: Thylacinus cynocephalus, convex hull, volumetric model, body mass estimation, feeding ecology, sexual dimorphism
1. Introduction
Body mass is one of the most fundamentally important aspects of an organism, strongly influencing and dictating many biological characteristics, including metabolic rate [1,2], lifespan [3], growth and fecundity rate [4–6], diet [7,8], and niche occupation [9–11]. One of the most striking repercussions of body mass for carnivorous mammals is the energy budget threshold known as the costs of carnivory [12,13]. Under this model, small carnivores (less than 14 kg) tend to feed on prey much smaller than themselves, and large carnivores (greater than 21 kg) feed on subequal-sized prey or larger, with those in the 14–21 kg range typically preying on small-bodied prey but may be capable of occasionally tackling larger prey items if necessary. This constraint is largely a result of the substantial energetic expense involved in locating and capturing prey, resulting in higher metabolic rates in carnivores than their herbivorous prey. As metabolic rate is strongly correlated with body size, larger carnivores incur higher costs per prey item located and consumed, prompting a shift towards larger-bodied prey [12,14]. Substantially higher energetic expenses are seen in marsupial carnivores versus their herbivorous relatives, strongly suggesting they are not exempt from this type of energetic constraint [15].
The most commonly cited average body mass for the thylacine is 29.5 kg [16], placing it well above the 21 kg threshold. However, structural analyses of the thylacine skull and mandible have repeatedly shown that the cranial architecture was poorly adapted to handle the stresses of procuring large-bodied prey [17–19]. This noted disagreement between the postulated energetic budget and the functional morphology remains unresolved [19]. The 29.5 kg estimate is seemingly based on uncritical reading of the anecdotal source material (Le Soef in Commissioners of the Victorian Intercolonial Exhibition, 1875, p. 261; ‘weighing sometimes from 60 lb. to 70 lb.’). Only four reliable records of thylacine body mass can be found in the peer-reviewed literature: 33 pounds for an ‘excessively fat’ male (approx. 15 kg, [20]); a 14.97 kg male [21], and two records from the 1914 death registry of the London Zoo, a 29 lb. female (approx. 13.2 kg) and a 57.5 lb. male (approx. 26.1 kg). Beyond these four records, reported thylacine body masses are scant, anecdotal, and problematic (electronic supplementary material, S1), leaving us with no clear record of adult body mass.
For extinct organisms such as the thylacine where we cannot directly measure mass, there has traditionally been reliance on regression equations based on craniodental [22–24] or postcranial [25–29] metrics from extant comparative taxa (see [30]). Recently, various volumetric techniques have been shown to be highly accurate and increasingly feasible (see [31]), including graphic double integration (GDI; [32,33]), convex hull volumetrics [34,35], and digital volumetric modelling [32,36,37]. Here, we use a combination of linear regressions and volumetric methods to address the question of whether the thylacine was a striking outlier to the costs of carnivory by re-examining the average body mass and size sexual dimorphism of this popular icon of convergent evolution and human-mediated extinction.
2. Methods
(a). Specimen data
A total of 93 adult thylacine specimens were studied (18 female, 23 male, 52 unknown sex), represented by one whole preserved body, two whole body taxidermies, three mounted skeletons, and a total of 82 crania, 74 mandibles, and 26 humerus/femur pairs (electronic supplementary material, S2). We three-dimensional surface scanned 88 of the most complete/undamaged specimens with an Artec Spider/Space Spider or Artec Leo structured light scanner, and five specimens were computed tomography (CT) scanned. Specimens were classified as adult where the M4 is fully erupted and in occlusion (in/nearly in contact with the M3 metastylar wing) or, in the case of mandible-only specimens, m4 erupted and clear of the ascending ramus. We classified the postcrania-only specimens as adult if metaphyses were ossified or partially ossified such that epiphyseal caps were not separable from the metaphysis. All analyses were conducted in R v. 3.6.1 [38], with all data presented in electronic supplementary material, S3.
(b). Body mass
We estimated thylacine body masses by four methods: Myers' [23] dental regressions (upper molar row length and lower molar row length [MRL regressions]), Campione & Evans’ [29] stylopodial regression (humeral and femoral least circumference [HcFc regression]), minimum convex hull estimations [35], and volumetric model estimation (e.g. [36,37]). Both MRL regressions and HcFc regression estimates were made for 22 specimens (seven female, nine male, six unknown), and the masses of four of those specimens were also calculated via both convex hull and volumetric models (two female, one male, one unknown). Body mass and prey body mass values for comparative taxa were sourced from the literature (electronic supplementary material, S4).
Convex hulls were generated in MeshLab v. 2016.12 (Visual Computing Lab, Italy) following standard procedures [35], using 'three-dimensional surface meshes of three mounted articulated skeletons (NMV C28178, TMAG A312, TMAG A315) and the digitally extracted skeleton from a CT scan of whole preserved body NRM 566599 (figure 1a,b). The volumes of the convex hulls were then multiplied by standard density values of water (1000 kg m−1) and that of a horse (893.36 kg m−1) as a bracketing method [39,40].
Figure 1.

Three-dimensional volumetric models of the thylacine. (a) Three-dimensional surface scan of mounted specimen TMAG A312; (b) convex hull generated over the skeleton; (c) fully textured volumetric model sculpted over the skeleton. Surface scans of taxidermy specimens (d) NMV C28744; (e) TMAG A1298; and (f) surface scan of preserved specimen NRM 566599. Images not to scale. (Online version in colour.)
Digital volumetric models were sculpted by one of us (DGM) in ZBrush v.2020 (Pixelogic, USA) around the scanned meshes of the three mounted skeletons (figure 1c). Both an underweight and ideal body condition model following Laflamme [41] were generated as a bracketing method. Surface scans were also used to make digital three-dimensional meshes of the two taxidermy specimens (NMV C28744, TMAG A1298; figure 1d,e). The curled position and compression of the preserved specimen NRM 566599 was deemed to require too much retrodeformation to allow for a similar sculpting, so we relied on a direct three-dimensional surface scan of the specimen (figure 1f). These six digital models were then imported into MeshLab and their mass estimated as described above, with the taxidermy specimens' surface area reduced to account for an average of 5 mm and 10 mm pelage thickness projecting above the true body surface, as a conservative bracketed estimate.
Differences between the mass estimates from the MRL and HcFc regressions were assessed via a Wilcoxon ranked sum test. This preliminary analysis showed that the HcFc regression differs significantly from the MRL regression estimates (p < 0.001; electronic supplementary material, S5) and that these HcFc estimates are largely congruent with both the convex hull and volumetric model mass estimates (figure 2a; electronic supplementary material, S6). As such, we chose to proceed with the HcFc body mass estimates as a best proxy in further analyses.
Figure 2.

Body mass of the thylacine. (a) Regression and volumetric body mass range estimates for six whole-body specimens. Values for UMRL, LMRL [23], and HcFc [29] regressions are upper and lower bounds of the respective prediction errors. Values for the convex hull and volumetric estimates are mass at ρ = 893.36 kg m−3 and ρ = 1000 kg m−3. Note that the volumetric estimate of NRM 566599 is from the surface scan of the emaciated ethanol-preserved specimen, not a model reconstruction, and so is not represented by an underweight/ideal weight condition. (b) Total sample body mass estimate (n = 91). Dashed line is mean value (16.7 kg). (c) Sexed specimen body mass estimate (female = 17, male = 21). Dashed lines are mean values (female = 13.7 kg, male = 19.7 kg). (Online version in colour.)
As the HcFc regression is the most accurate mass proxy—but postcrania making up only a fraction of thylacine museum specimens—we used ordinary least-squares (OLS) regression of the UMRL, LMRL, and condylobasal length of the skull (CBL) on the HcFc mass proxies to generate a ‘corrected’ set of regression equations (cUMRL, cLMRL, and cCBL) applicable to thylacine cranial specimens. Skull length (as estimated by condylobasal length) is a common metric to base body mass regressions, because it is not affected by dental reduction in carnivorous mammals [22], and due to the potential for indeterminate growth of the marsupial skeleton to poorly correlate with the dental metrics. These three OLS regression estimates were adjusted for transformation bias and ranked by the R2 and per cent prediction error (PPE).
(c). Sexual dimorphism
To assess potential sexual dimorphism in cranial shape, 12 linear metrics were taken using digital calipers from the 64 complete crania (14 female, 16 male, 34 unknown sex; electronic supplementary material, S7). All metrics are the average of three measurements to the nearest 0.1 mm, and were natural log-transformed for all subsequent analyses.
Sex-based differences between the individual metrics were explored using a multivariate analysis of variance (MANOVA). To test for deviation from isometric scaling, we used major axis (MA) regression of the traits of the sexed group against body size proxies (CBL and the above-estimated body mass) in the R package smatr [42]. We then performed a principal component analysis (PCA) of the total linear metrics sample (n = 64) and differences within the Principal Components (PCs) between the sexes were tested using MANOVA. The magnitude of sexual size dimorphism was calculated using the Lovich & Gibbons [43] Sexual Dimorphism Index (SDI), with estimated body mass as the trait of interest. To assign sex information to the 34 unknown specimens, a linear discriminant analysis (LDA) was carried out in the package MASS [44] with the resulting discriminant function then used to predict the sex of the unknown individuals.
Surface scans of 14 of the most complete specimens (seven female, seven male) were landmarked by one of us (DSR) using Viewbox 4 (dHAL software, Greece). Specimens with small amounts of unilateral damage were restored using mesh editing tools in Geomagic Studio 14. As shape differences between the sexes may not be captured with Type I suture-based landmarks sensu Bookstein [45], a fixed point, patch, and curve-based set of 381 landmarks was implemented (electronic supplementary material, S8).
The resultant three-dimensional Geometric Morphometrics (GM) coordinate data were analysed using the package geomorph [46]. A PCA was performed on the Procrustes coordinates as a data transformation and reduction technique, and a MANOVA performed on the resultant PC values holding sex as the factor. Additionally, we performed a Procrustes ANOVA (pANOVA) on the Procrustes coordinates to investigate the effect of sex, size (as natural log-transformed Centroid Size [lnCS]), and the interaction of sex and lnCS on shape.
Significance results for all analyses using multiple comparisons (e.g. MANOVAs) were adjusted to reduce Type I errors using the Benjamini-Hochberg procedure [47]. The false discovery rate (FDR) allowed for the procedure was set at 0.10 as a relatively conservative value that nevertheless would not overly penalize the small sample sizes in the study.
3. Results
(a). Body mass
The OLS regression of condylobasal skull length on the HcFc-generated body masses is the best-fit equation (adjusted R2 = 0.819, PPE = 0.0474), with cUMRL (adjusted R2 = 0.724, PPE = 0.0861) and cLMRL (adjusted R2 = 0.703, PPE = 0.0838) approximately subequal to each other (electronic supplementary material, S9). We chose this cCBL equation as a best proxy to calculate the body mass for the 74 applicable thylacines (i.e. those with CBL metrics) followed by HcFc, cUMRL, and cLMRL regressions in descending order based on metric availability and goodness of fit, totalling in 91 massed thylacines. All of the following results and discussion of body mass below refer to this ‘best estimate’ set.
Distribution of this total sample body mass is slightly bimodal, with a mean mixed-sex species estimate of 16.7 kg (figure 2b; electronic supplementary material, S10). The body mass estimates of the known-sexed specimens show a strong separation between the sexes (Welch's two-sample t-test: p < 0.001), with a female mean of 13.7 kg (s.d.: 1.51) and that of males at 19.7 kg (s.d.: 2.48; figure 2c). Mass distribution within the male sample is uneven, with a potentially bimodal pattern. The total range estimate across all three corrected equations indicates a potential minimum adult size of 9.8 kg (NMV C5750.1, female) and a maximum of 28.1 kg (LEEDM C.1869.46.2.4088; sex unknown). These mass averages place the thylacine under the 21 kg large-prey specialist threshold, contrary to the previous estimate of 29.5 kg (figure 3).
Figure 3.
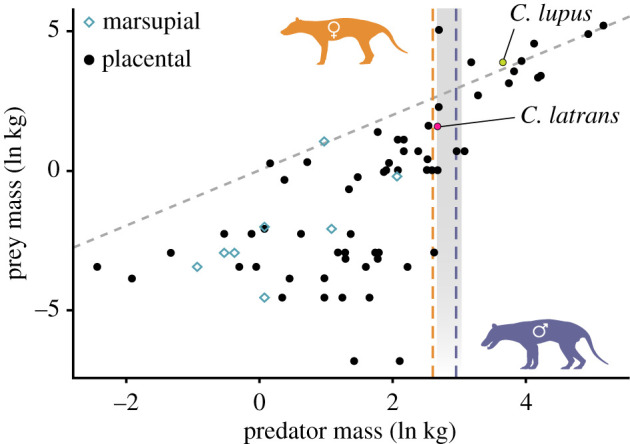
Natural log-transformed mean predator and mean prey body mass for 82 terrestrial faunivorous mammals. Grey dashed line is isometric, grey vertical bar is the 14.5–21 kg range from [12], data in electronic supplementary material, S4. Orange and purple (light and dark) vertical dashed lines are female and male thylacine mean body mass estimates. (Online version in colour.)
(b). Sexual dimorphism
The sexes are significantly different in size across all metrics (electronic supplementary material, S11). Results of the MA regressions on CBL are ambiguous, but suggestive of negative allometry in width of the palate at the carnassial and, with very poor fit, width of the skull at the postorbital constriction (electronic supplementary material, S12). Positive allometry is suggested in the width of the rostrum across the canines. The elevation of the regression against the M3 length is shown to be significantly different between the sexes, though again with very poor fit. The MA regressions on estimated body mass are broadly similar, suggesting negative allometry in the postorbital constriction, and positive allometry in palate length, rostral width, and bizygomatic width (electronic supplementary material, S12). In neither analyses, however, are the effects seen shared between the sexes, nor are the slopes found to be significantly different, suggesting that either small sample size or large trait variance are obscuring any trends.
The PCA of the linear metrics shows a separation in PC1 (86.7% of variance) but no pattern beyond this first PC, which is heavily loaded by size (figure 4a). The MANOVA on the PCs corroborates the separation on PC1 (p < 0.001) but does not find a significant difference between the sexes in any other PC. A clear discrimination between the sexes is also seen in the LDA, which correctly identifies 96.7% of the known-sex individuals (figure 4b).
Figure 4.

Thylacine sexual dimorphism. (a) PCA plot of linear metrics data (n = 64). (b) Distribution of males and females on LDA score for linear metrics. (c) PCA plot of three-dimensional GM data (n = 14). (d) Thylacine cranial mesh warps at the extremes of PC1. (Online version in colour.)
The PCA of the three-dimensional GM data also shows a separation along PC1 (27.3% of variance) between the sexes, with no separation along PC2 (17.0% of variance) (figure 4c). A MANOVA of the PCs finds a significant difference (p < 0.001) only in PC1 (electronic supplementary material, S13). Regression of the Procrustes coordinates on the natural log-transformed centroid size and sex both returned significant differences (p < 0.001), with the interaction of sex and lnCS not significant (electronic supplementary material, S13).
Thylacines show a mass-based SDI of 44.19, similar to the range expressed by the dasyurid comparatives (range SDI: 46.91–93.41; electronic supplementary material, S14). The dasyuromorphs tested here display a far higher SDI than the placental canid comparatives (range SDI: 4.85–37.39). With such a relatively large degree of sexual dimorphism, we then used body mass (as size proxy) as an additional post hoc discriminant for sexing the unknown thylacines. Thylacines with body mass less than two standard deviations from the male mean (mass < 14.8 kg) were labelled as ‘female’, and with a body mass greater than two standard deviations from the female mean (mass > 16.7 kg) as ‘male’. If these labels matched the prediction classification from the LDA, the unknown specimen was then ascribed to that sex (electronic supplementary material, S15).
Using the expanded dataset of the post hoc sexed thylacines (24 female, 28 male), we repeated the above analyses with the exception of the LDA and three-dimensional GM. All results are similar with the exception of the MA regressions on body mass. Strong support for positive allometry in width of the rostrum at the canine was found (female: R2 = 0.786, p = 0.003; male: R2 = 0.843, p < 0.001), though no evidence was found for a difference between the sexes in slope (p = 0.507) or elevation (p = 0.868). Tentative support for shared positive allometry was found in the occipital width (female: R2 = 0.799, p = 0.0502; male: R2 = 0.830, p = 0.021). Similarly, tentative support for shared positive allometry was found in the interorbital width (female: R2 = 0.473, p = 0.047; male: R2 = 0.714, p = 0.010) and negative allometry in postorbital constriction (female: R2 = 0.160, p = 0.087; male: R2 = 0.412, p = 0.017), though with markedly poorer fit.
4. Discussion
Previous mass estimates had placed the thylacine well over the 21.0 kg costs of carnivory threshold [12], suggesting a predation strategy focusing on large-bodied prey around or above the size of the predator. This feeding ecology conflicts with functional studies suggesting that the thylacine was poorly adapted to handle large-bodied prey [17–19,48]. Our data show that the mean body mass (approx. 16.7 kg) was likely to have been substantially lower than both the 29.5 kg value given by Paddle [16] and the 26.5 kg value calculated by Wroe [49]. When the predator-to-prey body mass ratio is considered, the thylacine is not seen to violate the costs of carnivory, indicating that the same or similar budget threshold applies across terrestrial mammalian carnivores (figure 3; [15]). This mass revision strongly suggests that the thylacine was not an outlier in the costs of carnivory, and has profound implications for interpretations of thylacine ecology and predatory behaviour. The thylacine falls within the transitional threshold similar to mesopredators that mostly target small-bodied prey but are capable of tackling larger prey if necessary, such as the coyote (Canis latrans), and unlike large-prey specialists the thylacine is often considered convergent with, e.g. the grey wolf (Canis lupus; figure 3). This is in line with several previous assessments of the thylacine's predatory ecology [17–19,48,50,51].
The mass of the female thylacine (mean 13.7 kg) overlaps with that of large Tasmanian devil (Sarcophilus harrisii) males, which average approximately 8.8 kg and occasionally reach weights of > 12 kg [51–53]. A similar overlap in mass is observed between the sympatric eastern quolls (Dasyurus viverrinus) and female spotted-tailed quolls (Dasyurus maculatus), and between male D. maculatus and female S. harrisii [51,54]. This overlap is not seen between quolls and devils in other functional characters, such as canine strength or temporalis muscle area [51]. Substantial overlap in these characters has been noted between Tasmanian devils and thylacines, with female thylacines having substantially weaker canines than devils of both sexes, and a smaller area for the temporalis than male devils [51]. While there is no reliable data for the feeding ecology of the thylacine, it may be that this overlap in mass and functional characters prompted niche separation in areas of sympatry, or that this mass overlap continued to allow devils to dominate carcass access and utilization over the entire range of marsupial carnivores, from quolls through thylacines.
The strong sexual size dimorphism (SDI: 44.19) is not reflected by a significant dimorphism in shape (figure 4d). While we do find evidence of positive allometry in the cranium in both sexes, especially in rostral and facial width, we find no evidence of differing allometric trajectories or non-allometric difference in shape between the sexes. This also suggests that the two ‘kinds’ or ‘types’ of thylacine sometimes noted in the literature—a short-nosed ‘bull-dog’ thylacine, and a ‘greyhound’ thylacine [55–58]—were simply observations of the strong size dimorphism coupled with the positive allometric trends in cranial measurements, as postulated by Allport [56] and Moeller [57].
The discordance between the estimates produced by the molar row length regressions and the estimates produced by both the volumetric methods and the stylopodial regressions could be due to the use of the 29.5 kg mass estimate in the generation of Myers' regressions. Additionally, the dental proportions of the hypercarnivorous thylacine may be sufficiently different enough to render the MRL regressions inaccurate. The overestimation of craniodentally distinct taxa was noted by Myers [23], e.g. their estimation of the mass of a Sarcophilus harrisii specimen produced a value of 14.1 kg, substantially larger than the species (approx. 7.2 kg) or male (approx. 8.8 kg) average [51,52]. This overestimation of S. harrisii body mass has been replicated and noted elsewhere [18]. We note that the MRL regressions are accurate for the smaller dasyurids, and we only urge caution regarding their use with the larger carnivorous marsupials.
The poor fit of the dental-based mass estimation methods has potential implications for understanding the palaeoecology of earlier members of Thylacinidae. Most of the family were small-bodied and likely to have varied little from the general bauplan of predatory dasyuromorphs, and we feel that the previous mass estimates, using dental regressions, are probably valid [59]. However, the members of the genus Thylacinus were significantly larger, culminating with Thylacinus potens and Thylacinus megiriani, both estimated at greater than approximately 30 kg via dental regressions [59,60]. While there are no suitably complete specimens of T. megiriani to explore via our corrected regressions, two specimens of T. potens (NTM P4326 & P4327) are complete enough to tentatively mass with the appropriate cUMRL and cLMRL regressions. The body mass of T. potens NTM P4326 is calculated here at 22.2 kg (versus 41.0 kg; [59]) and that of NTM P4327 at 27.9 kg (versus 52.3 kg; [59]). However, the same caveats mentioned above regarding the extrapolation from a smaller species to a larger, potentially differently proportioned one should be noted here as well (see discussion in [59]). Interestingly, while there are no stylopodial elements in the published literature, an unpublished humerus putatively referred to T. potens has been noted to be much smaller than expected from the cranial remains [60].
The poor accuracy of the dental regressions in mass estimation across dissimilar morphologies or magnitudes of size (e.g. extrapolating from the relatively short-faced, approximately 3 kg D. maculatus to the relatively long-faced, much larger T. cynocephalus) has implications beyond reconstructing the body mass of Thylacinus. Dental regressions have been widely used to reconstruct the mass of extinct marsupials [61–65], non-marsupial metatherian sparassodonts [66–71], and stem metatherians [72]. Many of these taxa are well within the sizes and/or morphologies included in the base data of the regressions, though many—such as the sparassodonts—are not. Overestimations of mass for these taxa could affect interpretations of metatherian ecology, competition, and extinction [67,70,73,74] as all of these are strongly affected by body mass.
These results highlight the general difficulties in extrapolating body mass for species with no close living relatives, or with living relatives that are drastically different in shape or size [22,30,60,75–80]. The advantages of using ‘conventional’ (linear metric-based regression) techniques—their simplicity, objectivity, and applicability to often-incomplete fossil remains—should not be ignored. However, their associated caveats and potential drawbacks also need to be kept in mind, particularly when applying them to wildly disparate taxa [30,31,80,81]. Where possible, it may be highly beneficial to use multiple methods, including those (such as volumetric methods, GDI, etc.) that are not constrained to single-element regressions, to provide a method of cross-validation and to avoid the ‘one bone effect’ often seen in such estimations.
5. Conclusion
Our data show that the thylacine did not violate the costs of carnivory, but demonstrate that prior body mass estimates were too high. The strongly sexually size dimorphic thylacine (female mean: 13.7 kg; male mean: 16.7 kg) instead occupied the entirety of the 14.5–21 kg threshold characterized by small-prey predators that are capable of switching to relatively large-bodied prey if the situation presents itself. Relatively confident sex assignment of thylacines is possible based on mass (female: < 14.8 kg; male > 16.7 kg) and cranial size via linear metric LDA (a rough simple metric is: female CBL < 203 mm; male CBL > 214 mm), and we post hoc sexed an additional 23 specimens. Regarding body mass estimations of the thylacine, we find that stylopodial circumference regressions and volumetric methods agree relatively well with each other to the exclusion of commonly used dental-based regressions.
Supplementary Material
Acknowledgements
We thank the following individuals and institutions for specimen access: S. Ingleby (Australian Museum), E. Westig (American Museum of Natural History), S. Bock (Berlin Natural History Museum), M. Lowe (Cambridge University Museum of Zoology), R. Machin (Leeds Museum), R. Blackburn (Macleay Natural History Museum), R. Portela-Miguez (Natural History Museum UK), D. Lunde (National Museum of Natural History), K. Date, R.-L. Erickson, K. Roberts, & K. Rowe (National Museums Victoria), J. Carter & J. Gallichan (National Museum Wales), T. Gordon (Queen Victoria Museum and Art Gallery), H. Janetzki (Queensland Museum), S. Bruaux & A. Folie (Royal Belgium Institute of Natural Sciences), D. Stemmer (South Australian Museum), S. Merker (Stuttgart State Museum of Natural History), K. Medlock (Tasmanian Museum and Art Gallery), B. Delling & D. Kalthoff (Swedish Museum of National History), K. Travouillon (Western Australian Museum), and S. King (York Museum). Mounted specimen scanning and CT scanning of specimens was graciously facilitated by F. Arnberg & F. Ståhl (Karolinska Institute), D. Hunt (National Museum of Natural History), M. McMillon (Artec 3D), and J. Farr & B. Myers (Thinglab). Details on historic records from the London Zoo were kindly provided by S. Sleightholme. Special thanks to A.D. McDonald and H.L. Richards for assisting with data acquisition and aesthetic arguments, and two anonymous reviewers. Without these people, this manuscript would not have been possible.
Data accessibility
Three-dimensional surface meshes for volumetric mass estimation can be found at www.morphosource.org (Project: P1055), R code and data at https://figshare.com/projects/project/86588. All other data are included in the electronic supplementary material.
Competing interests
We declare we have no competing interests.
Funding
This work was supported by Monash University (Faculty of Science/Subfaculty of Biomedical and Psychological Sciences Strategic Research Seed Funding Scheme) (ARE/JWA), the Robert Blackwood Partnership Monash-Museums Victoria scholarship (DSR) and the Department of Anatomy and Developmental Biology at Monash University (JWA/DSR).
References
- 1.Hennemann WW. 1983. Relationship among body mass, metabolic rate and the intrinsic rate of natural increase in mammals. Oecologia 56, 104–108. ( 10.1007/BF00378224) [DOI] [PubMed] [Google Scholar]
- 2.Hayssen V, Lacy RC. 1985. Basal metabolic rates in mammals: taxonomic differences in the allometry of BMR and body mass. Comp. Biochem. Physiol. Part A: Physiol. 81, 741–754. ( 10.1016/0300-9629(85)90904-1) [DOI] [PubMed] [Google Scholar]
- 3.Calder WA. 1982. The relationship of the Gompertz constant and maximum potential lifespan to body mass. Exp. Gerontol. 17, 383–385. ( 10.1016/0531-5565(82)90038-9) [DOI] [PubMed] [Google Scholar]
- 4.Fenchel T. 1974. Intrinsic rate of natural increase: the relationship with body size. Oecologia 14, 317–326. ( 10.1007/BF00384576) [DOI] [PubMed] [Google Scholar]
- 5.Angilletta MJ Jr, Steury TD, Sears MW. 2004. Temperature, growth rate, and body size in ectotherms: fitting pieces of a life-history puzzle. Integr. Comp. Biol. 44, 498–509. ( 10.1093/icb/44.6.498) [DOI] [PubMed] [Google Scholar]
- 6.Davidowitz G, Nijhout HF. 2004. The physiological basis of reaction norms: the interaction among growth rate, the duration of growth and body size. Integr. Comp. Biol. 44, 443–449. ( 10.1093/icb/44.6.443) [DOI] [PubMed] [Google Scholar]
- 7.Price SA, Hopkins SSB. 2015. The macroevolutionary relationship between diet and body mass across mammals. Biol. J. Linn. Soc. 115, 173–184. ( 10.1111/bij.12495) [DOI] [Google Scholar]
- 8.Pineda-Munoz S, Evans AR, Alroy J. 2016. The relationship between diet and body mass in terrestrial mammals. Paleobiology 42, 659–669. ( 10.1017/pab.2016.6) [DOI] [Google Scholar]
- 9.Christiansen P. 2002. Locomotion in terrestrial mammals: the influence of body mass, limb length and bone proportions on speed. Zool. J. Linn. Soc. 136, 685–714. ( 10.1046/j.1096-3642.2002.00041.x) [DOI] [Google Scholar]
- 10.Farlow JO, Planka ER. 2002. Body size overlap, habitat partitioning and living space requirements of terrestrial vertebrate predators: implications for the paleoecology of large theropod dinosaurs. Hist. Biol. 16, 21–40. ( 10.1080/0891296031000154687) [DOI] [Google Scholar]
- 11.Janis CM, Buttrill K, Figueirido B. 2014. Locomotion in extinct giant kangaroos: were sthenurines hop-less monsters? PLoS ONE 9, e109888 ( 10.1371/journal.pone.0109888) [DOI] [PMC free article] [PubMed] [Google Scholar]
- 12.Carbone C, Teacher A, Rowcliffe JM. 2007. The costs of carnivory. PLoS Biol. 5, e22 ( 10.1371/journal.pbio.0050022) [DOI] [PMC free article] [PubMed] [Google Scholar]
- 13.Carbone C, Mace GM, Roberts SC, Macdonald DW. 1999. Energetic constraints on the diet of terrestrial carnivores. Nature 402, 286–288. ( 10.1038/46266) [DOI] [PubMed] [Google Scholar]
- 14.Brose U. et al. 2019. Predator traits determine food-web architecture across ecosystems. Nat. Ecol. Evol. 3, 919–927. ( 10.1038/s41559-019-0899-x) [DOI] [PubMed] [Google Scholar]
- 15.Riek A, Bruggeman J. 2013. Estimating field metabolic rates for Australian marsupials using phylogeny. Comp. Biochem. Physiol. A: Mol. Integr. Physiol. 164, 598–604. ( 10.1016/j.cbpa.2013.01.007) [DOI] [PubMed] [Google Scholar]
- 16.Paddle R. 2000. The last Tasmanian tiger: the history and extinction of the thylacine. New York, NY: Cambridge University Press. [Google Scholar]
- 17.Attard MRG, Chamoli U, Ferrara TL, Rogers TL, Wroe S. 2011. Skull mechanics and implications for feeding behaviour in a large marsupial carnivore guild: the thylacine, Tasmanian devil and spotted-tailed quoll. J. Zool. 285, 292–300. ( 10.1111/j.1469-7998.2011.00844.x) [DOI] [Google Scholar]
- 18.Attard MRG, et al. 2014. Virtual reconstruction and prey size preference in the mid Cenozoic Thylacinid, Nimbacinus dicksoni (Thylacinidae, Marsupialia). PLoS ONE 9, e93088 ( 10.1371/journal.pone.0093088) [DOI] [PMC free article] [PubMed] [Google Scholar]
- 19.Wroe S, Clausen P, McHenry C, Moreno K, Cunningham E. 2007. Computer simulation of feeding behaviour in the thylacine and dingo as a novel test for convergence and niche overlap. Proc. R. Soc. B 274, 2819–2828. ( 10.1098/rspb.2007.0906) [DOI] [PMC free article] [PubMed] [Google Scholar]
- 20.Crisp E. 1855. On some points relating to the anatomy of the Tasmanian wolf (Thylacinus) and of the Cape hunting dog (Lycaon pictus). Proc. Zool. Soc. Lond. 23, 188–192. [Google Scholar]
- 21.Berns GS, Ashwell KWS. 2017. Reconstruction of the cortical maps of the Tasmanian tiger and comparison to the Tasmanian devil. PLoS ONE 12, e0168993 ( 10.1371/journal.pone.0168993) [DOI] [PMC free article] [PubMed] [Google Scholar]
- 22.Van Valkenburgh B. 1990. Skeletal and dental predictors of body mass in carnivores. In Body size in mammalian paleobiology: estimation and biological implications (eds Damuth J, MacFadden BJ), pp. 181–205. Cambridge, UK: Cambridge University Press. [Google Scholar]
- 23.Myers TJ. 2001. Prediction of marsupial body mass. Aust. J. Zool. 49, 99–118. ( 10.1071/ZO01009) [DOI] [Google Scholar]
- 24.Palmqvist P, Mendoza M, Arribas A, Gröcke D. 2002. Estimating the body mass of Pleistocene canids: discussion of some methodological problems and a new ‘taxon free’ approach. Lethaia 35, 358–360. ( 10.1080/002411602320790661) [DOI] [Google Scholar]
- 25.Scott KM. 1990. Postcranial dimensions of ungulates as predictors of body mass. In Body size in mammalian paleobiology: estimation and biological implications, pp. 301–335. Cambridge, UK: Cambridge University Press. [Google Scholar]
- 26.Anyonge W. 1993. Body mass in large extant and extinct carnivores. J. Zool. 231, 339–350. ( 10.1111/j.1469-7998.1993.tb01922.x) [DOI] [Google Scholar]
- 27.Christiansen P. 1999. Scaling of the limb long bones to body mass in terrestrial mammals. J. Morphol. 239, 167–190. () [DOI] [PubMed] [Google Scholar]
- 28.Andersson K. 2004. Predicting carnivoran body mass from a weight-bearing joint. J. Zool. 262, 161–172. ( 10.1017/S0952836903004564) [DOI] [Google Scholar]
- 29.Campione NE, Evans DC. 2012. A universal scaling relationship between body mass and proximal limb bone dimensions in quadrupedal terrestrial tetrapods. BMC Biol. 10, 1–21. ( 10.1186/1741-7007-10-60) [DOI] [PMC free article] [PubMed] [Google Scholar]
- 30.Hopkins SSB. 2018. Estimation of body size in fossil mammals. In Methods in paleoecology: reconstructing Cenozoic terrestrial environments and ecological communities (eds Croft DA, Su DF, Simpson SW), pp. 7–22. Cham, Switzerland: Springer. [Google Scholar]
- 31.Brassey CA. 2016. Body-mass estimation in paleontology: a review of volumetric techniques. Paleontol. Soc. Papers 22, 133–156. ( 10.1017/scs.2017.12) [DOI] [Google Scholar]
- 32.Larramendi A, Palombo MR. 2015. Body size, structure, biology and encephalization quotient of Palaeoloxodon ex gr. P. falconeri from Spinagallo Cave (Hyblean plateau, Sicily). Hystrix, the Italian J. Mammalogy. 26, 102–109. ( 10.1080/08912963.2019.1617289) [DOI] [Google Scholar]
- 33.Hurlburt G. 1999. Comparison of body mass estimation techniques, using recent reptiles and the pelycosaur Edaphosaurus boanerges. J. Vertebr. Paleontol. 19, 338–350. ( 10.1080/02724634.1999.10011145) [DOI] [Google Scholar]
- 34.Mallison H. 2010. The digital Plateosaurus I: body mass, mass distribution, and posture assessed using CAD and CAE on a digitally mounted complete skeleton. Palaeontol. Electron. 13, 1–26. [Google Scholar]
- 35.Sellers WI, et al. 2012. Minimum convex hull mass estimations of complete mounted skeletons. Biol. Lett. 8, 842–845. ( 10.1098/rsbl.2012.0263) [DOI] [PMC free article] [PubMed] [Google Scholar]
- 36.Romano M, Manucci F. 2019. Resizing Lisowicia bojani: volumetric body mass estimate and 3D reconstruction of the giant Late Triassic dicynodont. Hist. Biol. 2019, 1–6. ( 10.1080/08912963.2019.1631819) [DOI] [Google Scholar]
- 37.Romano M, Manucci F, Palombo MR. 2019. The smallest of the largest: new volumetric body mass estimate and in-vivo restoration of the dwarf elephant Palaeoloxodon ex gr. P. falconeri from Spinagallo Cave (Sicily). Hist. Biol. 2019, 1–14. ( 10.1080/08912963.2019.1617289) [DOI] [Google Scholar]
- 38.Core Team R. 2019. R: A language and environment for statistical computing. Vienna, Austria: R Foundation for Statistical Computing. [Google Scholar]
- 39.Alexander RM. 1985. Mechanics of posture and gait of some large dinosaurs. Zool. J. Linn. Soc. 83, 1–25. ( 10.1111/j.1096-3642.1985.tb00871.x) [DOI] [Google Scholar]
- 40.Buchner HHF, Savelberg HHCM, Schamhardt HC, Barneveld A. 1997. Inertial properties of Dutch Warmblood horses. J. Biomech. 30, 653–658. ( 10.1016/S0021-9290(97)00005-5) [DOI] [PubMed] [Google Scholar]
- 41.Laflamme D. 1997. Development and validation of a body condition score system for dogs. Canine Practice. 22, 10–15. [Google Scholar]
- 42.Warton DI, Duursma RA, Falster DS, Taskinen S. 2012. smatr 3– an R package for estimation and inference about allometric lines. Methods Ecol. Evol. 3, 257–259. ( 10.1111/j.2041-210X.2011.00153.x) [DOI] [Google Scholar]
- 43.Lovich JE, Gibbons JW. 1992. A review of techniques for quantifying sexual size dimorphism. Growth Dev. Aging. 56, 269. [PubMed] [Google Scholar]
- 44.Venables WN, Ripley BD. 2002. Modern applied statistics with S, 4th edn New York, NY: Springer. [Google Scholar]
- 45.Bookstein FL. 1991. Morphometric tools for landmark data: geometry and biology, p. 455 Cambridge, UK: Cambridge University Press. [Google Scholar]
- 46.Adams DC, Otárola-Castillo E. 2013. Geomorph: an R package for the collection and analysis of geometric morphometric shape data. Methods Ecol. Evol. 4, 393–399. ( 10.1111/2041-210X.12035) [DOI] [Google Scholar]
- 47.Benjamini Y, Hochberg Y. 1995. Controlling the false discovery rate: a practical and powerful approach to multiple testing. J. R. Stat. Soc. B (Methodological). 57, 289–300. ( 10.1111/j.2517-6161.1995.tb02031.x) [DOI] [Google Scholar]
- 48.Jones ME, Stoddart DM. 1998. Reconstruction of the predatory behaviour of the extinct marsupial thylacine (Thylacinus cynocephalus). J. Zool. 246, 239–246. ( 10.1111/j.1469-7998.1998.tb00152.x) [DOI] [Google Scholar]
- 49.Wroe S. 2001. Maximucinus muirheadae, gen. et sp. nov. (Thylacinidae: Marsupialia), from the Miocene of Riversleigh, north-western Queensland, with estimates of body weights for fossil thylacinids. Aust. J. Zool. 49, 603–614. ( 10.1071/ZO01044) [DOI] [Google Scholar]
- 50.Jones ME. 2003. Convergence in ecomorphology and guild structure among marsupial and placental carnivores. In Predators with pouches: the biology of carnivorous marsupials (eds Jones M, Dickman CR, Archer M), pp. 285–296. Collingwood, Australia: CSIRO Publishing. [Google Scholar]
- 51.Jones ME. 1997. Character displacement in Australian dasyurid carnivores: size relationships and prey size patterns. Ecology 78, 2569–2587. ( 10.1890/0012-9658(1997)078[2569:CDIADC]2.0.CO;2) [DOI] [Google Scholar]
- 52.Andersen GE, Johnson CN, Jones ME. 2020. Space use and temporal partitioning of sympatric Tasmanian devils and spotted-tailed quolls. Austral Ecol. 45, 355–365. ( 10.1111/aec.12865) [DOI] [Google Scholar]
- 53.Jones ME. 2008. Tasmanian devil. In The mammals of Australia (eds Van Dyke S, Strahan R), pp. 78–80. Sydney, Australia: Reed New Holland. [Google Scholar]
- 54.Jones ME, Barmuta LA. 1998. Diet overlap and relative abundance of sympatric dasyurid carnivores: a hypothesis of competition. J. Anim. Ecol. 67, 410–421. ( 10.1046/j.1365-2656.1998.00203.x) [DOI] [Google Scholar]
- 55.Krefft G. 1868. XXXV.—Description of a new species of thylacine (Thylacinus breviceps). Ann. Mag. Nat. Hist. 2, 296–297. ( 10.1080/00222936808695804) [DOI] [Google Scholar]
- 56.Allport M. 1868. Remarks on Mr. Krefft's ‘Notes on the fauna of Tasmania.’ Papers Proc. R. Soc. Tasmania 1868, 33–36. [Google Scholar]
- 57.Moeller HF. 1968. Zur Frage der Parallelerscheinungen bei Metatheria und Eutheria: Vergleichende Untersuchungen an Beutelwolf und Wolf. Zeitschrift für Wissenschaftliche Zoologie. 177, 283–392. [Google Scholar]
- 58.Guiler ER. 1985. Thylacine: the tragedy of the Tasmanian tiger. Melbourne, Australia: Oxford University Press. [Google Scholar]
- 59.Rovinsky DS, Evans AR, Adams JW. 2019. The pre-Pleistocene fossil thylacinids (Dasyuromorphia: Thylacinidae) and the evolutionary context of the modern thylacine. PeerJ 7, e7457 ( 10.7717/peerj.7457) [DOI] [PMC free article] [PubMed] [Google Scholar]
- 60.Yates AM. 2014. New craniodental remains of Thylacinus potens (Dasyuromorphia: Thylacinidae), a carnivorous marsupial from the late Miocene Alcoota Local Fauna of central Australia. PeerJ. 2, e547 ( 10.7717/peerj.547) [DOI] [PMC free article] [PubMed] [Google Scholar]
- 61.Archer M, Hand S, Black K, Beck R, Arena D, Wilson L et al. 2016. A new family of bizarre durophagous carnivorous marsupials from Miocene deposits in the Riversleigh World Heritage Area, northwestern Queensland. Sci. Rep. 6, 1–12. ( 10.1038/s41598-016-0001-8) [DOI] [PMC free article] [PubMed] [Google Scholar]
- 62.Archer M, Christmas O, Hand SJ, Black KH, Creaser P, Godthelp H et al. 2016. Earliest known record of a hypercarnivorous dasyurid (Marsupialia), from newly discovered carbonates beyond the Riversleigh World Heritage Area, north Queensland. Mem. Mus. Vic. 74, 137–150. ( 10.24199/j.mmv.2016.74.13) [DOI] [Google Scholar]
- 63.Mitchell DR, Sherratt E, Ledogar JA, Wroe S. 2018. The biomechanics of foraging determines face length among kangaroos and their relatives. Proc. R. Soc. B 285, 1–9. ( 10.1098/rspb.2018.0845) [DOI] [PMC free article] [PubMed] [Google Scholar]
- 64.Mitchell DR, Wroe S. 2019. Biting mechanics determines craniofacial morphology among extant diprotodont herbivores: dietary predictions for the giant extinct short-faced kangaroo, Simosthenurus occidentalis. Paleobiology 45, 167–181. ( 10.1017/pab.2018.46) [DOI] [Google Scholar]
- 65.Travouillon KJ, Legendre S, Archer M, Hand SJ. 2009. Palaeoecological analyses of Riversleigh's Oligo-Miocene sites: implications for Oligo-Miocene climate change in Australia. Palaeogeogr. Palaeoclimatol. Palaeoecol. 276, 24–37. ( 10.1016/j.palaeo.2009.02.025) [DOI] [Google Scholar]
- 66.Argot C, Babot J. 2011. Postcranial morphology, functional adaptations and palaeobiology of Callistoe vincei, a predaceous metatherian from the Eocene of Salta, north-western Argentina. Palaeontology 54, 447–480. ( 10.1111/j.1475-4983.2011.01036.x) [DOI] [Google Scholar]
- 67.Prevosti FJ, Forasiepi A, Zimicz N. 2013. The evolution of the Cenozoic terrestrial mammalian predator guild in South America: competition or replacement? J. Mamm. Evol. 20, 3–21. ( 10.1007/s10914-011-9175-9) [DOI] [Google Scholar]
- 68.Forasiepi AM, Judith Babot M, Zimicz N. 2015. Australohyaena antiqua (Mammalia, Metatheria, Sparassodonta), a large predator from the Late Oligocene of Patagonia. J. Syst. Palaeontol. 13, 503–525. ( 10.1080/14772019.2014.926403) [DOI] [Google Scholar]
- 69.Suarez C, Forasiepi AM, Goin FJ, Jaramillo C. 2016. Insights into the Neotropics prior to the Great American Biotic Interchange: new evidence of mammalian predators from the Miocene of Northern Colombia. J. Vertebr. Paleontol. 36, e1029581 ( 10.1080/02724634.2015.1029581) [DOI] [Google Scholar]
- 70.Wroe S, Argot C, Dickman C. 2004. On the rarity of big fierce carnivores and primacy of isolation and area: tracking large mammalian carnivore diversity on two isolated continents. Proc. R. Soc. B 271, 1203–1211. ( 10.1098/rspb.2004.2694) [DOI] [PMC free article] [PubMed] [Google Scholar]
- 71.Prevosti FJ, Forasiepi AM. 2018. Evolution of South American mammalian predators during the cenozoic: paleobiogeographic and paleoenvironmental contingencies, p. 186 Cham, Switzerland: Springer Geology. [Google Scholar]
- 72.Wilson GP, Ekdale EG, Hoganson JW, Calede JJ, Vander Linden A. 2016. A large carnivorous mammal from the Late Cretaceous and the North American origin of marsupials. Nat. Commun. 7, 1–10. ( 10.1038/ncomms13734) [DOI] [PMC free article] [PubMed] [Google Scholar]
- 73.Ercoli M, Prevosti F, Forasiepi A. 2014. The structure of the mammalian predator guild in the Santa Cruz Formation (late early Miocene). J. Mamm. Evol. 21, 369–381. ( 10.1007/s10914-013-9243-4) [DOI] [Google Scholar]
- 74.Zimicz N. 2014. Avoiding competition: the ecological history of Late Cenozoic metatherian carnivores in South America. J. Mamm. Evol. 21, 383–393. ( 10.1007/s10914-014-9255-8) [DOI] [Google Scholar]
- 75.Croft DA, Gelfo JN, López GM. 2020. Splendid innovation: the extinct South American native ungulates. Annu. Rev. Earth Planet Sci. 48, 259–290. ( 10.1146/annurev-earth-072619-060126) [DOI] [Google Scholar]
- 76.Millien V, Bovy H. 2010. When teeth and bones disagree: body mass estimation of a giant extinct rodent. J. Mammal. 91, 11–18. ( 10.1644/08-MAMM-A-347R1.1) [DOI] [Google Scholar]
- 77.Fariña RA, Vizcaíno SF, Bargo MS. 1998. Body mass estimations in Lujanian (late Pleistocene-early Holocene of South America) mammal megafauna. Mastozool. Neotrop. 5, 87–108. [Google Scholar]
- 78.Basu C, Falkingham PL, Hutchinson JR. 2016. The extinct, giant giraffid Sivatherium giganteum: skeletal reconstruction and body mass estimation. Biol. Lett. 12, 20150940 ( 10.1098/rsbl.2015.0940) [DOI] [PMC free article] [PubMed] [Google Scholar]
- 79.Richards HL, Wells RT, Evans AR, Fitzgerald EMG, Adams JW. 2019. The extraordinary osteology and functional morphology of the limbs in Palorchestidae, a family of strange extinct marsupial giants. PLoS ONE 14, e0221824 ( 10.1371/journal.pone.0221824) [DOI] [PMC free article] [PubMed] [Google Scholar]
- 80.Damuth J. 1990. Problems in estimating body masses of archaic ungulates using dental measurements. In Body size in mammalian paleobiology: estimation and biological implications (eds Damuth J, MacFadden BJ), pp. 229–253. Cambridge, UK: Cambridge University Press. [Google Scholar]
- 81.Fortelius M. 1990. Problems with using fossil teeth to estimate body sizes of extinct mammals. In Body size in mammalian paleobiology: estimation and biological implications (eds Damuth J, MacFadden BJ), pp. 207–228. Cambridge, UK: Cambridge University Press. [Google Scholar]
Associated Data
This section collects any data citations, data availability statements, or supplementary materials included in this article.
Supplementary Materials
Data Availability Statement
Three-dimensional surface meshes for volumetric mass estimation can be found at www.morphosource.org (Project: P1055), R code and data at https://figshare.com/projects/project/86588. All other data are included in the electronic supplementary material.