Abstract
Ground contact duration and stride frequency each affect muscle metabolism and help scientists link walking and running biomechanics to metabolic energy expenditure. While these parameters are often used independently, the product of ground contact duration and stride frequency (i.e. duty factor) may affect muscle contractile mechanics. Here, we sought to separate the metabolic influence of the duration of active force production, cycle frequency and duty factor. Human participants produced cyclic contractions using their soleus (which has a relatively homogeneous fibre type composition) at prescribed cycle-average ankle moments on a fixed dynamometer. Participants produced these ankle moments over short, medium and long durations while maintaining a constant cycle frequency. Overall, decreased duty factor did not affect cycle-average fascicle force (p ≥ 0.252) but did increase net metabolic power (p ≤ 0.022). Mechanistically, smaller duty factors increased maximum muscle-tendon force (p < 0.001), further stretching in-series tendons and shifting soleus fascicles to shorter lengths and faster velocities, thereby increasing soleus total active muscle volume (p < 0.001). Participant soleus total active muscle volume well-explained net metabolic power (r = 0.845; p < 0.001). Therefore, cyclically producing the same cycle-average muscle-tendon force using a decreased duty factor increases metabolic energy expenditure by eliciting less economical muscle contractile mechanics.
Keywords: economy, dynamometer, energetics, walk, run, soleus
1. Background
Linking biomechanics to metabolic energy expenditure is important for developing evolutionary hypotheses, understanding animal behaviour and informing interventions that reduce metabolic energy expenditure during locomotion. In search of this link, scientists have well-characterised the salient biomechanical and metabolic features of walking and running. Unfortunately, it is difficult to determine how individual biomechanical parameters affect metabolic energy expenditure because many parameters change in unison as animals alter their locomotion task (e.g. speed or slope). To navigate these concurrent changes, many scientists use the physical constraints of steady-state locomotion: the body's average net external mechanical work is a single number [1,2] and stride-average vertical ground reaction force equals body weight [3]. Even with guiding constraints, there are many viable theories regarding the biomechanical determinants of metabolic energy expenditure during steady-state locomotion [4–10].
One prevailing theory is that the volume of muscle activated to support body weight is a key factor driving metabolic energy expenditure during walking and running [11]. This theory is supported by muscle physiology studies, which suggest that active muscle volume is directly proportional to the number of active actin-myosin cross bridges [12,13]—the main source of muscle adenosine triphosphate (ATP) utilization [14,15]. Further, the requirement to support body weight over each stride dominates leg muscle force production and active muscle volume during locomotion [13,16–20]. Traditionally, scientists assume isometric contractions and calculate the active volume of each force-producing muscle (Vact,iso) using the corresponding muscle-tendon force (Fmt), optimal muscle fibre length (L0) and muscle stress (σ) (equation (1.1)) (see [12]):
| 1.1 |
After totalling the volume of each active muscle, scientists use this value to help relate walking and running biomechanics to metabolic energy expenditure [4,9,12,13,16,18,21].
Notably, isometric active muscle volume per se cannot link biomechanics and metabolic energy expenditure across many locomotor tasks. For instance, metabolic energy expenditure more than doubles across human walking [16,22] and running speeds [18,23] despite minimal changes in isometric active muscle volume [9,24,25]. Recognizing this disconnect, scientists typically incorporate additional parameters to their biomechanical explanations of metabolic energy expenditure [4,9,12,13,16,18,21]. Two such parameters that are easily measureable and probably serve as proxies for muscle ATP utilization are ground contact duration [18] and stride frequency [4,10]. Ground contact duration serves as the duration of active muscle force production, and decreasing it probably involves the activation of muscle fibres that use more ATP per unit active muscle volume (less economical muscle fibres) [12,18,26–29]. Stride frequency serves as a muscle's active force production cycle frequency, and increasing it probably increases ATP utilisation primarily owing to transporting ions (Ca2+ and Na+-K+) across cell membranes at faster rates [14,30,31]. Based on the compelling rationale and many supporting studies, scientists often use ground contact duration [18,19] or stride frequency [4,10] to help link biomechanics to metabolic energy expenditure.
In addition to their respective influences, decreasing the product of single-leg ground contact duration (tc) and stride frequency (Freqstride)—namely, duty factor (DF; equation (1.2))—may cause muscles to actively produce force in a manner that increases metabolic energy expenditure (electronic supplementary material):
| 1.2 |
To briefly explain, while producing the same cycle-average force, decreasing duty factor requires animals to produce greater peak muscle forces (figure 1). Greater peak muscle forces further stretch in-series tendons, yielding greater muscle fibre shortening. In turn, greater muscle fibre shortening decreases the muscle's potential to produce force owing to shorter operating lengths and faster shortening velocities (figure 1). Based on this framework, muscle force-length (FL) and force-velocity (FV) potential may be a function of duty factor (equation (1.3)):
| 1.3 |
Figure 1.
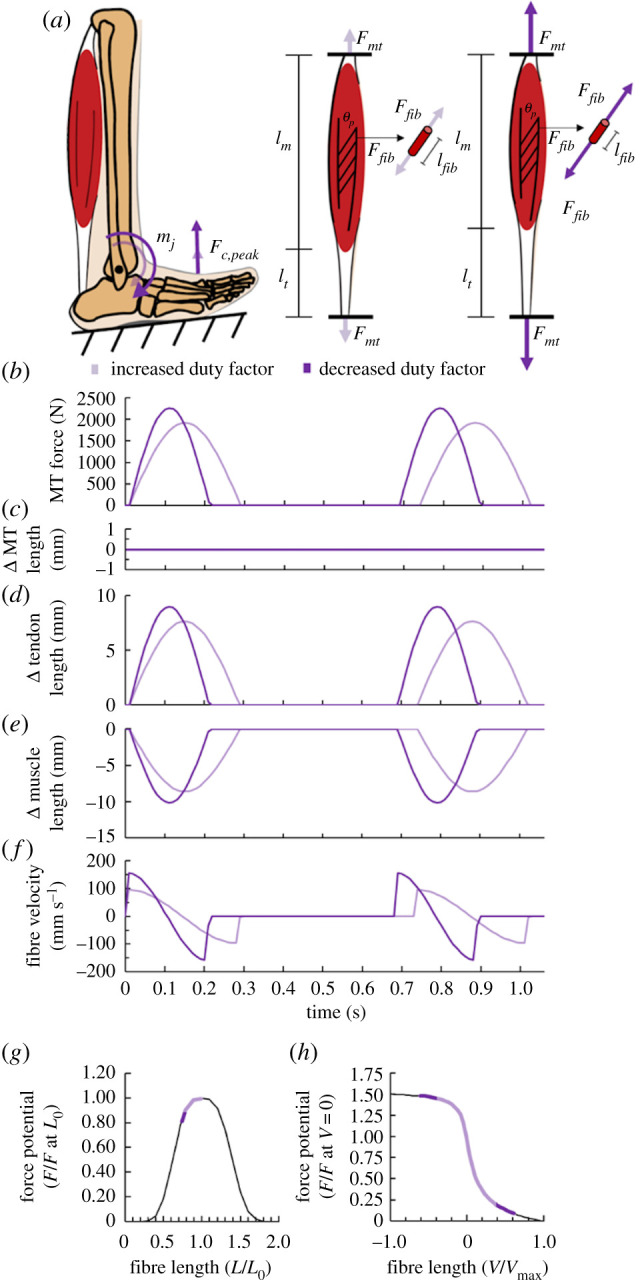
Duty factor influences muscle-tendon mechanics during cyclic contractions. Schematic showing (a) stance leg with a peak ground reaction force (Fc,peak) and plantar flexor joint moment (mj) during hypothetical conditions with a larger (lighter purple) and smaller (darker purple) duty factor. Graphical depictions of how we expect duty factor to affect the corresponding muscle-tendon force (Fmt), whole muscle length (lm), tendon length (lt), muscle fibre force (Ffib) and muscle fibre length (lfib). Time-series graphs of (b) muscle-tendon (MT) force, (c) MT length change, (d) tendon length change, (e) muscle fibre length change, and (f) muscle fibre velocity for the respective larger and smaller duty factor conditions. Expected normalized muscle fibre operating range depicted on Hill-type (g) force-length (FL) and (h) force-velocity (FV) curve for the respective larger and smaller duty factor conditions. L0 is optimal muscle fibre length. (Online version in colour.)
If so, smaller duty factors would require animals to activate a greater volume of muscle to continue producing the same cycle-average force. This notion can be formalized by incorporating equation (1.3) into the calculation of total active muscle volume (equation (1.4)), which updates the traditional isometric active muscle volume equation (equation (1.1)) by using active muscle fibre force (Fact) and muscle fibre force-length-velocity potential instead of muscle-tendon force and isometric force production, respectively [11]:
| 1.4 |
Subsequently, by accounting for the rate of metabolic energy expenditure per unit active muscle volume , changes in total active muscle volume theoretically mimic changes in metabolic energy expenditure :
| 1.5 |
Altogether, walking and running with a smaller duty factor may increase total active muscle volume (equation (1.4)) and metabolic energy expenditure (equation (1.5)) by decreasing muscle fibre force-length and force-velocity potential (equation (1.3)).
The goal of this study was to deduce whether duty factor affects metabolic energy expenditure during walking and running. To accomplish this goal, we devised a protocol where human participants cyclically produced the same cycle-average plantar flexion moment while performing zero gross ankle mechanical work on a fixed dynamometer pedal. Within each trial, participants maintained the same cycle frequency and produced plantar flexion moments using only their soleus over short, medium or long durations (small, medium or large duty factors, respectively). By studying the soleus, which has a relatively homogeneous fibre-type composition [32], the greater metabolic energy expenditure that is associated with activating less economical muscle fibres over shorter durations of active force production should be trivial. This enabled us to investigate how duty factor affects metabolic energy expenditure, independent from the metabolic influence of active force production duration (e.g. fibre-type recruitment) and cycle frequency (e.g. ion pumping). Because we expected duty factor to affect muscle contractile mechanics and total active muscle volume (equations (1.3), (1.4) and electronic supplementary material), we hypothesized that decreasing duty factor would increase metabolic energy expenditure.
2. Methods
Eleven of the 14 volunteers who enrolled in our study completed the protocol (resulting sample size: 11 participants; average ± s.d.; age: 24.5 ± 3.5 years; height: 1.78 ± 0.06 m; mass: 74.8 ± 10.7 kg; Achilles tendon moment arm: 5.0 ± 0.8 cm; optimal soleus fascicle length: 3.86 ± 0.7 cm; maximum soleus fascicle shortening velocity: 26.1 ± 4.6 cm s−1; and resting metabolic power 80 ± 11 W). The three volunteers who enrolled but did not complete the protocol were removed from the analyses because they were unable to achieve the targeted muscle-tendon mechanical output and yield serviceable metabolic data for at least half of their trials. All participants were apparently free of cardiovascular, orthopedic and metabolic disorders. Prior to the study, each participant gave informed written consent in accordance with the Georgia Institute of Technology Central Institutional Review Board.
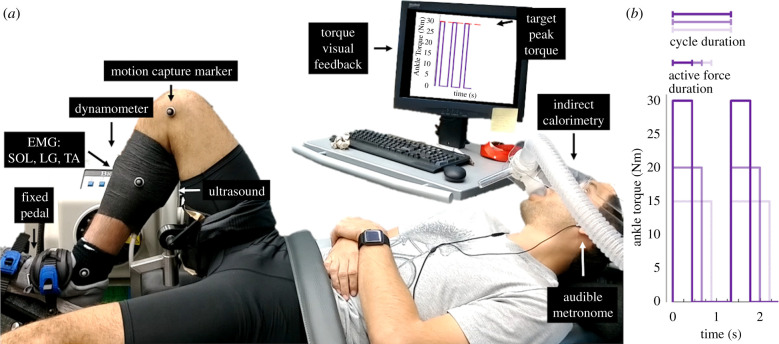
We instructed participants to arrive at the laboratory in the morning following an overnight fast. After arriving at the laboratory, participants laid supine on a dynamometer with custom attachments that supported their legs in the testing position: right knee and ankle supported at 50° and 90°, respectively, and left leg supported as desired (figure 2). Ninety degrees indicates perpendicular segments and more acute angles indicates joint flexion. In this position, participants performed a 10 min resting trial while breathing in and out of a mouth piece that funnelled expired air to a metabolic cart (TrueOne 2400, ParvoMedic, Sandy, UT, USA).
Figure 2.
(a) Experimental setup of a participant cyclically generating soleus muscle-tendon force to produce a plantar flexor moment that exerts an external torque on a fixed dynamometer pedal following the cues of an audible metronome and visual feedback. EMG, electromyography; SOL, soleus; LG, lateral gastrocnemius; TA, tibialis anterior. (b) Ankle torque versus time for three conceptual trials that yield the same average ankle torque. (Online version in colour.)
Following the resting trial, we shaved and used electrode preparation gel (NuPrep, Weaver and Co., Aurora, CO) to lightly abrade the skin superficial to each participant's right tibialis anterior, lateral gastrocnemius and soleus. Next, we placed a bipolar surface electrode (Delsys Inc., Natick, MA) over the skin superficial to each respective muscle belly and in the same orientation as the muscle fascicles. We verified each electrode position and signal quality by visually inspecting the electromyographic (EMG) signals while participants activated and de-activated each muscle. We secured a linear-array B-mode ultrasound probe (Telemed, Vilnius, Lituania) to the skin superficial of each participant's right anterio-medial soleus. Additionally, we placed reflective markers on the dynamometer at its axis of rotation, 10 cm above the axis of rotation, as well as on the participant's skin/clothes superficial to their right leg's medial knee-joint centre, medial mid-shank, medial malleolus and at the head of the first metatarsal (figure 2).
Subsequently, participants laid back down on the dynamometer and performed three plantar flexor maximum voluntary contractions (MVCs) with their ankle joint centre in-line with the dynamometer's axis of rotation (Biodex Medical Systems Inc., USA). In a random order, participants conducted an MVC with their right knee at approximately 70°, 60° and 50° and their ankle at 90° [33]. At least 2 min of rest preceded each MVC to mitigate fatigue [34]. Because MVC ankle moment did not change across knee-angles (repeated measures ANOVA: p = 0.173), we deemed the contribution of the bi-articular gastrocnemius on ankle moment to be negligible [33,35]. Participants performed all subsequent testing with their knee at 50°.
Next, participants performed six, 5 min trials with least 5 min of rest preceding each trial. These trials consisted of each participant repeatedly producing plantar flexor moments on a fixed-position dynamometer foot-pedal at the downbeat of an audible metronome and then relaxing at the subsequent upbeat (figure 2): repeating downbeat-active force production and upbeat-no force production. We systematically varied the duration between the downbeats and upbeats to alter the duration of active force production (three targeted active force production durations: ) while always targeting a total force production cycle that equalled s (three targeted duty factors: , 0.5, , respectively) (figure 2).
To guide ankle plantar flexor moment throughout each trial, participants watched a computer screen that displayed the trial's target peak dynamometer torque (10, 15, 20 or 30 Nm) and the recorded dynamometer torque profile over the previous 5-10 s (figure 2). We wanted each participant to achieve three lower (6.7–7.5 Nm) and three higher (10 Nm) average moment trials, while using a short, medium and long duration of active muscle-tendon force production within each moment level. We randomized the trial order. Throughout these trials, we collected oxygen uptake and carbon dioxide production, recorded dynamometer torque (100 Hz), motion capture data (200 Hz) (Vicon Motion Systems, UK), tracked soleus fascicle length and orientation (100 Hz) and quantified the muscle activity of the soleus, tibialis anterior and lateral gastrocnemius (1000 Hz) (figure 2).
(a). Metabolic energy expenditure
During the resting trial and each 5 min trial, we employed open-circuit expired gas analysis to record the participant's rates of oxygen uptake (V̇o2) and carbon dioxide production (V̇co2). We averaged V̇o2 and V̇co2 over the last minute of each trial and used a standard equation to calculate metabolic power (W) [36]. Next, we subtracted each participant's resting metabolic power from their experimental values to yield net metabolic power. We removed two (of 77) metabolic data values from our analyses because the corresponding respiratory exchange ratio did not reflect a respiratory quotient value that was indicative of fat and/or carbohydrate oxidation (0.7–1.0) [36].
(b). Soleus kinematics
We recorded B-mode ultrasound images containing anterio-medial soleus fascicles through a longitudinal cross section at a depth of 8 cm. We recorded soleus fascicle images during 20 s in the last 2 min of the metabolic trials. Within these 20 s, we post-processed soleus fascicle pennation angles and lengths throughout six consecutive moment generation cycles using a semi-automated tracking software [37]. For semi-automated images that did not accurately track the respective soleus fascicle's orientation and/or length, we manually redefined the software's identification of the desired fascicle. We filtered soleus fascicle angle and length using a fourth-order low-pass Butterworth filter (6 Hz) and took the derivative of fascicle length with respect to time to determine fascicle velocity (Mathworks Inc., Natick, MA, USA). Owing to technical difficulties, we excluded soleus fascicle data from two (of 66) experimental trials. We used the mechanics of the tracked fascicle per trial and generalized them to the entire soleus muscle. Non-soleus leg muscle fascicles have been shown to positively correlate with fascicle length changes along the muscle [38] and sarcomere [39].
(c). Soleus kinetics
Using a custom Matlab script (Mathworks Inc., Natick, MA, USA), we filtered motion capture data using a fourth-order low-pass Butterworth filter (6 Hz) and subtracted the resting dynamometer torque from that of the corresponding trial. We computed net dynamometer torque and the duration of active force production from 12 consecutive moment generation cycles that encompassed the analysed fascicle kinematic data. Owing to small fluctuations in dynamometer torque, we implemented a 1 Nm dynamometer torque threshold to decipher the duration of active force production. Using the filtered data and anthropometric measures, we calculated the instantaneous ankle joint angle and estimated the change in soleus muscle-tendon moment arm lengths [40]. Because the metabolic trials that have the greatest target peak torque exhibited a peak ankle angle that deviated a mere 1.8° from the resting angle, we considered Achilles tendon moment arm length to be constant during all trials. A 1.8° change in ankle angle alters moment arm length by less than 5% [40]. Then, we calculated the net ankle moment using dynamometer torque and the position of the ankle's axis of rotation relative to the dynamometer's axis of rotation. We calculated soleus muscle-tendon force by dividing net ankle moment (Mank) by the Achilles tendon moment arm length (rAT), and then we divided soleus muscle-tendon force by fascicle pennation angle to estimate soleus fascicle force (Fsol):
| 2.1 |
Next, we calculated soleus isometric active muscle volume using soleus muscle-tendon force and equation (1.1), where optimal fascicle length equals participant resting soleus fascicle length and stress equals 20 N cm−2 [41]. We calculated soleus total active muscle volume using equation (1.4), soleus fascicle force, and the same optimal fascicle length and stress values used in the isometric active muscle volume calculation [11]. Additionally, we reasoned that maximal soleus shortening velocity equals 6.77 L0 s−1 [42], that initial participant resting pennation angle was consistent across trials and that passive soleus fascicle force was negligible.
(d). Muscle activation
We band-pass filtered the raw tibialis anterior, soleus and lateral gastrocnemius EMG signals between 20 and 450 Hz from the same 12 consecutive torque generation cycles that we used to assess ankle moment. We full-wave rectified the filtered EMG signals and calculated the root mean square of the rectified signals using a 40 ms moving window [43].
(e). Statistical analyses
Unless otherwise specified, we independently performed all statistical tests within the targeted lower and higher cycle-average torque trials. We performed t-tests to determine whether the targeted lower and higher cycle-average torque trials elicited different cycle-average plantar flexion moments and force production cycle frequencies. Next, we performed one-way repeated measures ANOVAs to determine the influence of the duration of active force production and/or duty factor on cycle-average ankle moment, force production cycle frequency, average and maximum soleus fascicle pennation angle, isometric and total soleus active muscle volume, minimum and average fascicle length, average and maximum fascicle velocity, as well as net metabolic power. We performed a multiple linear regression with the factors of the participant and total soleus active muscle volume versus net metabolic power. We performed repeated measures ANOVAs to test for the independent effects of duty factor and total soleus active muscle volume on cycle-average soleus, lateral gastrocnemius, and tibialis anterior activation. We set significance as α = 0.05 and performed statistical analyses using RStudio software (RStudio, Inc., Boston, MA, USA).
3. Results
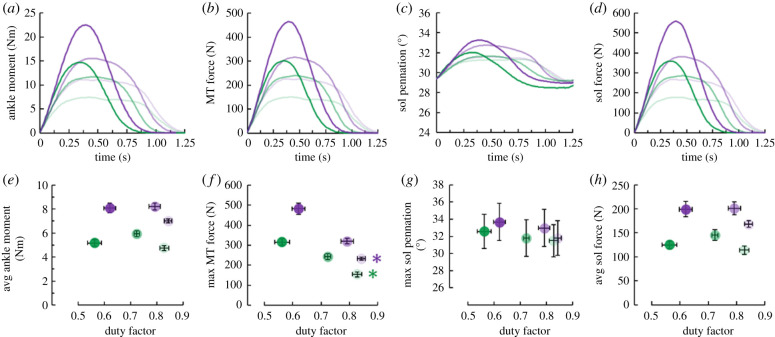
The participants well-performed the protocol. As desired, participants performed two distinct cycle-average ankle moment levels (lower and higher moment levels) (figure 3). Compared to the lower moment level, the higher moment level elicited a 48% greater cycle-average ankle moment (p < 0.001) and non-different cycle frequency (p = 0.141) (table 1). Importantly, within each moment level, both the duration of active force production and duty factor did not affect cycle-average ankle moment (p ≥ 0.699) (figure 3) or cycle frequency (p ≥ 0.175) (table 1). Unless otherwise specified, each p-value covers both moment levels for the respective comparison. Even though participants did not perfectly achieve the targeted dynamometer torque magnitudes and durations, they did successfully vary their duration of active force production while maintaining a constant total cycle-average ankle moment and cycle frequency. Also, the ankle's effective mechanical advantage was constant and duty factor did not affect soleus fascicle pennation angle (average and maximum pennation angle: p ≥ 0.240 and p ≥ 0.091, respectively). Altogether, the duty factor did not influence cycle-average fascicle force (figure 3) or isometric active muscle volume (p ≥ 0.252).
Figure 3.
Top row: time-series plots of average (a) ankle moment, (b) muscle-tendon (MT) force, (c) soleus (sol) pennation angle, and (d) soleus fascicle force. Bottom row: average (± s.e.) (e) average ankle moment, (f) maximum MT force, (g) maximum pennation angle and (h) average soleus fascicle force versus duty factor. Green and purple symbols indicate the lower and higher average ankle moment levels, respectively. Lighter to darker colours indicate longer to shorter durations of active force production per ankle moment level. Green and purple asterisks (*) indicate that the corresponding average moment level's duty factor affects the indicated dependent variable (p < 0.05). (Online version in colour.)
Table 1.
The lower and higher ankle moment level's average ± s.d. duration of active force production (tact), duration of the force generation cycle (tcycle), duty factor, and cycle-average ankle moment.
| moment level | tact (s) | tcycle (s) | duty factor | avg moment (Nm) |
|---|---|---|---|---|
| lower | 1.08 ± 0.11 | 1.33 ± 0.02 | 0.83 ± 0.05 | 4.75 ± 0.56 |
| lower | 0.97 ± 0.06 | 1.34 ± 0.02 | 0.72 ± 0.04 | 5.83 ± 0.72 |
| lower | 0.76 ± 0.12 | 1.33 ± 0.01 | 0.57 ± 0.08 | 5.17 ± 0.87 |
| higher | 1.11 ± 0.09 | 1.34 ± 0.02 | 0.85 ± 0.04 | 7.01 ± 0.66 |
| higher | 1.07 ± 0.07 | 1.32 ± 0.04 | 0.80 ± 0.07 | 8.21 ± 0.93 |
| higher | 0.86 ± 0.13 | 1.33 ± 0.01 | 0.63 ± 0.07 | 8.08 ± 1.36 |
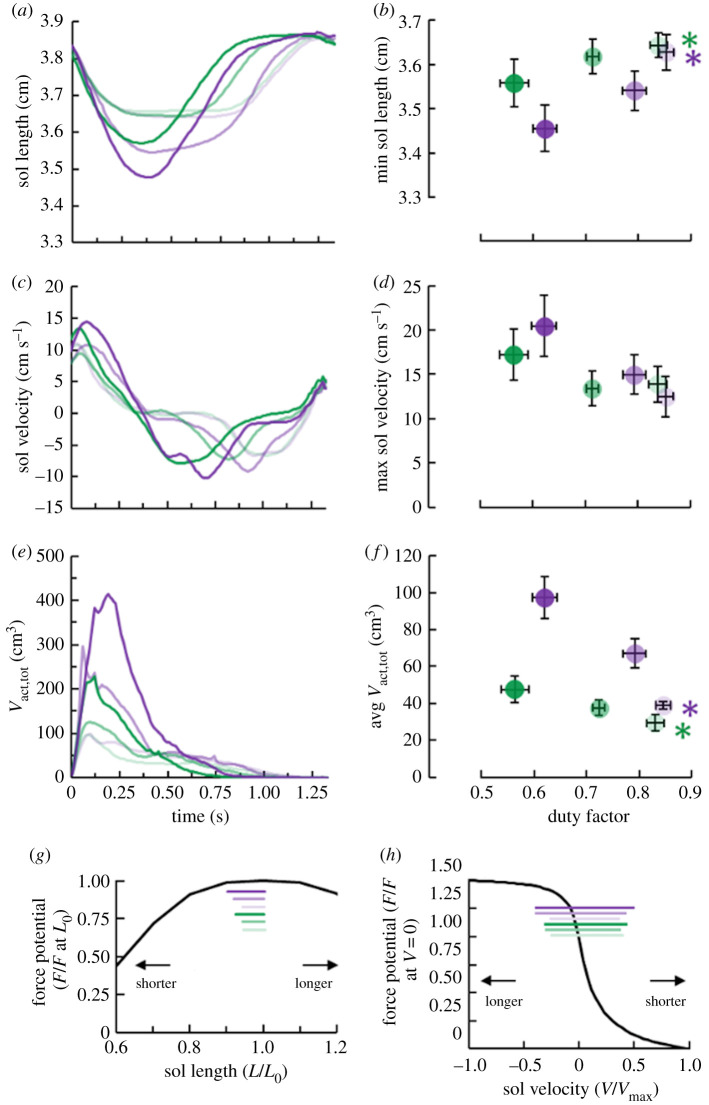
Despite not affecting isometric active muscle volume (equation (1.1)), duty factor influenced total active muscle volume (p < 0.001) (equation (1.4)) by modulating soleus fascicle force-length and force-velocity potential. Within each cycle-average moment level, decreasing duty factor elicited shorter minimum (p ≤ 0.047) but not average (p ≥ 0.644) soleus fascicle lengths (figure 4). Duty factor affected average soleus fascicle velocity within the lower (p = 0.027), but not the higher (p = 0.122) moment level. Despite visible trends, duty factor did not statistically affect maximum soleus fascicle velocity (p ≥ 0.122) (figure 4). Nonetheless, combining the trends of decreasing duty factors, shorter fascicle lengths and faster velocities; decreasing duty factor increased total soleus active muscle volume within both moment levels (p < 0.001) (figure 4). Further, because decreasing duty factor reduced soleus force-length and force-velocity potential but did not affect pennation angle, it increased the difference between total and isometric active muscle volume within each moment level (p < 0.001) (electronic supplementary material, figure S2).
Figure 4.
Left column: average time-series graphs of (a) soleus (sol) fascicle length, (c) soleus fascicle shortening velocity and (e) total soleus active muscle volume (Vact,tot). Right column: average (± s.e.) (b) minimum soleus fascicle length, (d) maximum soleus fascicle velocity and (f) cycle-average total soleus active muscle volume versus duty factor. Bottom row: Hill-type (g) force-length force potential expressed as a fraction of force (F) at optimal fascicle length (L0), and (h) force-velocity potential expressed as a fraction of force at zero velocity (V). Maximum shortening velocity is expressed as Vmax. Lighter to darker colour indicates longer to shorter duration of active force production per ankle moment level. Green and purple asterisks (*) indicate that the corresponding average moment level's duty factor affects the indicated dependent variable (p < 0.05). (Online version in colour.)
As hypothesized, decreased duty factor increased net metabolic power (p ≤ 0.022) (figure 5). Averaged across both moment levels, decreasing duty factor 29% increased net metabolic power 52%. The inverse relationship between duty factor and net metabolic power was probably related to changes in total soleus active muscle volume. Across both moment levels, participant total active muscle volume explained 72% of the change in net metabolic power (r = 0.845; p < 0.001) (figure 6).
Figure 5.
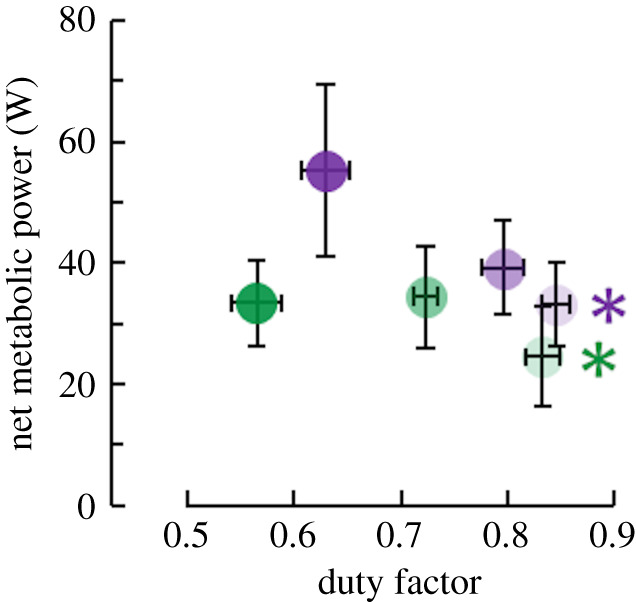
Average (± s.e.) net metabolic power versus duty factor. Lighter to darker colour indicates longer to shorter duration of active moment production per ankle moment level. Green and purple asterisks (*) indicate that total soleus active muscle volume affects the indicated dependent variable (p < 0.05). (Online version in colour.)
Figure 6.
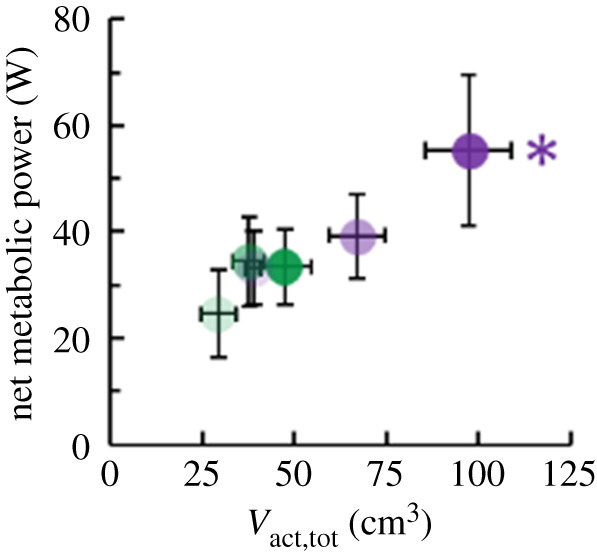
Average (± s.e.) net metabolic power versus total soleus active muscle volume (Vact,tot). Lighter to darker colour indicates longer to shorter duration of active moment production per ankle moment level. Green and purple asterisks (*) indicate that total soleus active muscle volume affects the indicated dependent variable (p < 0.05). (Online version in colour.)
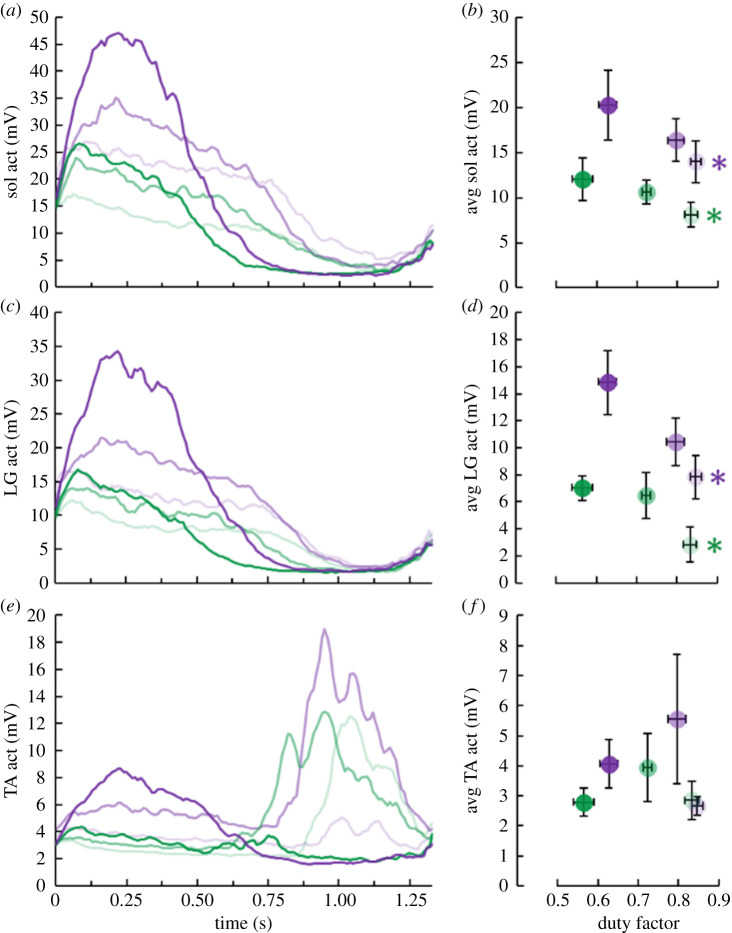
Based on muscle activation patterns, we presume that antagonist co-activation did not affect the relationships between duty factor, total soleus active muscle volume and net metabolic power. Cycle-average tibialis anterior activation was independent of both duty factor and total soleus active muscle volume within each moment level (p ≥ 0.363) (figure 7). Additionally, decreasing duty factor and increasing total soleus active muscle volume both yielded greater soleus (p ≤ 0.010) and lateral gastrocnemius (p ≤ 0.033) activation (figure 7).
Figure 7.
Time-series graphs of average (a) soleus (sol), (c) lateral gastrocnemius (LG) and (e) tibalis anterior (TA) activation (act) for each ankle moment and duration of force generation level combination. Average (± s.e.) (b) soleus, (d) lateral gastrocnemius and (f) tibalis anterior activation versus duty factor. Lighter to darker colour indicates longer to shorter duration of active force production per ankle moment level. Green and purple asterisks (*) indicate that the corresponding average moment level's duration of active force production affects the indicated dependent variable (p < 0.05). (Online version in colour.)
4. Discussion
To help link walking and running biomechanics to metabolic energy expenditure, we applied two physical constraints of steady-state locomotion (i.e. constant cycle-average force and mechanical work) to each participant's ankle and quantified their soleus fascicle mechanics and net metabolic power. We strategically fixed effective mechanical advantage, in addition to the metabolic influence of the duration of active force production and cycle frequency, enabling us to focus on the metabolic influence of duty factor. The results of our study support the hypothesis that decreasing duty factor increases metabolic energy expenditure. As such, accounting for duty factor may help scientists link walking and running biomechanics to metabolic energy expenditure.
Our results suggest that decreasing duty factor increases metabolic energy expenditure by altering muscle-tendon contractile mechanics. Specifically, a smaller duty factor incurs greater peak muscle-tendon forces, thereby causing greater tendon stretch and muscle fascicle shortening. This accentuated fascicle shortening reduces muscle force-length and force-velocity potential, requiring a greater total active muscle volume to continue producing the same cycle-average force [11] (figure 4). Many studies have used isometric active muscle volume to help explain the metabolic energy expenditure of tasks that require approximately zero net mechanical work (e.g. steady-state level-ground walking and running) [9,12,13,16,18,19] (equation (1.1)), but isometric active muscle volume failed to fully explain the present study's results. Further, total active muscle volume (equation (1.4)), which accounts for soleus fascicle force-length and force-velocity potential, well-explained duty factor's effect on net metabolic power (figure 6). Aside from the present study, the influence of total active muscle volume on metabolic energy expenditure is relatively untested [11]. Previously, Kipp et al. [9] reported that calculating the active muscle volume of human runners using stance-average force better explained metabolic energy expenditure across speeds versus using stride-average force. Notably, stance-average vertical ground reaction force (Fc,avg) equals stride-average vertical ground reaction force (Fs,avg) divided by two times the duty factor (DF; equation (4.1)):
| 4.1 |
Hence, Kipp et al. [9] effectively calculated one-half total active muscle volume (assuming that force-length-velocity potential is a function of duty factor (equation (1.3)) and concluded that it better explained metabolic energy expenditure during running than isometric active muscle volume. Combining Kipp et al.'s [9] data with the present study's moderate correlation between duty factor and total minus isometric active muscle volume (r = −0.602; p = 0.010) (electronic supplementary material, figure S2), duty factor may be a viable surrogate for estimating the muscle fascicle force-length-velocity potential during walking and running.
In the present study, we sought to decouple the metabolic influence of the duration of active force production and duty factor while muscle-tendons cyclically produced the same cycle-average force using a constant cycle frequency. To do so, we set each participant's knee angle to 50°, which probably placed slack in bi-articular gastrocnemius muscle-tendons and yielded the soleus as the primary contributor to the plantar flexion moment [33,35]. Because the soleus, but not the gastrocnemius muscles, cyclically produced force that generated the plantar flexion moment, we deemed the gastrocnemius muscles to elicit a fairly constant and small metabolic energy expenditure across conditions. As such, we attributed the change in metabolic energy expenditure across conditions to the soleus. Producing the same cycle-average force over shorter durations typically increases metabolic energy expenditure owing to the activation of faster, less economical muscle fibres [12,17,18]. However, given soleus' relatively homogeneous muscle fibre composition [32], it probably yields similar rates of metabolic energy per unit active muscle volume ( in equation (1.5)). Therefore, we reasoned that the metabolic influence of the duration of active force production was probably minimal in our study. To ensure that the activation of different muscle fibre types (from the soleus and gastrocnemius muscles) did not affect our conclusions, we performed post-hoc analyses which revealed that scaling total active muscle volume by the rate of active force production (1/ground contact duration in [17,18]) did not improve the correlation between participant total active muscle volume and net metabolic power (r = 0.840 versus 0.845). In other words, assuming that shorter durations of active force production recruited less economical muscle fibres did not improve the correlation between total active muscle volume and net metabolic power. Therefore, the increased metabolic energy expenditure typically associated with a shorter duration of active force production [17,18] was probably not present in our study.
Aside from total active muscle volume, there are other theories linking biomechanics to metabolic energy expenditure. One such theory is that positive muscle mechanical work drives metabolic energy expenditure [44,45]. In the present study, there was an inverse relationship between duty factor and positive muscle fascicle mechanical work (repeated measures ANOVA; both p ≤ 0.002). Further across our entire dataset, greater positive fascicle mechanical work was accompanied by increased net metabolic power (repeated measures ANOVA; p < 0.001) (electronic supplementary material, figure S3). Moreover, if muscle force-length-velocity potential and mechanical work are inversely related across many tasks, perhaps changes to both parameters are well-encapsulated by total active muscle volume. Future studies may be able to test this notion by evaluating the biomechanics and metabolic energy expenditure of muscles performing net positive or negative mechanical work.
In conclusion, under the mechanical work and force constraints of steady-state walking and running, decreasing duty factor may require animals to increase their metabolic energy expenditure. Mechanistically, a smaller duty factor probably causes muscles with compliant in-series tendons to generate force at decreased force-length-velocity potentials and perform greater gross mechanical work. Our results highlight that the metabolic energy expenditure of producing a fixed cycle-average muscle-tendon force depends not only on biomechanical factors, but also limb morphology. Accounting for both structural (e.g. tendon stiffness) and functional (e.g. duty factor) parameters may help scientists further explain the metabolic energy expenditure across locomotor modes, speeds and slopes, animals species, as well as across subjects that vary in age and pathology.
Supplementary Material
Acknowledgements
We thank the two reviewers for providing feedback that improved the quality of this manuscript.
Ethics
Prior to the study, each participant gave informed written consent in accordance with the Georgia Institute of Technology Central Institutional Review Board.
Data accessibility
Our data is available on the corresponding author's personal website: https://sites.google.com/view/owenbeck. There is a link under the respective study that takes you to an Excel sheet that has our data presented for the readership: https://drive.google.com/file/d/14BFdwuamHjcuaW1W0KvjwI8B6X78ewMs/view.
Authors' contributions
O.N.B. contributed to the conception and design of the study, acquisition of data, the analysis and interpretation of data, as well as the drafting of the article. J.G. contributed to acquisition of data and the revising of the article. J.R.F. contributed to the conception of the study, interpretation of data, as well as the drafting of the article. G.S.S. contributed to the conception and design of the study, the analysis and interpretation of data, as well as the drafting of the article. All authors approve of the manuscript and agree to be held accountable for all aspects of the work in ensuring that questions related to the accuracy or integrity of any part of the work are appropriately investigated and resolved.
Competing interests
We declare we have no competing interests.
Funding
This study was supported by a National Institute of Health's Institute of Aging Fellowship (F32AG063460) awarded to O.N.B. and a National Institute of Health's Institute of Aging grant no. (R0106052017) awarded to J.R.F. and G.S.S.
References
- 1.DeVita P, Helseth J, Hortobagyi T. 2007. Muscles do more positive than negative work in human locomotion. J. Exp. Biol. 210, 3361–3373. ( 10.1242/jeb.003970) [DOI] [PMC free article] [PubMed] [Google Scholar]
- 2.Holt NC, Roberts TJ, Askew GN. 2014. The energetic benefits of tendon springs in running: is the reduction of muscle work important? J. Exp. Biol. 217, 4365–4371. ( 10.1242/jeb.112813) [DOI] [PMC free article] [PubMed] [Google Scholar]
- 3.Taylor CR, Heglund NC, McMahon TA, Looney TR. 1980. Energetic cost of generating muscular force during running: a comparison of large and small animals. J. Exp. Biol. 86, 9–18. [Google Scholar]
- 4.Pontzer H. 2016. A unified theory for the energy cost of legged locomotion. Biol. Lett. 12, 20150935 ( 10.1098/rsbl.2015.0935) [DOI] [PMC free article] [PubMed] [Google Scholar]
- 5.Donelan JM, Kram R, Kuo AD. 2002. Mechanical work for step-to-step transitions is a major determinant of the metabolic cost of human walking. J. Exp. Biol. 205, 3717–3727. [DOI] [PubMed] [Google Scholar]
- 6.Alexander RM. 1997. Optimum muscle design for oscillatory movements. J. Theor. Biol. 184, 253–259. ( 10.1006/jtbi.1996.0271) [DOI] [PubMed] [Google Scholar]
- 7.Umberger BR, Gerritsen KG, Martin PE. 2003. A model of human muscle energy expenditure. Comput. Methods Biomech. Biomed. Engin. 6, 99–111. ( 10.1080/1025584031000091678) [DOI] [PubMed] [Google Scholar]
- 8.Lichtwark GA, Wilson AM. 2005. A modified Hill muscle model that predicts muscle power output and efficiency during sinusoidal length changes. J. Exp. Biol. 208, 2831–2843. ( 10.1242/jeb.01709) [DOI] [PubMed] [Google Scholar]
- 9.Kipp S, Grabowski AM, Kram R. 2018. What determines the metabolic cost of human running across a wide range of velocities? J. Exp. Biol. 221, jeb184218 ( 10.1242/jeb.184218) [DOI] [PubMed] [Google Scholar]
- 10.Doke J, Kuo AD. 2007. Energetic cost of producing cyclic muscle force, rather than work, to swing the human leg. J. Exp. Biol. 210, 2390-2398. ( 10.1242/jeb.02782) [DOI] [PubMed] [Google Scholar]
- 11.Beck ON, Punith LK, Nuckols RW, Sawicki GS. 2019. Exoskeletons improve locomotion economy by reducing active muscle volume. Exerc. Sport Sci. Rev. 47, 237–245. ( 10.1249/jes.0000000000000204) [DOI] [PubMed] [Google Scholar]
- 12.Taylor CR. 1994. Relating mechanics and energetics during exercise. Adv. Vet. Sci. Comp. Med. 38, 181–215. [PubMed] [Google Scholar]
- 13.Roberts TJ, Chen MS, Taylor CR. 1998. Energetics of bipedal running. II. Limb design and running mechanics. J. Exp. Biol. 201, 2753–2762. [DOI] [PubMed] [Google Scholar]
- 14.Rall JA. 1985. Energetic aspects of skeletal muscle contraction: implications of fiber types. Exerc. Sport Sci. Rev. 13, 33–74. [PubMed] [Google Scholar]
- 15.Barclay C. 2017. Energy demand and supply in human skeletal muscle. J. Muscle Res. Cell M 38, 143–155. ( 10.1007/s10974-017-9467-7) [DOI] [PubMed] [Google Scholar]
- 16.Griffin TM, Roberts TJ, Kram R. 2003. Metabolic cost of generating muscular force in human walking: insights from load-carrying and speed experiments. J. Appl. Physiol. 95, 172–183. ( 10.1152/japplphysiol.00944.2002) [DOI] [PubMed] [Google Scholar]
- 17.Kram R. 2000. Muscular force or work: what determines the metabolic energy cost of running. Exerc. Sport Sci. Rev. 28, 138–143. [PubMed] [Google Scholar]
- 18.Kram R, Taylor CR. 1990. Energetics of running: a new perspective. Nature 346, 265 ( 10.1038/346265a0) [DOI] [PubMed] [Google Scholar]
- 19.Roberts TJ, Kram R, Weyand PG, Taylor CR. 1998. Energetics of bipedal running. I. Metabolic cost of generating force. J. Exp. Biol. 201, 2745–2751. [DOI] [PubMed] [Google Scholar]
- 20.Arellano CJ, Kram R. 2014. Partitioning the metabolic cost of human running: a task-by-task approach. Integr. Comp. Biol. 54, 1084–1098. ( 10.1093/icb/icu033) [DOI] [PMC free article] [PubMed] [Google Scholar]
- 21.Nuckols RW, Dick TJM, Beck ON, Sawicki GS. 2020. Ultrasound imaging links soleus muscle neuromechanics and energetics during human walking with elastic ankle exoskeletons. Sci. Rep. 10, 3604 ( 10.1038/s41598-020-60360-4) [DOI] [PMC free article] [PubMed] [Google Scholar]
- 22.Bobbert AC. 1960. Energy expenditure in level and grade walking. J. Appl. Physiol. 15, 1015–1021. ( 10.1152/jappl.1960.15.6.1015) [DOI] [Google Scholar]
- 23.Batliner ME, Kipp S, Grabowski AM, Kram R, Byrnes WC. 2018. Does metabolic rate increase linearly with running speed in all distance runners? Sports Med. Int. Open 2, E1–E8. ( 10.1055/s-0043-122068) [DOI] [PMC free article] [PubMed] [Google Scholar]
- 24.Biewener AA. 1989. Scaling body support in mammals: limb posture and muscle mechanics. Science 245, 45-48. ( 10.1126/science.2740914) [DOI] [PubMed] [Google Scholar]
- 25.Biewener AA, Farley CT, Roberts TJ, Temaner M. 2004. Muscle mechanical advantage of human walking and running: implications for energy cost. J. Appl. Physiol. 97, 2266-2274. ( 10.1152/japplphysiol.00003.2004) [DOI] [PubMed] [Google Scholar]
- 26.Crow MT, Kushmerick MJ. 1982. Chemical energetics of slow- and fast-twitch muscles of the mouse. J. Gen. Physiol. 79, 147–166. ( 10.1085/jgp.79.1.147) [DOI] [PMC free article] [PubMed] [Google Scholar]
- 27.Woledge RC. 1968. The energetics of tortoise muscle. J. Physiol. 197, 685–707. ( 10.1113/jphysiol.1968.sp008582) [DOI] [PMC free article] [PubMed] [Google Scholar]
- 28.Barclay C. 2018. Efficiency of skeletal muscle. In Muscle and exercise physiology (ed. JA Zoladz), pp. 111–127. Cambridge, MA: Academic Press. [Google Scholar]
- 29.Barclay C. 2012. Quantifying Ca2+ release and inactivation of Ca2+ release in fast and slow-twitch muscles. J. Physiol. 590, 6199–6212. ( 10.1113/jphysiol.2012.242073) [DOI] [PMC free article] [PubMed] [Google Scholar]
- 30.Chasiotis D, Bergstrom M, Hultman E. 1987. ATP utilization and force during intermittent and continuous muscle contractions. J. Appl. Physiol. 63, 167–174. ( 10.1152/jappl.1987.63.1.167) [DOI] [PubMed] [Google Scholar]
- 31.Hogan MC, Ingham E, Kurdak SS. 1998. Contraction duration affects metabolic energy cost and fatigue in skeletal muscle. Am. J. Physiol. Cell Physiol. 274, E397–E402. ( 10.1152/ajpendo.1998.274.3.E397) [DOI] [PubMed] [Google Scholar]
- 32.Johnson MA, Polgar J, Weightman D, Appleton D. 1973. Data on the distribution of fibre types in thirty-six human muscles: an autopsy study. J. Neurol. Sci. 18, 111–129. ( 10.1016/0022-510X(73)90023-3) [DOI] [PubMed] [Google Scholar]
- 33.Rubenson J, Pires NJ, Loi HO, Pinniger GJ, Shannon DG. 2012. On the ascent: the soleus operating length is conserved to the ascending limb of the force–length curve across gait mechanics in humans. J. Exp. Biol. 215, 3539–3551. ( 10.1242/jeb.070466) [DOI] [PubMed] [Google Scholar]
- 34.Kawakami Y, Amemiya K, Kanehisa H, Ikegawa S, Fukunaga T. 2000. Fatigue responses of human triceps surae muscles during repetitive maximal isometric contractions. J. Appl. Physiol. 88, 1969–1975. ( 10.1152/jappl.2000.88.6.1969) [DOI] [PubMed] [Google Scholar]
- 35.Hof AL, van den Berg J. 1977. Linearity between the weighted sum of the EMGs of the human triceps surae and the total torque. J. Biomech. 10, 529–539. ( 10.1016/0021-9290(77)90033-1) [DOI] [PubMed] [Google Scholar]
- 36.Brockway J. 1987. Derivation of formulae used to calculate energy expenditure in man. Hum. Nutr. Clin. Nutr. 41, 463–471. [PubMed] [Google Scholar]
- 37.Farris DJ, Lichtwark GA. 2016. UltraTrack: software for semi-automated tracking of muscle fascicles in sequences of B-mode ultrasound images. Comput. Meth. Prog. Biol. 128, 111–118. ( 10.1016/j.cmpb.2016.02.016) [DOI] [PubMed] [Google Scholar]
- 38.Lichtwark G, Bougoulias K, Wilson A. 2007. Muscle fascicle and series elastic element length changes along the length of the human gastrocnemius during walking and running. J. Biomech. 40, 157–164. ( 10.1016/j.jbiomech.2005.10.035) [DOI] [PubMed] [Google Scholar]
- 39.Lichtwark GA, Farris DJ, Chen X, Hodges PW, Delp SL. 2018. Microendoscopy reveals positive correlation in multiscale length changes and variable sarcomere lengths across different regions of human muscle. J. Appl. Physiol. 125, 1812–1820. ( 10.1152/japplphysiol.00480.2018) [DOI] [PubMed] [Google Scholar]
- 40.Bobbert MF, Huijing PA, van Ingen Schenau GJ.. 1986. A model of the human triceps surae muscle-tendon complex applied to jumping. J. Biomech. 19, 887–898. ( 10.1016/0021-9290(86)90184-3) [DOI] [PubMed] [Google Scholar]
- 41.Perry AK, Blickhan R, Biewener AA, Heglund NC, Taylor CR. 1988. Preferred speeds in terrestrial vertebrates: are they equivalent? J. Exp. Biol. 137, 207–219. [DOI] [PubMed] [Google Scholar]
- 42.Bohm S, Mersmann F, Santuz A, Arampatzis A. 2019. The force–length–velocity potential of the human soleus muscle is related to the energetic cost of running. Proc. R. Soc. B 286, 20192560 ( 10.1098/rspb.2019.2560) [DOI] [PMC free article] [PubMed] [Google Scholar]
- 43.Carlo JDL. 1997. The use of surface electromyography in biomechanics. J. Appl. Biomech. 13, 135–163. ( 10.1123/jab.13.2.135) [DOI] [Google Scholar]
- 44.Mian OS, Thom JM, Ardigò LP, Narici MV, Minetti AE. 2006. Metabolic cost, mechanical work, and efficiency during walking in young and older men. Acta Physiol. 186, 127–139. ( 10.1111/j.1748-1716.2006.01522.x) [DOI] [PubMed] [Google Scholar]
- 45.van der Zee TJ, Lemaire KK, van Soest AJ.. 2019. The metabolic cost of in vivo constant muscle force production at zero net mechanical work. J. Exp. Biol. 222, jeb199158 ( 10.1242/jeb.199158) [DOI] [PubMed] [Google Scholar]
Associated Data
This section collects any data citations, data availability statements, or supplementary materials included in this article.
Supplementary Materials
Data Availability Statement
Our data is available on the corresponding author's personal website: https://sites.google.com/view/owenbeck. There is a link under the respective study that takes you to an Excel sheet that has our data presented for the readership: https://drive.google.com/file/d/14BFdwuamHjcuaW1W0KvjwI8B6X78ewMs/view.


