

Abstract
Policy Points.
Protective transgender‐specific policies (including those related to experiences of discrimination, health insurance coverage, and changing legal documents) are associated with increased access to medical gender affirmation services (hormone treatment, therapy/counseling) for transgender and other gender‐diverse people. Restrictive transgender‐specific policies are associated with less access to these services.
The relationship between race/ethnicity and use of medical gender affirmation services varies across states and is context specific, indicating that race/ethnicity also plays a role in access to these types of care across states.
Advocacy is needed to prevent or overturn restrictive policies and promote protective policies for transgender and other gender‐diverse people, especially for people of color.
Context
In the 2010s, the number of federal, state, and local transgender‐specific policies increased. Some of these policies advanced protections for transgender and other gender‐diverse (TGGD) people, and others were restrictive. Little is known about the relationships between these policies and use of medical gender affirmation services (eg, hormone treatment, therapy/counseling), or about how these associations may vary among different racial and ethnic groups.
Methods
Multilevel modeling was used to examine the associations between state‐level transgender‐specific policies and the use of medical gender affirmation services among TGGD people in the United States. Data are from the 2015 U.S. Trans Survey of nearly 28,000 TGGD people. The medical gender affirmation services examined in this study were hormone treatment and therapy/counseling. The state policies we analyzed addressed discrimination, health insurance coverage, and changing legal documents; these policies were measured individually and as a composite index. Race/ethnicity was included in the multilevel regression models as a random slope to determine whether the relationship between race/ethnicity and the use of medical gender affirmation services varied by state.
Findings
Individual policies and the policy index were associated with both outcomes (use of therapy/counseling and hormone treatment services), indicating that protective policies were associated with increased care. Broad religious exemption laws and Medicaid policies that excluded transgender‐specific care were both associated with less use of therapy/counseling, whereas transgender‐care‐inclusive Medicaid policies were associated with more use of therapy/counseling. Nondiscrimination protections that include gender identity were associated with increased use of hormone treatment services. The relationship between race/ethnicity and medical gender affirmation services varied across states.
Conclusions
State‐level transgender‐specific policies influence medical gender affirmation service use and seem to affect use by non‐Hispanic white TGGD people and TGGD people of color differently. Advocacy is needed to repeal restrictive policies and promote protective policies in order to reduce health inequities among TGGD people, especially people of color.
Keywords: Transgender, medical gender affirmation, hormone treatment, intersectionality, therapy, stigma, policies, health care
Although not all transgender and other gender‐diverse (TGGD) people (ie, individuals whose gender identity is not the same as the sex assigned to them at birth) seek medical gender affirmation services (eg, therapy/counseling, hormone treatment, surgery), these services play an essential role in improving quality of life and mental health for those who do. 1 However, there are often numerous barriers to accessing these services, 2 , 3 , 4 and many TGGD people are unable to access these services when they want them. 5 Research exploring these barriers has focused on issues related to health insurance and the health care experience (eg, stigma within health care settings, medical gatekeeping, lack of provider knowledge), 2 , 4 but little is known about how state‐level US policies influence the use of medical gender affirmation services.
The prevalence of state and federal policies specific to the experiences of TGGD people has been increasing over the past decade. 6 , 7 These policies are both restrictive and protective, and are important for the health of TGGD people. 8 , 9 , 10 Such policies can determine access to resources (eg, employment, housing, health insurance), and they can influence and/or reflect how accepting or stigmatizing a social environment is for TGGD people. Previous research demonstrates that living in environments with more protective policies, and fewer stigmatizing ones, is associated with improved mental and physical health outcomes and increased access to health care for TGGD people. 8 , 9 , 10 For example, Du Bois and colleagues used data from the Behavioral Risk Factor Surveillance System (BRFSS) across 26 US states and found that living in states with more protective TGGD‐specific policies was associated with TGGD people having better mental health, reduced alcohol use, and a shorter time since the last routine health care checkup. 8
To our knowledge, the research exploring relationships between TGGD‐related policies and health care use has not examined the role that state‐level TGGD‐specific policies play in access to medical gender affirmation services. Accessing medical gender affirmation services is a unique health care experience, and more research is needed to understand its relationships to specific policies and the policy climate.
Race and ethnicity may play a role in access to medical gender affirmation services, as they do in access to general health services. Using an intersectionality approach, 11 we can consider how stigma related to multiple marginalized identities influences access to care. TGGD people of color not only experience more stigma due to experiences of both racism and transgender‐related stigma, but their experiences of transgender‐related stigma may be different than those of their non‐Hispanic white counterparts, with a greater prevalence and severity of stigma and increased consequences to stigma. 5 , 12 , 13 , 14 , 15 TGGD people of color report experiencing higher rates of transgender‐related victimization and discrimination. 5 Because of stigma, TGGD people of color also experience more systemic vulnerability (eg, homelessness, unemployment, incarceration), resulting in increased exposure to health risks. 5 Racism and transgender‐related stigma embedded within health care systems can also create challenges for accessing care, 16 , 17 with people of color being more likely to receive worse treatment and have more mistrust in health care providers and medical systems. 18 , 19 These forms of stigma may create additional barriers for accessing medical gender affirmation services. To explore these issues, we assessed how the relationship between state‐level TGGD‐specific policies and access to medical gender affirmation services varies by race/ethnicity.
Methods
Data are from the U.S. Trans Survey (USTS), a national survey of TGGD people, implemented by the National Center for Transgender Equality (NCTE). 20 Additional details about recruitment, data collection procedures, the survey instrument, and data cleaning are included in the USTS study report. 5
Study Sample and Recruitment
With the help of approximately 400 lesbian, gay, bisexual, transgender, and queer (LGBTQ) organizations, the NCTE used multiple strategies (eg, email, social media, promotional campaigns) to recruit 27,715 participants for the USTS. Eligibility criteria included identifying along a spectrum of TGGD identities, being at least age 18, and living in a US state or territory. For this analysis, we excluded responses from individuals who identify as crossdressers (n = 758) and those living in US territories outside of the 50 US states and the District of Columbia (n = 63).
Procedures
USTS data were collected from August to September 2015. The survey was conducted online in English and Spanish, and approximately 200 participants completed it at in‐person survey events at LGBTQ organizations. The survey covered a broad range of topics (eg, health, employment, housing). All data were collected anonymously, and participants entered a cash‐prize drawing as an incentive. The NCTE attained approval from the University of California–Los Angeles North General Institutional Review Board. Permission to use the data set for this analysis was acquired from the NCTE.
Measures
Measures included medical gender affirmation outcomes, state‐level TGGD‐specific policies, and individual‐level and state‐level covariates.
Medical Gender Affirmation Services
Two medical gender affirmation outcomes were included: therapy/counseling and hormone treatment. Although therapy/counseling could be used for reasons beyond medical gender affirmation, the USTS specifically asked about the use of therapy/counseling for “gender identity or gender transition.” For each outcome, the analysis only included individuals who reported ever wanting that type of health care (ie, therapy/counseling or hormone treatment), and the variables were measured based on whether these services were ever accessed. Although the USTS included data on medical gender affirmation surgeries, this analysis only examined the use of therapy/counseling and hormone treatment as outcomes because there were too few participants of color in each state who had accessed these surgeries for us to explore associations between race/ethnicity and surgical health care use outcomes across US states.
Policies
State‐level policy data were from the Movement Advancement Project, an independent nonprofit think tank whose mission is to “provide rigorous research, insight and communications that help speed equality and opportunity for all.” The organization's research includes reports and maps addressing state‐level policies specific to the experiences of LGBTQ people. 21 Six types of policies that may influence access to medical gender affirmation services were analyzed: inclusion of gender identity/expression in nondiscrimination policies, religious exemption laws (ie, laws that enable people, churches, businesses, and other organizations and institutions to refuse to provide services to TGGD people based on their religious beliefs; for example, this can include refusal to offer adoption services, reproductive healthcare services, government services such as marriage, services from public businesses, etc.), private health insurance policies, Medicaid policies, regulations for changing a gender marker on state‐issued identification, and regulations for legally changing one's name. These policies vary across states (Figures 1, 2, 3) and may influence access to medical gender affirmation services.
Figure 1.
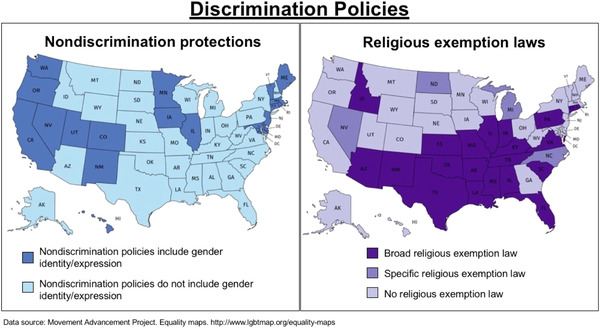
Distribution of Transgender‐Specific Discrimination Policies [Color figure can be viewed at wileyonlinelibrary.com]
Figure 2.
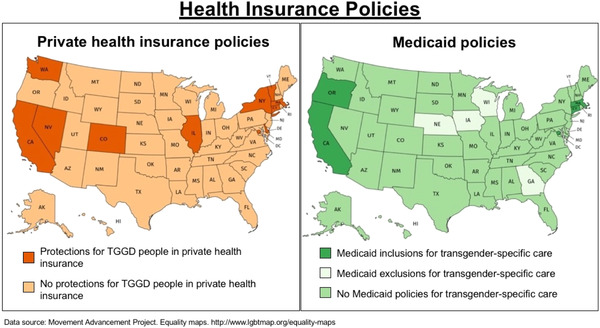
Distribution of Transgender‐Specific Health Insurance Policies [Color figure can be viewed at wileyonlinelibrary.com]
Abbreviation: TGGD, transgender and other gender‐diverse.
Figure 3.
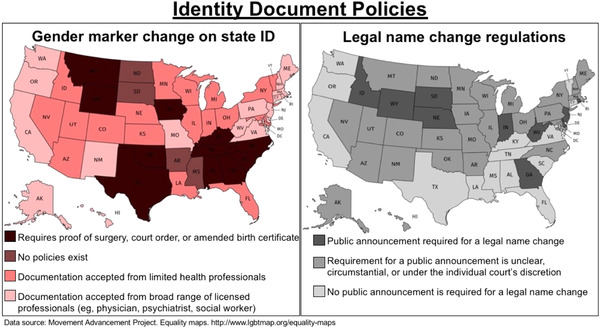
Distribution of Transgender‐Specific Identity Document Change Policies [Color figure can be viewed at wileyonlinelibrary.com]
State‐level policies were determined based on the policies that existed at the start of the USTS data collection (August 2015). However, data were not publicly available for identity document policies in 2015, so we used Movement Advance Project data from February 2017 for legal name changes and from July 2018 for changing a gender marker.
We examined the six types of policies separately and in a cumulative index that captures the policy climate of each state. Analyzing the policies separately helped us understand how each policy is associated with therapy/counseling and hormone treatment, and using a policy index elucidated how the broader sociopolitical context was associated with medical gender affirmation service use. To create the index, we ranked each state in the six policy areas. For each policy, a state received a score of –1 if the policy was harmful, a +1 if the policy was protective, and a 0 if the policy did not exist. The index is a sum of the points across the six policy types. The final composite index ranged from –3 to 5 and the distribution of the index across states is presented in Figure 4.
Figure 4.
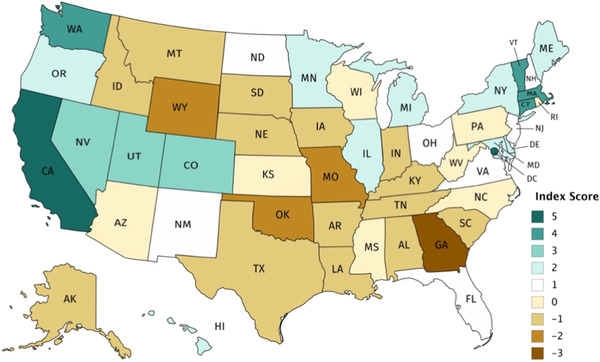
Composite Policy Index [Color figure can be viewed at wileyonlinelibrary.com]
To create the composite policy index, each state received a +1 for each protective policy that it had, a −1 for each restrictive policy, and a 0 if no policy existed.
Individual‐Level Covariates
Individual‐level covariates in our study included demographics, experiences of stigma, outness, social support, systemic vulnerability, health status, and health insurance coverage. We selected these covariates because previous research demonstrated that these factors influence health care access. 19 , 22
Demographic variables included age, gender identity, sexual orientation, race/ethnicity, US citizenship status, highest education level, and employment status. The gender identity variable comprised four categories: transfeminine (ie, individuals assigned male at birth who identify as a woman, a trans woman, etc.), transmasculine (ie, individuals assigned female at birth who identify as a man, a trans man, etc.), and other gender diverse, with the latter category including separate categories for those assigned male at birth and those assigned female at birth. Sexual orientation was classified as heterosexual/straight, LGB+ (ie, lesbian, gay, bisexual, and other sexual identities such as queer, same‐gender loving, and pansexual), asexual, or other. Race/ethnicity included non‐Hispanic white; American Indian or Alaska Native; Asian, Native Hawaiian, or Pacific Islander; Black; Latinx/Hispanic; multiracial; or other race. Education included four categories: high school graduate, some college, undergraduate degree, and graduate/professional degree. Current employment status was categorized as being employed, unemployed, or out of the labor force.
Transgender‐related stigma and racism variables included single items to assess experiences of discrimination, verbal victimization, and physical violence occurring in the past year. These experiences were classified as transgender‐related stigma if participants attributed these experiences to their transgender status/gender identity and/or gender expression/appearance. Experiences were classified as racism if participants attributed them to their race.
Gender expression was measured based on whether participants were living full time in a gender different from their sex assigned at birth. Outness was measured using a 0‐8 scale, where each point on the scale indicated a social group to whom the respondent had disclosed their gender identity, including family (immediate and extended), friends (LGBTQ and non‐LGBTQ), colleagues (a boss/manager/supervisor and coworkers), classmates, and health care providers. A binary social support variable captured whether immediate family, coworkers, and/or classmates provide social support.
Systemic vulnerability was examined through four separate binary variables measuring lifetime experiences of homelessness and sex work, current experiences of poverty, and incarceration in the past year. Health status included measures of health outcomes found to be disproportionately experienced by TGGD populations, 5 , 23 , 24 including experiences of psychological distress in the past 30 days (measured through the Kessler Psychological Distress Scale), 25 lifetime experiences of suicidal ideation, HIV status, having had at least one incident of binge drinking in the past 30 days, and any illicit drug use or prescription drugs use not as prescribed in the past 30 days. Health insurance was measured based on whether the participant had any type of health coverage.
State‐Level Control Variables. State‐level control variables included each state's racial makeup, population density, and urban makeup. These contextual factors may influence access to medical gender affirmation services. Data on racial makeup were from the U.S. Census Bureau's 2017 American Community Survey 26 and included the percentage of the population that is non‐Hispanic white. Population‐density data were from the 2010 decennial US Census and were measured as the number of people per square mile. The proportion of each state that was urban was determined using the 2013 U.S. Department of Agriculture Rural‐Urban Continuum Codes. 27 Urbanicity was measured as the proportion of counties in a state that were ranked as mostly urban.
Analysis
We used STATA 14 to analyze data and ran multilevel logistic regressions to understand the relationships between state‐level TGGD‐specific policies and medical gender affirmation service use. Missing data on the outcome variable were missing at random, and none of the covariates were missing more than 10% of responses; therefore, all missing data were dropped from the data set, resulting in sample sizes of 18,195 participants who reported wanting therapy/counseling and 18,421 participants who reported wanting hormone treatment. Multicollinearity was assessed, and the model was respecified to ensure that none of the independent variables were too closely associated with each other. Descriptive statistics were computed, and bivariate analyses examined the independent relationships between each independent variable and each outcome using chi‐square tests and t tests. An alpha level of 0.05 was used to determine significance for all analyses.
For each outcome (therapy/counseling and hormone treatment), two separate models were fit: one model included the composite policy score, and the other included all policies as separate independent variables. To account for the clustering of data by state, U.S. state was included as a random intercept; this included all 50 states and the District of Columbia. Race/ethnicity was included as the random slope. Because the sample size of TGGD people of color was small relative to the overall sample and there were too few TGGD people of color in each state to explore race/ethnicity in a more nuanced way, for the random slope, race/ethnicity was measured as a binary variable based on whether an individual was non‐Hispanic white or a person of color. The random slope determines whether the relationship between race/ethnicity and medical gender affirmation service use varies across states.
Results
Descriptive Statistics and Bivariate Analyses
Descriptive statistics and results of bivariate analyses are presented in Tables 1 and 2. The majority of participants in our samples reported using therapy/counseling (67.33%, n = 12,250) and/or hormone treatment (61.38%, n = 11,307). The mean age of participants in both samples was approximately 31years (range 18 to 81 years). Approximately 40% of participants in our samples were transfeminine, and most participants were LGB+, non‐Hispanic white, and US citizens. About two‐thirds of participants were employed, and just over 85% had at least some college education. Generally, participants disproportionately lived in states with protective policies (eg, California and New York).
Table 1.
Sample Distributions of Participants Wanting Medical Gender Affirmation Services
| Variables | Wanted Therapy/Counseling (N = 18,195) | Wanted Hormone Treatment (N = 18,421) |
|---|---|---|
| State‐level policies | ||
| Nondiscrimination protections, % (n) | ||
| State policy includes gender identity/expression | 47.81 (8,699) | 47.71 (8,788) |
| State policy does not include gender identity/expression | 52.19 (9,496) | 52.29 (9,633) |
| Religious exemption laws, % (n) | ||
| Broad law exists in state | 35.61 (6,480) | 36.04 (6,639) |
| Only specific law exists in state | 6.97 (1,269) | 7.06 (1,300) |
| No law exists in state | 57.41 (10,446) | 56.90 (10,482) |
| Private health insurance, % (n) | ||
| State policy has TGGD‐specific protections | 39.13 (7,119) | 39.14 (7,210) |
| State policy does not have TGGD‐specific protections | 60.87 (11,076) | 60.86 (11,211) |
| Medicaid policies, % (n) | ||
| State has TGGD‐specific Medicaid policies | 71.31 (12,975) | 71.43 (13,158) |
| State excludes TGGD‐specific care | 5.57 (1,014) | 5.53 (1,018) |
| State includes TGGD‐specific care | 23.12 (4,206) | 23.04 (4,245) |
| Gender marker change requirements on state ID, % (n) | ||
| No policies exist in state | 1.45 (264) | 1.49 (274) |
| State requires proof of surgery, court order, or amended birth certificate | 19.07 (3,469) | 19.18 (3,534) |
| State accepts documentation from a limited list of providers | 37.93 (6,902) | 37.71 (6,946) |
| State accepts documentation from a broad range of providers | 41.55 (7,560) | 41.62 (7,667) |
| Legal name change requirements, % (n) | ||
| State has unclear rules or requirements are decided by an individual court | 48.97 (8,911) | 49.09 (9,043) |
| State requires a public announcement | 8.44 (1,536) | 8.21 (1,512) |
| State does not require a public announcement | 42.58 (7,748) | 42.70 (7,866) |
| Composite score, mean (SD) | 1.61 (2.15) | 1.61 (2.15) |
| State‐level characteristics | ||
| State proportion of non‐Hispanic white people, mean (SD) | 77.81 (8.59) | 77.83 (8.63) |
| State population density, mean (SD) | 318.36 (872.72) | 315.44 (864.55) |
| State proportion living in an urban area, mean (SD) | 0.56 (0.22) | 0.56 (0.22) |
| Individual‐level sociodemographic characteristics | ||
| Age (y), mean (SD) | 31.03 (12.84) | 31.45 (12.97) |
| Gender identity, % (n) | ||
| Transfeminine | 37.47 (6,817) | 41.25 (7,599) |
| Transmasculine | 30.70 (5,586) | 36.11 (6,651) |
| Other gender diverse (AFAB) | 25.45 (4,631) | 17.46 (3,217) |
| Other gender diverse (AMAB) | 6.38 (1,161) | 5.18 (954) |
| Sexual identity, % (n) | ||
| Heterosexual/straight | 11.01 (2,004) | 12.75 (2,349) |
| LGB+ | 73.17 (13,313) | 71.85 (13,236) |
| Asexual | 9.40 (1,711) | 9.11 (1,679) |
| Other | 6.41 (1,167) | 6.28 (1,157) |
| Race/ethnicity, % (n) | ||
| Non‐Hispanic White | 81.62 (14,851) | 81.48 (15,010) |
| American Indian/Alaska Native | 1.13 (205) | 1.19 (220) |
| Asian, Native Hawaiian, Pacific Islander | 2.59 (472) | 2.68 (493) |
| Black | 2.53 (461) | 2.71 (500) |
| Latinx/Hispanic | 5.03 (916) | 4.90 (902) |
| Multiracial | 4.48 (816) | 4.46 (822) |
| Other | 2.61 (474) | 2.57 (474) |
| Has U.S. citizenship, % (n) | 98.40 (17,903) | 98.41 (18,128) |
| Highest education level, % (n) | ||
| Less than high school | 2.73 (496) | 2.92 (537) |
| High school graduate (including GED) | 11.12 (2,023) | 11.76 (2,166) |
| Some college (no degree) | 37.71 (6,862) | 37.50 (6,908) |
| Undergraduate degree | 34.93 (6,355) | 34.53 (6,361) |
| Graduate or professional degree | 13.51 (2,459) | 13.29 (2,449) |
| Employment status, % (n) | ||
| Employed | 67.45 (12,272) | 67.42 (12,420) |
| Unemployed | 12.72 (2,314) | 12.69 (2,338) |
| Out of the labor force | 19.84 (3,609) | 19.88 (3,663) |
| Experiences of transgender‐related stigma in past year | ||
| Experienced discrimination, % (n) | 14.75 (2,683) | 15.26 (2,811) |
| Experienced verbal harassment, % (n) | 49.13 (8,940) | 47.81 (8,807) |
| Experienced physical violence, % (n) | 9.19 (1,672) | 9.00 (1,658) |
| Experiences of racism in past year | ||
| Experienced discrimination, % (n) | 1.79 (326) | 1.70 (313) |
| Experienced verbal harassment, % (n) | 4.83 (878) | 4.40 (810) |
| Experienced physical violence, % (n) | 0.89 (162) | 0.76 (140) |
| Gender expression, outness, and social support | ||
| Living full time in gender different from sex assigned at birth, % (n) | 62.80 (11,426) | 68.20 (12,564) |
| Outness scale, mean (SD) | 3.61 (2.34) | 3.90 (2.27) |
| Has social support, % (n) | 63.49 (11,552) | 66.67 (12,281) |
| Systemic vulnerability | ||
| Living at/near poverty, % (n) | 32.67 (5,945) | 32.34 (5,958) |
| Ever experienced homelessness, % (n) | 29.83 (5,427) | 30.88 (5,689) |
| Incarcerated in the past year, % (n) | 1.27 (231) | 1.38 (254) |
| Ever engaged in sex work/industry, % (n) | 10.16 (1,849) | 10.94 (2,016) |
| Health status and health insurance | ||
| Experienced psychological distress in the past month, % (n) | 40.44 (7,358) | 38.29 (7,054) |
| Ever experienced suicidal ideation, % (n) | 84.46 (15,368) | 83.81 (15,439) |
| HIV status, % (n) | ||
| Not living with HIV | 52.67 (9,583) | 53.50 (9,855) |
| Living with HIV | 0.55 (100) | 0.69 (128) |
| Never tested/does not know | 46.78 (8,512) | 45.81 (8,438) |
| Experienced binge drinking in the past 30 days, % (n) | 25.71 (4,678) | 25.39 (4,678) |
| Used drugs in the past 30 days, % (n) | 28.63 (5,209) | 28.66 (5,280) |
| Has health insurance coverage, % (n) | 87.99 (16,009) | 87.56 (16,130) |
Abbreviations: AFAB, assigned female at birth; AMAB, assigned male at birth; GED, general educational development certificate; HRT, hormone replacement treatment; LGB+, lesbian, gay, bisexual, etc.; SD, standard deviation; TGGD, transgender and other gender‐diverse.
Table 2.
Sample Distributions and Bivariate Analyses Examining the Use of Therapy/Counseling (n = 18,195) and Hormone Treatment (n = 18,421)
| Variables | Received Counseling/Therapy | Received Hormone Treatment |
|---|---|---|
| State‐level policies | ||
| Nondiscrimination protections, % (n) | ||
| State policy includes gender identity/expression | 69.80 (6,072)c | 66.02 (5,802)c |
| State policy does not include gender identity/expression | 65.06 (6,178)c | 57.15 (5,505)c |
| Religious exemption laws, % (n) | ||
| Broad law exists in state | 64.03 (4,149)c | 56.54 (3,754)c |
| Only specific law exists in state | 64.38 (817)c | 55.62 (723)c |
| No law exists in state | 69.73 (7,284)c | 65.16 (6,830)c |
| Private health insurance, % (n) | ||
| State policy has TGGD‐specific protections | 70.70 (5,033)c | 67.02 (4,832)c |
| State policy does not have TGGD‐specific protections | 65.16 (7,217)c | 57.76 (6,475)c |
| Medicaid policies, % (n) | ||
| State has TGGD‐specific Medicaid policies | 66.09 (8,575)c | 59.37 (7,812)c |
| State excludes TGGD‐specific care | 63.91 (648)c | 58.84 (599)c |
| State includes TGGD‐specific care | 71.97 (3,027)c | 68.22 (2,896)c |
| Gender marker change requirements on state ID, % (n) | ||
| No policies exist in state | 63.26 (167)c | 50.73 (139)c |
| State requires proof of surgery, court order, or amended birth certificate | 62.78 (2,178)c | 55.43 (1,959)c |
| State accepts documentation from a limited list of providers | 66.85 (4,614)c | 60.03 (4,170)c |
| State accepts documentation from a broad range of providers | 69.99 (5,291)c | 65.72 (5,039)c |
| Legal name change requirements, % (n) | ||
| State has unclear rules or requirements are decided by an individual court | 67.82 (6,043)b | 61.38 (5,551)c |
| State requires a public announcement | 63.22 (971)b | 56.15 (849)c |
| State does not require a public announcement | 67.58 (5,236)b | 62.38 (4,907)c |
| Composite score, mean (SD) | 1.71 (2.14)c | 1.77 (2.16)c |
| State‐level characteristics | ||
| State proportion of non‐Hispanic white people, mean (SD) | 77.84 (8.63) | 77.63 (8.79)c |
| State population density, mean (SD) | 327.95 (909.44)a | 338.59 (972.34)c |
| State proportion living in an urban area, mean (SD) | 0.56 (0.22)c | 0.57 (0.22)c |
| Individual‐level sociodemographic characteristics | ||
| Age (y), mean (SD) | 33.77 (13.51)c | 34.81 (13.41)c |
| Gender identity, % (n) | ||
| Transfeminine | 82.37 (5,615)c | 74.92 (5,693)c |
| Transmasculine | 76.28 (4,261)c | 67.88 (4,515)c |
| Other gender diverse (AFAB) | 39.00 (1,806)c | 24.65 (793)c |
| Other gender diverse (AMAB) | 48.92 (568)c | 32.08 (306)c |
| Sexual identity, % (n) | ||
| Heterosexual/straight | 83.38 (1,671)c | 78.20 (1,837)c |
| LGB+ | 68.14 (9,072)c | 61.89 (8,192)c |
| Asexual | 48.51 (830)c | 41.81 (702)c |
| Other | 58.01 (677)c | 49.78 (576)c |
| Race/ethnicity, % (n) | ||
| Non‐Hispanic white | 68.75 (10,210)c | 61.92 (9,294)c |
| American Indian/Alaska Native | 62.44 (128)c | 58.64 (129)c |
| Asian, Native Hawaiian, Pacific Islander | 61.86 (292)c | 55.78 (275)c |
| Black | 64.64 (298)c | 65.80 (329)c |
| Latinx/Hispanic | 57.97 (531)c | 56.43 (509)c |
| Multiracial | 57.97 (473)c | 57.06 (469)c |
| Other | 67.09 (318)c | 63.71 (302)c |
| Has U.S. citizenship, % (n) | ||
| Yes | 67.44 (12,037)a | 61.45 (11,139) |
| No | 60.62 (177)a | 57.34 (168) |
| Highest education level, % (n) | ||
| Less than high school | 42.94 (213)c | 34.26 (184)c |
| High school graduate (including GED) | 51.71 (1,046)c | 42.47 (920)c |
| Some college (no degree) | 59.87 (4,108)c | 53.58 (3,701)c |
| Undergraduate degree | 75.12 (4,774)c | 70.49 (4,484)c |
| Graduate or professional degree | 85.77 (2,109)c | 82.40 (2,018)c |
| Employment status, % (n) | ||
| Employed | 71.25 (8,744)c | 65.75 (8,166)c |
| Unemployed | 52.59 (1,217)c | 44.87 (1,049)c |
| Out of the labor force | 63.42 (2,289)c | 57.11 (2,092)c |
| Experiences of transgender‐related stigma in past year | ||
| Experienced discrimination, % (n) | ||
| Yes | 73.20 (1,964)c | 71.33 (2,005)c |
| No | 66.31 (10,286)c | 59.59 (9,302)c |
| Experienced verbal harassment, % (n) | ||
| Yes | 65.18 (5,827)c | 59.33 (5,225)c |
| No | 69.40 (6,423)c | 63.26 (6,082)c |
| Experienced physical violence, % (n) | ||
| Yes | 61.96 (1,036)c | 59.11 (980)a |
| No | 67.87 (11,214)c | 61.61 (10,327)a |
| Experiences of racism in past year | ||
| Experienced discrimination, % (n) | ||
| Yes | 57.67 (188)c | 58.15 (182) |
| No | 67.50 (12,062)c | 61.44 (11,125) |
| Experienced verbal harassment, % (n) | ||
| Yes | 55.81 (490)c | 53.58 (434)c |
| No | 67.91 (11,760)c | 61.74 (10,873)c |
| Experienced physical violence, % (n) | ||
| Yes | 51.85 (84)c | 56.14 (80) |
| No | 67.47 (12,166)c | 61.41 (11,227) |
| Gender expression, outness, and social support | ||
| Living full time in gender different from sex assigned at birth, % (n) | ||
| Yes | 79.89 (9,128)c | 78.44 (9,855)c |
| No | 46.12 (3,122)c | 24.79 (1,452)c |
| Outness scale, mean (SD) | 4.35 (2.16)c | 4.85 (1.91)c |
| Has social support, % (n) | ||
| Yes | 76.80 (8,872)c | 70.61 (8,672)c |
| No | 50.85 (3,378)c | 42.92 (2,635)c |
| Systemic vulnerability | ||
| Living at/near poverty, % (n) | ||
| Yes | 57.86 (3,440)c | 51.76 (3,084)c |
| No | 71.92 (8,810)c | 65.98 (8,223)c |
| Ever experienced homelessness, % (n) | ||
| Yes | 68.33 (3,708) | 66.85 (3,803)c |
| No | 66.90 (8,542) | 58.94 (7,504)c |
| Incarcerated in the past year, % (n) | ||
| Yes | 69.26 (160) | 63.78 (162) |
| No | 67.30 (12,090) | 61.35 (11,145) |
| Ever engaged in sex work/industry, % (n) | ||
| Yes | 70.25 (1,299)b | 72.72 (1,466)c |
| No | 66.99 (10,951)b | 59.99 (9,841)c |
| Health status and health insurance | ||
| Experienced psychological distress in the past month, % (n) | ||
| Yes | 55.25 (4,065)c | 46.27 (3,264)c |
| No | 75.53 (8,185)c | 70.76 (8,043)c |
| Ever experienced suicidal ideation, % (n) | ||
| Yes | 66.53 (10,224)c | 60.70 (9,371)c |
| No | 71.67 (2,026)c | 64.92 (1,936)c |
| HIV status, % (n) | ||
| Not living with HIV | 77.85 (7,460)c | 75.97 (7,487)c |
| Living with HIV | 73.00 (73)c | 82.81 (106)c |
| Never tested/does not know | 55.42 (4,717)c | 44.02 (3,714)c |
| Experienced binge drinking in the past 30 days, % (n) | ||
| Yes | 67.89 (3,176) | 63.83 (2,986)c |
| No | 67.13 (9,074) | 60.55 (8,321)c |
| Used drugs in the past 30 days, % (n) | ||
| Yes | 68.77 (3,582)c | 66.23 (3,497)c |
| No | 66.75 (8,668)c | 59.43 (7,810)c |
| Has health insurance coverage, % (n) | ||
| Yes | 69.30 (11,094)c | 62.79 (10,128)c |
| No | 52.88 (1,156)c | 51.46 (1,179)c |
| Used medical gender affirmation services, % (n) | 67.33 (12,250) | 61.38 (11,307) |
Abbreviations: AFAB, assigned female at birth; AMAB, assigned male at birth; GED, general educational development certificate; HRT, hormone replacement treatment; LGB+, lesbian, gay, bisexual, etc.; SD, standard deviation; TGGD, transgender and other gender‐diverse.
P < 0.05
P < 0.01
P < 0.001
Multilevel Logistic Regression
Fully adjusted regression models demonstrated that the policy composite score was significantly associated with both therapy/counseling and hormone treatment use. For each additional point on the 9‐point index, the odds of receiving therapy/counseling increased by 4% (95% confidence interval [CI] = 1.003‐1.07, P = .031; data not shown) and the odds of receiving hormone treatment increased by 6% (95% CI = 1.02‐1.11, P = .003; data not shown).
When examining the policies separately, we found that individual policies were associated with both therapy/counseling and hormone treatment use (Table 3). Living in a state with a broad religious exemption law was associated with a 16% decrease in accessing therapy/counseling (95% CI = 0.74‐0.96, P = .010). Individuals living in states with TGGD exclusions in Medicaid policies were less likely to use therapy/counseling (adjusted odds ratio [aOR] and 95% CI = 0.70 (0.55‐0.90), P = .005) and those living in states with TGGD inclusions in Medicaid policies were more likely to use therapy/counseling (aOR and 95% CI = 1.26 (1.06‐1.49), P = .009). Living in a state with nondiscrimination protections for TGGD people was associated with increased use of hormone treatment (aOR and 95% CI = 1.21 (1.02‐1.43), P = .029).
Table 3.
Multilevel, Multivariable Logistic Regression Results Examining the Relationships between Individual Policies and Medical Gender Affirmation Services
| Therapy/Counseling (n = 18,195) | Hormone Treatment (n = 18,421) | |||
|---|---|---|---|---|
| aOR | 95% CI | aOR | 95% CI | |
| State‐Level Policies | ||||
| Nondiscrimination protections | ||||
| State policy includes gender identity/expression | 0.89 | 0.78‐1.02 | 1.21a | 1.02‐1.43 |
| State policy does not include gender identity/expression | Reference Group | Reference Group | ||
| Religious exemption laws | ||||
| Broad law exists in state | 0.84 a | 0.74‐0.96 | 0.93 | 0.79‐1.09 |
| Only specific law exists in state | 0.92 | 0.75‐1.12 | 1.12 | 0.87‐1.46 |
| No law exists in state | Reference Group | Reference Group | ||
| Private health insurance policies | ||||
| State policy has TGGD‐specific protections | 1.06 | 0.93‐1.21 | 1.15 | 0.96‐1.36 |
| State policy does not have TGGD‐specific protections | Reference Group | Reference Group | ||
| Medicaid policies | ||||
| State has no TGGD‐specific Medicaid policies | Reference Group | Reference Group | ||
| State excludes TGGD‐specific care | 0.70b | 0.55‐0.90 | 0.90 | 0.67‐1.20 |
| State includes TGGD‐specific care | 1.26b | 1.06‐1.49 | 0.97 | 0.77‐1.23 |
| Gender marker change requirements on state ID | ||||
| No policies exist in state | Reference Group | Reference Group | ||
| State requires proof of surgery, court order, or amended birth certificate | 1.23 | 0.85‐1.78 | 1.28 | 0.85‐1.95 |
| State accepts documentation from a limited list of providers | 1.20 | 0.82‐1.74 | 1.13 | 0.74‐1.73 |
| State accepts documentation from a broad range of providers | 1.14 | 0.78‐1.67 | 1.30 | 0.84‐2.00 |
| Legal name change requirements | ||||
| State has unclear rules or requirements are decided by an individual court | Reference Group | Reference Group | ||
| State requires a public announcement | 1.03 | 0.86‐1.23 | 0.90 | 0.72‐1.11 |
| State does not require a public announcement | 0.97 | 0.87‐1.09 | 0.90 | 0.77‐1.04 |
| State‐Level Characteristics | ||||
| State proportion of non‐Hispanic white people | 1.00 | 1.00‐1.00 | 1.00 | 0.99‐1.00 |
| State population density | 1.00 | 1.00‐1.00 | 1.00 | 1.00‐1.00 |
| State proportion living in an urban area | 0.88 | 0.67‐1.16 | 1.06 | 0.77‐1.47 |
| Individual‐Level Sociodemographic Characteristics | ||||
| Age | 1.03 c | 0.68‐0.85 | 1.03c | 1.02‐1.03 |
| Gender identity | ||||
| Transfeminine | Reference Group | Reference Group | ||
| Transmasculine | 0.76c | 0.68‐0.85 | 0.49c | 0.44‐0.55 |
| Other gender diverse (AFAB) | 0.30c | 0.27‐0.34 | 0.12c | 0.11‐0.14 |
| Other gender diverse (AMAB) | 0.39c | 0.34‐0.46 | 0.24c | 0.20‐0.29 |
| Sexual identity | ||||
| Heterosexual/straight | Reference Group | Reference Group | ||
| LGB+ | 0.83a | 0.72‐0.96 | 0.79b | 0.69‐0.91 |
| Asexual | 0.67c | 0.55‐0.80 | 0.90 | 0.74‐1.09 |
| Other | 0.72b | 0.59‐0.88 | 0.63c | 0.51‐0.77 |
| Race/ethnicity | ||||
| Non‐Hispanic white | Reference Group | Reference Group | ||
| American Indian/Alaska Native | 0.61b | 0.43‐0.87 | 0.69 | 0.47‐1.00 |
| Asian, Native Hawaiian, Pacific Islander | 0.99 | 0.77‐1.26 | 1.06 | 0.80‐1.39 |
| Black | 0.93 | 0.72‐1.20 | 1.04 | 0.78‐1.37 |
| Latinx/Hispanic | 0.76b | 0.63‐0.91 | 0.97 | 0.79‐1.19 |
| Multiracial | 0.82a | 0.68‐0.98 | 1.07 | 0.87‐1.31 |
| Other | 0.98 | 0.76‐1.26 | 1.07 | 0.81‐1.40 |
| Has U.S. citizenship | 1.39a | 1.02‐1.88 | 1.51a | 1.07‐2.12 |
| Highest education level | ||||
| Less than high school | Reference Group | Reference Group | ||
| High school graduate (including GED) | 1.16 | 0.91‐1.47 | 1.18 | 0.91‐1.54 |
| Some college (no degree) | 1.59c | 1.27‐1.98 | 1.86c | 1.45‐2.39 |
| Undergraduate degree | 2.24c | 1.78‐2.82 | 2.76c | 2.14‐3.57 |
| Graduate or professional degree | 3.10c | 2.38‐4.03 | 3.60c | 2.69‐4.81 |
| Employment status | ||||
| Employed | Reference Group | Reference Group | ||
| Unemployed | 0.89a | 0.79‐0.99 | 0.83b | 0.73‐0.95 |
| Out of the labor force | 1.10 | 1.00‐1.22 | 1.08 | 0.96‐1.21 |
| Experiences of Transgender‐Related Stigma in Past Year | ||||
| Experienced discrimination | 1.03 | 0.91‐1.17 | 1.34c | 1.17‐1.53 |
| Experienced verbal harassment | 0.85c | 0.78‐0.93 | 0.67c | 0.61‐0.74 |
| Experienced physical violence | 0.91 | 0.79‐1.05 | 0.81a | 0.69‐0.95 |
| Experiences of Racism in Past Year | ||||
| Experienced discrimination | 0.92 | 0.66‐1.27 | 0.86 | 0.59‐1.25 |
| Experienced verbal harassment | 0.98 | 0.80‐1.21 | 0.94 | 0.74‐1.19 |
| Experienced physical violence | 0.89 | 0.58‐1.36 | 1.27 | 0.75‐2.14 |
| Gender Expression, Outness, and Social Support | ||||
| Living full time in gender different from sex assigned at birth | 1.65c | 1.50‐1.81 | 5.67c | 5.08‐6.32 |
| Outness scale | 1.42c | 1.38‐1.45 | 1.48c | 1.44‐1.52 |
| Has support from family, coworkers, or classmates | 1.25c | 1.14‐1.36 | 1.14b | 1.03‐1.26 |
| Systemic Vulnerability | ||||
| Living at/near poverty | 0.87b | 0.80‐0.95 | 0.77c | 1.02‐1.26 |
| Ever experienced homelessness | 0.89a | 0.81‐0.97 | 1.13a | 1.02‐1.26 |
| Incarcerated in the past year | 0.81 | 0.58‐1.14 | 0.62b | 0.44‐0.87 |
| Ever engaged in sex work/industry | 0.94 | 0.82‐1.08 | 1.27b | 1.09‐1.48 |
| Health Status and Health Insurance | ||||
| Experienced psychological distress in the past month | 0.86c | 0.79‐0.93 | 0.71c | 0.64‐0.78 |
| Ever experienced suicidal ideation | 1.13a | 1.00‐1.27 | 1.16a | 1.02‐1.31 |
| HIV status | ||||
| Not living with HIV | Reference Group | Reference Group | ||
| Living with HIV | 0.44b | 0.26‐0.76 | 0.67 | 0.37,1.20 |
| Never tested/does not know | 0.76c | 0.69‐0.83 | 0.51c | 0.46‐0.56 |
| Experienced binge drinking in the past 30 days | 0.98 | 0.89‐1.08 | 1.04 | 0.84‐1.15 |
| Used drugs in the past 30 days | 1.04 | 0.95‐1.14 | 1.20c | 1.09‐1.33 |
| Has health insurance coverage | 1.82c | 1.62‐2.04 | 1.42c | 1.25‐1.62 |
Abbreviations: AFAB, assigned female at birth; AMAB, assigned male at birth; aOR, adjusted odds ratio; CI, confidence interval; GED, general educational development certificate; HRT, hormone replacement treatment; LGB+, lesbian, gay, bisexual, etc.; TGGD, transgender and other gender‐diverse.
P <.05.
P <.01.
P <.001.
Across all models, none of the state‐level covariates were significantly associated with either counseling/therapy or hormone treatment, but most of the individual‐level covariates were significant. For both outcomes, the random intercept was significant. This means that there was unobserved heterogeneity; even after controlling for all of the individual‐ and state‐level variables in the model, the likelihood of accessing therapy/counseling or hormone treatment still varied by state. For both outcomes, the random slope of race/ethnicity was also significant. Thus, after controlling for all other factors in the model, the relationship between race/ethnicity and the use of medical gender affirmation services varied across U.S. states.
Figures 5 and 6 include descriptive data highlighting racial/ethnic differences in the use of medical gender affirmation services across states. As shown in Figure 5, in nearly all states, TGGD people of color reported less use of therapy/counseling than non‐Hispanic white participants. However, the difference in use varied across states, with some states (eg, Kansas, New Hampshire, and Nebraska) having large racial/ethnic disparities in use of therapy/counseling and other states (eg, Ohio, Idaho, and Connecticut) having similar percentages of therapy/counseling use across groups. In six states (eg, Tennessee, Maine, and Indiana), more TGGD people of color than non‐Hispanic white participants reported use of therapy/counseling. Figure 5 excludes 10 states that had fewer than 10 participants of color who reported wanting therapy/counseling.
Figure 5.
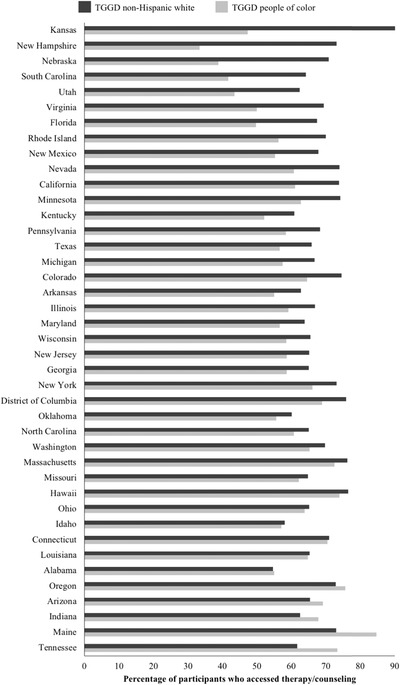
Comparisons of Use of Therapy/Counseling by Race/Ethnicity Across US States
Figure excludes all states with fewer than 10 transgender and other gender‐diverse (TGGD) participants of color who reported wanting therapy/counseling: Alaska, Delaware, Iowa, Mississippi, Montana, North Dakota, South Dakota, Vermont, West Virginia, and Wyoming.
Figure 6.
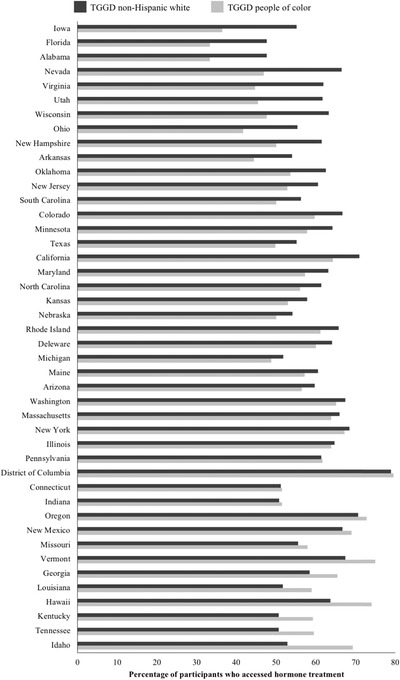
Comparisons of Use of Hormone Treatment by Race/Ethnicity Across US States
Figure excludes all states with fewer than 10 transgender and other gender‐diverse (TGGD) participants of color who reported wanting hormone treatment: Alaska, Mississippi, Montana, North Dakota, South Dakota, West Virginia, and Wyoming.
As shown in Figure 6, TGGD people of color in most states reported lower use of hormone treatment than non‐Hispanic white participants. Iowa, Florida, and Alabama demonstrated the biggest differences in race/ethnicity, with non‐Hispanic white participants having more use of hormone treatment. A few states, including Pennsylvania, the District of Columbia, and Connecticut, had similar results across racial/ethnic groups. Finally, as with therapy/counseling, some states (eg, Idaho, Tennessee, Kentucky, and Hawaii) had more TGGD people of color reporting use of hormone treatment than non‐Hispanic white participants. Data from seven states are not presented because they had fewer than 10 participants of color who reported wanting hormone treatment.
Discussion
To our knowledge, this is the first study to explore the relationship between state‐level TGGD‐specific policies and the use of medical gender affirmation services. Policies related to discrimination were associated with both outcomes: broad religious exemption laws were associated with less use of therapy/counseling, and the inclusion of gender identity/expression in nondiscrimination protections was associated with greater hormone treatment use. Discrimination‐related policies may reflect the experiences of enacted and anticipated stigma occurring within each state. Previous research found that stigma (and especially stigma within health care settings) was a barrier for accessing medical gender affirmation services. 2 , 17 These policies prohibit and/or allow for discrimination to occur across a range of settings, including within health care settings. Therefore, it is possible that individuals living in states with more protective nondiscrimination policies and those living in states without stigmatizing religious exemption laws are less likely to anticipate stigma within health care settings, and more able to access medical gender affirmation services when they want them.
Medicaid policies were only significantly associated with the use of therapy/counseling, with TGGD Medicaid inclusions being associated with increased use of therapy/counseling and TGGD Medicaid exclusions being associated with decreased use of therapy/counseling. Cost can be a huge barrier for accessing health care, especially therapy/counseling. 5 , 28 , 29 The finding that Medicaid policies were significantly associated with use of therapy/counseling, and private health insurance policies were not, may indicate that health insurance coverage for therapy/counseling visits is especially important for participants using Medicaid.
In contrast, Medicaid policies were not significantly associated with hormone treatment use. Therapy/counseling and hormone treatment are very different types of services, offered by different types of providers, and that may account for differences in findings for the two outcomes. More research examining the relationships between health insurance, Medicaid policies, and medical gender affirmation services is warranted.
The composite policy index demonstrated that having more protective and fewer stigmatizing policies was significantly associated with increased use of both therapy/counseling and hormone treatment. This finding highlights that the overall sociopolitical climate matters for medical gender affirmation service use and, since only a few individual policies were significantly associated with medical gender affirmation services, the sociopolitical climate may be more important for medical gender affirmation service use than individual policies. Future exploration of state policies and aspects of the sociopolitical context not included in this analysis (eg, adoption/parenting laws, safe school laws, bathroom bills, conversion therapy laws) may bring additional insights into the importance of specific policies relative to the overall sociopolitical context.
It is important to note that individual policies are always reciprocally related to the sociopolitical climate in which they exist. For example, lawmakers may be more likely to pass a stigmatizing policy if they live in a state with a more stigmatizing environment; that stigmatizing policy also contributes to the sociopolitical context and may make it easier to pass more stigmatizing policies in the future. Stigmatizing processes occur within iterative social contexts and across multiple socioecological levels. 30 Individuals and institutions function within cultural ideologies that are embedded in society, and yet these cultural ideologies are generated by individuals and institutions.
The significant random intercept indicates that, even after controlling for all of the covariates, experiences with medical gender affirmation services varied across states. This analysis may not have included additional state‐level factors that account for this variation. For example, this study did not include measures of the availability of medical gender affirmation services or other social factors (eg, experiences in schools, with bathrooms) that may account for transgender‐related stigma in the social environment; these unmeasured variables may play a role in the use of medical gender affirmation services and may account for differences across states.
The random slope was also significant, indicating that the relationship between race/ethnicity and use of medical gender affirmation services varied across states and is probably context specific. The descriptive statistics highlighted that, across most states, TGGD people of color reported less use of medical gender affirmation services than their non‐Hispanic white counterparts, with the severity of this inequity varying from state to state. In some states, the percentage of TGGD people of color reporting use of medical gender affirmation services exceeded the percentage of non‐Hispanic white participants using them. The reasons for these differences are not entirely clear; however, some of the differences may be due to the differences in the breakdown of the racial/ethnic minority groups across states. For example, Hawaii (which had more participants of color than white participants reporting hormone treatment use) had a large sample of Asian, Native Hawaiian, and Pacific Islander participants (31%) and 45% of participants in that state identified as non‐Hispanic white. In contrast, Florida (which had more non‐Hispanic white participants than participants of color reporting hormone treatment use) had a larger sample of non‐Hispanic white participants (75%), with Latinx/Hispanic participants comprising the largest group among racial/ethnic minority participants in this state (10%).
In addition, even though this study controlled for an individual's race/ethnicity, experiences of racism, and a state's racial makeup, other factors related to race/ethnicity (eg, the frequency and severity of transgender‐related and racist stigma) may account for differences in associations between race/ethnicity and health care use across states. Given that different US states and regions have varied social and historical contexts, especially regarding experiences of race/ethnicity and racism, 31 it makes sense that the relationship between race/ethnicity and the use of the medical gender affirmation services varied across states.
Policy Implications
Our findings highlight the importance of advocating for state‐level policies that provide protections to TGGD populations and against those that further perpetuate transgender‐related stigma. If we aim to achieve health equity for TGGD people, it is necessary to consider how policies may shape access to health care, and ultimately affect health outcomes. Pervasive transgender‐related stigma contributes to poor access to care and poor health outcomes, 17 but the passing of more protective policies may help to foster resilience and reduce experiences of stigma, ultimately improving the health of TGGD populations.
When considering state‐level TGGD‐specific policies, it is also important to consider the role of race/ethnicity. The relationship between race/ethnicity and the use of medical gender affirmation services varied across states, indicating that the state‐level social environment may play a role in the relationship between race/ethnicity and use of care. It is important to consider how the implementation of TGGD‐specific policies may shape experiences for different TGGD groups in different ways. When implementing policies, the effects on the lives of the most marginalized and stigmatized populations (ie, those who experience multiple and intersecting forms of stigma, such as TGGD people of color) should be considered. If we fail to achieve an intersectional understanding of policies, TGGD people of color may not be able to benefit from policy protections.
Research Implications
Further research is needed to better understand the nuanced relationships between federal, state, and local TGGD‐specific policies and access to medical gender affirmation services among TGGD people. Individual policies and composite policy indices can be useful for understanding both individual policies and the larger social context. While the USTS provides rich data for exploring state‐level policies and differences in experiences of TGGD people across states, longitudinal studies would allow for causal inferences and a deeper understanding of the effects of policies and policy changes over time. As more longitudinal studies (eg, BRFSS) begin collecting data on experiences of gender identity, further analyses exploring the effects of these policies over time will be possible. As these data are collected, it is important to apply an intersectionality approach 11 and further explore experiences of other types of stigma (eg, stigma related to disability status, sexual identity, socioeconomic status, body size, HIV status, and immigration status), so that the needs of TGGD populations who experience multiple marginalized identities are addressed.
Limitations
There were some limitations to this research. Data are cross‐sectional, so no causal inferences can be made. The study also used a convenience sample that was almost entirely collected online; these sampling methods and procedures are common among hard‐to‐reach populations, 32 but caution should be taken when generalizing results. The sample was disproportionately non‐Hispanic white when compared with the US population as a whole; this is especially notable because estimates suggest that TGGD populations are more racially and ethnically diverse than the general US population. 33 The relatively small sample of people of color required the use of a binary variable when exploring race/ethnicity across states because there were too few participants of color in each state to include more nuanced variables. The lack of racial/ethnic diversity also limited the health care use outcomes that could be used in this analysis. Specifically, there were too few people of color in each state who had accessed medical gender affirmation surgery for us to explore associations between race/ethnicity and surgery across states.
Although this analysis accounted for the timing of policies and the USTS data collection, policies related to identity documents were based on more recent data than the survey data. Furthermore, it is possible that policies that did not exist in 2015 were being discussed at the time, potentially affecting the sociopolitical climate. Analysis was also limited to variables available in the USTS; additional measures on quality of services or use of therapy/counseling for other reasons could further elucidate the findings. Finally, even though this study explored state‐level differences, this analysis was unable to consider migration patterns and length of state residency; migration patterns among TGGD people are not random and could influence experiences of medical gender affirmation service use. 34 , 35
Conclusion
Overall, this study suggests that state‐level TGGD‐specific policies are important for access to and use of medical gender affirmation services for TGGD people across the United States. This study also explores how race/ethnicity may relate to the use of medical gender affirmation services across US states. Within a stigmatizing US political climate, where policies specific to the experiences of TGGD people are increasing, 6 it is important to advocate for protective policies and advocate against harmful ones, in order to improve the health of TGGD people. Improving TGGD‐specific policies may help increase access to needed health care services and, as a result, may ultimately help improve health outcomes and reduce health inequities experienced by TGGD people in the United States.
Funding/Support: This research received support from the Population Research Training grant (T32 HD007168) and the Population Research Infrastructure Program (P2C HD050924) awarded to the University of North Carolina at Chapel Hill by the Eunice Kennedy Shriver National Institute of Child Health and Human Development.
Conflict of Interest Disclosures: All authors have completed the ICMJE Form for Disclosure of Potential Conflicts of Interest. No conflicts were reported.
References
- 1. White Hughto JM, Reisner SL. A systematic review of the effects of hormone therapy on psychological functioning and quality of life in transgender individuals. Transgend Health. 2016;1(1):21‐31. 10.1089/trgh.2015.0008. [DOI] [PMC free article] [PubMed] [Google Scholar]
- 2. Gridley SJ, Crouch JM, Evans Y, et al. Youth and caregiver perspectives on barriers to gender‐affirming health care for transgender youth. J Adolesc Health. 2016;59(3):254‐261. [DOI] [PubMed] [Google Scholar]
- 3. Sanchez NF, Sanchez JP, Danoff A. Health care utilization, barriers to care, and hormone usage among male‐to‐female transgender persons in New York City. Am J Public Health. 2009;99(4):713‐719. [DOI] [PMC free article] [PubMed] [Google Scholar]
- 4. Puckett JA, Cleary P, Rossman K, Mustanski B, Newcomb ME. Barriers to gender‐affirming care for transgender and gender nonconforming individuals. Sex Res Social Policy. 2018;15(1):48‐59. [DOI] [PMC free article] [PubMed] [Google Scholar]
- 5. James SE, Herman JL, Rankin S, Keisling M, Mottet L, Anafi M. The report of the 2015 U.S. Transgender Survey. National Center for Transgender Equity. https://www.hrc.org/resources/equality-from-state-to-state. Published 2016. Accessed March 15, 2020.
- 6. Human Rights Campaign Foundation . Equality from state to state & state equality index archives. https://www.hrc.org/resources/equality-from-state-to-state. Published 2019. Accessed March 15, 2020.
- 7. Stryker S. Transgender History: The Roots of Today's Revolution. 2nd ed New York: Seal Press; 2017. [Google Scholar]
- 8. Du Bois SN, Yoder W, Guy AA, Manser K, Ramos S. Examining associations between state‐level transgender policies and transgender health. Transgend Health. 2018;3(1):220‐224. [DOI] [PMC free article] [PubMed] [Google Scholar]
- 9. Gleason HA, Livingston NA, Peters MM, Oost KM, Reely E, Cochran BN. Effects of state nondiscrimination laws on transgender and gender‐nonconforming individuals’ perceived community stigma and mental health. J Gay Lesbian Mental Health. 2016;20(4):350‐362. [Google Scholar]
- 10. Perez‐Brumer A, Hatzenbuehler ML, Oldenburg CE, Bockting W. Individual‐ and structural‐level risk factors for suicide attempts among transgender adults. Behav Med. 2015;41(3):164‐171. [DOI] [PMC free article] [PubMed] [Google Scholar]
- 11. Crenshaw K. Mapping the margins: intersectionality, identity politics, and violence against women of color. Stanford Law Rev. 1991;43(6):1241‐1299. [Google Scholar]
- 12. Logie CH, James L, Tharao W, Loutfy MR. HIV, gender, race, sexual orientation, and sex work: a qualitative study of intersectional stigma experienced by HIV‐positive women in Ontario, Canada. PLoS Med. 2011;8(11):e1001124. [DOI] [PMC free article] [PubMed] [Google Scholar]
- 13. Marcellin RL, Bauer GR, Scheim AI. Intersecting impacts of transphobia and racism on HIV risk among trans persons of colour in Ontario, Canada. Ethnic Inequal Health Social Care. 2014;6(4):97‐107. [Google Scholar]
- 14. Reisner SL, Bailey Z, Sevelius J. Racial/ethnic disparities in history of incarceration, experiences of victimization, and associated health indicators among transgender women in the US. Women Health. 2014;54(8):750‐767. [DOI] [PMC free article] [PubMed] [Google Scholar]
- 15. Human Rights Campaign Foundation , Trans People of Color Coalition. A time to act: fatal violence against transgender people in America 2017. http://assets2.hrc.org/files/assets/resources/A_Time_To_Act_2017_REV3.pdf. Published 2017. Accessed March 15, 2020.
- 16. Washington HA. Medical Apartheid: The Dark History of Medical Experimentation on Black Americans from Colonial Times to the Present. New York: Doubleday; 2006. [Google Scholar]
- 17. Hughto JMW, Reisner SL, Pachankis JE. Transgender stigma and health: a critical review of stigma determinants, mechanisms, and interventions. Soc Sci Med. 2015;147:222‐231. [DOI] [PMC free article] [PubMed] [Google Scholar]
- 18. Cuevas AG, O'Brien K, Saha S. African American experiences in healthcare: “I always feel like I'm getting skipped over.” Health Psychol. 2016;35(9):987‐995. [DOI] [PubMed] [Google Scholar]
- 19. Institute of Medicine . Unequal Treatment: Confronting Racial and Ethnic Disparities in Health Care. Washington, DC: National Academies Press; 2003. 10.17226/12875. [PubMed] [Google Scholar]
- 20. National Center for Transgender Equality . U.S. Transgender Survey. In:2015.
- 21. Movement Advancement Project . Equality maps. http://www.lgbtmap.org/equality-maps. Published 2018. Accessed March 15, 2020.
- 22. Ferrer RL. Pursuing equity: contact with primary care and specialist clinicians by demographics, insurance, and health status. Ann Family Med. 2007;5(6):492‐502. [DOI] [PMC free article] [PubMed] [Google Scholar]
- 23. Bauermeister JA, Goldenberg T, Connochie D, Jadwin‐Cakmak L, Stephenson R. Psychosocial disparities among racial/ethnic minority transgender young adults and young men who have sex with men living in Detroit. Transgend Health. 2016;1(1):279‐290. [DOI] [PMC free article] [PubMed] [Google Scholar]
- 24. Poteat T, Scheim A, Xavier J, Reisner S, Baral S. Global epidemiology of HIV infection and related syndemics affecting transgender people. J Acquir Immune Defic Syndr. 2016;72(Suppl 3):S210–S219. 10.1097/QAI.0000000000001087. [DOI] [PMC free article] [PubMed] [Google Scholar]
- 25. Kessler RC, Andrews G, Colpe LJ, et al. Short screening scales to monitor population prevalences and trends in non‐specific psychological distress. Psychol Med. 2002;32(6):959‐976. [DOI] [PubMed] [Google Scholar]
- 26. U.S. Census Bureau . 2017. American Community Survey. https://www.census.gov/acs/www/data/data-tables-and-tools/data-profiles. Accessed March 15, 2020.
- 27. U.S. Department of Agriculture . 2013 rural‐urban continuum codes. https://www.ers.usda.gov/data-products/rural-urban-continuum-codes. Last updated May 2013. Accessed March 15, 2020.
- 28. Padula WV, Baker K. Coverage for gender‐affirming care: making health insurance work for transgender Americans. LGBT Health. 2017;4(4):244‐247. [DOI] [PubMed] [Google Scholar]
- 29. Roehrig C. Mental disorders top the list of the most costly conditions in the United States: $201 billion. Health Affairs. 2016;35(6):1130‐1135. [DOI] [PubMed] [Google Scholar]
- 30. Bronfenbrenner U. The Ecology of Human Development: Experiments by Design and Nature. Cambridge, MA: Harvard University Press; 1979. [Google Scholar]
- 31. Omi M, Winant H. Racial Formation in the United States. New York, NY: Routledge; 2014. [Google Scholar]
- 32. Muhib F, Lin L, Stueve A, et al. A venue‐based method for sampling hard‐to‐reach populations. Public Health Rep. 2001;116:216‐222. [DOI] [PMC free article] [PubMed] [Google Scholar]
- 33. Flores AR, Brown TN, Herman J. Race and ethnicity of adults who identify as transgender in the United States. Williams Institute, UCLA School of Law. https://williamsinstitute.law.ucla.edu/wp-content/uploads/Race-and-Ethnicity-of-Transgender-Identified-Adults-in-the-US.pdf. Published 2016. Accessed March 15, 2020.
- 34. Doan PL, Higgins H. The demise of queer space? Resurgent gentrification and the assimilation of LGBT neighborhoods. J Plan Educ Res. 2011;31(1):6‐25. [Google Scholar]
- 35. Black D, Gates G, Sanders S, Taylor LJD. Demographics of the gay and lesbian population in the United States: evidence from available systematic data sources. Demography. 2000;37(2):139‐154. [PubMed] [Google Scholar]