Abstract
Autophagy is a homeostatic process with multiple functions in mammalian cells. Here we show that mammalian Atg8 proteins (mAtg8s) and the autophagy regulator IRGM control TFEB, a transcriptional activator of the lysosomal system. IRGM directly interacted with TFEB and promoted TFEB’s nuclear translocation. An mAtg8 partner of IRGM, GABARAP, interacted with TFEB. Deletion of all mAtg8s or GABARAPs affected global transcriptional response to starvation and down-regulated subsets of TFEB targets. IRGM and GABARAPs countered mTOR’s action as a negative regulator of TFEB. This was suppressed by constitutively active RagB, an activator of mTOR. Infection of macrophages with membrane-permeabilizing microbe Mycobacterium tuberculosis or infection of target cells by HIV elicited TFEB activation in an IRGM-dependent manner. Thus, IRGM and its interactors mAtg8s close a loop between the autophagosomal pathway and the control of lysosomal biogenesis by TFEB ensuring coordinated activation of the two systems that eventually merge during autophagy.
INTRODUCTION
Autophagy is a homeostatic process that delivers cytoplasmic cargo to lysosomes for degradation 1 and affects a broad range of physiological and pathological processes 2. Mechanistically, autophagy depends on ATG proteins, which form the core of the autophagy machinery conserved from yeast to humans 1. However, the systems controlling autophagy in mammals can be different from those in yeast 3. Several metazoan-specific autophagy factors exist in animals, including the immunity related GTPase IRGM 4. IRGM cooperates with ATG16L1, is a risk locus in Crohn’s disease (CD) 5, 6, and has been linked to mycobacterial disease 7. IRGM and its murine orthologue Irgm1 8, 9 bridge the immune system 10 and the core ATG machinery to control autophagy in mammalian cells 4, 11–14.
IRGM interacts with mammalian Atg8 proteins (mAtg8s: LC3s and GABARAPs) 14, with other ATG proteins 13, 15, and with the SNARE protein Stx17 14, which translocates to autophagosomes during autophagy 14, 16. Like Stx17 and IRGM, mAtg8s function at multiple steps of autophagy and interact with several key regulators during different stages of autophagy, albeit the precise function of mAtg8s as a family and individually is yet to be fully established 17, 18.
TFEB 19, 20 is a member of the MiT/TFE subfamily of transcription factors 21, 22 regulating inflammatory 23 and metabolic 24 outputs and show redundancy in regulating several physiological functions 21. TFEB is peripherally associated with lysosomes and is phosphorylated and regulated by mTOR 25, 26. It is kept in the cytoplasm but translocates to the nucleus and drives the expression of the lysosomal system 19–21, 25, 27 during diverse stress conditions including lysosomal exocytosis 28, endocytosis 29 mitochondrial biogenesis and metabolism 30, inflammation 23, cancer 31, infection 32, 33, and autophagy as the lysosomal and autophagy pathways merge 19. TFEB is phosphorylated by kinases such as mTORC1, which prevents TFEB’s translocation to the nucleus; when phosphorylated, TFEB is bound to 14-3-3 proteins that retain it in the cytoplasm25. Dephosphorylation of TFEB by a calcineurin phosphatase PPP3CB is important for release of TFEB from 14-3-3 25 and its subsequent nuclear translocation 27. The balance between phosphorylation and dephosphorylation of TFEB by mTORC1 and PPP3CB 27 determines its cytoplasmic vs. nuclear distribution.
We have shown that TFEB responds to endomembrane (e.g. lysosomal) damage 34 during infection with microbes such as Mtb 35 where IRGM plays a protective role. Here we show that IRGM, which bridges the immune system 10 and the core autophagosomal and autolysosomal machinery 4, 11–14, interacts directly with TFEB and its phosphatase PPP3CB thus controlling activation of TFEB. We also show that Stx17 and mAtg8s influence TFEB nuclear translocation, and that with IRGM they affect mTOR, a kinase upstream of TFEB. We furthermore uncover that mAtg8s affect expression of TFEB-controlled genes, in a positive feedback loop regulating lysosomal gene expression.
RESULTS
IRGM affects nuclear translocation of TFEB
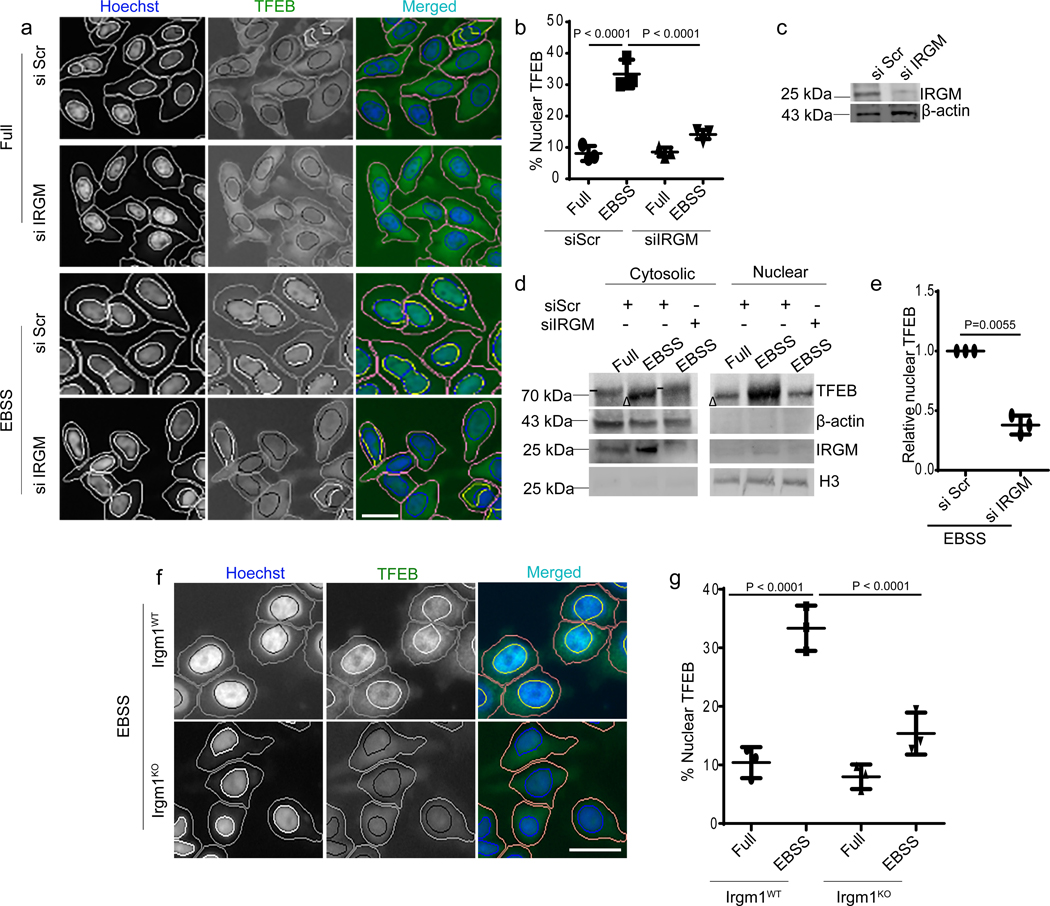
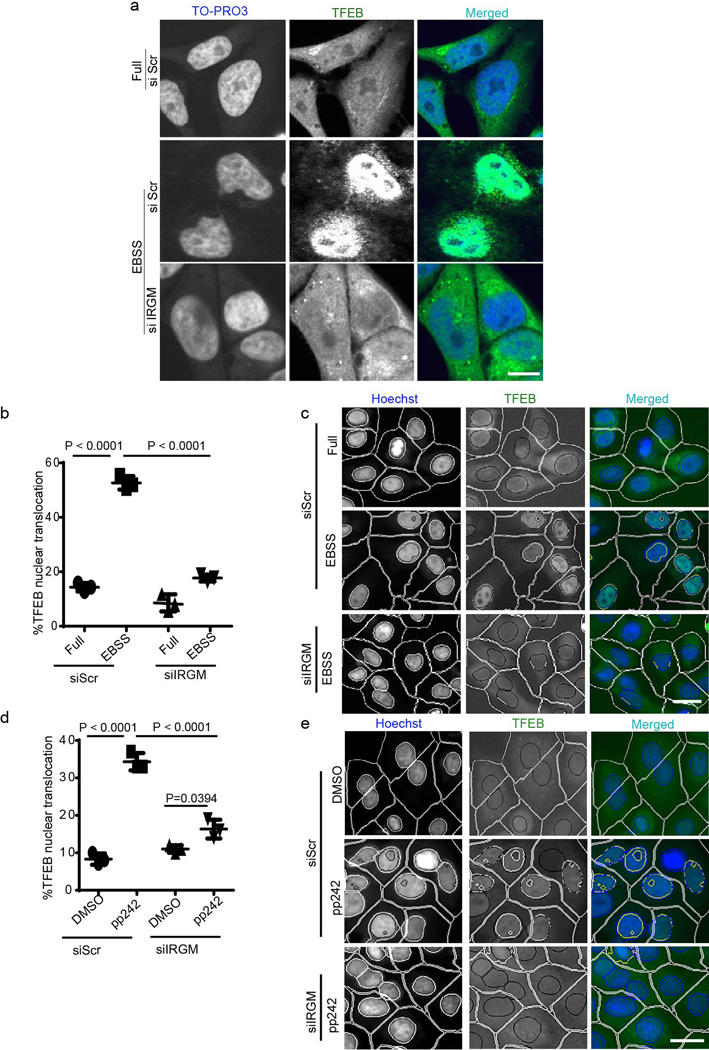
In the course of studying the role of IRGM in autophagy, we observed that it influenced TFEB’s sub-cellular distribution. A knockdown (KD) of IRGM reduced nuclear translocation of TFEB under starvation conditions (Fig. 1a–c, Extended Data Fig. 1a–c) and in response to pharmacological inhibition of mTOR by pp242 (Extended Data Fig. 1 d,e). Upon IRGM KD, subcellular fractionation showed reduced levels of TFEB in nuclear fractions (Fig. 1d,e). Primary bone marrow-derived macrophages from Irgm1KO transgenic mice36 displayed reduced nuclear translocation of TFEB in response to starvation (Fig. 1f,g). Thus, IRGM is required for efficient TFEB nuclear translocation.
Fig. 1|. IRGM controls TFEB nuclear translocation.
a, b, High content microscopy (HCM) analysis of the effect of IRGM KD on nuclear translocation of TFEB (3 biologically independent experiments; >500 primary objects examined per well). Masks; magenta: algorithm-defined cell boundaries; blue: computer-identified nucleus; yellow outline: computer-identified colocalization between TFEB and Hoechst-33342 nuclear stain). Data, means ± SEM; (n=3 biologically independent experiments) ANOVA, Tukey’s post hoc test. Scale bar 10 μm. c, Western blot analysis of IRGM KD in HeLa cells used for experiments in a and b, n=3 biologically independent experiments. d,e, Western blot analysis of effects of IRGM knockdown on nuclear translocation of TFEB tested by sub-cellular fractionation (EBSS, 1 h starvation in EBSS). Triangle, mobility-shifted TFEB (dephosphorylated) TFEB; dash, unshifted TFEB. Data, means ± SEM of normalized intensities; paired t test. n=3 biologically independent experiments. f,g, BMMs isolated from Irgm1KO or WT mice were incubated in full medium or induced for autophagy using EBSS, stained with TFEB antibody (Thermo Pierce; # PA1–31552) and analyzed by HCM for TFEB nuclear translocation. Masks; magenta: algorithm-defined cell boundaries; blue: computer-identified nucleus; yellow outline: computer-identified colocalization between TFEB and Hoechst-33342 nuclear stain). The masks in gray scale panels are cloned from the merged images. Images, a detail from a large database of machine-collected and computer-processed images. Data, means ± SEM (n=3) ANOVA, Tukey’s post hoc test; n=3 biologically independent experiments; >500 primary object examined per well; minimum number of wells, 9. Scale bar 10 μm. Uncropped blots for panels c and d are provided in Unprocessed Blots Fig. 1 and numerical source data for panels b, e and g are provided in Statistical Source Data Fig. 1.
IRGM interacts directly with TFEB
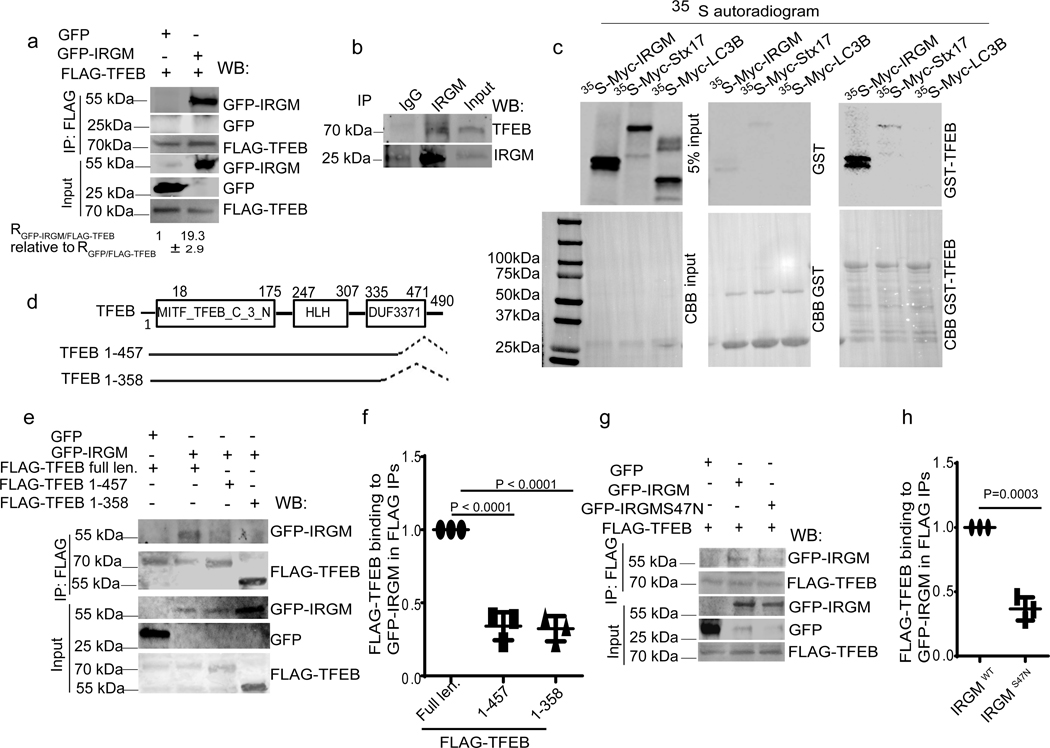
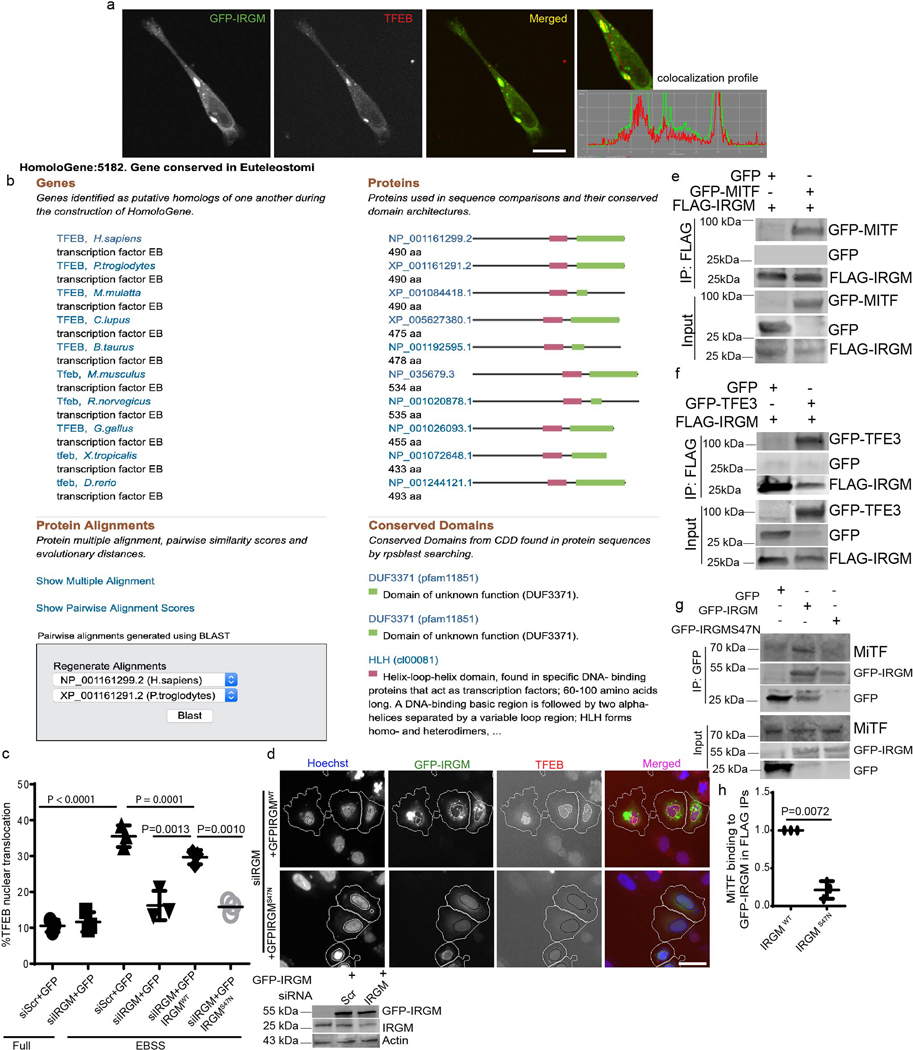
GFP-IRGM co-immunoprecipitated (co-IPed) with FLAG-TFEB (Fig. 2a). GFP-IRGM and endogenous TFEB colocalized (Extended Data Fig. 2a) and endogenous IRGM and TFEB interacted (Fig. 2b). In GST pull-downs, [35S]-Myc-IRGM showed direct interaction with GST-TFEB whereas [35S]-Myc-Stx17 and [35S]-Myc-LC3B, used as a control, did not (Fig. 2c). The C-terminal region of TFEB, which includes a hitherto functionally uncharacterized region, termed DUF3371 (domain of unknown function 3371) 37 (Extended Data Fig. 2b), was required for binding of TFEB to IRGM (Fig. 2d–f). A GTPase mutant (S47N) of IRGM 12 showed reduced TFEB binding (Fig. 2g,h). WT-IRGM did whereas IRGM S47N did not rescue the effects of IRGM KD on TFEB nuclear translocation (Extended Data Fig. 2c,d). IRGM interacted with other MiT/TFE members. GFP-MiTF and GFP-TFE3 co-IPed with FLAG-IRGM (Extended Data Fig. 2e,f). GFP-IRGM S47N bound less efficiently than GFP-IRGM WT to MiTF (Extended Data Fig. 2g,h). Thus, IRGM interacts with MiTF/TFE members and directly binds TFEB.
Fig. 2|. IRGM and TFEB interact.
a, Co-IP analysis of interactions between FLAG-TFEB and GFP-IRGM in 293T cells, (n=3 biologically independent experiments). b, Co-IP analysis of interactions between endogenous IRGM and TFEB in 293T cells, (n=3 biologically independent experiments). c, GST pull-down analysis of radiolabelled [35S] Myc-IRGM and [35S]Myc-Stx17 and [35S]Myc-LC3B with GST-TFEB, (n=3). d, Mapping of TFEB sites on IRGM. e,f, Co-IP analysis of interactions between GFP-IRGM and different TFEB mutants. Data, means ± SEM of intensities normalized to IP input; (n=3 biologically independent experiments) ANOVA, Tukey’s post hoc test. g, h, Co-IP analysis of interactions between FLAG-TEFB and GFP-IRGM wild type (IRGMwt) or GFP-IRGMS47N mutant. Data, means ± SEM of intensities normalized to IP input; paired t-test, n=3 biologically independent experiments. Uncropped blots for panels a, b, c, e and g are provided in Unprocessed Blots Fig. 2 and numerical source data for panels f and h are provided in Statistical Source Data Fig. 2.
IRGM affects TFEB phosphorylation status
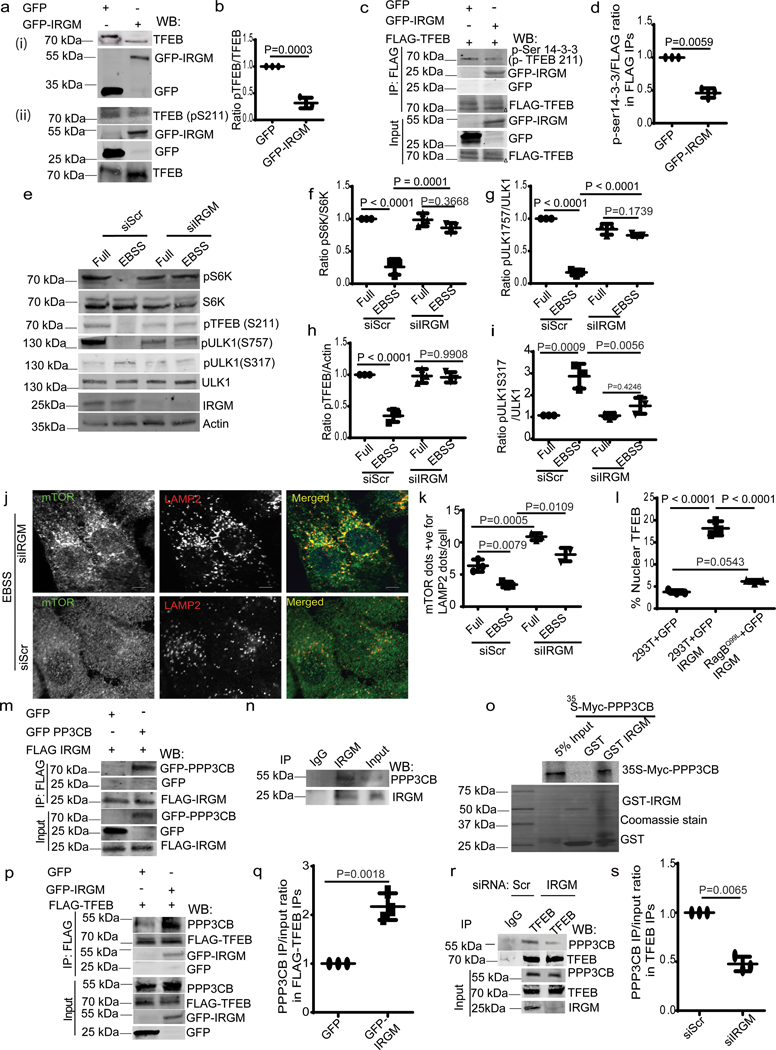
Overexpression of GFP-IRGM caused increased electrophoretic mobility of endogenous TFEB (Fig. 3a(i)), compatible with TFEB dephosphorylation 19, 25. Dephosphorylation of TFEB was detected (Fig. 3c and 3d) using phospho-(Ser) 14-3-3 binding motif antibody 25, which recognizes phospho-Ser-211 on TFEB, the site for 14-3-3 binding that keeps TFEB in the cytoplasm. Reduced TFEB phosphorylation caused by IRGM overexpression was confirmed using anti pS211-TFEB antibody (Fig. 3a(ii) and 3b). Thus, IRGM promotes dephosphorylation of TFEB.
Fig. 3|. IRGM affects mTOR activity and interacts with PPP3CB.
a (i), Mobility shift of TFEB in GFP-IRGM expressing 293T cells. a(ii),b, effects of IRGM expression on phosphorylated TFEB. Data, means ± SEM of intensities normalized, TFEB (pS211)/TFEB paired t-test (n=3 biologically independent experiments). c, d, Co-IP analysis of effects of IRGM expression on TFEB phosphorylation using Phospho-(Ser) 14-3-3 antibody in immunoprecipitated FLAG-TFEB in 293T cells. Triangle, shifted TFEB band. Data, means ± SEM IP/input; paired t-test (n=3 biologically independent experiments). e–i, western blot analysis of the effects of IRGM KD on mTOR and AMPK (pULK1 S317) targets in cells incubated in full media or in EBSS for 2h. Data, means ± SEM of intensities of phosphorylated/total levels of proteins (n=3 biologically independent experiments) ANOVA, Tukey’s post hoc test. j, confocal microscopy analysis of the effects of IRGM-KD on colocalization between mTOR and LAMP2 in HeLa cells induced for autophagy (EBSS 2h), (n=3 biologically independent experiments). k, HCM analysis of the effects of IRGM-KD on colocalization between mTOR and LAMP2 in HeLa cells. Data, means ± SEM (n=3 biologically independent experiments) ANOVA, Tukey’s post hoc test. l, HCM analysis of the effects of IRGM expression in cells stably expressing RagBQ99L, on nuclear translocation of TFEB. Data, means ± SEM (n=3 biologically independent experiments) ANOVA, Tukey’s post hoc test. Scale bar 10 μm. m,n, Co-IP analysis of GFP-PPP3CB and FLAG-IRGM and endogenous IRGM and PPP3CB in 293Tcells (n=3 biologically independent experiments). o, GST pull-down of Myc-PPP3CB with GST-IRGM, (n=3 biologically independent experiments). p, q, Co-IP analysis of effects of IRGM expression on interactions between FLAG-TFEB and endogenous PPP3CB in 293T cells. Data, normalized intensity means ± SEM; paired t test (n=3 biologically independent experiments). r, s, Co-IP analysis of the effects of IRGM-KD on interactions between FLAG-TFEB and endogenous PPP3CB in 293T cells. Data, means ± SEM; n=3 biologically independent experiments (paired t test). Uncropped blots for panels a (i), a (ii), c, e, m, n, o, p and r are provided in Unprocessed Blots Fig. 3 and numerical source data for panels b, d, f, g, h, i, k, l, q and s are provided in Statistical Source Data Fig. 3.
IRGM affects mTOR activity
TFEB is phosphorylated by mTOR, which blocks TFEB’s nuclear translocation 25, 27. The activity of mTOR is inhibited during starvation, an effect that was diminished by IRGM KD, measured by pP70S6K, pS757-ULK1 and pS211 TFEB levels (Fig. 3e–h). IRGM KD also, albeit only partially, prevented decrease in pS211 TFEB levels in cells treated with the catalytic inhibitor of mTOR, pp242 (Extended Data Fig. 3a,b). Conversely, overexpression of IRGM reduced mTOR activity (Extended Data Fig. 3c–e). IRGM KD countered desorption of mTOR from lysosomes during starvation 38 (Fig. 3j,k and Extended Data Fig. 3f) whereas the number of LAMP2 profiles remained unaffected (Extended Data Fig. 3g,h). Paradoxically, mTOR’s association with lysosomes increased upon IRGM KD under basal conditions (Fig. 3k). IRGM stabilizes and activates AMPK 13 whereas AMPK inhibits mTOR activity 39. IRGM KD reduced AMPK activity, measured by pS317-ULK1, in response to starvation (Fig. 3e,i). Thus, activation of AMPK by IRGM 13 may contribute to the basal state of mTOR. We next tested whether the known circuitry controlling mTOR activity, which includes Rag GTPases 38, transduces IRGM effects to TFEB. Constitutively active RagB (RagBQ99L) maintains mTOR in active state even under starvation conditions 38. Whereas expression of GFP-IRGM increased TFEB nuclear translocation, this effect was abrogated in cells stably expressing RagBQ99L (Fig. 3l, Extended Data Fig.3i). Thus, IRGM affects TFEB activation at least partially via mTOR.
IRGM interacts with calcineurin PPP3CB
TFEB is dephosphorylated by calcineurin phosphatase PPP3CB 27. GFP-IRGM and PPP3CB colocalized (Extended data Fig. 3j–l) and the number of double positive profiles increased during starvation (Extended data Fig. 3k–l) 27. FLAG-IRGM co-IPed with GFP-PPP3CB (Fig. 3m). PPP3CB was found in protein complexes with endogenous IRGM (Fig. 3n). A direct interaction between IRGM and PPP3CB was established in GST pull-downs (Fig. 3o). GFP-IRGM expression augmented whereas IRGM KD reduced association of TFEB with PPP3CB (Fig. 3p–s). IRGM was together with TFEB and PPP3CB on lysosomes purified by LysoIP 34, 40 (Extended Data Fig. 3n,o). IRGM overexpression promoted dephosphorylation of another PPP3CB target, NFAT27 (Extended Data Fig. 3p). Thus, not only does IRGM control TFEB via mTOR but it also acts through calcineurin.
Mammalian Atg8s control nuclear translocation of TFEB
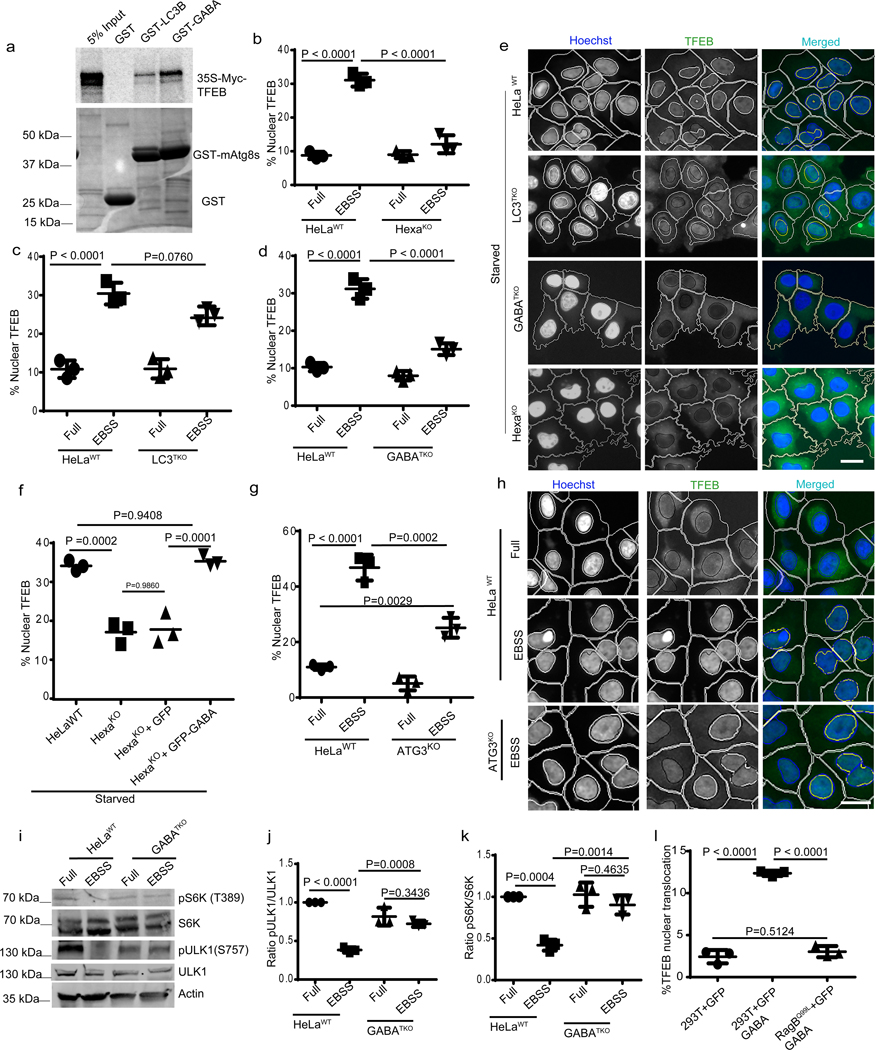
IRGM and mAtg8s form a complex 14. We wondered whether mAtg8s may contribute to control of TFEB translocation. GFP-GABARAP co-IPed efficiently with FLAG-TFEB (Extended Data Fig. 3q). TFEB bound GABARAP directly (Fig. 4a). The LIR docking site (LDS) 41 was not required for binding of TFEB to GABARAP (Extended Data Fig 3r), ruling out canonical LDS-LIR interactions.
Fig. 4|. mAtg8s affect mTOR and nuclear translocation of TFEB.
a, GST pull-down of radiolabelled [35S]Myc-TFEB with GST-LC3B or GST-GABARAP, (n=3 biologically independent experiments). b–e, HCM images and quantification to test the effects of HexaKO (b), LC3TKO (c) and GABATKO (d) on TFEB translocation in response to starvation by 2h incubation in EBSS. Data, means (n=3 biologically independent experiments) ANOVA, Tukey’s post hoc test. Masks; white: algorithm-defined cell boundaries; blue: computer-identified nucleus; yellow outline: computer-identified co-localization between TFEB and nucleus. The masks in gray scale panels are cloned from the merged images. Data, 3 independent experiments; >500 primary objects examined per well; minimum number of wells, 9. f, HCM quantification to test the effect of complementation of HexaKO cells with GFP or GFP-GABARAP on nuclear translocation of TFEB in response to starvation. Data, means ± SEM; (n=3 biologically independent experiments) ANOVA, Tukey’s post hoc test 3 independent experiments; >500 primary object examined per well; minimum number of wells, 9. g,h, HCM images and quantification to test the effect of ATG3KO on nuclear translocation of TFEB in response to starvation. Data, means ± SEM; (n=3 biologically independent experiments) ANOVA, Tukey’s post hoc test. Masks; white: algorithm-defined cell boundaries; blue: computer-identified nucleus; yellow outline: computer-identified co-localization between TFEB and nucleus. i–k, western blot analysis of the effect of GABATKO on mTOR activity (measured by phosphorylated ULK1 and S6K) in response to starvation (2h EBSS). Data, means ± SEM of intensities of phosphorylated proteins normalized to levels of total proteins; (n=3 biologically independent experiments) ANOVA, Tukey’s post hoc test. l, HCM quantifications to test the effect of GFP-GABARAP on nuclear translocation of TFEB in parental 293T cells or cells constitutively expressing RagBQ99L. Data, means ± SEM ANOVA, Tukey’s post hoc test; HCM, >500 cells counted per well; minimum number of valid wells 9, n=3 biologically independent experiments. Uncropped blots for panels a and i are provided in Unprocessed Blots Fig. 4 and numerical source data for panels b, c, d, f, g, j, k and l are provided in Statistical Source Data Fig. 4.
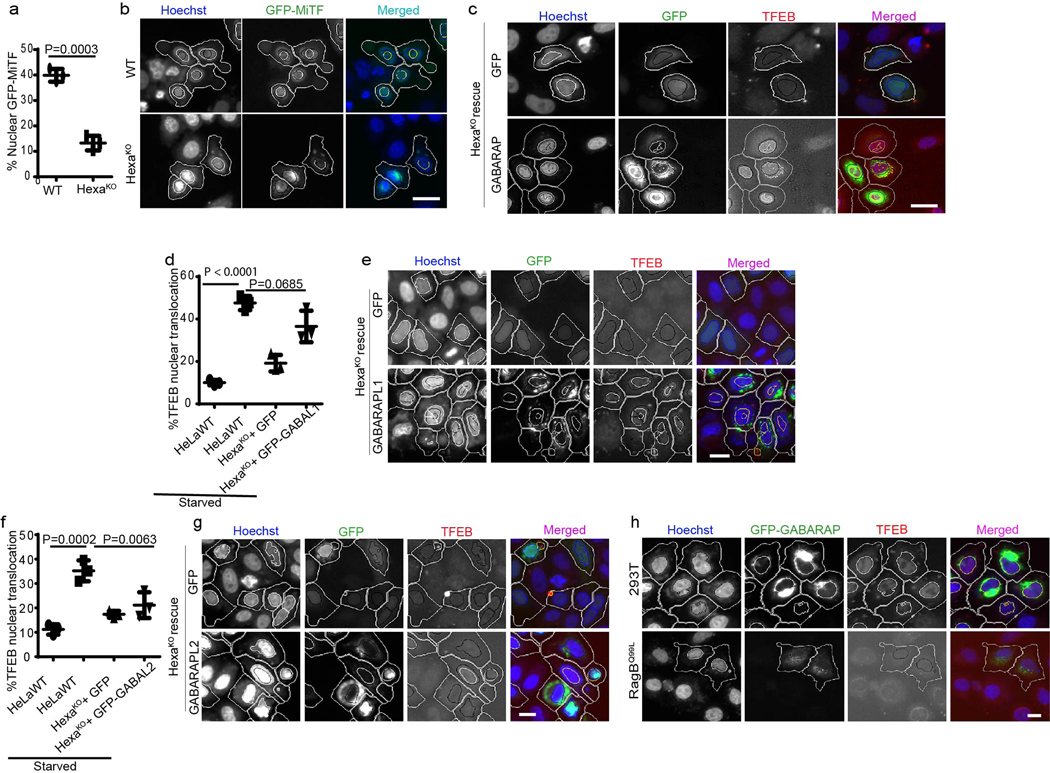
We next used the previously characterized HeLa cells with CRISPR knockouts of mAtg8s as triple LC3TKO (LC3A,B,C KO), triple GABATKO (GABARAP, GAPARAPL1, GABARAPL2 KO) and total mAtg8 HexaKO (pan-mAtg8s KO) 18. HexaKO displayed inefficient nuclear translocation of TFEB relative to the parental HeLa cells in response to starvation (Fig. 4b,e and Extended Data Fig. 3s). Nuclear translocation of GFP-MiTF in response to starvation was also reduced in HexaKO cells (Extended Data Fig. 4a,b). The LC3TKO did not affect TFEB (Fig. 4c,e and Extended Data Fig. 3s), however, knock out of all GABARAPs (GABATKO) reduced nuclear translocation of TFEB (Fig. 4d,e and Extended Data Fig. 3s). Transfection of HexaKO cells with GFP-GABARAP or GFP-GABARAPL1 but not with GFP-GABARPAL2 rescued the effects on nuclear translocation of TFEB in response to starvation (Fig. 4f and Extended Data Fig. 4c–g). Thus, GABARAP or GABARAPL1 are mAtg8s that promote TFEB translocation.
Previous studies have indicated that certain ATG proteins may affect TFEB translocation whereas others do not 42. We detected only a partial reduction in the efficacy of TFEB nuclear translocation in HeLa ATG3KO cells relative to their parental HeLa WT cells (Fig. 4g,h). We next addressed the possibility that, like with the GABARAPs partner IRGM 14, mTOR may be involved. GABARAP was found together with mTOR in lysosomal preparations (Extended Data Fig. 3 j,k). Knock-out of all three GABARAPs (GABATKO) countered starvation-induced inhibition of mTOR activity (Fig 4 i–k). Overexpression of GFP-GABARAP increased TFEB nuclear translocation in 293T cells but not in cells stably expressing RagBQ99L (Fig. 4l and Extended Data Fig. 4h). Thus, similar circuitries converging upon mTOR are involved in the effects of IRGM and GABARPs on TFEB.
Mammalian Atg8s affect expression of TFEB target genes
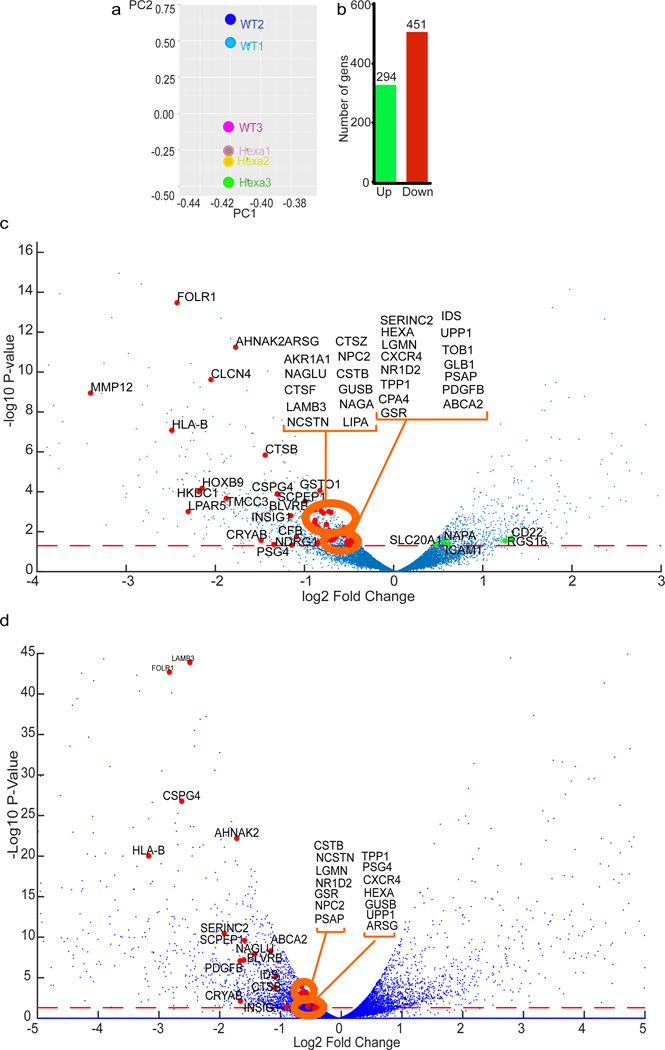
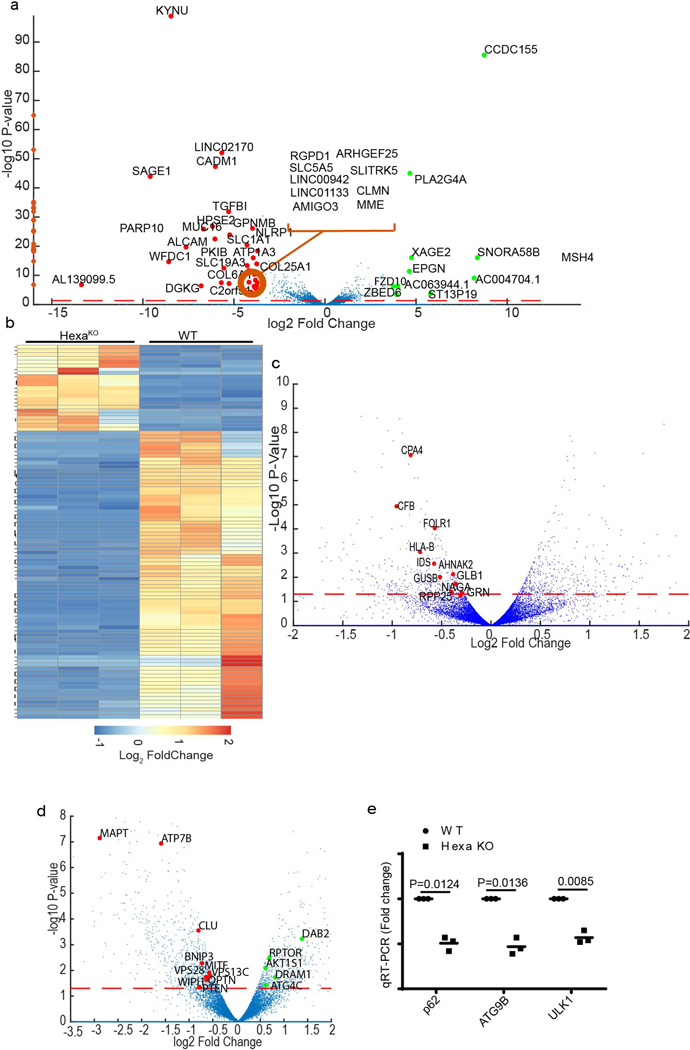
TFEB functions as a transcriptional regulator 19. We performed RNA-seq analyses in pan-mAtg8s KO HeLa cells (HexaKO) and their parental HeLa cells induced for autophagy by starvation. This global analysis detected 451 genes downregulated in HexaKO compared to parental HeLa cells (Fig. 5a,b and Extended Data Fig. 5a,b) including 46 previously identified TFEB targets 20 (Fig. 5c, Supplementary Table 1, Tab1). This group, marked on the volcano plot in Fig. 5c, consisted of lysosomal hydrolases and other identified TFEB target genes 20 such as CTSB, CTSF, CTSZ, GUSB, HEXA, and TPP1, as well as MMP12, FOLR1, AHNAK2, HLA-B, HOXB9, HKDC1, LPAR5, and SCPEP1. GABATKO cells showed a partial overlap (>50%; 29 out of 46 known TFEB-controlled genes 20) relative to HexaKO (Fig. 5d). Additional TFEB targets, such as DEXI, VPS18, SYNJ2, SFXN3, APBB3, HSPB8, and the key autophagy regulator ULK1, were reduced in GABATKO (Supplementary Table 2, Tab1). A question arose of whether these changes were due to disabled autophagy or due to other effector functions of mAtg8s. For this, we used ATG3KO HeLa cells 43, which cannot conjugate mAtg8s to lipids, a key step in autophagy as a process 1. When we compared ATG3KO cells and HexaKO, the overlap with the previously identified TFEB targets in HexaKO was limited to 11 genes (Extended Data Fig. 5c, Tabl3 S3). Thus, a substantial portion of gene expression effects seen in HexaKO and GABATKO cells exceed what could be ascribed to autophagy as a process.
Fig. 5|. mAtg8s control the transcriptional activity of TFEB.
a, Principal component analysis from RNAseq comparisons between parental HeLaWT and pan-mAtg8 mutant HeLa cells (HexaKO; CRISPR pan-mAtg8 knockout of LC3A, LC3B, LC3C, GABARAP, GABARAPL1, and GABARAP L2); RNAseq was performed in triplicates. Cells were induced for autophagy in EBSS for 2h. b, Green bar, number of upregulated genes (294, in HexaKO cells relative to HeLaWT); red bar, number of downregulated genes (451, in HexaKO cells relative to HeLaWT). c, Volcano plot showing the effect of pan-mAtg8 knockout on differential gene expression (log2 fold change; ratio HexaKO/HeLaWT). Named genes are the previously identified TFEB target genes. Colors, red: TFEB targets upregulated in HexaKO cells; green: TFEB targets upregulated in HexaKO cells. Dotted orange line, significance cuttof (p value < 0.05). P values were calculated using Fisher’s exact test adapted for over-dispersed data; edgeR models read counts with negative binomial (NB) distribution (see methods). n=3 biologically independent experiments. d, Volcano plot showing the effect of GABATKO on differential gene expression (log2 fold change; ratio GABATKO/HeLaWT). Named genes are the previously identified TFEB target genes. Colors, red: TFEB targets up regulated in GABATKO cells; green: TFEB targets up regulated in GABATKO cells. Dotted orange line, significance cutoff (p value < 0.05). P values were calculated using Fisher’s exact test adapted for over-dispersed data; edgeR models read counts with negative binomial (NB) distribution (see methods). n=3 biologically independent experiments.
HexaKO showed altered expression of several genes associated with autophagy (Extended Data Fig. 5d and Supplementary Table 1, Tab1). RT-PCR showed reduced relative expression of SQSTM1/p62, ATG9B and ULK1 in HexaKO (Extended Data Fig. 5e). RNAseq data, albeit not showing a cumulative decrease for SQSTM1, indicated downregulation of individual SQSTM1-specific transcripts in HexaKO cells (Supplementary Table 1, Tab2; transcript ID: ENST00000510187). Expression of TFEB in HexaKO did not change, indicating that mAtg8s effects on TFEB are primarily at the protein level. In conclusion, mAtg8s affect global transcriptional activity, including the lysosomal system. This involves a partial overlap with TFEB’s domain of influence and additional systems that remain to be fully explored.
Mammalian Atg8s affect differential expression of diverse genes
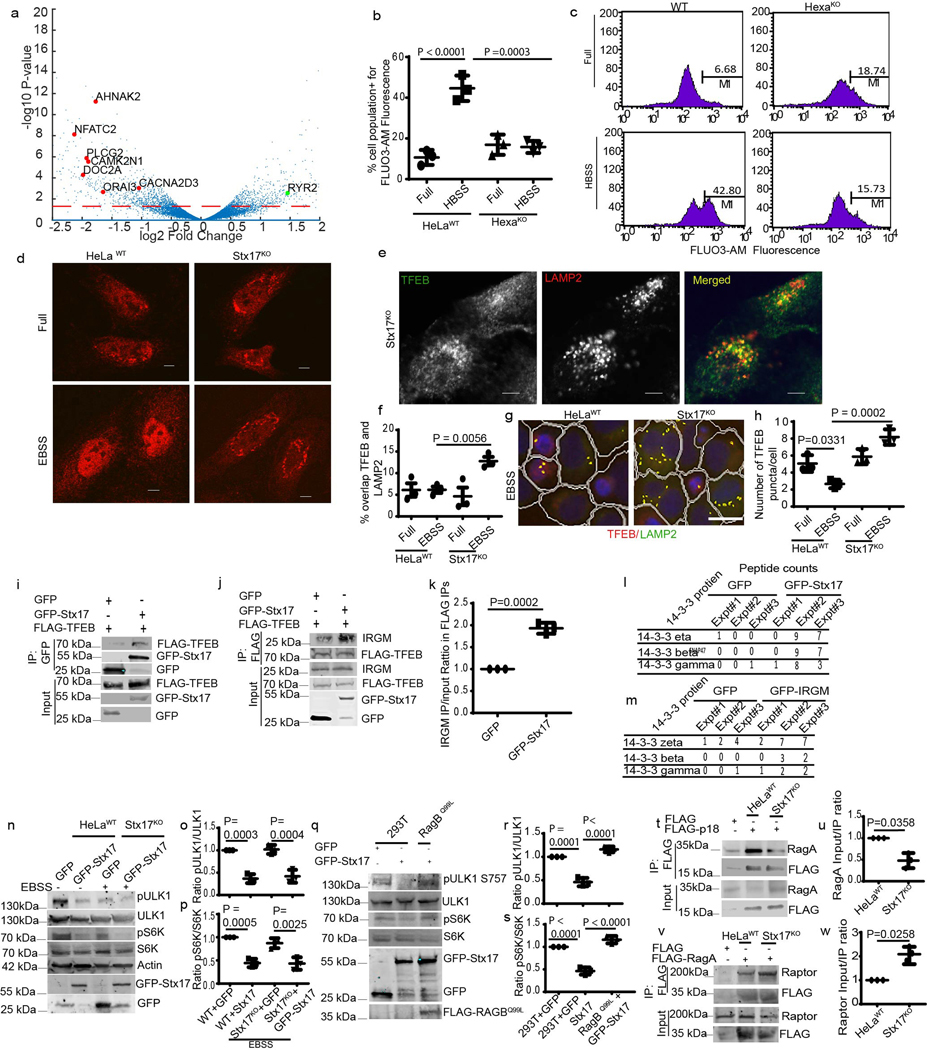
Additional global transcriptional changes in HexaKO cells, including upregulation of 294 genes, were observed by RNAseq (Fig. 5b; Supplementary Table 1, Tab1) that could not be fully explained by TFEB alone. RNAseq showed changes in expression of NFATC2 and other calcium effectors such as CAMK2N1, CANA2D3, ORAI3, and PLCG2, suggesting a Ca2+-related theme (Extended Data Fig. 6a; Supplementary Table 1, Tab1). We examined whether Ca2+ response is intact or affected in HexaKO cells, and found a diminished rise in cytosolic Ca2+ in HexaKO cells subjected to starvation in HBSS (Extended Data Fig. 6b,c). Thus, in addition to the very specific interactions with PPP3CB within the TFEB stimulation pathway and effects on TFEB-dependent transcription, mAtg8s affect cytoplasmic Ca2+ responses.
Stx17 affects nuclear translocation of TFEB
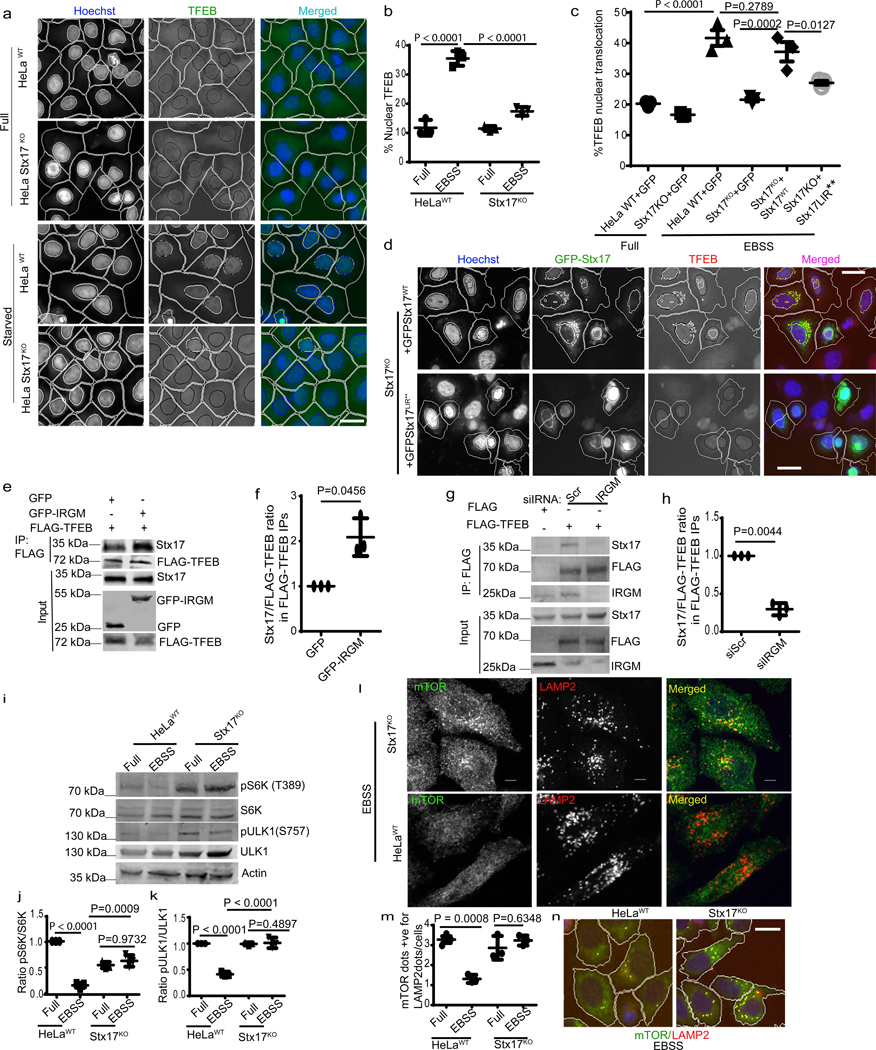
Another member of the complex between IRGM and mAtg8s is Stx17 14. Stx17 CRISPR knockout 44 displayed reduced TFEB translocation to the nucleus in response to starvation (Fig. 6a,b and Extended Data Fig. 6d). Mirroring this, a small fraction of residual TFEB, which remains localized to lysosomes even under starvation in WT cells, further increased in Stx17KO cells (Extended Data Fig. 6 e–g). Likewise, the total number of TFEB puncta in the cytoplasm, which went down in WT cells subjected to starvation, increased in Stx17KO cells (Extended Data Fig. 6h). Complementation of Stx17KO HeLa cells with GFP-Stx17 rescued nuclear translocation of TFEB (Fig. 6 c,d). A LIR mutant of Stx17 (Stx17LIR**), which does not bind mAtg8s 14, did not efficiently rescue nuclear translocation of TFEB (Fig. 6c,d).
Fig. 6|. Stx17 affects mTOR and regulates TFEB nuclear translocation.
a,b, HCM analysis of effect on EBSS (2h) on nuclear translocation of TFEB in HeLaWT or Stx17KO cells. Data, means ± SEM; (n=3 biologically independent experiments) ANOVA, Tukey’s post hoc test; >500 primary objects examined per well; minimum number of wells, 9. Masks; white: algorithm-defined cell boundaries; blue: computer-identified nucleus; yellow outline: computer-identified co-localization between TFEB and nucleus). c,d, HCM images and quantification to test the effect of complementation of Stx17KO cells with GFP-Stx17WT or GFP-Stx17LIR** on nuclear translocation of TFEB. Data, means ± SEM (n=3 biologically independent experiments) ANOVA, Tukey’s post hoc test; HCM, >500 cells counted per well; minimum number of valid wells 9. Masks; white: algorithm-defined cell boundaries and computer-identified GFP positive cells; blue outline: nuclear stain; yellow outline: co-localization between TFEB and nucleus). Scale bar 10 μm. e,f, Co-IP analysis of FLAG-TFEB and endogenous Stx17 in the presence of GFP or GFP-IRGM in 293T cells. (f) Stx17 intensities normalized to FLAG-TFEB intensities in FLAG IPs. Data, means ± SEM of normalized intensities; (n=3 biologically independent experiments) paired t-test. g,h, Co-IP analysis of the effect of IRGM KD on interactions between FLAG-TFEB and endogenous Stx17 in 293T cells. Graph in h, Stx17 intensities normalized to FLAG-TFEB intensities in FLAG IPs. Data, means ± SEM of normalized intensities; (n=3 biologically independent experiments) paired t-test. i–k, Western blot analysis of the effects of Stx17KO on mTOR activity (measured by phosphorylation of ULK1 and S6K) in response to starvation (EBSS 2h). Data, means ± SEM of intensities of phosphorylated proteins normalized to total levels of proteins; (n=3 biologically independent experiments) ANOVA, Tukey’s post hoc test. l–n, confocal microscopy analysis (l) and HCM quantifications of the effect of Stx17KO on colocalization between mTOR and LAMP2. Data, means ± SEM; ANOVA, Tukey’s post hoc test; (n=3 biologically independent experiments). Masks; white: algorithm-defined cell boundaries; yellow outline: computer-identified co-localization between mTOR and LAMP2. Scale bar 10 μm. Uncropped blots for panels e, g and i are provided in Unprocessed Blots Fig. 6 and numerical source data for panels b, c, f, h, j, k and m are provided in Statistical Source Data Fig. 6.
How might Stx17 affect TFEB? Although there was no appreciable direct interaction between Stx17 and TFEB (Fig. 2c), using LysoIP-purified lysosome we detected Stx17 on lysosomes together with other factors studied including mTOR and TFEB (Extended Data Fig. 3j,k). We thus tested whether TFEB and Stx17 coexisted in protein complexes even without direct interactions. Co-IP analyses showed that Stx17 and TFEB were in common protein complexes (Extended Data Fig. 6h). The three components, IRGM, Stx17 and TFEB displayed interdependence. When GFP-IRGM was overexpressed, this increased Stx17 levels in FLAG-TFEB IPs (Fig. 6e,f). IRGM KD reduced levels of Stx17 in FLAG-TFEB IPs (Fig. 6g,h). Finally, overexpression of GFP-Stx17 increased levels of IRGM in FLAG-TFEB IPs (Extended Data Fig. 6i,j). In proteomics studies, GFP-Stx17 was also found in protein complexes with a panel of 14-3-3 proteins (Extended Data Fig. 6k). Incidentally, mass-spectrometry analyses also indicated interactions of 14-3-3 proteins with GFP-IRGM (Extended Data Fig. 6l, Supplementary Table 4). 14-3-3 proteins interact with TFEB and hold the phosphorylated TFEB in the cytoplasm 25, 27, which may contribute to the effects of Stx17 on TFEB. Thus, Stx17 interacts with proteins that control TFEB localization and is required for efficient nuclear translocation of TFEB.
Stx17 affects mTOR inhibition during starvation
As both IRGM and mAtg8s were required for efficient inhibition of mTOR in response to starvation, we also tested the role of Stx17. Inactivation of mTOR in response to starvation was reduced in Stx17KO HeLa cells, evidenced by persistent phosphorylation of S6K and ULK1 (Fig. 6 i–k) and presence of mTOR on lysosomes (Fig. 6 l–n). GFP-Stx17 complemented these effects in Stx17KO cells (Extended Data Fig. 6 m–o). Overexpression of GFP-Stx17 in 293T cells partially inhibited mTOR activity in full medium (Extended Data Fig. 6 p–r), an effect suppressed by constitutively active RagBQ99L (Extended Data Fig. 6 p–r). Thus, like IRGM and mAtg8s, Stx17 exerts effects on mTOR.
RagA/B are physiologically activated and loaded with GTP through the action of the cognate nucleotide exchange factor (GEF), a pentameric complex termed Ragulator consisting of LAMTOR1–5 (e.g. p18/LAMTOR1, p14/LAMTOR2, etc.) 45. The Ragulator-Rag interaction increases during amino acid starvation 45 believed to reflect increased affinity of GEFs (in this case Ragulator) for inactive (GDP-bound) cognate GTPases46, such as Rags 38, 45. We used Ragulator-Rag interaction as a readout 45, 47 of the activation state of RagA in cells lacking Stx17. Stx17KO HeLa cells displayed lower RagA-p18 complexes than Stx17 WT HeLa cells. (Extended Data Fig 6 s,t), consistent with increased RagA activation state 45, 48. Increased interactions of RagA with its effector Raptor were observed in Stx17KO vs WT HeLa cells (Extended Data Fig 6 u,v). Thus, Stx17 influences state of the key Rag GTPase that activates mTOR.
IRGM affects TFEB nuclear translocation in pathological conditions
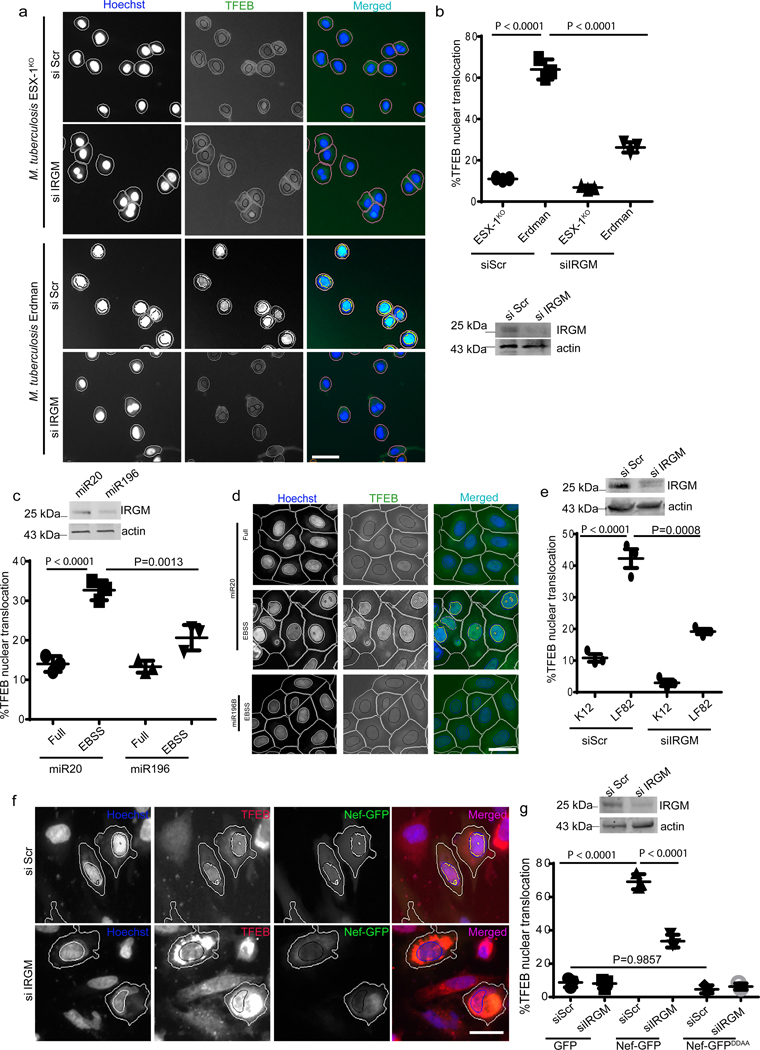
We tested the effects of IRGM on TFEB in a physiological setting of M. tuberculosis (Mtb) macrophage infection, which causes endomembrane damage that in turn affects TFEB nuclear translocation 49. TFEB was nuclear in infected macrophage-like THP1 cells, dependent on the ability of Mtb Erdman to disrupt integrity of phagosomal membranes (ESX-1 mutant of Mtb Erdman, disabled for membrane permeabilization 35, had only 10% of cells with nuclear TFEB) (Fig. 7a,b). The translocation of TFEB in response to Mtb Erdman was reduced upon IRGM knockdown (Fig. 7a,b).
Fig. 7|. IRGM affects TFEB nuclear translocation in cells infected with diverse pathogens associated with tuberculosis, AIDS or Crohn’s disease.
a,b, THP-1 cells were knocked down for IRGM, infected with M. tuberculosis (wild type Erdman or its ESX-1 mutant), cells immuno-stained for TFEB, and nuclear translocation of TFEB analyzed by high content microscopy. Data, means ± SEM; ANOVA, Tukey’s post hoc test (n=3 biologically independent experiments); high content microscopy, >500 cells counted per well; minimum number of valid wells 9, 3 independent experiments. Masks; magenta: algorithm-defined cell boundaries; blue: computer-identified nucleus; green: computer identified TFEB; yellow outline: computer-identified colocalization between TFEB and Hoechst-33342 nuclear stain). Scale bar 10 μm. c,d, HCM images and quantifications to test the effect of miR196B transfection in HeLa cells on nuclear translocation of TFEB. miR20 was used as a control, (n=3 biologically independent experiments). Data, means ± SEM (ANOVA, Tukey’s post hoc test). e, HCM quantifications of the effect of IRGM KD on LF82 influenced nuclear translocation of TFEB in THP-1 cells, K12 was used as a control. Data, means ± SEM (n=3 biologically independent experiments) ANOVA, Tukey’s post hoc test. f,g, HCM images and quantifications to test the effect of IRGM KD on NEF mediated nuclear translocation of TFEB. NEF-DDAA was used as control. Data, means ± SEM (n=3 biologically independent experiments) ANOVA, Tukey’s post hoc test; high content microscopy, >500 cells counted per well; minimum number of valid wells 12 (n=3 biologically independent experiments). Masks; white: algorithm-defined cell boundaries and computer-identified GFP positive cells; blue outline: computer-identified nuclear stain; yellow outline: computer-identified colocalization between TFEB and Hoechst-33342 nuclear stain). Scale bar 10 μm. The masks in gray scale panels are cloned from the merged images. Western blot confirming IRGM knock down in cells used for the experiment. Uncropped blots for panels c, e and g are provided in Unprocessed Blots Fig. 7 and numerical source data for panels b, c, e and g are provided in Statistical Source Data Fig. 7.
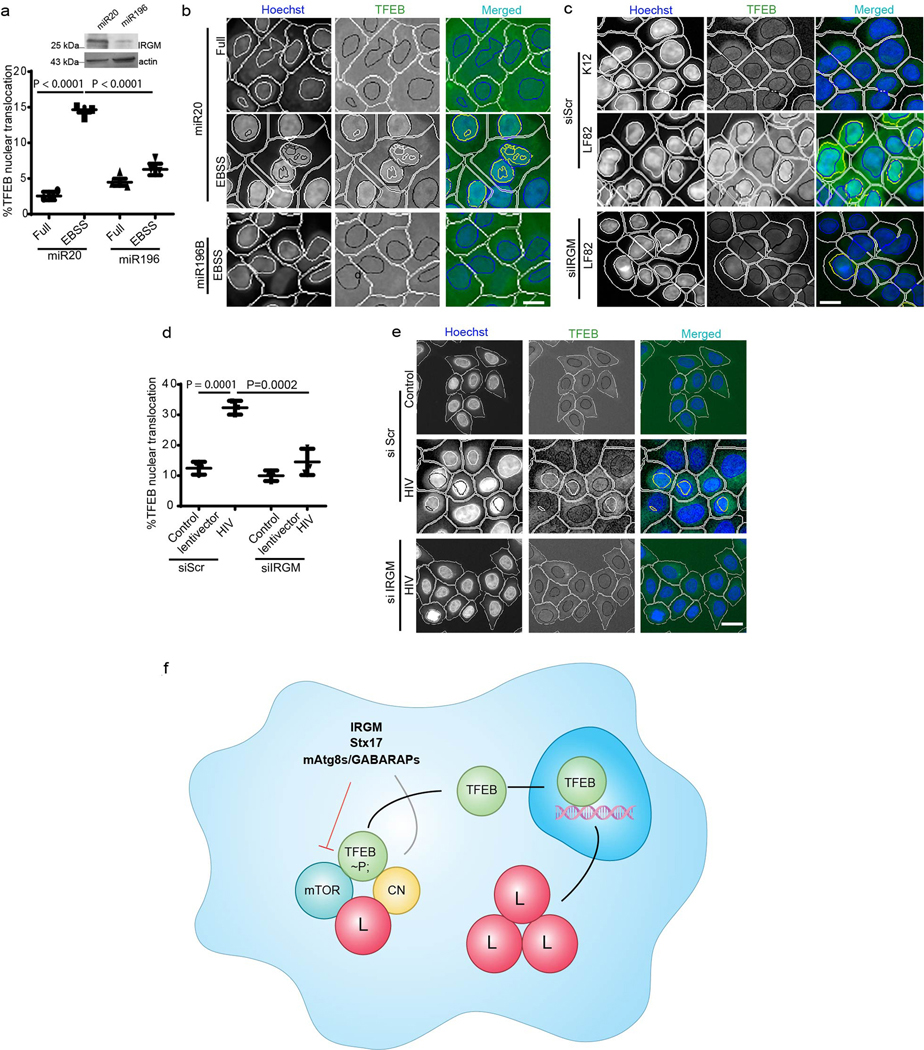
IRGM is a CD risk factor 5, 7, 50. Therefore, we tested effects of the CD polymorphisms c.313C>T 51, representing one of the mechanistically best characterized IRGM risk alleles (c313T) associated with CD. IRGM c313C (protective allele) is targeted by mIR196B resulting in downregulation of IRGM expression, relative to the risk allele c.313T, which is not targeted by miR196B 51. We transfected HeLa or 293T cells (encoding c.313C 52) with miRNA196, and found that this tapered expression of IRGM and reduced nuclear translocation of TFEB in response to starvation (Fig. 7c,d, Extended Data Fig. 7a,b). Infection of THP-1 macrophages with CD-associated adhesive-invasive E. coli AIEC LF82 53 but not with K12 E. coli, caused nuclear translocation of TFEB (Fig. 7e, Extended Data Fig. 7c). However, this response was attenuated in cells knocked down for IRGM (Fig. 7e, Extended Data Fig. 7e). Thus, it appears that protective IRGM allele tested is associated with a moderate TFEB response, restraining over-exuberant reactivity, observed here under general conditions (starvation) and conditions of infection with an intestinal pathogen.
Nef, an HIV accessory factor implicated in pathogenesis of AIDS, plays a complex role in nuclear translocation of TFEB 32. When we infected cells with a VSVG-pseudotyped HIV virus encoding Nef 54, this induced nuclear translocation of TFEB relative to lentiviral vector control, whereas a knockdown of IRGM substantially reversed nuclear translocation of TFEB (Extended Data Fig. 7d,e). Transfection of HeLa cells with Nef-GFP induced nuclear translocation of TFEB whereas a knockdown of IRGM significantly inhibited this (Fig. 7f,g). When we tested a mutant Nef, NefDD-AA (174DD175 mutated to 174AA175) that cannot bind IRGM 14, Nef had no effect on TFEB translocation (Fig. 7f,g). Thus, IRGM controls nuclear translocation of TFEB in response to various pathological stressors.
DISCUSSION
In this study we have uncovered the role of mAtg8s as regulators of the lysosomal system acting upstream of TFEB 19, 20. The underlying regulatory circuitry is based on mAtg8 interactors, IRGM, Stx17 and TFEB, whereby mAtg8s act as a unifying platform. IRGM, Stx17 and mAtg8s affect mTOR, a kinase phosphorylating TFEB 25, 26. IRGM’s action extends to its partner calcineurin PPP3CB, a phosphatase that promotes TFEB translocation to the nucleus 27 where TFEB initiates lysosomal transcriptional program. This study also unveils a hitherto unappreciated inhibitory effect of IRGM and its interactors 14 on mTOR activity. The expression of a constitutively active RagB can over-ride effects of mAtg8s and their interactors on mTOR. This indicates that their effects channel through the Rag-based control of mTOR, expanding the circuitry associated with mTOR regulation beyond the canonical nutrition-based control. A physical link between mAtg8s and TFEB is amplified by three factors – IRGM, which interacts with mAtg8s 14, Stx17 known to bind members of the mAtg8 family 14, and calcineurin, which binds IRGM as shown here. IRGM activates calcineurin as evident from dephosphorylation of non-TFEB substrates (NFAT). These protein interactions underlie the mechanism (Extended Data Fig. 7f) for how mAtg8s, IRGM and Stx17 control TFEB in addition to the upstream effects on mTOR.
The global gene expression changes during starvation in cells lacking all mAtg8s include a number of TFEB-dependent genes20. This relationship fits the general biological principle of feed-back control, whereby mAtg8s feed-forward stimulate lysosomal expression, reminiscent of the positive feedback between TFEB and MCOLN1 27. By RNAseq, we found fewer autophagy targets than previously described for TFEB 19, albeit by qRT-PCR, mAtg8s affected expression of p62/SQSTM1, ATG9B and ULK119. Mammalian Atg8s affect transcription more broadly, beyond the known TFEB targets 20, including lysosome-associated genes ARSD, DOC2A, SOD1, DENND3, TSPAN1, ATP1A3, and others not related to lysosomes including TGFBI, KYNU, ZNF595, HPSE2, CADM1, IGFBP6, SAGE1 MUC16, NLRP1, etc. One of the mAtg8s has been described as a nuclear protein that shuttles between the nucleus and cytosol 55, and thus mAtg8s in the nucleus may have active roles in gene expression.
Autophagy immune functions include direct elimination of intracellular microbes and control of inflammation 7. IRGM is necessary for full response of TFEB to Mtb infection in macrophages whereas the HIV protein Nef affects TFEB in an IRGM-dependent fashion. IRGM effects on mTOR and AMPK 56 may extend to immunometabolism and associated innate and T cell responses 57.
In summary, mAtg8s control the key regulator of lysosomal biogenesis TFEB, whereas IRGM together with Stx17 and mAtg8s governs nearly all stages of the autolysosomal pathway. Hence, a subset of mAtg8s act indirectly in the completion of the autophagy pathway exerting their function on autophagosomal maturation by regulating TFEB. The molecular complexes formed by IRGM participate in cellular responses to infectious and physiological processes such as starvation. With many functions converging upon IRGM as shown here and elsewhere, it is not surprising that IRGM has emerged as a medically important locus. Thus, IRGM and its complexes as well as the functions of mAtg8s uncovered here should be considered as potential drug targets.
Methods
Antibodies and reagents
The following antibodies and dilutions were used: Rabbit anti Stx17 polyclonal antibody (Sigma; #HPA001204; lot # F115989; 1:1000 (WB)); mouse anti FLAG monoclonal (Sigma; #F1804, lot #SLB W5142; used at 0.5 μg/ml and 1:1,000 for (WB)); Rabbit anti IRGM polyclonal antibody (Abcam; cat. # ab69494; lot no. GR3316406–1; 1:500 for western blots (WB)); rabbit anti GFP polyclonal antibody (Abcam; cat. no. ab290; lot no. GR3222604–1; 0.5 μg/ml IP and 1:4,000 (WB)); mouse anti-actin monoclonal antibody (Abgent; #AM1829b, lot #SG100806AD; used at 1:4,000); mouse anti PPP3CB polyclonal antibody (Abcam, cat. # ab58161; lot # GR196202–3; 1:500 (WB)); mouse anti pan 14-3-3 monoclonal antibody (Santa Cruz Biotechnology, Inc. #sc-133232 (B11), lot #K0812 1:500 (WB)); rabbit anti TFEB polyclonal antibody (Cell Signaling CST #4240, lot # 2; 1:200 (IF); 1:1000 (WB)); rabbit anti phospho (Ser) 14-3-3 binding motif polyclonal antibody (Cell Signaling CST #9601,1:1000 (WB)); goat anti TFEB polyclonal antibody; Thermo Pierce (Cat# PA1–31552, lot# RD2191941; 1:200 (IF)); rabbit anti phospho TFEB (Ser211) (E9S8N) monoclonal antibody (Cell Signaling CST #37681, lot # 1; 1:1000 (WB); rabbit anti phospho pP70S6K (T389) (108D2) monoclonal antibody (Cell Signaling CST #9234, lot # 2; 1:1000 (WB); rabbit anti P70S6K (49D7) monoclonal antibody (Cell Signaling CST #2708, lot #20; 1:1000 (WB); rabbit anti phospho ULK1 (Ser757) (D706U) monoclonal antibody (Cell Signaling #CST 14202, lot # 2; 1:1000 (WB); anti phospho ULK1 (Ser317) (D2B6Y) monoclonal antibody (Cell Signaling CST #12753, lot # 1; 1:1000 (WB); rabbit anti ULK1 (D9D7) monoclonal antibody (Cell Signaling CST #6439, lot # 1; 1:1000 (WB); rabbit anti mTOR (7C10) monoclonal antibody (Cell Signaling CST #2983, lot#16; 1:200 (IF); rabbit anti Raptor (24C12) monoclonal (Cell Signaling CST 2280, 1:750 (WB)); rabbit anti RagA (D8B5) monoclonal antibody (Cell Signaling CST #4357, lot #2; 1:750 (WB); Rabbit anti NFAT monoclonal antibody (Cell Signaling CST #4389, lot #2; 1:500 (WB))mouse anti LAMP2 monoclonal antibody (human; DSHB of University of Iowa H4B4, 1:250 (IF); IRGM siRNA (Dharmacon 34561); Dynabeads Protein G (Thermo Fisher Scientific 88816 10003D 50μl/ IP); Anti-HA magnetic beads (Thermo Fisher Scientific 88836 10003D 150μl/ IP).
Cell culture
HEK 293T, THP-1 and HeLa cells were obtained directly from ATCC and maintained in ATCC recommended media.THP-1 cells were differentiated with 50 nM PMA overnight before use. LC3TKO, GABARAPTKO, HexaKO and wild type control HeLa cells were from Michael Lazarou (Monash University, Melbourne) 18. HeLa Stx17KO and ATG3KO have been described previously 43, 44. TZM-bl Cells were obtained from NIH AIDS Reagent program and were cultured in DMEM media supplemented with 10% FBS and antibiotics. 293T stably expressing RagBQ99L and control wild type cells were from Roberto Zoncu (UC Berkeley). HeLa cells stably expressing TMEM192–2xFLAG or TFEM192–3xHA are described previously 34. Mouse (IrgmKO and IrgmWT; cared for following protocols approved by Institutional Animal Care and Use Committee) bone marrow macrophages (BMMs) were extracted from mouse bone marrow and cultured in DMEM media supplemented with high glucose, sodium bicarbonate and 20% FBS in presence of mouse macrophage colony stimulating factor (mM-CSF).
High content microscopy
High content microscopy was carried out as described previously 44. Briefly, cells were plated in 96 well plates, transfected with plasmids or siRNAs, as indicated in Figures. After transfection cells were stimulated for autophagy or TFEB translocation by incubating in EBSS for 2h followed by fixation with 4% paraformaldehyde for 5 mins. Cells were permeabilized with 0.1% saponin and blocked in 3% BSA, followed by incubation with primary antibody for 4 h and secondary antibody for 1 h. High content microscopy with automated image acquisition and quantification was carried out using a Cellomics HCS scanner and iDEV software (Thermo). Scan was carried out using a Cellomics HCS scanner and iDEV software (Thermo Fisher Scientific) using a minimum of 500 cells per well. Scanning parameters and object mask were preset and predefined to analyze images. Hoechst 33342 staining was used for autofocusing and to define object/cells based on background staining of the cytoplasm. For TFEB translocation nuclei were defined as a region of interest. All data collection, processing and analyses were computer driven.
Mass spectrometry analysis
Mass spectrometry was performed as described previously 44. Briefly, HEK293T cells were transfected with plasmids (pDest-EGFP or pDest-EGFP-IRGM) and immunoprecipitation was performed using ChromoTek GFP-Trap following the manufacturer’s instructions. IPed samples were loaded on a SDS-polyacrylamide gel and Coomassie stained. Each lane was cut into slices and destained. Reduction, alkylation and proteinase digestion was carried out with trypsin overnight at 37ºC as previously described 58, 59. This was followed by extraction of protease-generated peptides as previously described 60. Analyses of in-gel digested peptides were done by reverse phase nanoflow liquid chromatography coupled to a nanoelectrospray QE Exactive mass spectrometer utilizing a Higher energy induced dissociation (HCD) fragmentation (RP nLC-ESI MS2). The RP nLC was performed as previously described 59. Proteomic data 44 have been deposited in MassIVE repository (https://massive.ucsd.edu).
GST pull downs
GST pull-down assays with in vitro translated 35S-labeled proteins were done as described previously 14. Briefly, GST-fusion proteins were expressed in Escherichia coli BL21(DE3) and/or SoluBL21 (Amsbio). After pull-down assays, the proteins were separated by SDS-PAGE and transferred to PVDF membranes and the radiolabeled proteins were detected in a PharosFX and PharosFX Plus Imager (BioRad).
Immunofluorescence confocal microscopy
For immunofluorescence confocal microscopy, cells were plated onto coverslips in 12 well or 24 well plates. Cells were transfected with plasmids as indicated in figures. Cells were incubated in full media or EBSS for 2 h and fixed in 4% paraformaldehyde for 10 min followed by permeabilization with 0.1% saponin in 3% BSA. Cells were then blocked in 3% BSA and then stained with primary antibodies followed by washings with PBS and then incubation with appropriate secondary antibodies for 1 h at room temperature. Coverslips were mounted using ProLong Gold Antifade Mountant (Invitrogen) and analyzed by confocal microscopy using the Zeiss LSM510 Laser Scanning Microscope.
Plasmids, siRNAs, miRNAs transfections
IRGM constructs were described previously 4, 12–14. Stx17 construct was a kind gift from N. Mizushima. MiTF and TFE3 constructs were from R.Perera. TFEB constructs were kindly provided by R. Puertollano. Plasmid constructs were verified by DNA-sequencing. Plasmids were transfected using ProFection Mammalian Transfection System from Promega or Lipofectamine 2000 reagent from Thermo Fisher. All siRNAs were from Dharmacon. Cells were transfected with 1.5 μg of siRNAs. For siRNA transfections 106 cells were resuspended in 100 μl of Nucleofector solution kit V (Amaxa), siRNAs were then added to the cell suspension and cells were nucleoporated using Amaxa Nucleofector apparatus with program D-032. Cells were re-transfected with a second dose of siRNAs 24 h after the first transfection and assayed after 48 h. miRNA196 (sequence: UAGGUAGUUUCCUGUUGUUGGG) and miRNA20 (sequence: UAAAGUGCUUAUAGUGCAGGUAG) were transfected with lipofectamine 2000 reagent. Cells were assayed 48h after transfection.
Bacterial strains and procedures
M. tuberculosis wild-type Erdman and its ESX-1 mutant were cultured as described previously 14, 49. For TFEB translocation differentiated THP-1 cells were infected with M. tuberculosis (Erdman or ESX-1). After infections, cells were fixed in 4% paraformaldehyde and stained with TFEB antibody. TFEB nuclear translocation was analyzed by high content microscopy.
For E. coli experiment, THP1 cells were differentiated with PMA and cells were infected with AIEC LF82 or K12 with MOI of 1:20 for 4 h. Cells were treated with gentamycin (100 μg/ml) for 1 h followed by incubation in fresh media for 2h. After infection cells were fixed using paraformaldehyde and stained with TFEB antibody. TFEB nuclear translocation was analyzed by high content microscopy.
HIV clones, viral production and cellular infection
HIV molecular clones pNL 4–3∆Env or control lentviral vector were transfected in 293T cells together with VSV-G envelope61. 24 h after transfection, supernatant was collected, filtered and normalized for viral budding by ELISA (ZeptoMetrix Corporation, NY). Virus was titrated using TZM-bl cells by X-Gal staining method 62. HeLa cells were infected with virus titer at MOI 1 63.
Isolation of Nuclear and cytosolic fractions
Nuclear and cytosolic fractions were isolated as described previously19. Briefly, HeLa cells were transfected with scrambled or IRGM siRNA and plated in 10 cm dishes. After 48h of transfection, cells were left in full media or incubated in EBSS for autophagy induction for 2h. For subcellular fractionation, cells were lysed in 0.5 Triton X-100 lysis buffer (50mM Tris-HCl, 0.5% triton, 137.5 mM NaCl, 10% glycerol, 5 mM EDTA) supplemented with protease and phosphatase inhibitors. After 15 minutes the lysates were centrifuged. The supernatant represented cytosolic fraction while pellet (nuclear fraction) was washed twice and lysed in 0.5 Triton X-100 buffer 0.5% SDS and sonicated. Both cytosolic and nuclear fractions were run on SDS-PAGE and western blotting for TFEB and other proteins (indicated in figures) was done to analyze TFEB nuclear translocation.
Immunoblotting and co-immunoprecipitation assays
Western blotting and co-immunoprecipitations (co-IP) were performed as described previously 49. For co-IP, cells were transfected with plasmids as indicated in figures, lysed in NP-40 buffer containing protease inhibitor cocktail and PMSF. Lysates were incubated with antibodies at 4°C for 4 h followed by incubation with protein G Dynabeads for 2 h-4h at 4°C. Beads were washed three times with PBS and samples were boiled with SDS containing sample buffer. Samples were processed for immunoblotting to analyze the interactions between immunoprecipitated proteins.
Immunopurification of lysosomes (LysoIP)
LysoIP was performed as described previously 34, 40. Briefly, ~25 million HeLa cells stably expressing TMEM192–3xHA or TMEM192–2xFLAG were used for LysoIP. Cells were rinsed with PBS and then scraped in one mL of KPBS (136 mM KCl, 10 mM KH2PO4, pH 7.25 was adjusted with KOH) and centrifuged at 1000 x g for 2 min at 4°C. Pelleted cells were resuspended in 1000 μL of KPBS and were gently homogenized with 20 strokes of homogenizer. The homogenate was then centrifuged at 1000 x g for 2 min at 4°C. 50 μL of samples were saved as input. Rest of the supernatant was incubated with 150 μL of anti-HA magnetic beads on a gentle rotator shaker for 10 min. Immunoprecipitates were then washed three times and eluted in SDS loading buffer. Western blotting for proteins indicated in figures was done as described in above section.
Quantitative RT-PCR
HeLa wild type or HexaKO, Stx17KO or the cells transfected with scrambled (scr) or IRGM siRNA were incubated in EBSS for 2h. Cells were collected in and RNA was isolated using TRIzol reagent. cDNA was generated by using a high capacity cDNA reverse transcriptase kit with RNase inhibitor and random hexamer primers (Applied Biosystems) on a GeneAmp PCR System 9700 thermocycler (Applied Biosystems). Quantitative real-time PCR (qPCR) qPCR was performed using a StepOne Plus instrument (Applied Biosystems) relative to 18S rRNA as a housekeeping gene control for normalization. Taqman Gene Expression master mix (Applied Biosystems) and a PrimeTime predesigned qPCR Assay for ULK1 (Catalog number: Hs00177504_m1; 4331182;Thermo Fisher), ATG9B (Catalog number: Hs01123449_g1; 4331182;Thermo Fisher) and p62 (Catalog number: Hs02621445_s1; 4331182;Thermo Fisher) were used. Gene expression was quantified using QuantStudio Software (Applied Biosystems) relative to the housekeeping gene 18S.
RNAseq
GABATKO, HexaKo and ATG3KO along with their parental wild type HeLa cells were incubated with EBSS for 2h. Total RNA was extracted using Trizol reagent (Invitrogen, CA, USA) following the manufacturer’s procedure. The total RNA quantity and purity were analyzed using Bioanalyzer 2100 and RNA 6000 Nano LabChip Kit (Agilent, CA, USA) with RIN number >7.0. Poly(A) RNA was purified from total RNA (5ug) using poly-T oligo-attached magnetic beads using two rounds of purification. Following purification, the mRNA was fragmented into small pieces using divalent cations under elevated temperature. Then the cleaved RNA fragments were reverse transcribed to create the final cDNA library in accordance with the protocol for the TruSeq RNA Sample Preparation v2 (Cat. RS-122–2001, RS-122–2002) (Illumina, San Diego, USA), the average insert size for the paired-end libraries was 300 bp (±50 bp). The paired-end sequencing was carried out on an Illumina NovaseqTM 6000 at the (LC Sceiences,USA) following the manufacturer’s recommended protocol. Using the Illumina paired-end RNA-seq approach, the transcriptome was sequenced, generating a total of 2 × 150 million bp paired-end reads. This yielded gigabases (Gb) of sequence. Prior to assembly, the low-quality reads (1, reads containing sequencing adaptors; 2 reads containing sequencing primer;3, nucleotide with q quality score lower than 20) were removed. Sequencing reads were aligned to the reference genome using HISAT2 package. HISAT allows multiple alignments per read (up to 20 by default) and a maximum of two mismatches when mapping the reads to the reference. HISAT build a database of potential splice junctions and confirms these by comparing the previously unmapped reads against the database of putative junctions. The mapped reads of each sample were assembled using StringTie. All transcriptomes from samples were merged to reconstruct a comprehensive transcriptome using perl scripts (LC Sciences, USA). After the final transcriptome was generated, StringTie and edgeR was used to estimate the expression levels of all transcripts. StringTie was used to perform expression level for mRNAs by calculating FPKM (Fragments Per Kilobase Million). Differential gene expression was analyzed by the R package, edgeR, which takes into account dispersions (i.e. variations) between biological replicates. P values were calculated using Fisher’s exact test adapted for over-dispersed data; edgeR models read counts with negative binomial (NB) distribution64. The differentially expressed mRNAs and genes were selected with log2 (fold change) ≥1 or log2 (fold change) ≤−1 and with statistical significance (p value < 0.05) by R package.
Flow cytometry to analyze intracellular calcium
Intracellular calcium was analyzed using FLUO-3AM fluorescence on the FL-1 channel of flow cytometer (BD FACScan). Wild type HeLa or HexaKo cells were left unstimulated on incubated in HBSS for 2h. Cells were incubated with 5μM of FLUO-3AM for 30 minutes, followed by analysis on flow cytometer.
Statistics and reproducibility
Data are expressed as means ± SEM (n ≥ 3). Data were analyzed with a paired Student’s t-test or with analysis of variance (ANOVA, Tukey’s post hoc test). GraphPad prism6 was used to determine Statistical significance. No statistical methods were used to predetermine the sample sizes. The number of replicates and any statistical tests used are indicated in the figure legends, and all the replicates reproduced the shown findings. The experiments were repeated at least 3 times wherever representative results are shown. Majority of statistics were calculated using GraphPad Prism 6, R Package was used to calculate statistics for RNAseq data.
Extended Data
Extended Data Fig. 1. IRGM affects nuclear translocation of TFEB.
a, confocal microscopy analysis of effects of IRGM KD on TFEB nuclear translocation in response to 2h starvation. Scale bar 5 μm, (n=3 biologically independent experiments). b,c, HCM images and quantification to test the effect of IRGM KD on nuclear translocation of TFEB. Cells were permeabilized with Triton. Data, means ± SEM (n=3 biologically independent experiments) ANOVA, Tukey’s post hoc test; high content microscopy, >500 cells counted per well; minimum number of valid wells 9. Masks; white: algorithm-defined cell boundaries; yellow outline: computer-identified colocalization between TFEB and Hoechst-33342 nuclear stain). Scale bar 10 μm. d,e, HCM images and quantifications to test the effect of IRGM KD on nuclear translocation of TFEB in cells treated with DMSO or pp242. Data, means ± SEM (n=3 biologically independent experiments) ANOVA, Tukey’s post hoc test; high content microscopy, >500 cells counted per well; minimum number of valid wells . Masks; white: algorithm-defined cell boundaries; yellow outline: computer-identified colocalization between TFEB and Hoechst-33342 nuclear stain). Scale bar 10 μm. Numerical source data for panels b and d are provided in Statistical Source Data Extended Fig. 1.
Extended Data Fig. 2. Interactions and localization analyses of IRGM with MiT/TFE family of transcriptional regulators.
a, Confocal microscopy analysis of co-localization between GFP-IRGM and endogenous TFEB. Scale bar 5 μm, (n=3 biologically independent experiments). b, A screenshot from NCBI showing domain of unknown function (DUF3371) in TFEB. c,d, HCM images and quantifications to analyze the effect of complementation of IRGM KD with GFP-IRGM WT or GFP-IRGM S47N on nuclear translocation of TFEB. Data, means ± SEM (n=3 biologically independent experiments) ANOVA, Tukey’s post hoc test; HCM, >500 cells counted per well; minimum number of valid wells 9, 3 independent experiments. Masks; white: algorithm-defined cell boundaries and computer-identified GFP positive cells; blue outline: computer-identified nuclear stain; yellow outline: computer-identified colocalization between TFEB and Hoechst-33342 nuclear stain). Scale bar 10 μm. The masks in gray scale panels are cloned from the merged images. Inset: western blot showing GFP-IRGM expression IRGM KD cells. e, Co-IP analysis of interactions between GFP-MiTF (H isoform) and FLAG-IRGM in 293T cells, (n=3 biologically independent experiments). f, Co-IP analysis of interactions between GFP-TFE3 and FLAG-IRGM in 293T cells, (n=3 biologically independent experiments). g,h, Co-IP analysis of interactions between GFP-IRGM WT or GFP-IRGM S47N with MiTF in 293T cells. Data, means ± SEM of normalized intensities (n=3 biologically independent experiments) paired t-test. Uncropped blots for panels e, f and g are provided in Unprocessed Blots Data Extended Fig. 2 and numerical source data for panels c and h are provided in Statistical Source Data Extended Fig. 2.
Extended Data Fig. 3. IRGM effects on mTOR and calcineurin and mAtg8s interactions with and effects on TFEB.
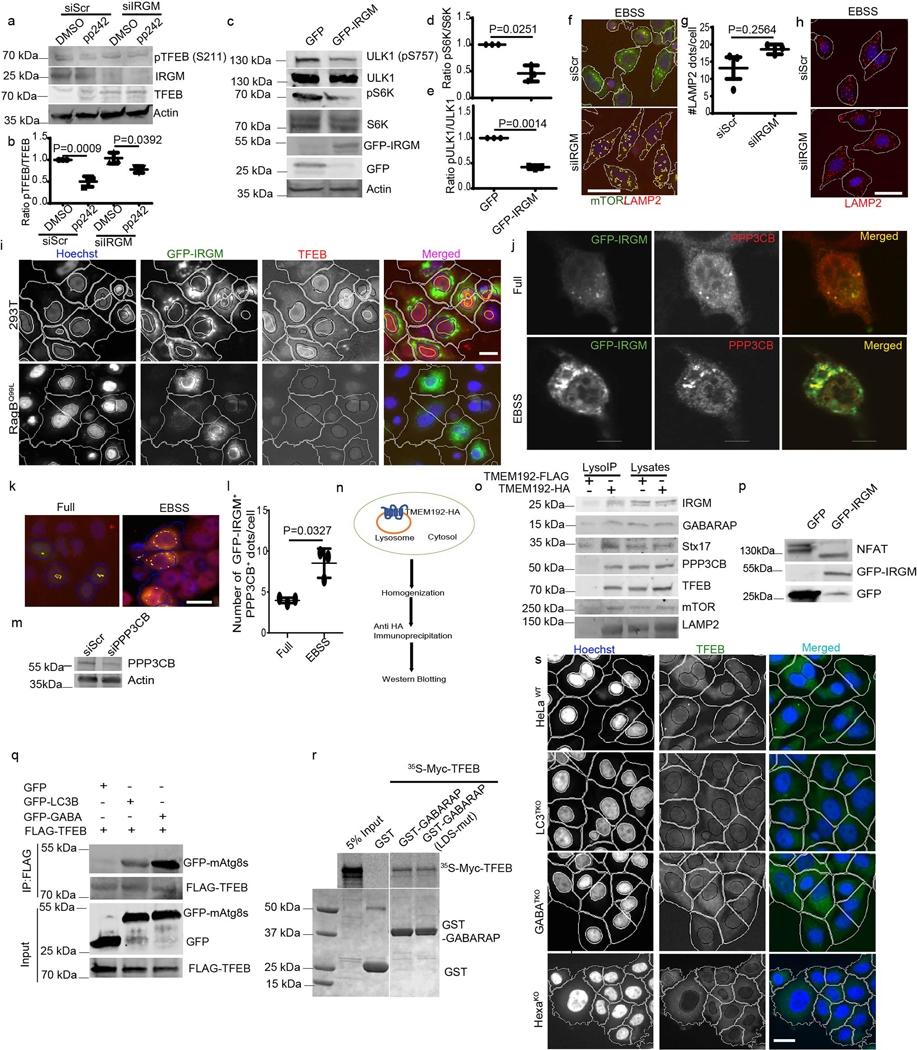
a, b, Western blot analysis and quantifications of the effects of IRGM KD on pTFEB (S211) levels in cells treated with pp242. Data, means ± SEM of normalized intensities (n=3 biologically independent experiments) ANOVA, Tukey’s post hoc test. c–e, western blots analysis of the effects of IRGM on mTOR substrates pS6K and pULK1. Data, means ± SEM of normalized intensities (n=3 biologically independent experiments) paired t-test. f, HCM image analysis of co-localization between mTOR and LAMP2. Scale bar 10 μm. g,h, HCM analysis of the effects of IRGM KD on LAMP2 puncta. Data, means ± SEM; (n=3 biologically independent experiments) paired t-test. Scale bar 10 μm. i, HCM analysis of the effect of IRGM expression on cells expressing RagBQ99L and parental 293T cells on nuclear translocation of TFEB, (n=3 biologically independent experiments). Scale bar 10 μm. j, confocal microscopy analysis of co-localization between GFP-IRGM and endogenous PPP3CB in HeLa cells (n=3 biologically independent experiments). Scale bar 5 μm. k,l, HCM analysis of the effect of starvation on colocalization between GFP-IRGM and PPP3CB. Data, means ± SEM (n=3 biologically independent experiments) paired t-test. Scale bar 10 μm. m, western blot showing PPP3CB KD in HeLa cells (n=3 biologically independent experiments). n, schematics of LysoIP technique. o, LysoIP to detect indicated proteins on lysosomes (n=3 biologically independent experiments). p, western blot analysis of the effects of IRGM expression on NFAT mobility shift (n=3 biologically independent experiments). q, Co-IP analysis of GFP-LC3B and GFP-GABARAP with FLAG-TFEB in 293T cells. r, GST pull-down analysis of TFEB with WT or LDS mutant of GABARAP. s, HCM images in WT or HexaKO cells (n=3 biologically independent experiments). Scale bar 10 μm. Uncropped blots for panels a, c, o, p, q and r are provided in Unprocessed Blots Data Extended Fig. 3 and numerical source data for panels b, d, e, g and l are provided in Statistical Source Data Extended Fig. 3.
Extended Data Fig. 4. GABARAP and GABARAPL1 but not GABARAPL2 control nuclear translocation of TFEB.
a,b, HCM images and quantifications to test the role of mAtg8s on nuclear translocation of GFP-MiTF in response to autophagy induction (EBSS 2h). Data, means ± SEM (n=3 biologically independent experiments) paired t-test. Masks; white: algorithm-defined cell boundaries; blue outline: computer-identified nuclear stain; yellow outline: computer-identified colocalization between TFEB and Hoechst-33342 nuclear stain). Scale bar 10 μm. The masks in gray scale panels are cloned from the merged images, (n=3 biologically independent experiments). c, HCM image analysis of effects of complementation of HexaKO with GFP-GABARAP on nuclear translocation of TFEB. Scale bar 10 μm. d–g, HCM analysis of the effect of complementation of HexaKO cells with GABARAPL1 or GABARAPL2 on nuclear translocation of TFEB. Data, means ± SEM, ANOVA, Tukey’s post hoc test; HCM, >500 cells counted per well; minimum number of valid wells 9, (n=3 biologically independent experiments). Scale bar 10 μm. h, HCM analysis of effect of expression of GABARAP in 293T cells expressing RagBQ99L or parental 293T cells on nuclear translocation of TFEB. Masks in c, e, g, h; white: algorithm-defined cell boundaries in GFP positive cells; blue outline: computer-identified nuclear stain; yellow outline: computer-identified co-localization between TFEB and Hoechst-33342 nuclear stain), (n=3 biologically independent experiments). Scale bar 10 μm. Numerical source data for panels a, d, and f are provided in Statistical Source Data Extended Fig. 4.
Extended Data Fig. 5. mAtg8s affect global gene expression.
a, Volcano plot (RNAseq) showing the effect of pan-mAtg8 knockout on differential gene expression (log2 fold change; ratio HeLa HexaKO/HeLaWT). Red points: down-regulated genes in HexaKO cells. Green points: upregulated in HexaKO cells. A subset of genes not identified as TFEB targets are named. Dotted orange line, significance cuttof (p value < 0.05). P values were calculated using Fisher’s exact test adapted for over-dispersed data; edgeR models read counts with negative binomial (NB) distribution (see methods). (n=3 biologically independent experiments). b, Heat map representation of genes upregulated or downregulated in HeLaWT vs. HexaKO cells. c, A volcano plot showing RNAseq analysis of HeLaWT vs. ATG3KO cells. P values were calculated using Fisher’s exact test using R package. Named genes are previously identified TFEB targets those were also down-regulated in HexaKO shown in Fig. 5c. (n=3 biologically independent experiments). d, A volcano plot (RNAseq) listing upregulated and downregulated autophagy-related genes in HeLaWT vs. HexaKO cells. P values were calculated using Fisher’s exact test adapted for over-dispersed data; edgeR models read counts with negative binomial (NB) distribution (see methods). (n=3 biologically independent experiments). e, qRT-PCR analysis of p62, ATG9B and ULK1 in HeLaWT vs. HexaKO cells induced for autophagy in EBSS for 2h; 18S was used as an internal control, Data, means ± SEM (n=3 biologically independent experiments). Numerical source data for panel e are provided in Statistical Source Data Extended Fig. 5.
Extended Data Fig. 6. mAtg8s affect calcium fluxes and Stx17 affects mTOR and TFEB.
a, A volcano plot showing expression of calcium effectors in HexaKO cells. P values were calculated using Fisher’s exact test adapted for over-dispersed data (see methods) (n=3 biologically independent experiments). b,c Flow cytometry using FLUO-3AM to detect intracellular calcium in HeLaWT or HexaKo. Data, means ± SEM; (n=3 biologically independent experiments) ANOVA, Tukey’s post hoc test. d, Confocal microscopy analysis of the effects of Stx17KO on TFEB localization, (n=3 biologically independent experiments). Scale bar 5 μm. e–g, confocal microscopy (e) and HCM (f,g) analyses of the effects of Stx17KO on colocalization between TFEB and LAMP2. Scale bar 5 μm (e). Scale bar 10 μm (f). Data, means ± SEM; (n=3 biologically independent experiments) ANOVA, Tukey’s post hoc test. h, HCM analysis of the effects of Stx17KO on TFEB puncta. Data, means ± SEM; (n=3 biologically independent experiments) ANOVA, Tukey’s post hoc test. i, Co-IP analysis of interactions between GFP-Stx17 and FLAG-TFEB in 293T cells (n=3 biologically independent experiments). j,k, Co-IP analysis of effects of GFP-Stx17 on FLAG-TFEB and IRGM complexes. Data, means ± SEM (n=3 biologically independent experiments) paired t-test. l,m, MS analysis showing 14-3-3 peptides those interacted with GFP or GFP-Stx17 and GFP-IRGM (n=3 biologically independent experiments). n–p, Western blot analysis and quantification of the effect of GFP-Stx17 in HeLaWT (full media) or in Stx17KO cells (EBSS 2h) on mTOR activity. Data, means ± SEM; (n=3 biologically independent experiments) ANOVA, Tukey’s post hoc test. q–s, Western blot analysis and quantification of pULK1 and pS6K to test the effects of GFP-Stx17 expression in WT 293T cells and cells expressing RagBQ99L. Data, means ± SEM; (n=3 biologically independent experiments) ANOVA, Tukey’s post hoc test. t–w, Co-IP analysis of interactions between RagA and FLAG-p18 (t,u) and Raptor and FLAG-RagA (v-w) in Stx17KO or parental HeLa cells. Data, means ± SEM of normalized intensities (n=3 biologically independent experiments) paired t-test. Uncropped blots for panels i, j, n, q, t and v are provided in Unprocessed Blots Data Extended Fig. 6 and numerical source data for panels b, f, h, k, p, o, r, s, u and w are provided in Statistical Source Data Extended Fig. 6.
Extended Data Fig. 7. mIR196B affects protective CD variant of IRGM in its role in nuclear translocation of TFEB.
a,b, HCM analysis of the effects of miR196B (shown to downregulate CD protective IRGM variant) and miR20 (control) transfection on TFEB nuclear localization in 293T cells (c.313C). HCM (n=3 biologically independent experiments); >500 primary objects examined per well; minimum number of wells, 9). Masks; white: algorithm-defined cell boundaries; blue: computer-identified nucleus; yellow outline: computer-identified colocalization between TFEB and Hoechst-33342 nuclear stain). Images, a detail from a large database of machine-collected and computer-processed images. Data, means ± SEM; (n=3 biologically independent experiments) ANOVA, Tukey’s post hoc test. Scale bar 10 μm. c, HCM image analysis of the effects of IRGM KD on AIEC LF82 influenced nuclear translocation of TFEB. K12 was used as control, (n=3 biologically independent experiments). Scale bar 10 μm. d,e, HC microscopy and quantifications to analyze the effect of HIV infection on TFEB localization in HeLa cells transfected with scramble siRNA or IRGM siRNA. HC microscopy (n=3 biologically independent experiments; >500 primary objects examined per well; minimum number of wells, 12). Masks; white: algorithm-defined cell boundaries; blue: computer-identified nucleus; yellow outline: computer-identified colocalization between TFEB and Hoechst-33342 nuclear stain). Images, a detail from a large database of machine-collected and computer-processed images. Data, means ± SEM; (n=3 biologically independent experiments) ANOVA, Tukey’s post hoc test. Scale bar 10 μm. f, The model summarizes the effects of IRGM, Stx17 and mAtg8s/GABARAPs on mTOR inhibition and calcineurin (CN) activation promoting nuclear translocation of TFEB. L, lysosome. Numerical source data for panels a and d are provided in Statistical Source Data Extended Fig. 7.
Supplementary Material
: RNAseq analysis (reported as differential gene expression) of HeLa WT and HexaKO determining effects of deletion of all mAtg8s (HexaKO) on differential gene expression. The cells were incubated in EBSS for 2h. Previously known TFEB targets are highlighted in yellow. Table S1 Tab2: same as Tab1, reporting differential transcript expression. (n=3 biologically independent experiments).
: RNAseq analysis (reported as differential gene expression) of HeLa WT and GABA TKO determining effects of deletion of all GABARAPs on differential gene expression. The cells were incubated in EBSS for 2h. Previously known TFEB targets are highlighted in yellow. Table 2 Tab2: same as Tab1, reporting differential transcript expression. (n=3 biologically independent experiments).
: Tab5. RNAseq analysis (reported as differential gene expression) of HeLa WT and ATG3KO determining effects of deletion ATG3 on differential gene expression. The cells were incubated in EBSS for 2h. Previously known TFEB targets are highlighted in yellow. Table 3 Tab2: same as Tab1, reporting differential transcript expression. (n=3 biologically independent experiments)
: Mass-spectrometry analyses of GFP-IRGM interactors. (n=3 biologically independent experiments).
Acknowledgments
We thank R. Puertollano, S. Ferguson, and A. Ballabio for TFEB constructs. This work was supported by NIH grants R37AI042999 and R01AI042999 and center grant P20GM121176 to V.D.
Footnotes
Competing interests
The authors declare no competing interests.
Data availability statement
RNA–seq data that support the findings of this study have been deposited in the Gene Expression Omnibus (GEO) under accession codes GSE149533. Mass spectrometry proteomics data in this study have been deposited in MassIVE repository (https://massive.ucsd.edu) for Stx17 interactors44 with the accession number MSV000083251 and for IRGM interactors with the accession number MSV000085401. All other data supporting the findings of this study are available from the corresponding author on reasonable request.
References
- 1.Mizushima N, Yoshimori T & Ohsumi Y. The role of Atg proteins in autophagosome formation. Annu Rev Cell Dev Biol 27, 107–132 (2011). [DOI] [PubMed] [Google Scholar]
- 2.Mizushima N, Levine B, Cuervo AM & Klionsky DJ Autophagy fights disease through cellular self-digestion. Nature 451, 1069–1075 (2008). [DOI] [PMC free article] [PubMed] [Google Scholar]
- 3.Levine B & Kroemer G. Biological Functions of Autophagy Genes: A Disease Perspective. Cell 176, 11–42 (2019). [DOI] [PMC free article] [PubMed] [Google Scholar]
- 4.Singh SB, Davis AS, Taylor GA & Deretic V. Human IRGM induces autophagy to eliminate intracellular mycobacteria. Science 313, 1438–1441 (2006). [DOI] [PubMed] [Google Scholar]
- 5.Consortium Genome-wide association study of 14,000 cases of seven common diseases and 3,000 shared controls. Nature 447, 661–678 (2007). [DOI] [PMC free article] [PubMed] [Google Scholar]
- 6.Parkes M et al. Sequence variants in the autophagy gene IRGM and multiple other replicating loci contribute to Crohn’s disease susceptibility. Nat Genet 39, 830–832 (2007). [DOI] [PMC free article] [PubMed] [Google Scholar]
- 7.Deretic V, Saitoh T & Akira S. Autophagy in infection, inflammation and immunity. Nat Rev Immunol 13, 722–737 (2013). [DOI] [PMC free article] [PubMed] [Google Scholar]
- 8.Bekpen C et al. The interferon-inducible p47 (IRG) GTPases in vertebrates: loss of the cell autonomous resistance mechanism in the human lineage. Genome Biol 6, R92 (2005). [DOI] [PMC free article] [PubMed] [Google Scholar]
- 9.Bekpen C et al. Death and resurrection of the human IRGM gene. PLoS Genet 5, e1000403 (2009). [DOI] [PMC free article] [PubMed] [Google Scholar]
- 10.Mitchell G & Isberg RR Innate Immunity to Intracellular Pathogens: Balancing Microbial Elimination and Inflammation. Cell Host Microbe 22, 166–175 (2017). [DOI] [PMC free article] [PubMed] [Google Scholar]
- 11.Gutierrez MG et al. Autophagy is a defense mechanism inhibiting BCG and Mycobacterium tuberculosis survival in infected macrophages. Cell 119, 753–766 (2004). [DOI] [PubMed] [Google Scholar]
- 12.Singh SB et al. Human IRGM regulates autophagy and cell-autonomous immunity functions through mitochondria. Nat Cell Biol 12, 1154–1165 (2010). [DOI] [PMC free article] [PubMed] [Google Scholar]
- 13.Chauhan S, Mandell MA & Deretic V. IRGM Governs the Core Autophagy Machinery to Conduct Antimicrobial Defense. Mol Cell 58, 507–521 (2015). [DOI] [PMC free article] [PubMed] [Google Scholar]
- 14.Kumar S et al. Mechanism of Stx17 recruitment to autophagosomes via IRGM and mammalian Atg8 proteins. J Cell Biol 217, 997–1013 (2018). [DOI] [PMC free article] [PubMed] [Google Scholar]
- 15.Gregoire IP et al. IRGM is a common target of RNA viruses that subvert the autophagy network. PLoS pathogens 7, e1002422 (2011). [DOI] [PMC free article] [PubMed] [Google Scholar]
- 16.Itakura E, Kishi-Itakura C & Mizushima N. The hairpin-type tail-anchored SNARE syntaxin 17 targets to autophagosomes for fusion with endosomes/lysosomes. Cell 151, 1256–1269 (2012). [DOI] [PubMed] [Google Scholar]
- 17.Weidberg H et al. LC3 and GATE-16/GABARAP subfamilies are both essential yet act differently in autophagosome biogenesis. The EMBO journal 29, 1792–1802 (2010). [DOI] [PMC free article] [PubMed] [Google Scholar]
- 18.Nguyen TN et al. Atg8 family LC3/GABARAP proteins are crucial for autophagosome-lysosome fusion but not autophagosome formation during PINK1/Parkin mitophagy and starvation. J Cell Biol 215, 857–874 (2016). [DOI] [PMC free article] [PubMed] [Google Scholar]
- 19.Settembre C et al. TFEB links autophagy to lysosomal biogenesis. Science 332, 1429–1433 (2011). [DOI] [PMC free article] [PubMed] [Google Scholar]
- 20.Sardiello M et al. A gene network regulating lysosomal biogenesis and function. Science 325, 473–477 (2009). [DOI] [PubMed] [Google Scholar]
- 21.Puertollano R, Ferguson SM, Brugarolas J & Ballabio A. The complex relationship between TFEB transcription factor phosphorylation and subcellular localization. EMBO J 37 (2018). [DOI] [PMC free article] [PubMed] [Google Scholar]
- 22.Napolitano G & Ballabio A. TFEB at a glance. J Cell Sci 129, 2475–2481 (2016). [DOI] [PMC free article] [PubMed] [Google Scholar]
- 23.Brady OA, Martina JA & Puertollano R. Emerging roles for TFEB in the immune response and inflammation. Autophagy 14, 181–189 (2018). [DOI] [PMC free article] [PubMed] [Google Scholar]
- 24.Settembre C et al. TFEB controls cellular lipid metabolism through a starvation-induced autoregulatory loop. Nature cell biology 15, 647–658 (2013). [DOI] [PMC free article] [PubMed] [Google Scholar]
- 25.Roczniak-Ferguson A et al. The transcription factor TFEB links mTORC1 signaling to transcriptional control of lysosome homeostasis. Sci Signal 5, ra42 (2012). [DOI] [PMC free article] [PubMed] [Google Scholar]
- 26.Settembre C et al. A lysosome-to-nucleus signalling mechanism senses and regulates the lysosome via mTOR and TFEB. EMBO J 31, 1095–1108 (2012). [DOI] [PMC free article] [PubMed] [Google Scholar]
- 27.Medina DL et al. Lysosomal calcium signalling regulates autophagy through calcineurin and TFEB. Nat Cell Biol 17, 288–299 (2015). [DOI] [PMC free article] [PubMed] [Google Scholar]
- 28.Medina DL et al. Transcriptional activation of lysosomal exocytosis promotes cellular clearance. Dev Cell 21, 421–430 (2011). [DOI] [PMC free article] [PubMed] [Google Scholar]
- 29.Nnah IC et al. TFEB-driven endocytosis coordinates MTORC1 signaling and autophagy. Autophagy 15, 151–164 (2019). [DOI] [PMC free article] [PubMed] [Google Scholar]
- 30.Mansueto G et al. Transcription Factor EB Controls Metabolic Flexibility during Exercise. Cell Metab 25, 182–196 (2017). [DOI] [PMC free article] [PubMed] [Google Scholar]
- 31.Perera RM et al. Transcriptional control of autophagy-lysosome function drives pancreatic cancer metabolism. Nature 524, 361–365 (2015). [DOI] [PMC free article] [PubMed] [Google Scholar]
- 32.Campbell GR, Rawat P, Bruckman RS & Spector SA Human Immunodeficiency Virus Type 1 Nef Inhibits Autophagy through Transcription Factor EB Sequestration. PLoS Pathog 11, e1005018 (2015). [DOI] [PMC free article] [PubMed] [Google Scholar]
- 33.Gray MA et al. Phagocytosis Enhances Lysosomal and Bactericidal Properties by Activating the Transcription Factor TFEB. Curr Biol 26, 1955–1964 (2016). [DOI] [PMC free article] [PubMed] [Google Scholar]
- 34.Jia J et al. Galectin-3 Coordinates a Cellular System for Lysosomal Repair and Removal. Dev Cell 52, 69–87 e68 (2020). [DOI] [PMC free article] [PubMed] [Google Scholar]
- 35.Manzanillo PS, Shiloh MU, Portnoy DA & Cox JS Mycobacterium Tuberculosis Activates the DNA-Dependent Cytosolic Surveillance Pathway within Macrophages. Cell host & microbe 11, 469–480 (2012). [DOI] [PMC free article] [PubMed] [Google Scholar]
- 36.Collazo CM et al. Inactivation of LRG-47 and IRG-47 reveals a family of interferon gamma-inducible genes with essential, pathogen-specific roles in resistance to infection. J Exp Med 194, 181–188 (2001). [DOI] [PMC free article] [PubMed] [Google Scholar]
- 37.NCBI https://www.ncbi.nlm.nih.gov/Structure/cdd/cddsrv.cgi?uid=pfam11851 Domain of unknown function (DUF3371).
- 38.Zoncu R et al. mTORC1 senses lysosomal amino acids through an inside-out mechanism that requires the vacuolar H(+)-ATPase. Science 334, 678–683 (2011). [DOI] [PMC free article] [PubMed] [Google Scholar]
- 39.Inoki K, Zhu T & Guan KL TSC2 mediates cellular energy response to control cell growth and survival. Cell 115, 577–590 (2003). [DOI] [PubMed] [Google Scholar]
- 40.Abu-Remaileh M et al. Lysosomal metabolomics reveals V-ATPase- and mTOR-dependent regulation of amino acid efflux from lysosomes. Science 358, 807–813 (2017). [DOI] [PMC free article] [PubMed] [Google Scholar]
- 41.Behrends C, Sowa ME, Gygi SP & Harper JW Network organization of the human autophagy system. Nature 466, 68–76 (2010). [DOI] [PMC free article] [PubMed] [Google Scholar]
- 42.Nezich CL, Wang C, Fogel AI & Youle RJ MiT/TFE transcription factors are activated during mitophagy downstream of Parkin and Atg5. J Cell Biol 210, 435–450 (2015). [DOI] [PMC free article] [PubMed] [Google Scholar]
- 43.Gu Y et al. Mammalian Atg8 proteins regulate lysosome and autolysosome biogenesis through SNAREs. EMBO J 38, e101994 (2019). [DOI] [PMC free article] [PubMed] [Google Scholar]
- 44.Kumar S et al. Phosphorylation of Syntaxin 17 by TBK1 Controls Autophagy Initiation. Dev Cell (2019). [DOI] [PMC free article] [PubMed] [Google Scholar]
- 45.Bar-Peled L, Schweitzer LD, Zoncu R & Sabatini DM Ragulator Is a GEF for the Rag GTPases that Signal Amino Acid Levels to mTORC1. Cell 150, 1196–1208 (2012). [DOI] [PMC free article] [PubMed] [Google Scholar]
- 46.Jackson CL & Casanova JE Turning on ARF: the Sec7 family of guanine-nucleotide-exchange factors. Trends Cell Biol 10, 60–67 (2000). [DOI] [PubMed] [Google Scholar]
- 47.Jia J et al. Galectins Control mTOR in Response to Endomembrane Damage. Mol Cell 70, 120–135 e128 (2018). [DOI] [PMC free article] [PubMed] [Google Scholar]
- 48.Castellano BM et al. Lysosomal cholesterol activates mTORC1 via an SLC38A9-Niemann-Pick C1 signaling complex. Science 355, 1306–1311 (2017). [DOI] [PMC free article] [PubMed] [Google Scholar]
- 49.Chauhan S et al. TRIMs and Galectins Globally Cooperate and TRIM16 and Galectin-3 Co-direct Autophagy in Endomembrane Damage Homeostasis. Dev Cell 39, 13–27 (2016). [DOI] [PMC free article] [PubMed] [Google Scholar]
- 50.Huett A, McCarroll SA, Daly MJ & Xavier RJ On the level: IRGM gene function is all about expression. Autophagy 5, 96–99 (2009). [DOI] [PMC free article] [PubMed] [Google Scholar]
- 51.Brest P et al. A synonymous variant in IRGM alters a binding site for miR-196 and causes deregulation of IRGM-dependent xenophagy in Crohn’s disease. Nat Genet 43, 242–245 (2011). [DOI] [PubMed] [Google Scholar]
- 52.McCarroll SA et al. Deletion polymorphism upstream of IRGM associated with altered IRGM expression and Crohn’s disease. Nat Genet 40, 1107–1112 (2008). [DOI] [PMC free article] [PubMed] [Google Scholar]
- 53.Carvalho FA et al. Crohn’s disease adherent-invasive Escherichia coli colonize and induce strong gut inflammation in transgenic mice expressing human CEACAM. J Exp Med 206, 2179–2189 (2009). [DOI] [PMC free article] [PubMed] [Google Scholar]
- 54.Chowers MY et al. Optimal infectivity in vitro of human immunodeficiency virus type 1 requires an intact nef gene. J Virol 68, 2906–2914 (1994). [DOI] [PMC free article] [PubMed] [Google Scholar]
- 55.Huang R et al. Deacetylation of nuclear LC3 drives autophagy initiation under starvation. Mol Cell 57, 456–466 (2015). [DOI] [PubMed] [Google Scholar]
- 56.Inoki K, Kim J & Guan KL AMPK and mTOR in cellular energy homeostasis and drug targets. Annu Rev Pharmacol Toxicol 52, 381–400 (2012). [DOI] [PubMed] [Google Scholar]
- 57.O’Neill LA, Kishton RJ & Rathmell J. A guide to immunometabolism for immunologists. Nat Rev Immunol 16, 553–565 (2016). [DOI] [PMC free article] [PubMed] [Google Scholar]
- 58.Faeste CK et al. Characterisation of potential novel allergens in the fish parasite Anisakis simplex. EuPA Open Proteom 4, 140–155 (2014). [DOI] [PMC free article] [PubMed] [Google Scholar]
- 59.Faeste CK et al. Development of liquid chromatography-tandem mass spectrometry methods for the quantitation of Anisakis simplex proteins in fish. J Chromatogr A 1432, 58–72 (2016). [DOI] [PubMed] [Google Scholar]
- 60.Anonsen JH et al. Novel protein substrates of the phospho-form modification system in Neisseria gonorrhoeae and their connection to O-linked protein glycosylation. Infect Immun 80, 22–30 (2012). [DOI] [PMC free article] [PubMed] [Google Scholar]
- 61.Olivetta E & Federico M. HIV-1 Nef protects human-monocyte-derived macrophages from HIV-1-induced apoptosis. Exp Cell Res 312, 890–900 (2006). [DOI] [PubMed] [Google Scholar]
- 62.Aiken C & Trono D. Nef stimulates human immunodeficiency virus type 1 proviral DNA synthesis. J Virol 69, 5048–5056 (1995). [DOI] [PMC free article] [PubMed] [Google Scholar]
- 63.Aiken C. Pseudotyping human immunodeficiency virus type 1 (HIV-1) by the glycoprotein of vesicular stomatitis virus targets HIV-1 entry to an endocytic pathway and suppresses both the requirement for Nef and the sensitivity to cyclosporin A. J Virol 71, 5871–5877 (1997). [DOI] [PMC free article] [PubMed] [Google Scholar]
- 64.Robinson MD, McCarthy DJ & Smyth GK edgeR: a Bioconductor package for differential expression analysis of digital gene expression data. Bioinformatics 26, 139–140 (2010). [DOI] [PMC free article] [PubMed] [Google Scholar]
Associated Data
This section collects any data citations, data availability statements, or supplementary materials included in this article.
Supplementary Materials
: RNAseq analysis (reported as differential gene expression) of HeLa WT and HexaKO determining effects of deletion of all mAtg8s (HexaKO) on differential gene expression. The cells were incubated in EBSS for 2h. Previously known TFEB targets are highlighted in yellow. Table S1 Tab2: same as Tab1, reporting differential transcript expression. (n=3 biologically independent experiments).
: RNAseq analysis (reported as differential gene expression) of HeLa WT and GABA TKO determining effects of deletion of all GABARAPs on differential gene expression. The cells were incubated in EBSS for 2h. Previously known TFEB targets are highlighted in yellow. Table 2 Tab2: same as Tab1, reporting differential transcript expression. (n=3 biologically independent experiments).
: Tab5. RNAseq analysis (reported as differential gene expression) of HeLa WT and ATG3KO determining effects of deletion ATG3 on differential gene expression. The cells were incubated in EBSS for 2h. Previously known TFEB targets are highlighted in yellow. Table 3 Tab2: same as Tab1, reporting differential transcript expression. (n=3 biologically independent experiments)
: Mass-spectrometry analyses of GFP-IRGM interactors. (n=3 biologically independent experiments).


