Abstract
A novel method to locate the centre of keratoconus (KC) and the transition zone between the pathological area and the rest of the corneal tissue is proposed in this study. A spherical coordinate system was used to generate a spherical height map measured relative to the centre of the optimal sphere fit, and normal to the surface. The cone centre was defined as the point with the maximum height. Second derivatives of spherical height were then used to estimate the area of pathology in an iterative process. There was mirror symmetry between cone centre locations in both eyes. The mean distance between cone centre and corneal apex was 1.45 ± 0.25 mm (0.07–2.00), the mean cone height normal to the surface was 37 ± 23 µm (2–129) and 75 ± 45 µm (5–243) in the anterior and posterior surfaces, respectively. There was a significant negative correlation between the cone height and the radius of the sphere of optimal fit (p < 0.05 for both anterior and posterior surfaces). On average, posterior cone height was larger than the corresponding anterior cone height by 37 ± 24 µm (0–158). The novel method proposed can be used to estimate the cone centre and area, and explore the changes in anterior and posterior corneal surfaces that take place with KC progression. It can help improve understanding of keratoconic corneal morphology and assist in developing customized treatments.
Keywords: keratoconus, cornea, topography, cone, shape
1. Introduction
Keratoconus (KC) is a disease that causes alteration in the curvature of the cornea and localized thinning [1–3]. It commonly begins in early adolescence, progresses over the next two decades [4] and can significantly reduce visual acuity and vision-related quality of life [5,6]. While the characteristic topographic patterns of KC can be identified on corneal topographic and tomographic maps, it is still difficult to precisely locate the centre of the cone and the transition zone between the pathology area and the rest of the corneal tissue [7–11]. As classifying and managing KC can be more efficient when the affected corneal region is located, especially in the case of customized corneal crosslinking [12–15], techniques were developed to address this challenge [16–18]. However, some of the available techniques to detect the KC cone are based on methods that analyse corneal tangential or axial curvature maps, which provide different values of maximum curvature based on their specific algorithms [16–18].
Tangential curvature maps typically have high noise-to-signal ratios and are based on the second derivative nature of the curvature calculation. This creates the need in elevation-based systems, such as Scheimpflug tomographers, for smoothing or low-pass filtering to derive tangential curvature from height data [19,20]. Conversely, axial maps assume centre points of surface curvature to be always located on the central reference axis and this assumption reduces the sensitivity of the curvature maps in identifying surface changes due to cone development [21]. Mahmoud et al. [16] initially proposed a method using axial and tangential maps to locate the cone position and to quantify its magnitude. Later, axial and tangential curvature, and the relative elevation of both the anterior and the posterior surfaces, as well as the pachymetric maps were included in the method which exhibited improved accuracy in detecting the presence of KC [22]. Another method used Brillouin spectroscopy which uses the scattering of light for the determination of localized materials elasticity [23]. The Brillouin frequency shift at the point of maximum posterior elevation in relation to the best-fit sphere was also related to several curvature indices [24]. Its magnitude showed a high correlation with corneal stiffness reduction assessed by means of the Brillouin frequency shift [24]. Schwiegerling took Zernike polynomial corneal fitted surface away from the raw-height data to expose the cone characteristics [25]; however, this method was based on the idealistic assumption that only non-keratoconic features of the cornea would be significantly removed when removing the sixth-order Zernike polynomial fitted surface from the raw-height data. A Zernike polynomial of such a radial order is well classified as a high-order aberration fit that could filter many of the keratoconic features of the eye when being removed, leaving serious doubt about analysing the residual elevation for obtaining the KC cone characteristics. Even though these methods have been demonstrated to be good in detecting the presence of KC and quantifying the stiffness associated with the local pathology, they do not evaluate the size of the pathologic area. Furthermore, as the cone centre is different in curvature, elevation, and pachymetry maps, there is a need for a method for detecting the location of the cone axis normal to the surface, in its natural three-dimensional position.
While estimating the area of pathology from the elevation data offers a direct method, a particular challenge is caused by the smooth transition between the natural curved shape of corneal surface and the steeper curvature within the cone. Furthermore, as the cone may be only a few microns above the curved shape of the cornea, it may be difficult to detect given the nature of elevation data, which may cause unacceptably high noise-to-signal ratios. The current study attempts to overcome this difficulty by expressing corneal surface data normal to the surface and relative to the centre of the sphere to generate a ‘spherical height map’. This map eliminates the effect of corneal surface curvature and hence increases the precision in locating cone centre and estimating the size of the affected area of the cornea.
2. Methods
2.1. Clinical data
In this retrospective study, we reviewed the tomography maps of right and left eyes of 309 clinically diagnosed KC patients enrolled in the Vincieye Clinic and Humanitas Clinical and Research Hospital (Milan, Italy). The institutional review board ruled that approval was not obligatory for this record review study. However, the ethical standards set out in the 1964 Declaration of Helsinki and their revision in 2013 were observed and all patients provided informed written consent before using their de-identified data in the study [26,27].
The inclusion criteria were the diagnosis of bilateral KC made by an experienced corneal specialist (P.V.) based on typical topographic patterns (e.g. inferior steepening, asymmetric bowtie, skewed axis) and/or characteristic slit-lamp findings (e.g. Vogt's striae, Fleischer's ring, apical thinning or Rizutti's sign). Exclusion criteria included eye diseases other than KC, extensive corneal scarring, former ocular procedures such as collagen cross-linking or implantation of intracorneal rings, connective tissue disease, as well as pregnancy or early puberty. All participants underwent a complete ophthalmic examination, including a Pentacam HR (Oculus Optikgeräte GmbH; Wetzlar, Germany) examination. Raw elevation data with a reference plane set at the corneal apex (from U12 file) were extracted using customized Pentacam software (v. 1.21r41) and stored in the comma-separated values (CSV) format [28]. The data covered a square grid that was 14 mm wide and had a regular spacing of 0.01 mm.
Patients were divided according to disease severity into three groups, mild, moderate and advanced, based on the topographic keratoconus classification (TKC) provided by the Pentacam topographer [29]. Mild KC was defined with TKC classification of ‘abnormal’, ‘possible’, ‘-’ and ‘1’, moderate KC included TKC grades ‘1–2’, ‘2’ and ‘2–3’, and advanced KC included TKC grades ‘3’, ‘3–4’ and ‘4’.
2.2. Cone location analysis
The data were processed using custom-built Matlab (2018b, The MathWorks, Inc., Natick, MA, USA) codes created by the Biomechanical Engineering Group (BioEG) at the University of Liverpool. Initially, the raw elevation data for anterior and posterior maps (relative to a vertical plane positioned at surface apex) were imported for all patients. Only records that had a quality score ‘OK’ were processed. A sphere was then fitted—using the least-squares method—to the central area with 8 mm diameter of each corneal surface, and the coordinates of the centre point and the radius of the optimal fit sphere were determined. The radial distance from each data point on a corneal surface to the centre of the sphere was then calculated. This was followed by subtracting the radius of the sphere from these radial distances and the position and magnitude of the largest positive difference were assumed to point at the location and height of the cone centre, respectively.
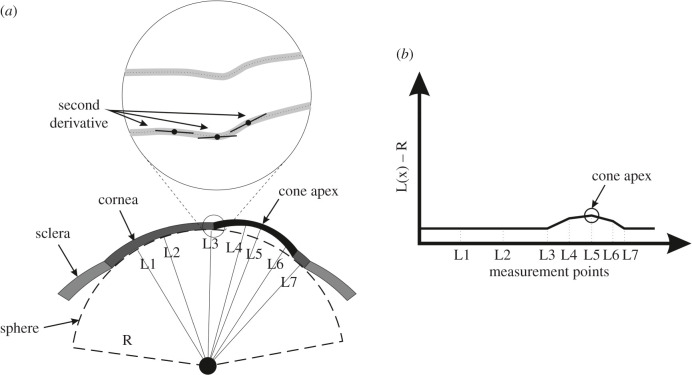
To estimate the area of pathology, height data relative to the optimal sphere were determined along 360 equally-spaced lines meeting at the cone centre and extending outwards using triangle-based cubic interpolation [30]. A first derivative of the height data was calculated to determine the tangent to the surface along these lines. The second derivative was then calculated to represent the rate of change of this gradient. Since the rate of gradient change experiences a change in direction when the point of interest moves from the cone area to the surrounding healthy area, a sudden change in the sign of the rate of change in tangent gradient is indicative of an intersection with the transition zone between the pathologic area and the remaining corneal tissue, figure 1. Locating the transition zone between the area of pathology and the remaining corneal tissue using this method then allowed calculating the cone area.
Figure 1.
(a) Optimal sphere of corneal posterior surface and distances from sphere centre to multiple points on the posterior surface. Variations in radial coordinates above the optimal sphere are used to locate the cone centre and estimate its height, while the second derivatives of elevation are used to estimate the transition zone between the cone and the rest of corneal tissue. (b) Distances between corneal surface points and optimal sphere are plotted and the largest value indicates cone height and centre location.
An iterative process was then initiated in which the cone area was removed from the topography data before re-identifying the optimal sphere and repeating the subsequent steps. This process was repeated until the difference between the results (cone height and centre location) of two subsequent analyses became smaller than 1.0 µm. The process was applied separately for anterior and posterior surfaces and no comparisons between the results were carried out before the analysis was concluded.
The correlation of cone parameters (location and height of cone centre and cone area) with disease severity was explored using the correlation coefficient ‘R’ and the corresponding significance value p using bespoke Matlab code.
2.3. Statistical analysis
Data are expressed as mean, standard deviation and range. Matlab Statistics and Machine Learning Toolbox, 2019a (MathWorks, Natick, USA) were used to carry out the statistical analyses in this study. Spearman correlation analysis was used to evaluate the relationships between parameters and Quade's rank analysis of covariance was used to evaluate the effect of co-variants. Non-parametric paired test of Wilcoxon signed rank was performed to compare left and right eyes where there was no normal distribution. The probability p, which is an element of the period [0,1], was determined where values of p > 0.05 indicate the validity of the null hypothesis, otherwise, it indicates the significance of the phenomenon [31].
3. Results
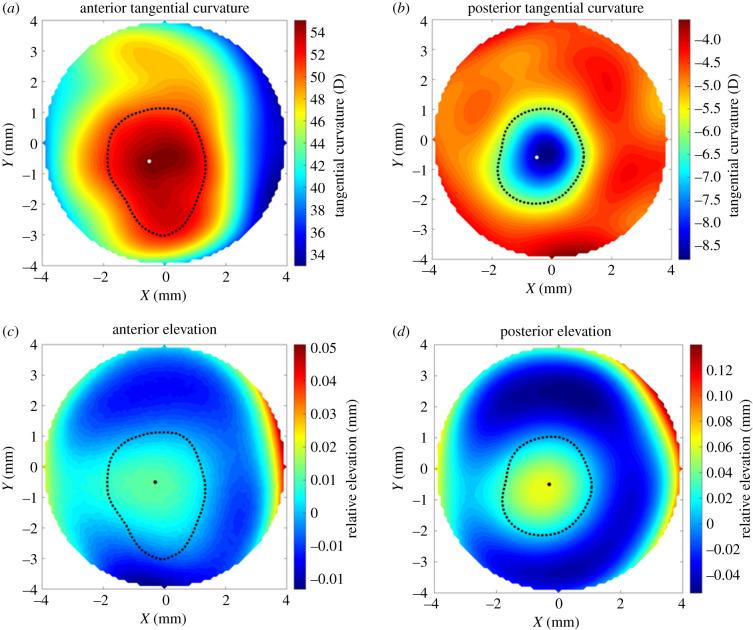
For the 309 keratoconic patients included in the study, the mean, standard deviation and range of age were 33 ± 11 years (9–72). Gender and ethnicity of patients were not recorded and therefore not included in this analysis. Among the right eyes, those with mild, moderate and severe KC were 102, 130 and 77, respectively, while the corresponding numbers for left eyes were 90, 148 and 71. For each eye, the location and normal height of the cone centre and the transition zone between the cone-shape area and the remaining corneal tissue were estimated using the proposed method. Figure 2 presents a typical example where the cone centre and transition zone (presented by a black dot and a dashed line, respectively) are plotted on corneal tangential curvature maps and standard elevation maps for both the anterior and posterior surfaces.
Figure 2.
Location of cone centre and transition zone estimated using the proposed method for the right eye of a 42-year-old patient with moderate keratoconus. The results are plotted on tangential curvature maps (a,b) and maps of elevation relative to the optimal sphere (c,d).
3.1. Cone characteristics
The results showed mirror symmetry between right and left eye groups. Whereas in right eyes, 76% and 82% of anterior and posterior cone centres were located in the temporal-inferior quadrant, respectively, the corresponding figures in left eyes were 82% and 84%. The posterior cone centre was superiorly located relative to the anterior cone centre by 0.119 ± 0.216 mm in right eyes and 0.096 ± 0.227 mm in left eyes (p = 0.070). The anterior areas of the cone in right and left eyes were also similar; with values of 7.36 ± 2.27 mm2 (0.01–12.54) and 7.21 ± 2.22 mm2 (1.13–12.54), respectively (p = 0.051). The cone centre heights were also similar in right and left eyes at 36 ± 22 um (2–107) and 37 ± 23 um (3–129), p = 0.559, in anterior surfaces and 74 ± 44 um (8–244) and 75 ± 45 um (5–243), p = 0.619, in posterior surfaces. The results further demonstrate consistently that posterior cone height was larger than anterior cone height in 90% of cases and by 37 ± 24 um (0–158) on average. On the other hand, the cone area presented was larger in the anterior surface (7.77 ± 3.07 mm2) than in the posterior surface (7.26 ± 3.92 mm2, p < 0.001)
3.2. Cone centre location
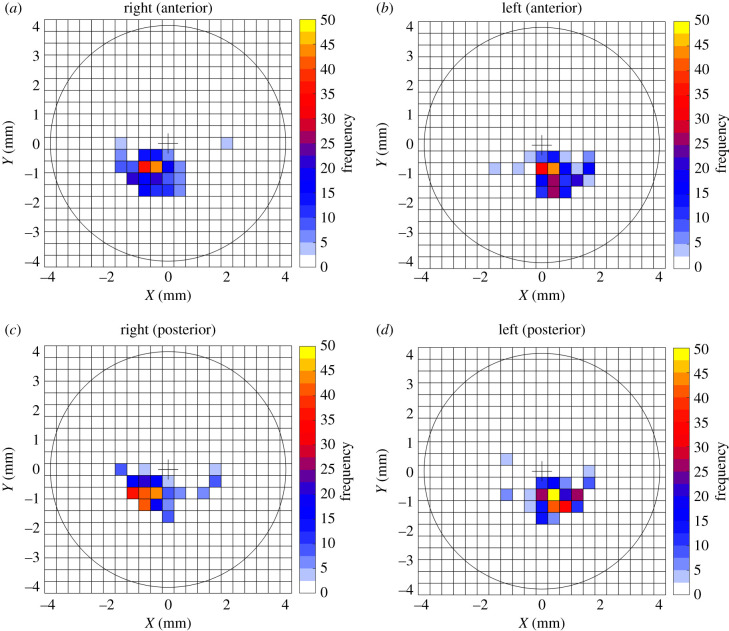
Considering only the majority of the cones, which are located in the temporal-inferior quadrant, the anterior cone centre was located at 1.019 ± 0.403 mm (0.1–1.8) on the inferior side and 0.663 ± 0.434 (0.1–1.8) mm on the temporal side of left eyes and located at 0.939 ± 0.388 (0.1–1.7) mm on the inferior side and 0.683 ± 0.424 (0.1–1.8) mm on the temporal side of right eyes. In posterior surfaces, the cone centre was located at 0.938 ± 0.344 (0.2–1.6) mm towards the inferior side and 0.610 ± 0.359 (0.1–1.4) mm towards the temporal side in left eyes and at 0.813 ± 0.345 (0.2–1.5) mm towards the inferior side and 0.734 ± 0.371 (0.1–1.5) mm towards the temporal side in right eyes, figure 3.
Figure 3.
Frequency of cone centre location in (a) anterior surfaces of right eyes, (b) anterior surfaces of left eyes, (c) posterior surfaces of right eyes and (d) posterior surfaces of left eyes.
The results further show a strong correlation between the locations of cone centres on the anterior and posterior surfaces (p < 0.001). This correlation could be used to estimate the shifts between the two cone centres using the relationships
| 3.1 |
and
| 3.2 |
where X(anterior) and Y(anterior) are the coordinates in millimetres of the anterior cone centres and X(posterior) and Y(posterior) are the corresponding coordinates of the posterior cone centres.
3.3. Correlation between cone characteristics and disease severity
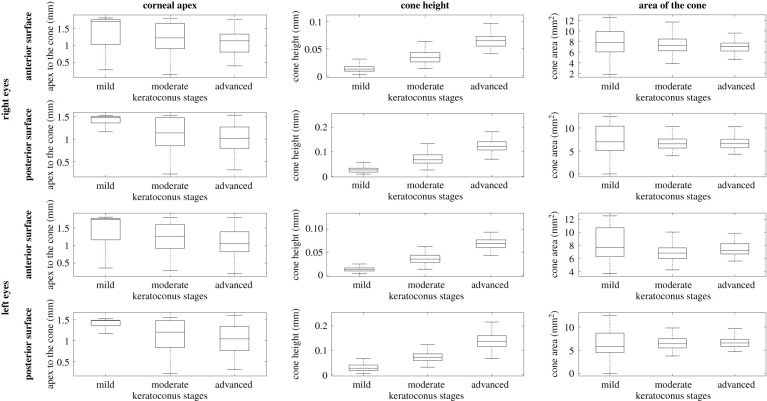
The results showed evidence that with increased disease severity, the distance from corneal apex to cone centre reduced (p < 0.001, R = −0.312), while cone height increased (p < 0.001, R = 0.716). On the other hand, the cone area did not show statistically significant differences among the disease stages (p = 0.002, R = −0.092), figure 4. Furthermore, no significant correlation was found between cone area and height in left (R = −0.087, p = 0.148) and right (R = 0.018, p = 0.769) eyes.
Figure 4.
Mean, standard deviation, minimum and maximum values of distance from cone centre to corneal apex (left column), cone height (middle column) and area of cone (right column) for eyes with mild KC (left = 90, right = 102), moderate KC (left = 148, right = 130) and advanced KC (left = 71, right = 77). Results are presented for anterior and posterior surfaces of right and left eyes.
3.4. Posterior cone height in relation to anterior cone
The results also show strong correlation between anterior cone height and posterior cone height (p < 0.001, R = 0.784 for right eyes and p < 0.001, R = 0.774 for left eyes). This strong correlation was evident when combining all the data or considering separately data for eyes with different KC severity extents, figure 5. The relationship between the two cone heights follows the relationship:
| 3.3 |
where PCH is the posterior cone height in millimetres and ACH is the anterior cone height.
Figure 5.
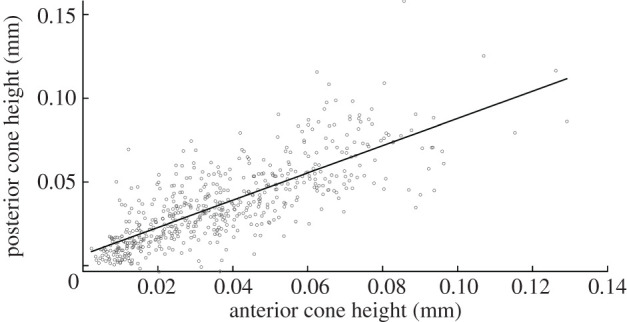
Correlation between anterior cone height and posterior cone height when considering all data.
3.5. Correlation of cone height and pathology area with radius of the optimum sphere
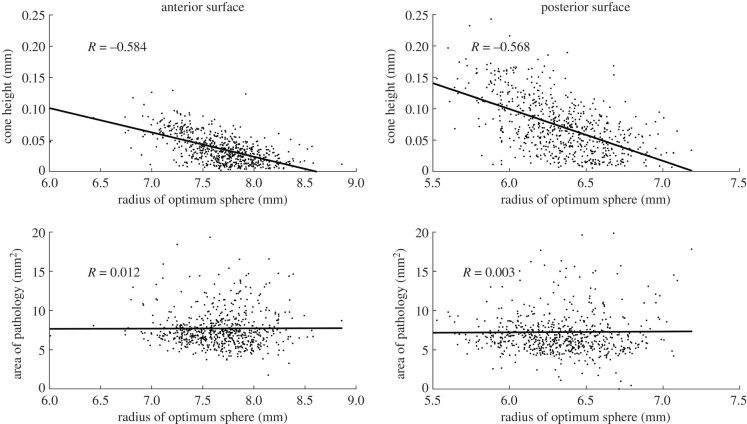
The results show significant correlation between the cone height and radius of the optimum sphere for anterior surfaces (R = −0.584, p < 0.001) and posterior surfaces (R = −0.568, p < 0.001) in all eyes. Meanwhile, there was no significant correlation between the area of pathology and the radius of the optimum sphere for both anterior surfaces (R = 0.012, p = 0.769) and posterior surfaces (R = 0.003, p = 0.945), figure 6.
Figure 6.
Correlation of cone height and pathology area with the radius of the sphere of optimal fit for both anterior and posterior surfaces.
4. Discussion
A novel method to detect the cone centre and height normal to the surface, as well as the transition zone between the area of pathology and the surrounding healthy corneal tissue in keratoconic patients, is proposed in this study. The method relies on spherical coordinates relative to the centre of the cornea's optimal sphere fit and measured normal to the surface, in order to reduce the effect of the cornea's natural curvature in determining the cone's geometric features. When applying the method to 618 eyes of 309 KC patients, more than 80% of cases had infra-temporal cones, which is intermediate between the 95% figure reported by Auffarth et al. [32] and 65% reported by Demirbas & Pflugfelder [33], but different from findings by Wilson et al. [34] where the majority of 48 eyes under study had the cone centre located in the inferior-nasal quadrant. The reason for this mismatch could be that Wilson et al. [34] used a relatively small sample that may have particular characteristics that cannot be generalized. Our results also showed significant mirror-image symmetry (enantiomorphism) between right and left eye groups in cone location, similar to what was reported by Rabinowitz & McDonnell [7] and Holland et al. [35]. As no direct comparison was made between the fellow eyes of individual subjects in this study, the disease could be more advanced in one eye than the other.
The results further showed a trend of increased cone height (R = 0.716, p < 0.001) and reduced distance from corneal apex to cone centre (R = −0.312, p < 0.001) with disease severity—this trend was significant in both anterior and posterior surfaces of right and left eyes. Cone height was also negatively correlated with the radius of the optimum fit sphere in both the anterior surfaces (R = −0.584, p < 0.001) and posterior surfaces (R = −0.568, p < 0.001).
By contrast, while having the radius of the optimal sphere as a co-variate, the cone area was not correlated with the disease stages in the anterior surface (R = 0.002, p = 0.753) and was weakly correlated in the posterior surface (R = 0.093, p = 0.003). This lack of difference may be due to the simultaneous inclusion of different cone morphologies. Perry et al. [12] described two types of cone morphologies in advanced cases: the centrally restricted cone with nipple-shaped pattern and the peripheral with more spread oval cones. As nipple cones typically have smaller areas and locate closer to corneal apex compared with oval cones in severe KC, the use of both cone height and distance of cone centre to apex as biomarkers for KC severity may be less effective, leaving only cone height as a robust biomarker [3,11,16,36,37].
There is also strong evidence that the posterior cone increased in height faster in 90% of cases than the anterior cone which was likely affected by epithelial remodelling. This finding supports the notion that the evaluation of both surfaces would be important for a reliable diagnosis [38]. The study also revealed strong correlation between the shift of the posterior cone (relative to the anterior cone) and the height of the anterior cone. This is an important finding which can be used to provide a realistic representation of cone geometry in numerical simulations of the biomechanics of keratoconic eyes. It could also help the design and optimization of corneal implants used to correct refractive errors in KC patients.
Another important earlier study by Mahmoud et al. identified the 2 mm diameter circular zone of the cornea with the steepest curvature and used it to locate the cone centre [16]. The method was initially developed for anterior surface axial and tangential curvature maps but later expanded to consider the posterior surface, surface elevation and corneal thickness maps. While this method was sensitive in separating keratoconic and normal corneas, and in locating and quantifying the alterations that occur in the central area of the disease, it was not designed to evaluate the cone shape or locate its transition zone.
The proposed method in this research is also different from the Belin/Ambrósio enhanced best-fit sphere method [39,40]. In the Belin/Ambrosio method, the height of the cone is obtained by the difference in Z coordinate between the cornea and the BFS obtained after excluding a fixed area around the thinnest point. In the method presented in this study, the height is obtained by the radial differences between the cornea and the optimal sphere, calculated normal to the surface, obtained in an iterative process to exclude the pathologic area specific for each case. Another characteristic of the proposed method is that by using radial distances, the method is expected to be less affected by the natural curved shape of the eye.
With numerical simulations being extensively used in ophthalmology, the findings of this study could be valuable for future research. Numerical models require geometric information to be able to perform simulations and provide reliable results. To model eyes with KC, the availability of the information provided in this paper would enable modelling of corneal geometry, including the representation of the pathologic area which could then be simulated as softer than the surrounding area. The proposed method can also be used on data provided by different corneal topographers to identify the cone location, height and transition zone. This should enable researchers to develop computer programs based on this logic and analyse mass information in a customized manner using only the elevation data of the anterior and posterior cornea. In addition, in the era of artificial intelligence (AI), access to large datasets is crucial for machine learning purposes. One problem with data collection is that information provided by different devices often cannot be used due to variations in data format [11,41]. This method bridges this gap and enables consistent use of raw elevation data allowing multi-device data collection that can be fed into AI algorithms. This would help in the process of clinical decision making. With this advancement, AI algorithms would be able to help diagnose KC and with treatment planning by, for example, increasing the accuracy of contact lens fitting of patients with abnormal corneas and helping in ring segment surgery by improving ring size selection and defining its placement position.
One limitation of the study was the reliance on only keratoconic topography data in the analysis and hence the lack of comparison to normal, healthy eyes. This was done as the method was intended not for disease detection, but to support the management of KC.
In conclusion, this study proposed a new method to explore the changes in anterior and posterior corneal surfaces in patients with KC and to define the cone-shaped area. The method is intended to help improve understanding of corneal shape as KC progresses and customize treatment regimens such as collagen cross-linking and intracorneal ring implantation.
Data accessibility
This article has no additional data.
Authors' contributions
A. Eliasy: writing original draft, editing, conceptualization, formal analysis, methodology, software, validation and visualization. A.A.: writing original draft, review, conceptualization, formal analysis, methodology, software, validation, visualization and supervision. B.T.L.: writing original draft, conceptualization, software, validation and visualization. R.V.: review, editing and data curation. H.Z.: review, formal analysis, validation and visualization. P.V.: review, editing and data curation. R.A.: review and editing. C.J.R.: review, editing, conceptualization, investigation & methodology. A. Elsheikh: writing original draft, review, funding acquisition, investigation, methodology, project administration, resources and supervision.
Competing interests
We declare we have no competing interests.
Funding
This study has received funding from the European Union's Horizon 2020 research and innovation programme Horizon 2020 IMCUSTOMEYE project under grant agreement ID 779960
Financial disclosure(s)
R.A., P.V., R.V., C.J.R. and A. Elsheikh are consultants for OCULUS Optikgeräte GmbH. A. Elsheikh and B.L. have received research funding from OCULUS Optikgeräte GmbH. None of the remaining authors has financial disclosures.
References
- 1.Appelbaum A. 1936. Keratoconus. Arch. Ophthalmol. 15, 900–921. ( 10.1001/archopht.1936.00840170112011) [DOI] [Google Scholar]
- 2.Bron AJ. 1988. Keratoconus. Cornea 7, 163–169. [PubMed] [Google Scholar]
- 3.Krachmer JH, Feder RS, Belin MW. 1984. Keratoconus and related noninflammatory corneal thinning disorders. Surv. Ophthalmol. 28, 293–322. ( 10.1016/0039-6257(84)90094-8) [DOI] [PubMed] [Google Scholar]
- 4.Rabinowitz YS. 1998. Keratoconus. Surv. Ophthalmol. 42, 297–319. ( 10.1016/S0039-6257(97)00119-7) [DOI] [PubMed] [Google Scholar]
- 5.Efron N, Hollingsworth JG. 2008. New perspectives on keratoconus as revealed by corneal confocal microscopy. Clin. Exp. Optom. 91, 34–55. ( 10.1111/j.1444-0938.2007.00195.x) [DOI] [PubMed] [Google Scholar]
- 6.Nejabat M, Khalili MR, Dehghani C. 2012. Cone location and correction of keratoconus with rigid gas-permeable contact lenses. Contact Lens Anterior Eye 35, 17–21. ( 10.1016/j.clae.2011.08.007) [DOI] [PubMed] [Google Scholar]
- 7.Rabinowitz YS, McDonnell PJ. 1989. Computer-assisted corneal topography in keratoconus. J. Refract. Surg. 5, 400–408. [PubMed] [Google Scholar]
- 8.Klyce SD. 1995. Information fidelity in corneal topography. Br. J. Ophthalmol. 79, 791–792. ( 10.1136/bjo.79.9.791) [DOI] [PMC free article] [PubMed] [Google Scholar]
- 9.Lebow KA, Grohe RM. 1999. Differentiating contact lens induced warpage from true keratoconus using corneal topography. CLAO J. 25, 114–122. [PubMed] [Google Scholar]
- 10.Maguire LJ, Bourne WM. 1989. Corneal topography of early keratoconus. Am. J. Ophthalmol. 108, 107–112. ( 10.1016/0002-9394(89)90001-9) [DOI] [PubMed] [Google Scholar]
- 11.Maeda N, Klyce SD, Smolek MK. 1995. Neural network classification of corneal topography. Preliminary demonstration. Invest. Ophthalmol. Vis. Sci. 36, 1327–1335. [PubMed] [Google Scholar]
- 12.Perry HD, Buxton JN, Fine BS. 1980. Round and oval cones in keratoconus. Ophthalmology 87, 905–909. ( 10.1016/S0161-6420(80)35145-2) [DOI] [PubMed] [Google Scholar]
- 13.Seiler TG, Fischinger I, Koller T, Zapp D, Frueh BE, Seiler T. 2016. Customized corneal cross-linking: one-year results. Am. J. Ophthalmol. 166, 14–21. ( 10.1016/j.ajo.2016.02.029) [DOI] [PubMed] [Google Scholar]
- 14.Scarcelli G, Besner S, Pineda R, Yun SH. 2014. Biomechanical characterization of keratoconus corneas ex vivo with Brillouin microscopy. Invest. Ophthalmol. Vis. Sci. 55, 4490–4495. ( 10.1167/iovs.14-14450) [DOI] [PMC free article] [PubMed] [Google Scholar]
- 15.Dauwe C, Touboul D, Roberts CJ, Mahmoud AM, Kerautret J, Fournier P, Malecaze F, Colin J. 2009. Biomechanical and morphological corneal response to placement of intrastromal corneal ring segments for keratoconus. J. Cataract. Refract. Surg. 35, 1761–1767. ( 10.1016/j.jcrs.2009.05.033) [DOI] [PubMed] [Google Scholar]
- 16.Mahmoud AM, et al. 2008. CLMI: the cone location and magnitude index. Cornea 27, 480–487. ( 10.1097/ICO.0b013e31816485d3) [DOI] [PMC free article] [PubMed] [Google Scholar]
- 17.Vega-Estrada A, Alio JL. 2016. The use of intracorneal ring segments in keratoconus. Eye Vis. (Lond). 3, 8 ( 10.1186/s40662-016-0040-z) [DOI] [PMC free article] [PubMed] [Google Scholar]
- 18.Shetty R, Matalia H, Srivatsa P, Ghosh A, Dupps WJ Jr, Sinha Roy A. 2015. A novel Zernike application to differentiate between three-dimensional corneal thickness of normal corneas and corneas with keratoconus. Am. J. Ophthalmol. 160, 453–462. ( 10.1016/j.ajo.2015.06.001) [DOI] [PMC free article] [PubMed] [Google Scholar]
- 19.Abass A, Clamp J, Bao F, Ambrosio R Jr, Elsheikh A. 2018. Non-Orthogonal corneal astigmatism among normal and keratoconic Brazilian and Chinese populations. Curr. Eye Res. 43, 717–724. ( 10.1080/02713683.2018.1433858) [DOI] [PubMed] [Google Scholar]
- 20.Khurana AK. 2008. Theory and practice of optics and refraction, 3rd edn India: Elsevier India Pvt. Limited. [Google Scholar]
- 21.Lopes BT, Ramos IC, Dawson DG, Belin MW, Ambrosio R Jr. 2016. Detection of ectatic corneal diseases based on pentacam. Z. Med. Phys. 26, 136–142. ( 10.1016/j.zemedi.2015.11.001) [DOI] [PubMed] [Google Scholar]
- 22.Mahmoud AM, et al. 2013. Expanding the cone location and magnitude index to include corneal thickness and posterior surface information for the detection of keratoconus. Am. J. Ophthalmol. 156, 1102–1111. ( 10.1016/j.ajo.2013.07.018) [DOI] [PubMed] [Google Scholar]
- 23.Polian A. 2003. Brillouin spectroscopy uses the scattering of light for the determination of materials elasticity. J. Raman Spectrosc. 34, 633–637. ( 10.1002/jrs.1031) [DOI] [Google Scholar]
- 24.Seiler TG, Shao P, Eltony A, Seiler T, Yun SH. 2019. Brillouin spectroscopy of normal and keratoconus corneas. Am. J. Ophthalmol. 202, 118–125. ( 10.1016/j.ajo.2019.02.010) [DOI] [PMC free article] [PubMed] [Google Scholar]
- 25.Schwiegerling J. 1997. Cone dimensions in keratoconus using Zernike polynomials. Optom. Vis. Sci. 74, 963–969. ( 10.1097/00006324-199711000-00029) [DOI] [PubMed] [Google Scholar]
- 26.Vinciguerra R, Ambrosio R Jr, Elsheikh A, Roberts CJ, Lopes B, Morenghi E, Azzolini C, Vinciguerra P. 2016. Detection of keratoconus with a new biomechanical index. J. Refract. Surg. 32, 803–810. ( 10.3928/1081597X-20160629-01) [DOI] [PubMed] [Google Scholar]
- 27.Ambrosio R Jr, Lopes BT, Faria-Correia F, Salomao MQ, Buhren J, Roberts CJ, Elsheikh A, Vinciguerra R, Vinciguerra P. 2017. Integration of Scheimpflug-based corneal tomography and biomechanical assessments for enhancing ectasia detection. J. Refract. Surg. 33, 434–443. ( 10.3928/1081597X-20170426-02) [DOI] [PubMed] [Google Scholar]
- 28.Belin MW, Khachikian SS. 2009. An introduction to understanding elevation-based topography: how elevation data are displayed — a review. Clin. Experiment. Ophthalmol. 37, 14–29. ( 10.1111/j.1442-9071.2008.01821.x) [DOI] [PubMed] [Google Scholar]
- 29.Goebels S, Eppig T, Wagenpfeil S, Cayless A, Seitz B, Langenbucher A. 2015. Staging of keratoconus indices regarding tomography, topography, and biomechanical measurements. Am. J. Ophthalmol. 159, 733–738. ( 10.1016/j.ajo.2015.01.014) [DOI] [PubMed] [Google Scholar]
- 30.Renka RJ, Renka RL, Cline AK. 1984. A triangle-based C¹ interpolation method. Rocky Mt J. Math. 14, 223–237. ( 10.1216/RMJ-1984-14-1-223) [DOI] [Google Scholar]
- 31.Everitt BS, Skrondal A. 2010. The cambridge dictionary of statistics, 4th edn Cambridge, UK: Cambridge University Press. [Google Scholar]
- 32.Auffarth GU, Wang L, Volcker HE. 2000. Keratoconus evaluation using the Orbscan topography system. J. Cataract. Refract. Surg. 26, 222–228. ( 10.1016/S0886-3350(99)00355-7) [DOI] [PubMed] [Google Scholar]
- 33.Demirbas NH, Pflugfelder SC. 1998. Topographic pattern and apex location of keratoconus on elevation topography maps. Cornea 17, 476–484. ( 10.1097/00003226-199809000-00004) [DOI] [PubMed] [Google Scholar]
- 34.Wilson SE, Lin DT, Klyce SD. 1991. Corneal topography of keratoconus. Cornea 10, 2–8. ( 10.1097/00003226-199101000-00002) [DOI] [PubMed] [Google Scholar]
- 35.Holland DR, Maeda N, Hannush SB, Riveroll LH, Green MT, Klyce SD, Wilson SE. 1997. Unilateral keratoconus: incidence and quantitative topographic analysis. Ophthalmology 104, 1409–1413. ( 10.1016/S0161-6420(97)30123-7) [DOI] [PubMed] [Google Scholar]
- 36.Twa MD, Nichols JJ, Joslin CE, Kollbaum PS, Edrington TB, Bullimore MA, Mitchell GL, Cruickshanks KJ, Schanzlin DJ. 2004. Characteristics of corneal ectasia after LASIK for myopia. Cornea 23, 447–457. ( 10.1097/01.ico.0000122702.49054.12) [DOI] [PubMed] [Google Scholar]
- 37.Wilson SE, Klyce SD. 1994. Screening for corneal topographic abnormalities before refractive surgery. Ophthalmology 101, 147–152. ( 10.1016/S0161-6420(94)31372-8) [DOI] [PubMed] [Google Scholar]
- 38.Gomes JA, et al. 2015. Global consensus on keratoconus and ectatic diseases. Cornea 34, 359–369. ( 10.1097/ICO.0000000000000408) [DOI] [PubMed] [Google Scholar]
- 39.Belin MW, Khachikian SS. 2007. Keratoconus/ectasia detection with the oculus pentacam: Belin/Ambrósio enhanced ectasia display. Highlights Ophthalmol. 35, 5–12. [Google Scholar]
- 40.Luz A, Lopes B, Hallahan KM, Valbon B, Ramos I, Faria-Correia F, Schor P, Dupps WJ, Ambrósio R. 2016. Enhanced combined tomography and biomechanics data for distinguishing forme fruste keratoconus. J. Refract. Surg. 32, 479–494. ( 10.3928/1081597X-20160502-02) [DOI] [PMC free article] [PubMed] [Google Scholar]
- 41.Smolek MK, Klyce SD. 2001. Screening of prior refractive surgery by a wavelet-based neural network. J. Cataract Refract. Surg. 27, 1926–1931. ( 10.1016/S0886-3350(01)01182-8) [DOI] [PubMed] [Google Scholar]
Associated Data
This section collects any data citations, data availability statements, or supplementary materials included in this article.
Data Availability Statement
This article has no additional data.


