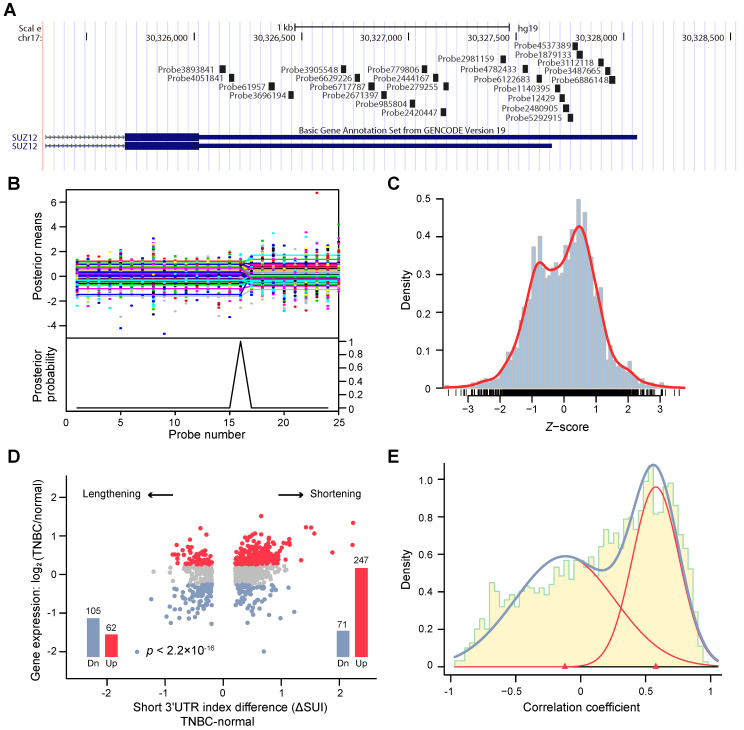
Figure 1.
Bayesian change point (BCP) approach for alternative polyadenylation (APA) analysis of transcriptome array data. (A) Mapping of Human Transcriptome Array 2.0 probes to the SUZ12 3′UTR. (B) BCP analysis results. The upper panel represents the input probe intensities (dots) and posterior probe mean intensities (lines) for all samples. The lower panel reveals the probabilities of the posterior change point. (C) The histogram represents the distribution of the z-score of the short 3′UTR index (SUI) and the red line is the estimated density. (D) The fold-changes in expression between TNBC and normal adjacent tumor tissues are plotted against the ΔSUI values. The genes significantly up- and down-regulated in TNBC are shown in red and blue, respectively. The red and blue bars indicate the number of up- and down-regulated genes, respectively. (E) The correlation coefficient between 3′UTR shortening and gene expression follows a bimodal distribution. The histogram represents the distribution of the correlation coefficient and the estimated densities are shown for individual (red line) and combined (blue line) distributions. Abbreviations: 3′UTR, 3′ untranslated region; APA, alternative polyadenylation; BCP, Bayesian change point; HTA, human transcriptome array; SUI, short 3′UTR index.

