Abstract
Purpose
Pneumonia is a common clinical diagnosis for which chest radiographs are often an important part of the diagnostic workup. Deep learning has the potential to expedite and improve the clinical interpretation of chest radiographs. While earlier approaches have emphasized the feasibility of “binary classification” to accomplish this task, alternative strategies may be possible. We explore the feasibility of a “semantic segmentation” deep learning approach to highlight potential foci of pneumonia on frontal chest radiographs.
Materials and Methods
In this retrospective study, we train a U-net convolutional neural network (CNN) to predict pixel-wise probability maps for pneumonia using a public data set provided by the Radiological Society of North America (RSNA) comprised of 22,000 radiographs and radiologist-defined bounding boxes. We reserved 3,684 radiographs as an independent validation data set and assessed overall performance for localization using Dice overlap and classification performance using the area under the receiver-operator characteristic curve (AUC).
Results
For classification/detection of pneumonia, AUC on frontal radiographs was 0.854 with a sensitivity of 82.8% and specificity of 72.6%. Using this strategy of neural network training, probability maps localized pneumonia to lung parenchyma for essentially all validation cases. For segmentation of pneumonia for positive cases, predicted probability maps had a mean Dice score (+/−SD) of 0.603 +/− 0.204 and 60.0% of these had Dice score greater than 0.5.
Conclusion
A “semantic segmentation” deep learning approach can provide a probabilistic map to assist in the diagnosis of pneumonia. In combination with the patient’s history, clinical findings and other imaging, this strategy may help expedite and improve diagnosis.
Purpose
Pneumonia is a commonly encountered clinical entity with a prevalence of 10–65% among hospitalized patients. It is not only responsible for 257,000 emergency room visits per year, but also the cause of nearly 50,000 deaths in the US annually1–3. Chest radiographs are often part of the initial diagnostic workup of pneumonia and are used to monitor progression or resolution2. Pneumonia is one of many indications for the roughly 2 billion chest radiographs performed annually in the US4. Due to these large study volumes, computer-automated diagnostic tools are increasingly being developed to assist in diagnostic interpretation5.
Convolutional neural networks (CNNs) are a recent form of machine learning (ML) that have reinvigorated interest in development of algorithms for chest radiography. In contrast to historical ML approaches, CNNs can learn structural features of an image or volume without being explicitly programmed. This makes it considerably easier to build CNNs capable of performing a variety of tasks, including image-wide classification, object detection, and segmentation6.
Much of recent research in chest radiography utilize a large, 112,000 public frontal database of chest radiographs7–9. This database includes an associated ontology-based text image-wide classification covering 14 common radiographic findings/pathologies. Because of the nature of these labels, sometimes referred to as “weak” labels, many groups have explored the use of “classification” networks to perform image-based diagnosis. While these approaches show promise in their ability to classify radiographic findings; one of challenges has been the uncertainty on how these methods arrive at their final categorization8,10,11. One potential strategy has been to use “saliency maps” or maps of neural network activation to reveal areas of the image important in arriving at the “diagnosis”. Because these classification CNNs are not explicitly directed to the pathology of interest, often these saliency maps are unreliable and may highlight parts of the image unrelated to the diagnosis. Without visualizing where an algorithm focuses on a radiograph, it may be difficult to resolve inconsistencies or disagreements between machine and radiologist interpretation of a chest radiograph.
We therefore sought to explore a novel approach using a new strategy of “semantic segmentation” for radiographic diagnosis, which inherently provides algorithm transparency. With this strategy, the CNN makes pixel-level decisions to produce a probability map for the presence or absence of pneumonia. This strategy is analogous to what has been used for segmentation and quantitative measurements of structures like the heart12, brain lesions13, pulmonary nodules14, and liver15. We hypothesize that this semantic segmentation approach may be just as effective as the “classification” strategy, while also providing a probability map to display the pixel-wise likelihood of pneumonia.
Materials and Methods
Data Sources and Patient Demographics
We utilize a database of publicly available frontal chest radiographs with bounding boxes representing pneumonia annotated by radiologists, released as part of the 2018 RSNA pneumonia challenge16. The radiographs in this data set are a subset of a larger 112,120 NIH frontal chest radiograph database7 where each radiographs were assigned findings/diagnoses from 14 categories based on radiologist text reports, including atelectasis, cardiomegaly, effusion, infiltration, mass, nodule, pneumonia, pneumothorax, consolidation, edema, emphysema, fibrosis, pleural thickening, and hernia. The RSNA pneumonia challenge included 25,684 chest radiographs spanning the range of pathologies from this data set, distributed as DICOM images. No additional exclusion criteria were applied for the current study.
Each radiograph in the public data set was distributed with a spatial resolution of 1024×1024 pixels and 8-bit pixel depth. Patient demographics are the following: 56.8% male; ages 1–93 years; 45.6% anterior-posterior (AP) and 54.4% posterior-anterior (PA) projections. Twenty-two percent of radiographs were assigned as positive for pneumonia, 33.2% were normal radiographs, and the remaining 44.8% were diagnosed as abnormal but did not have pneumonia. These characteristics are presented in Table 1.
Table 1: Data used to train and evaluate the pneumonia segmentation model.
Convolutional neural networks were trained on publically-available frontal chest radiographs and radiologist-defined bounding boxes demarcating areas of lung parenchyma associated with pneumonia. 22,000 radiographs were used for model training and the remaining were reserved to evaluate performance.
| Total | Training | Validation | |
|---|---|---|---|
| N (%) | 25,684 | 22,000 (85.6%) | 3,684 (14.4%) |
| % Male | 56.8% | 56.6% | 57.9% |
| Mean Age, years (range) | 47 (1–92) | 47 (1–92) | 46.9 (3–91) |
| % AP | 45.6% | 45.4% | 46.7% |
| N (%) Pneumonia | 5,656 (22.0) | 4,796 (21.8) | 860 (23.3) |
| N (%) Abnormal, not Pneumonia | 11,512 (44.8) | 9,878 (44.8) | 1,634 (44.4) |
| N (%) Normal | 8,516 (33.2) | 7,326 (33.3) | 1,190 (32.3) |
Data and Pre-processing
Radiographs and radiologist-defined bounding box annotations of pneumonia from this public data were preprocessed into probability maps. This additional step was devised to synthesize training data for the “semantic segmentation” strategy. First, to reduce computational complexity, chest radiographs were spatially down-sampled to 256×256 pixels. For radiographs annotated with bounding boxes, box coordinates were used to create ellipsoid probability masks of identical width, height and location. This conversion from a bounding box to an elliptical map was utilized to reduce highlighting of extra-thoracic structures that were otherwise contained in the original rectangular bounding boxes. For radiographs without pneumonia bounding boxes, a null binary probability map was created.
The data set was randomly divided into two groups -- 22,000 (85.6%) radiographs were utilized for training and the remaining 3,684 (14.4%) radiographs reserved for validation. Validation radiographs were kept independent from training data and were used solely to benchmark and evaluate neural network performance.
Model Structure and Training
A U-net17 was trained using the synthetic probability maps to predict the pixel-wise likelihood of pneumonia on each frontal chest radiograph (Figure 1). Predictions are represented by a pneumonia probability map with dimensions identical to the input image and output pixel values between 0 and 1. Neural network weights were initialized randomly between 0 and 1 using a uniform distribution. No pretraining or transfer learning was utilized. No image augmentation was utilized.
Figure 1: Probabilistic view of pneumonia.

Probabilistic view of pneumonia. A U-net convolutional neural network is trained to take a chest radiograph as an input and generate a probability map for the likelihood of pneumonia at each pixel in the radiograph. This is rendered as a color image overlay to help guide interpretation. By establishing a probability threshold, these maps can be collapsed to a binary classification for the absence/presence of pneumonia.
Training was performed using batch size of 8 and weighted binary cross-entropy loss function17. Pixels with pneumonia were assigned 10-fold weighting and positive cases of pneumonia were assigned 30-fold weighting. Model training over this loss function was optimized using the “ADAM” back-propagation method with an initial learning rate of 0.0001. One epoch was defined as the interval when all 22,000 radiographs have been used to update the network. We used a dynamic learning rate, decreasing by a factor of five when the validation loss failed to decrease for three consecutive epochs; overall training was terminated once validation loss failed to decrease for six epochs. Using this training strategy, the CNN trained for a total of 43 epochs.
The U-Net CNN was implemented and trained in Python (version 3.5; Python Software Foundation, Wilmington, DE) using Keras 2.2 and Tensorflow 1.8 on a GPU workstation running Ubuntu 16.04, equipped with a Titan X graphics card (NVIDIA, Mountain View, CA). Model training and algorithm development was executed by the primary author, a radiology research resident.
Probability map post-processing
In order to arrive at patient-level binary classifications of “pneumonia” and “no pneumonia”, probability maps were post-processed using a fully automated strategy. First, we automatically isolated discrete regions of pneumonia from the probability map using an Otsu-thresholding technique18 and calculated each region’s mean probability and a rectangular bounding box encompassing the predicted pathology. The overall radiographic classification was determined by comparing the region with the highest predicted mean pneumonia probability to a minimum operating probability threshold.
Model Evaluation & Statistical Analysis
First, to evaluate accuracy of localization, we examined all 860 of the 3,684 radiographs in the validation cohort with ground truth labels of pneumonia. For these cases, Dice and Intersection over Union (IoU) scores were computed to compare the overlap between radiologist-annotation and the predicted probability map. Dice and IoU metrics are standard metrics used to describe the degree of overlap between two discrete objects in an image with values ranging between 0 (none) and 1 (perfect). These values were computed for predictions against the elliptical ground truth as well as the rectangular bounding box predictions against the public dataset’s rectangular annotations for comparison. For elliptical annotations we grouped cases according to Dice scores of high overlap (0.5< Dice <1.0), low overlap (0.0 < Dice <0.5), and no overlap (Dice=0).
Second, to evaluate whole-radiograph classification performance, we examined the entire validation cohort of 3,684 radiographs by computing receiver operator characteristic (ROC) curves and areas under the curve (AUC). ROC curves were created by adjusting the regional mean probability threshold for classifying the radiograph as “positive” for pneumonia. An optimal operating point was also chosen to maximize the sensitivity and specificity equally, known as Youden’s J-index19. Sub-analyses were performed to assess performance using (a) the entire validation cohort, (b) pneumonia versus normal, excluding films labeled as abnormal but not pneumonia in the public data set, and (c) pneumonia versus abnormal findings, excluding normal chest radiographs.
Visualization
Finally, to further examine the performance of the neural network, we rendered probability maps superimposed on input chest radiographs to assess the performance of this approach for individual representative cases. Probability maps were alpha blended with maximum of 80% opacity for probability values of 100% and full transparency for probability values of less than 5%. Cases were divided into characteristic groups, highlighted in table 2, based on if there was agreement between prediction and radiologist annotation. Concordance was defined as agreement between the CNN and the ground truth label; Discordance was defined as a disagreement between the CNN and the ground truth label.
Table 2: Classification definitions between predictions and data set.
Each classification prediction made is evaluated against its “ground truth” label. Cases which agree are considered “concordant” and cases which disagree are considered “discordant.” This deviates from classical nomenclature of true/false positive/negative because of some uncertainty of pneumonia diagnosis in the training and test data set.
| Prediction | “Ground truth” label | |
|---|---|---|
| Concordant Positives | Pneumonia | Pneumonia |
| Concordant Negatives | No pneumonia | No pneumonia |
| Discordant Positives | Pneumonia | No pneumonia |
| Discordant Negatives | No pneumonia | Pneumonia |
Results
Localization Performance
The performance of the CNN was evaluated on 3,684 chest radiographs held out for analysis, including 860 cases with ground truth labels of pneumonia. Performance characteristics of the algorithm are shown in Figure 2. The overall mean and standard deviation of Dice and IoU scores for predicted regions compared to the elliptical radiologist annotations were 0.603 +/− 0.204 and 0.461 +/− 0.205, respectively; The overall mean and standard deviation of Dice and IoU scores against the rectangular radiologist annotations were 0.553 +/− 0.259 and 0.417 +/− 0.229, respectively. For 60.0% of radiographs, there was high overlap (Dice >0.5). For 22.3% of radiographs, there was low overlap (Dice >0 and <0.5). For 0.5% of radiographs, there was no overlap (Dice = 0). The remaining 17.2% cases did not achieve the Youden J-index threshold (calculated to be 0.08) to be classified as pneumonia. Representative case examples are highlighted in figure 3.
Figure 2: Localization performance of U-Net segmentation for pneumonia detection at the optimal operating threshold.
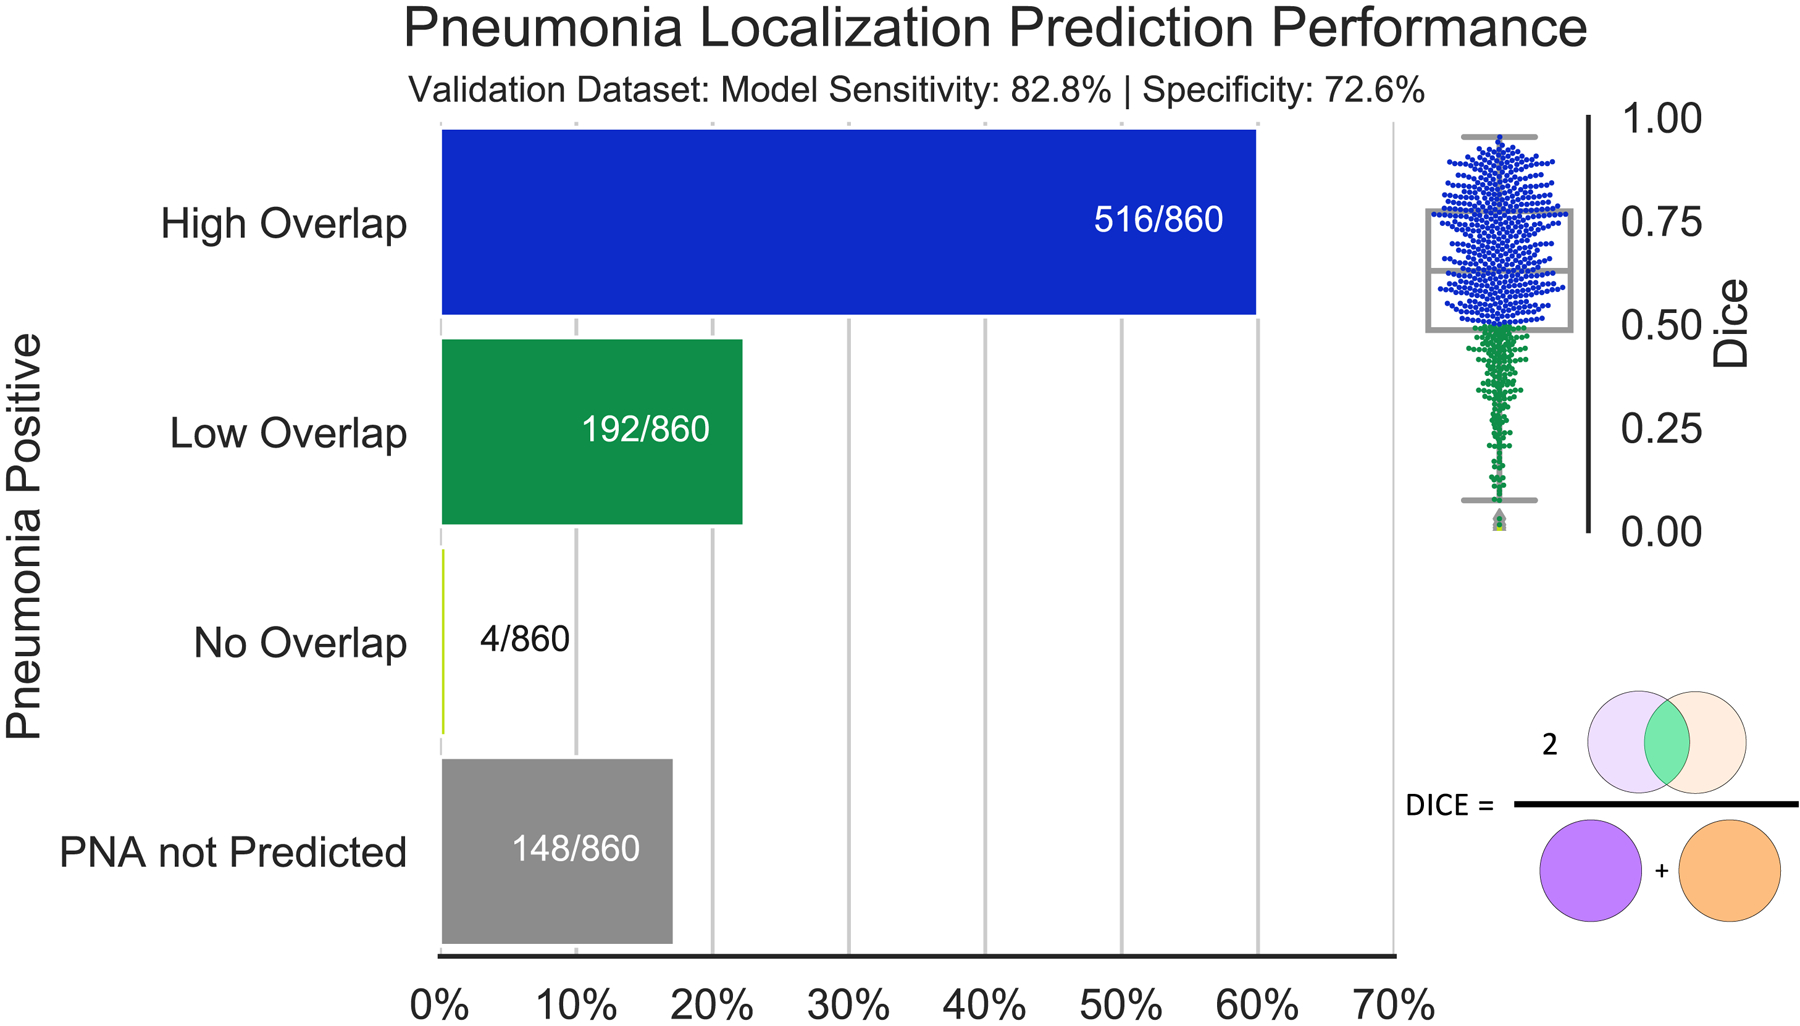
Dice scores (0=no overlap; 1=perfect overlap) are shown in the box & whisker/feather plot on the upper right. 60.0% of pneumonia-positive radiographs have dice scores between 0.5 and 1 which are considered high overlap. 22.3% have dice scores between 0 and 0.5, and 0.5% have dice scores of 0 corresponding to a positive pneumonia prediction but no localization overlap with radiologist annotations. Finally, 17.2% of the radiographs assigned pneumonia were not predicted as such.
Figure 3: Example predictions of probability maps for pneumonia.
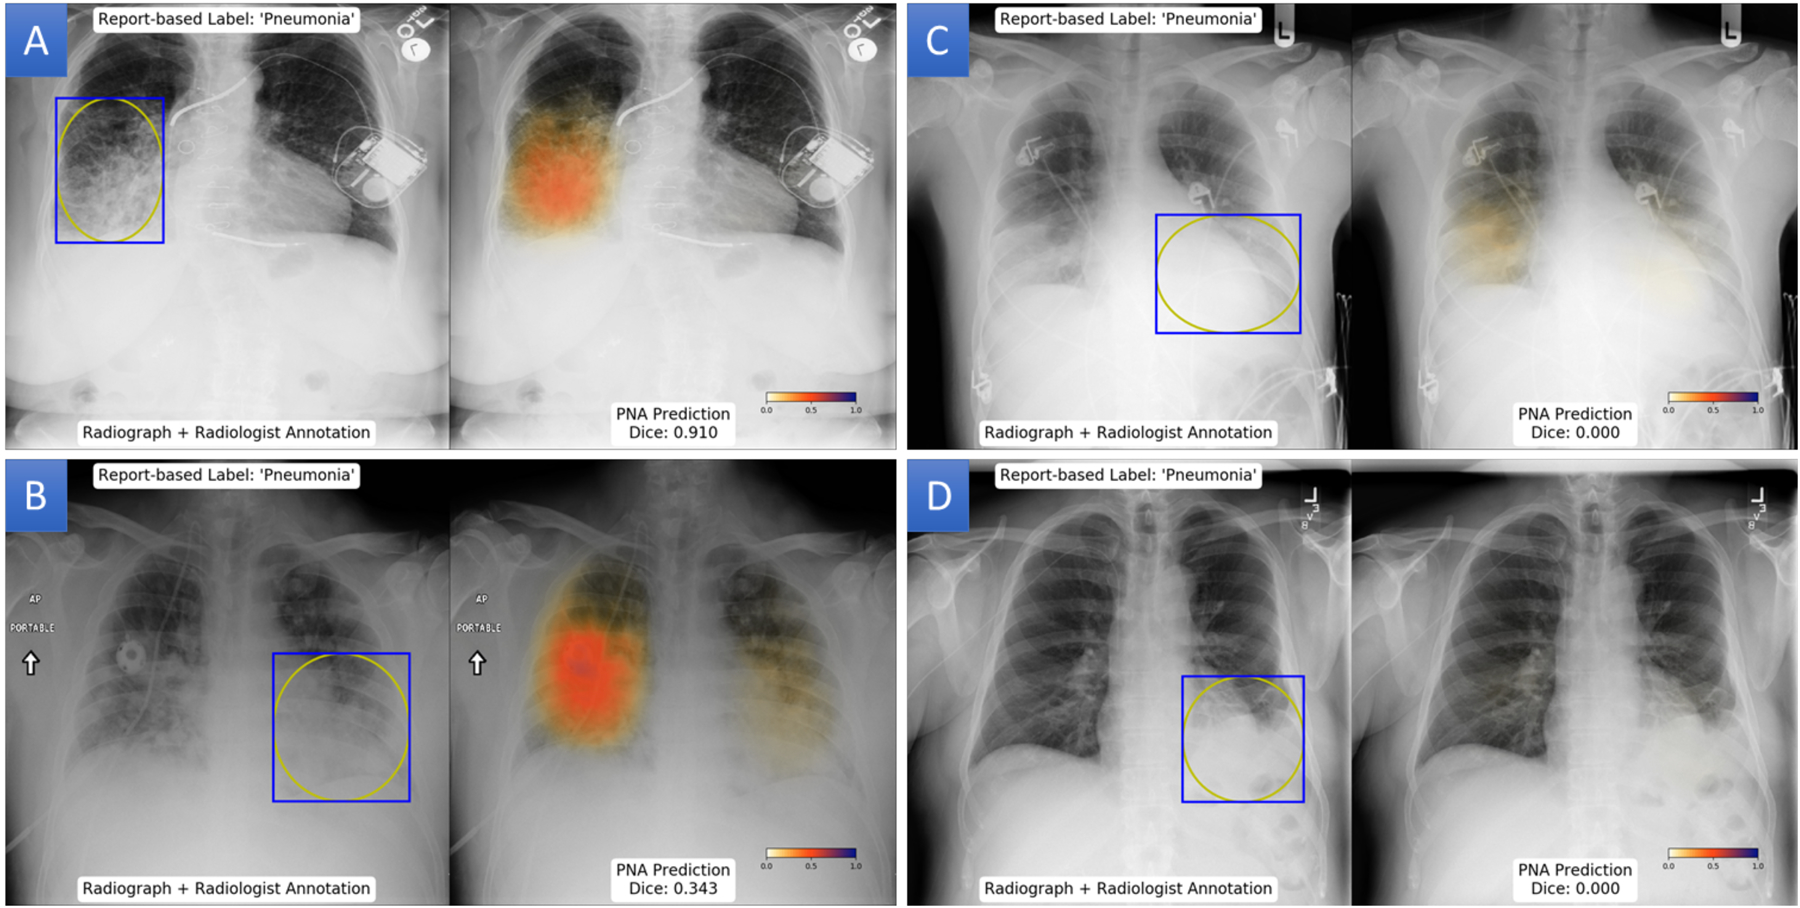
(A) Patient with a highly overlap between the pneumonia probability map and radiologist annotation with a Dice score of 0.91. (B) Left lower lung pneumonia in patient has a Dice score of 0.343 due to prediction of pneumonia in the contralateral lower lobe. (C) Discordant localization of pneumonia in the right lung, leading to a dice score of 0. (D) Left basilar opacity annotated as pneumonia, but pneumonia is not predicted in any region of the radiograph.
Classification Performance
Classification performance of the neural network was assessed using the entire validation cohort of 3,684 radiographs. Overall AUC for the CNN was 0.854. At the optimal operating point (Youden J-index threshold), this corresponded to an accuracy of 81.6%, sensitivity of 82.8%, specificity of 72.6%, positive predictive value of 47.9%, and negative predictive value of 93.3%. When abnormal non-pneumonia chest radiographs were excluded, performance increase to an AUC of 0.944. When normal chest radiographs were excluded, AUC declined to 0.788. ROC curves for each of these three analyses are illustrated in Figure 4.
Figure 4: Receiver-operator characteristic (ROC) curve for the performance of U-Net segmentation for detection of pneumonia.
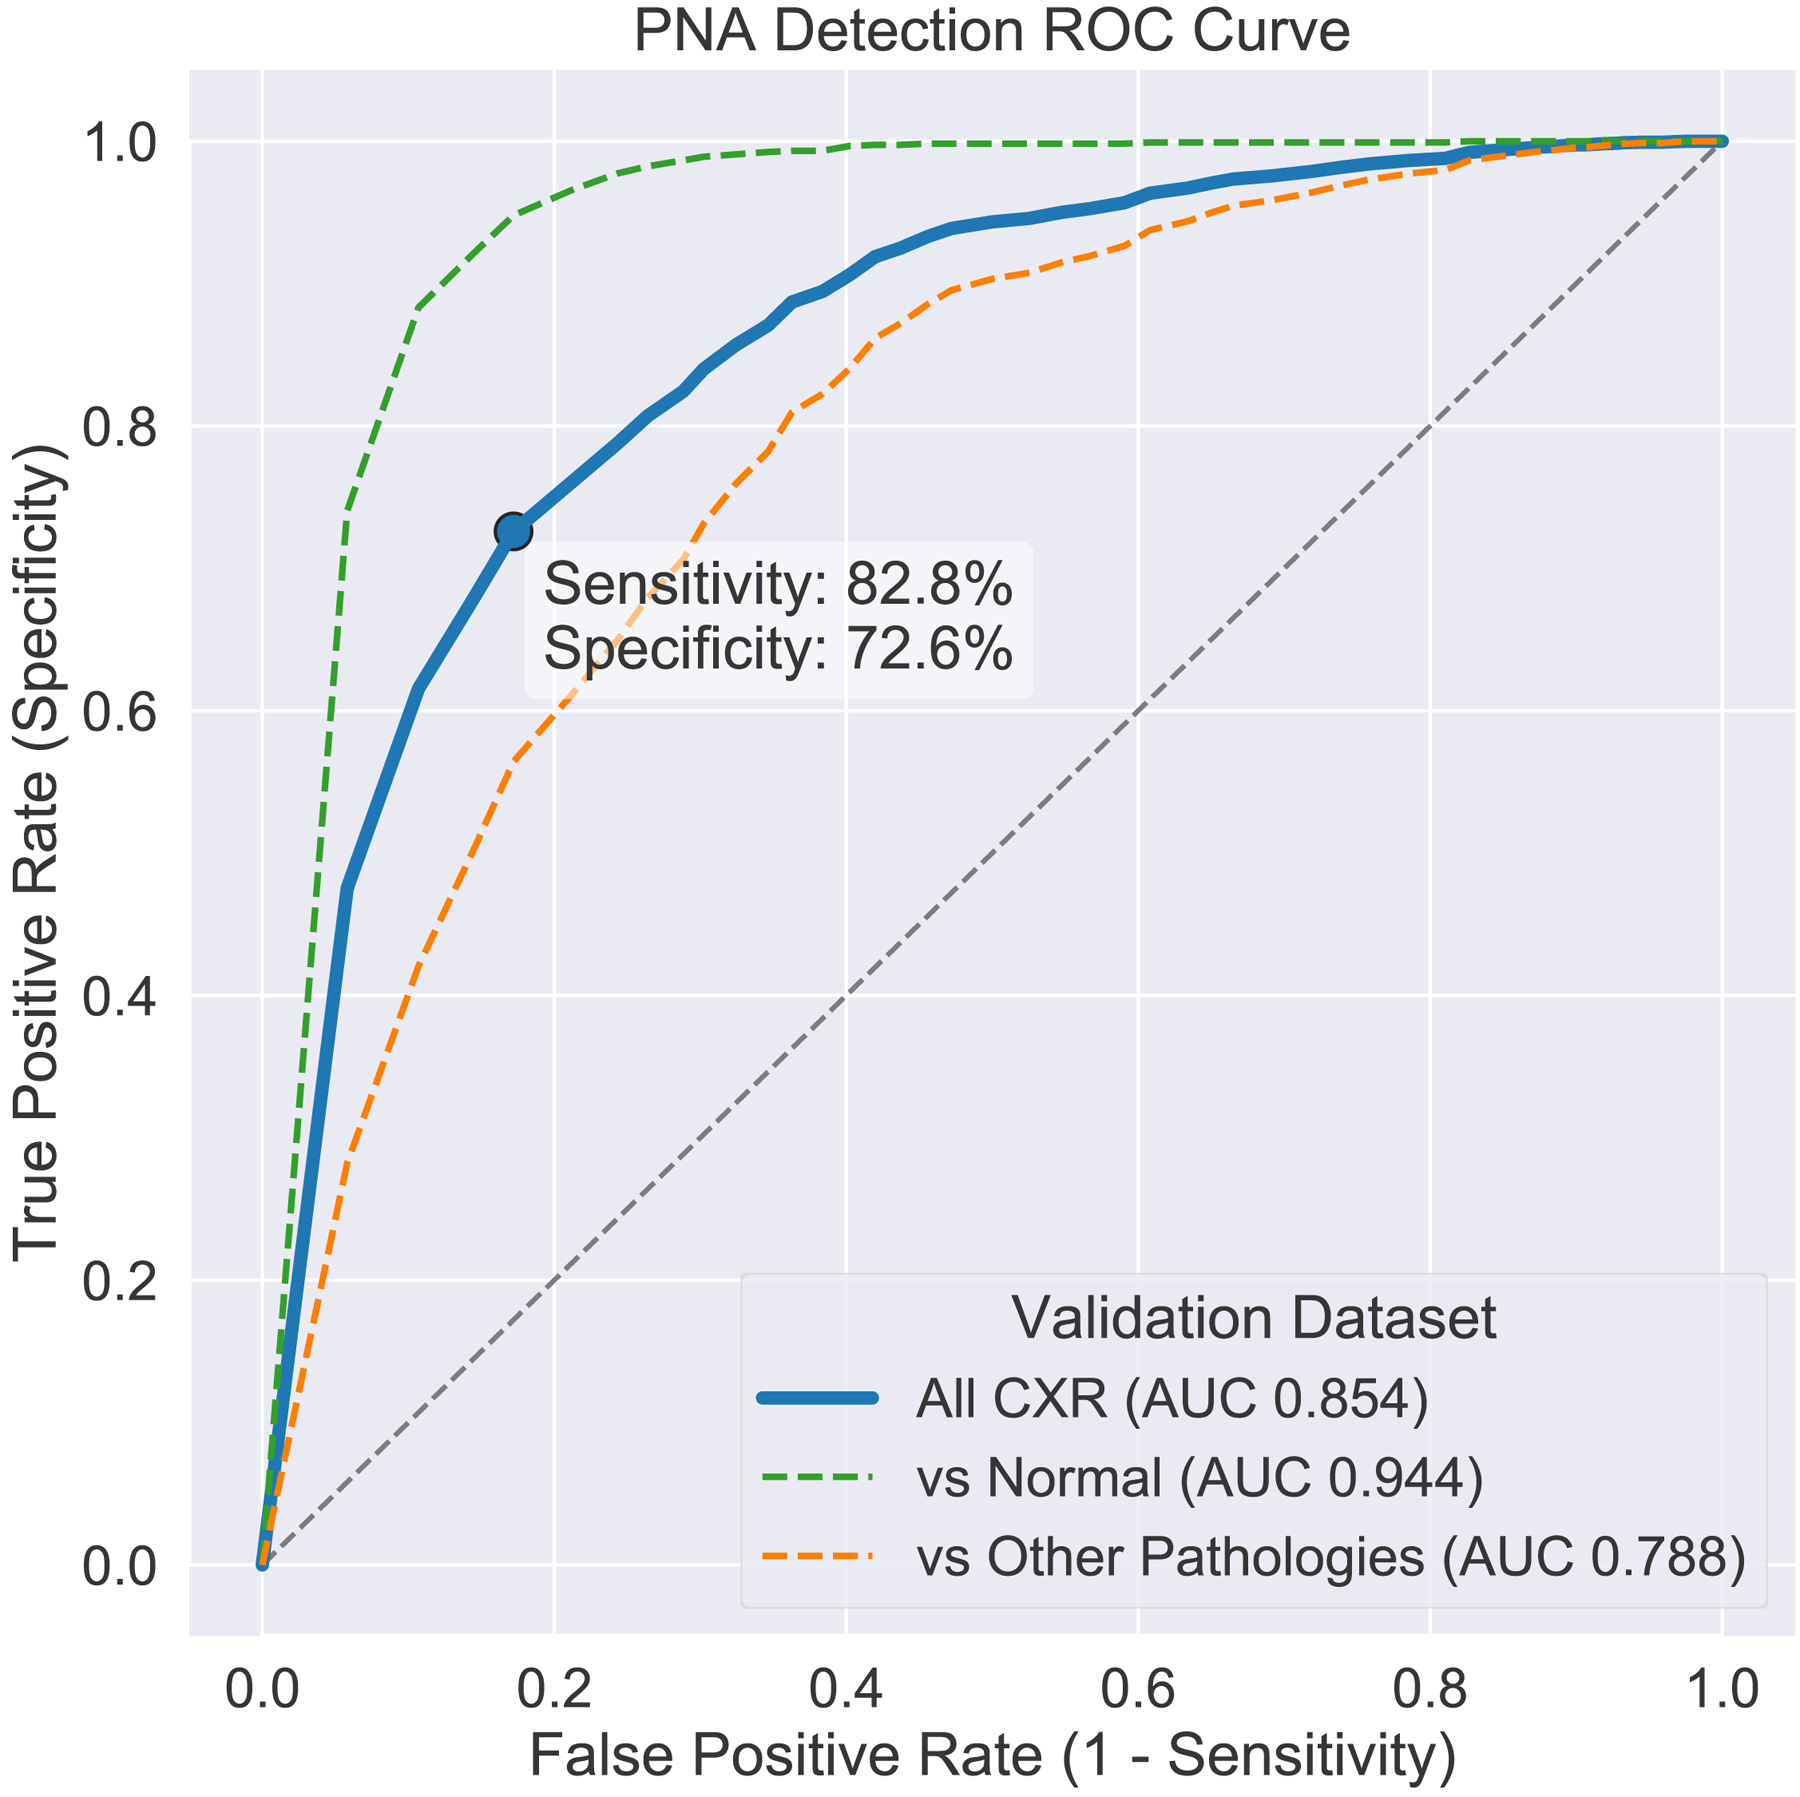
Including all radiographs (blue), overall performance yielded an area under the curve (AUC) of 0.854, which corresponds an accuracy of 81.6%, sensitivity of 82.8%, specificity of 72.6%, positive predictive value of 47.9%, and negative predictive value of 93.3%. Excluding radiographs with other diagnoses (not pneumonia), AUC was 0.944. Excluding normal radiographs, AUC was 0.788.
Representative examples of the performance of the neural network are highlighted in figures 5–8. For concordant positive cases, the CNN successfully localized cases of diffuse pneumonia with bilateral involvement and focal pneumonia on both adult and pediatric films. For concordant negative cases, the CNN appeared to perform well on normal radiographs, but also avoided normal variants like an elevated right hemidiaphragm. For discordant positive cases, where the CNN predicted pneumonia and ground truth was not labeled as pneumonia, the CNN highlighted pulmonary opacities that might be considered equivocal for pneumonia. For discordant negative cases, where there was a ground truth label of pneumonia, but the CNN did not identify any abnormalities, findings were equivocal or subtle for pneumonia, including a perihilar opacity and lingular opacity.
Figure 5: Examples cases where neural network predictions agreed with the ground truth label of pneumonia.
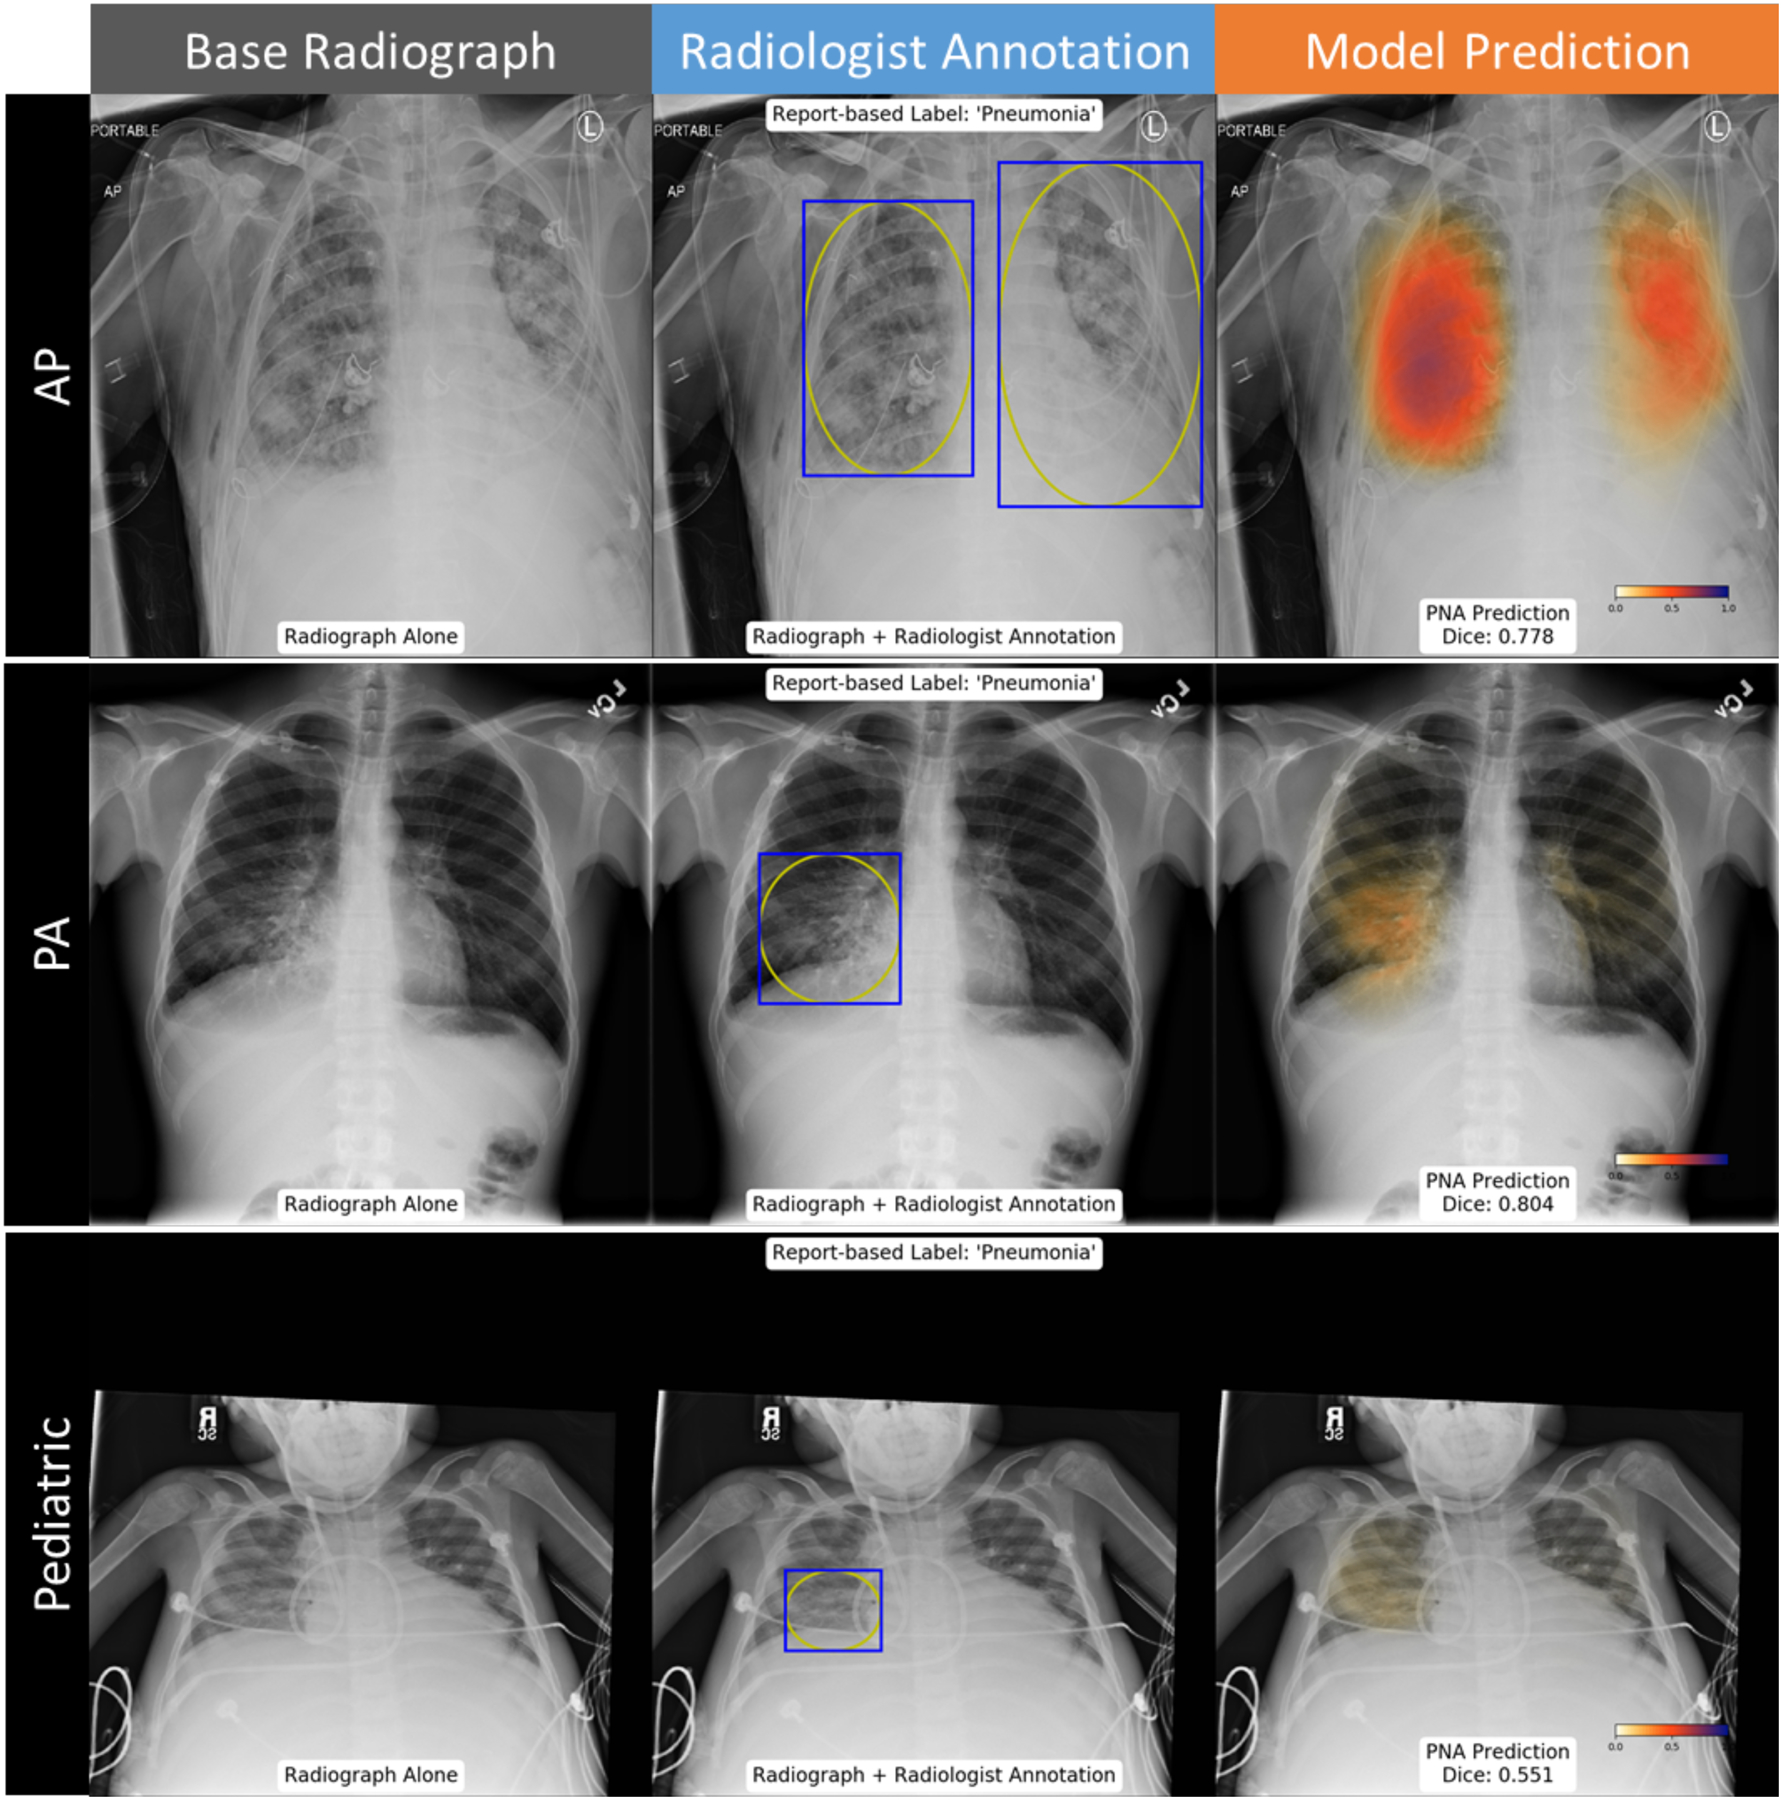
Probability map highlights a high likelihood of pneumonia throughout the lungs on an AP film, consistent with the radiologist localization (top row). Probability map matches radiologist annotation of a right middle lobe pneumonia (middle row). Probability map suggests greater involvement of pneumonia in the right lung than in the radiologists’ annotation for a pediatric patient (bottom row).
Figure 8: Example cases where neural network predictions disagreed with assigned annotation.
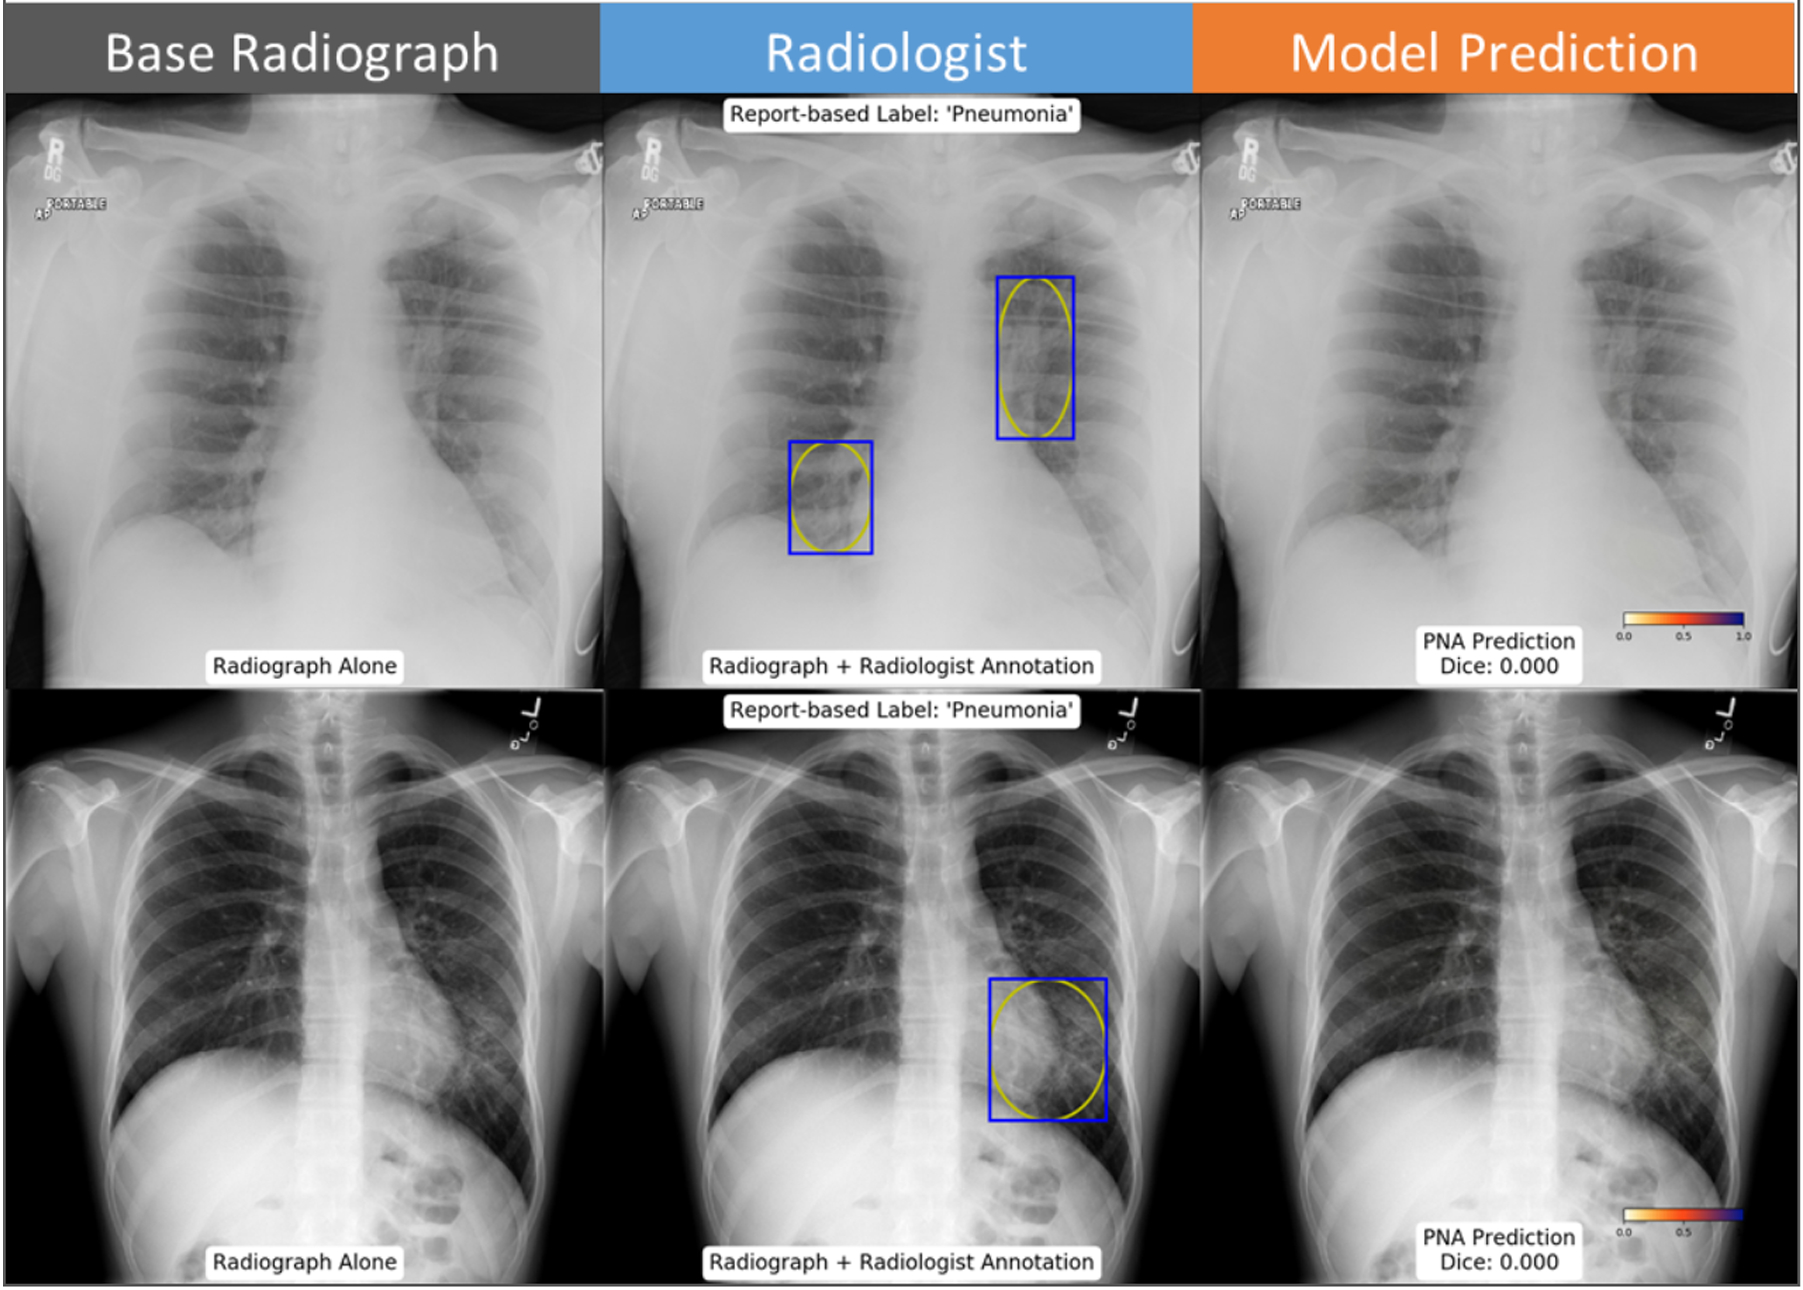
Left suprahilar and right infrahilar opacities were assigned as pneumonia by the annotating radiologist, which were not predicted by the neural network (top row). A lingular opacity effacing the left heart border was also assigned as pneumonia by the annotating radiologist, but not predicted by the neural network (bottom row).
Discussion
In this study, we show a semantic segmentation deep learning strategy can achieve radiographic diagnosis of pneumonia with an AUC of 0.854, compared to historical classification strategies that achieved AUC of 0.78–0.918,9, albeit with a different validation cohort. More importantly, this strategy appears to successfully highlight suspicious foci of pneumonia, which may be a more practical application of neural networks than previous approaches, providing a natural level of algorithm transparency that can be readily integrated into a radiologist’s workflow. Since often radiographs are interpreted concurrently with clinical history, prior films, lateral projections, or even prior CTs, final interpretation of radiographs is often more complex than can be accomplished based on a single frontal film. Color-encoded pixel-wise likelihood maps likely have some intrinsic value of their own. Probability maps can allow a physician to rapidly refute or agree with the observations of the neural network and consider these observations within the full clinical context of the patient and other more definitive information.
The literature using deep learning to localize pneumonia is limited. Other CNN approaches to predict pneumonia bounding boxes can be used such as Faster RCNN, or Mask RCNN. Recent work using a Mask RCNN approach on this same data set reported a mean IoU of 0.18–0.2120, which, while not an equivalent calculation, is likely slightly better than our rectangular-based IoU metric when accounting for discordant predictions, but roughly equivalent when using the elliptical-based IoU metric. Previous groups using whole image classification approaches attempt to illustrate pneumonia localizations using applied saliency maps to reveal portions of the image that are emphasized in the final classification9. However, it is unclear how reliable these saliency maps can be. Future work may be required to compare these alternative techniques to the strategy proposed here.
The purposes of cropping bounding box annotations into ellipses was an attempt to remove extrathoracic structures from being interpreted as pneumonia, thus improving the consistency of what the model learns as a pneumonia. Our results support this in two compounding ways: 1) all positive predictions localized to the thoracic cavity, and 2) 60% of concordant pneumonia predictions have elliptically based dice scores over 50%. Taken together this suggests the model reasonably differentiates lung opacities from normal lung parenchyma. The downside, as stated above, is that cropping radiologists’ annotations as ellipses does make it difficult for direct comparisons with prior works. Nonetheless we favor this approach for clinical use because we can be confident predictions will always localize within the thoracic cavity and being able to localize opacities.
One advantage of a classification approach over a localization or segmentation approach is that radiologist-defined localizations are not required for algorithm development. “Weak” binary labels (is or is not pneumonia, pneumothorax, etc.) are enough to make binary predictions. This property has made the classification strategy attractive to machine learning scientists, as they do not require involvement of a radiologist. The tradeoff, however, is that classification approaches typically require much larger data sets and more complex neural network architectures. Interestingly, we found that a smaller number of cases, only 20% of the NIH 112K data set, was enough to train a U-net to achieve similar performance as the classification-only approaches, which required 98–108K exams8,9. We presume this is due to training with explicit localizations.
AUC and Dice scores assume that the ground truth labels of pneumonia and radiologist annotations are correct and exact. It is possible that they were not, and the accuracy of our current algorithm may be underestimated. In this data set, radiologists annotated radiographs based on previous NLP-derived labels from the broader NIH data set. The accuracy of those labels is not certain9. In addition, only a couple radiologists annotated each radiograph. Even expert thoracic radiologists may not have perfect agreement on the boundaries or certainty of radiographic findings which is discussed in the curation of the data set used for this study16. Without supporting clinical data or a confirmatory CT scan it is difficult to assess the degree of diagnostic certainty in the data set. Future work may be required to assess overall performance against a more definitive ground truth, including CT or objective clinical features, such as leukocytosis and relevant clinical history.
Several observations stand out when reviewing the probability maps generated by the neural network. Using the strategy proposed here, we found that all areas of medium to high probability for pneumonia were confined to the thoracic cavity and tended to be observed on lung opacities. While this intuitively obvious to human observers, one common pitfall of classification neural networks is that they may often use visual cues that are unrelated to the disease process21. It is likely that this is the natural result of utilizing radiologists’ annotations of the location of pneumonia in the training process, rather than loosely providing labels of which exams came from patients who had pneumonia.
Ultimately, algorithms like these may be integrated into the clinical workflow of radiologists, emergency physicians, and internists. However, it is likely that they will not be immediately perfect in their initial implementation, and will require further training and optimization, which may be facilitated with expert feedback. Since CNNs can be further modified through a process of transfer learning, it is possible to adapt and “teach” CNNs to improve performance for specific patterns where it may struggle, analogous to teaching a resident after he/she misses a retrocardiac pneumonia. A number of different strategies could have been used to further improve performance of our algorithm. It is possible using a pretrained network, hyperpameter optimization, or applying image augmentation could have marginally improved performance. However, we believe it is also possible to improve performance by providing relevant data to learn on. Improving performance on diaphragmatic, retrocardiac and lingular pneumonias may be remedied by increasing the number or weight of these cases in training, whether retraining from scratch or utilizing a “transfer learning” strategy15. Alternatively, training CNNs to specifically recognize and identify other similar appearing pathologies like pulmonary edema may also improve performance.
The approach we propose here, augmenting radiographs with a probability map, has potential to integrate readily into the clinical workflow of an interpreting radiologist, who can integrate information from multiple sources, including the clinical history, lateral films or other imaging modalities such as CT. Future work may further assess the multiple potential advantages of this image augmentation approach, which may be readily applied to other disease processes. For example, small pneumothoraces can be important to detect, though difficult with historical classification approaches22. The same technique may also be effective at localizing tubes, lines or other devices or acute fractures. It is also possible that this approach could have impact on the quality of interpretation of physicians closer to the point of care, such as emergency or ICU physicians, or diagnostic radiology trainees with more limited experience with this front-line imaging modality. Future work may be valuable to assess overall clinical impact of this technology.
Conclusion
In this study we show a “semantic segmentation” deep learning approach may be a useful adjunct to facilitate the radiographic diagnosis of pneumonia. The pneumonia probability map produced by this approach may interface more naturally with radiologist interpretation than purely classification-based strategies.
Figure 6: Examples cases where the pneumonia probability map agreed with absence of pneumonia.
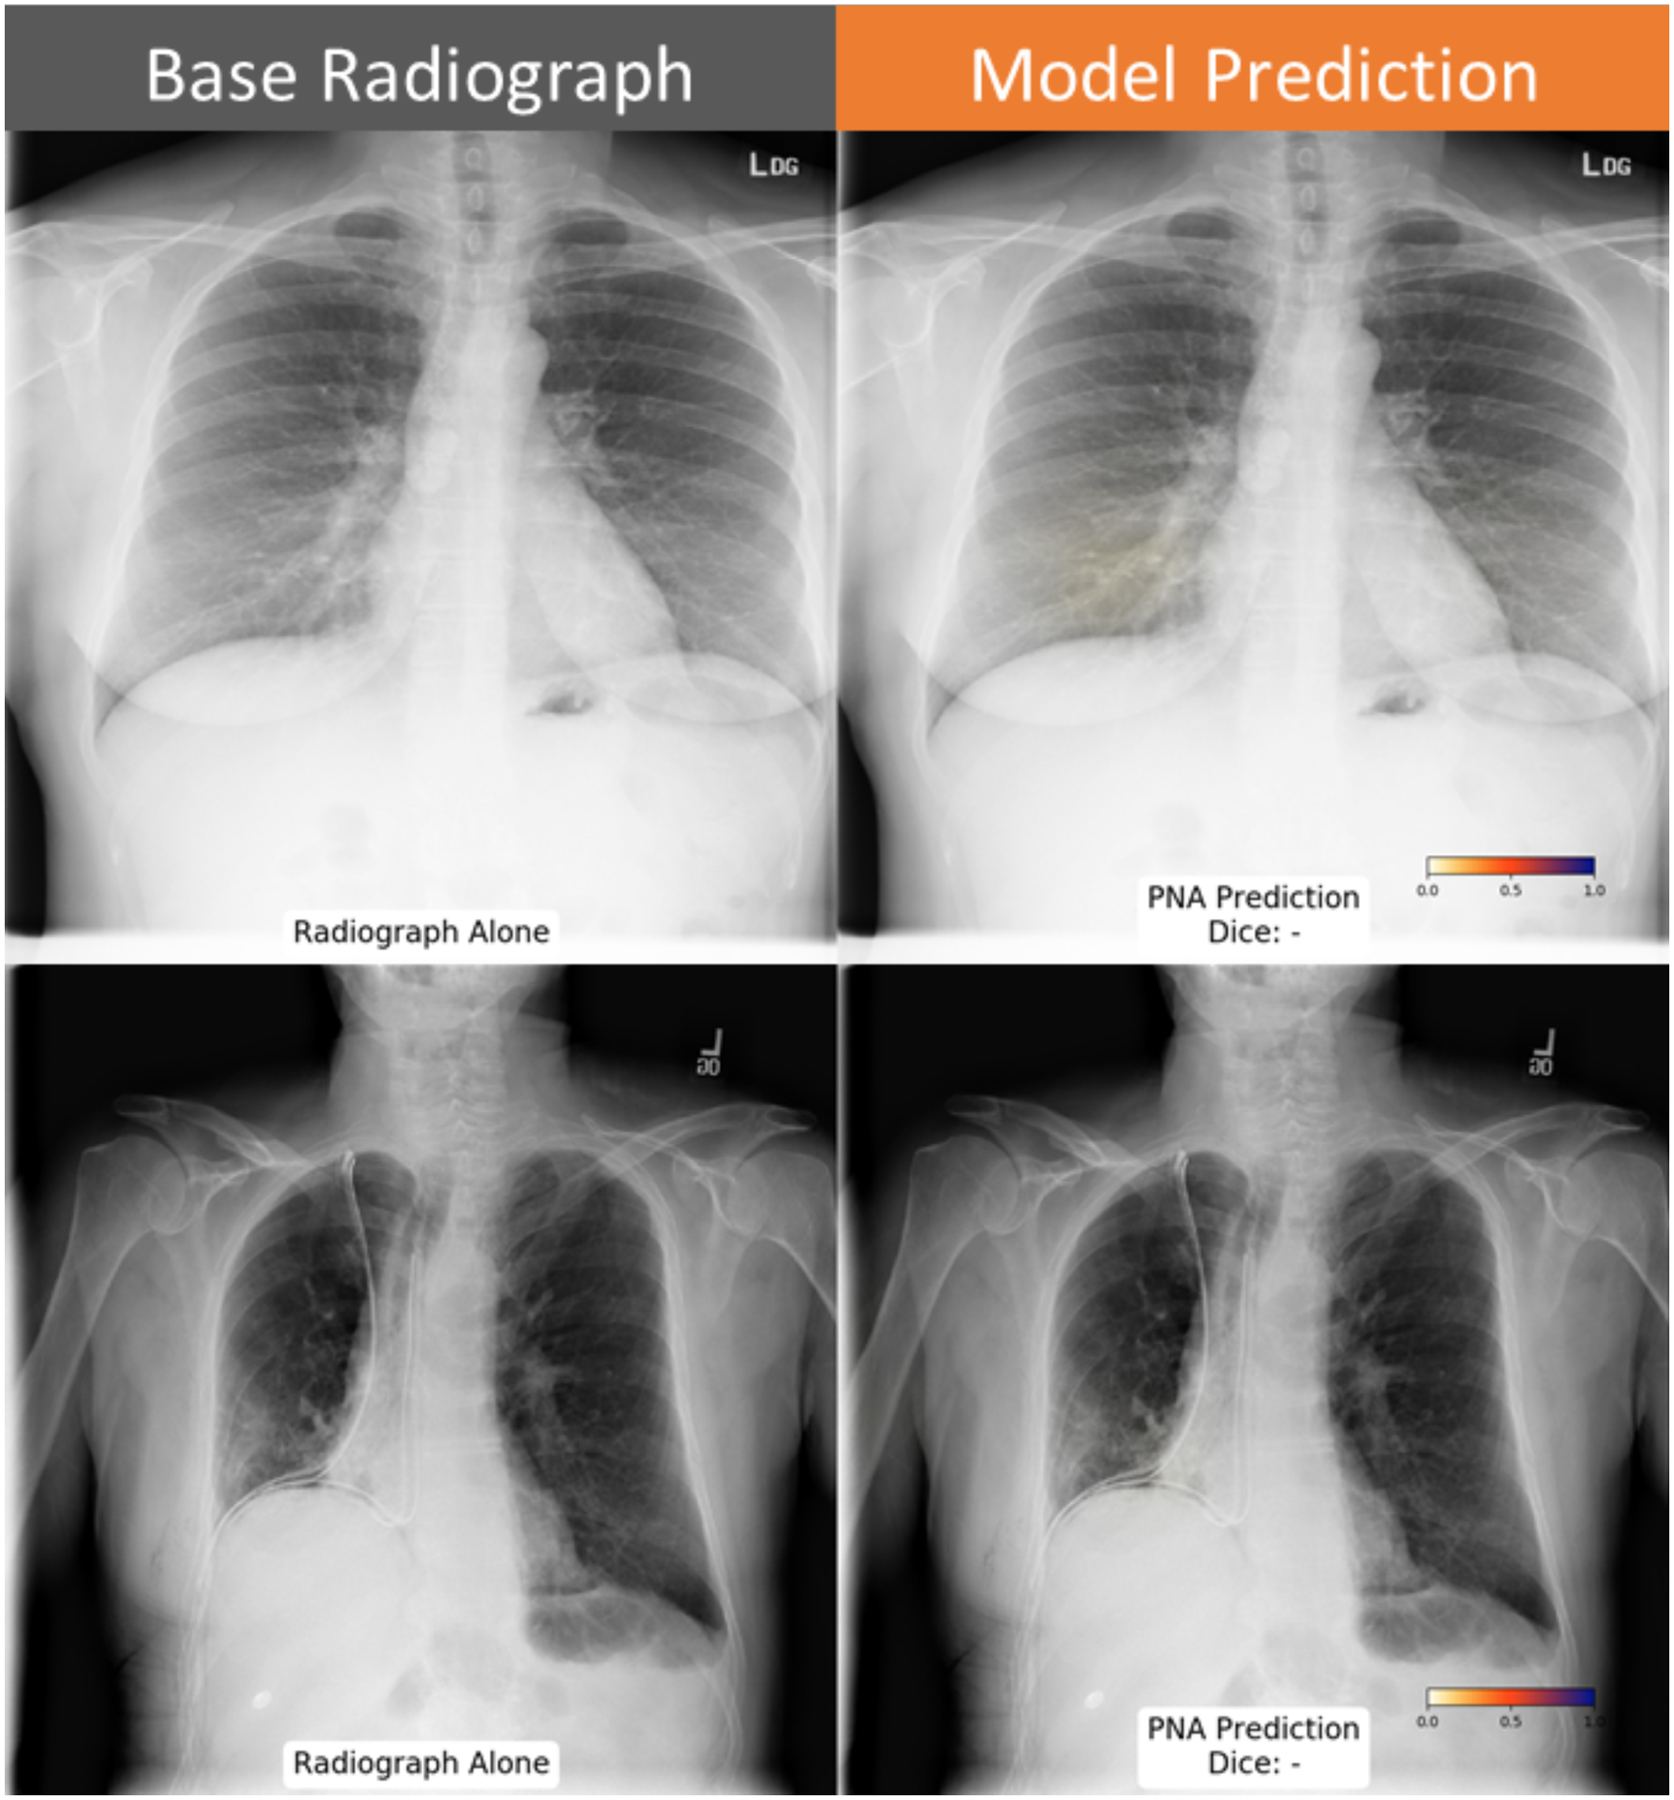
Probability map highlights an area with low likelihood of pneumonia below threshold in the right lung base (top row). Elevation of the right hemidiaphragm was also correctly classified as negative (bottom row) by the neural network.
Figure 7: Example cases where neural network predictions disagreed with ground truth annotation.
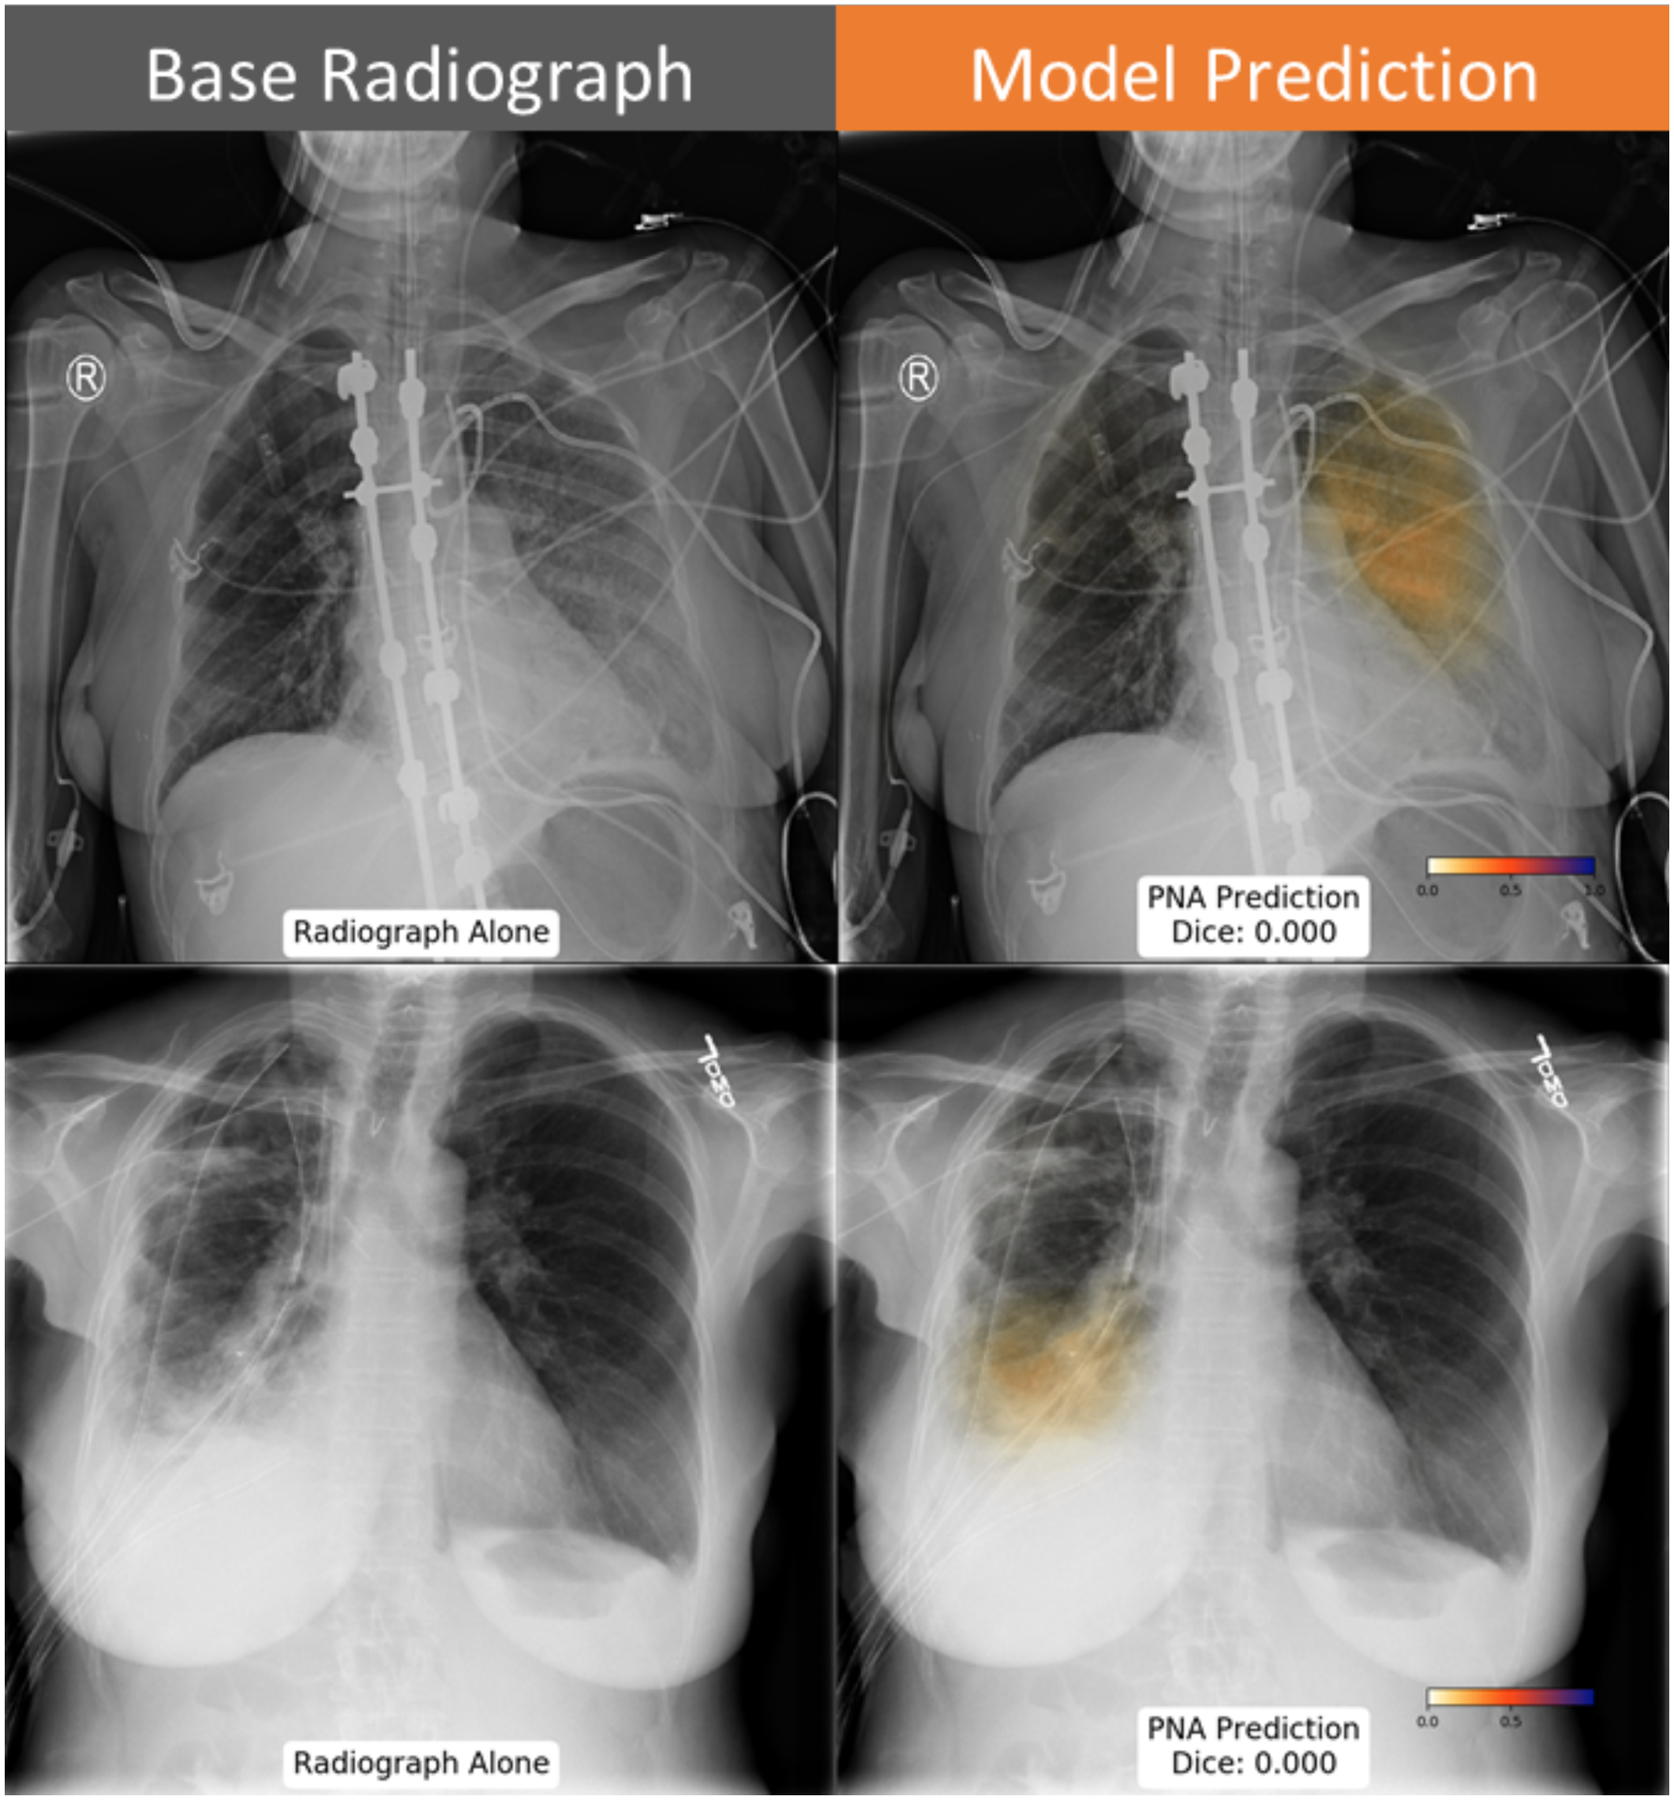
The neural network predicts pneumonia in the left upper lung (top row), which was not marked by the annotating radiologist. Similarly, the discordant prediction of pneumonia in the right lung in a patient with chest tubes, pleural effusion and adjacent opacity.
Funding Sources:
B.H. receives grant support from the NIH T32 Institutional National Research Service Award; Hardware used to perform this research provided by an NVIDIA GPU Grant. A.H. receives grant support from the American Roentgen Ray Society, as the ARRS Scholar
Footnotes
Conflicts of Interest:
B.H. provides consulting services to Arterys and IBM; A.Y. provides consulting services to IMedis. S.K. does not have relevant disclosures, and A.H. receives grant support from GE Healthcare and Bayer AG. A.H. is a founder and consultant for Arterys, Inc.
References
- 1.Xu J, Murphy SL, Kochanek KD BB. National Vital Statistics Reports Deaths : Final Data for 2013. Natl Vital Stat Rep. 2016;64(2):1–119. doi:May 8, 2013 [PubMed] [Google Scholar]
- 2.NEJM, Journal E. Current concepts community-acquired pneumonia. 1995;222:1618–1624. [Google Scholar]
- 3.Ibrahim EH, Tracy L, Hill C, Fraser VJ, Kollef MH. The occurrence of ventilator-associated pneumonia in a community hospital: Risk factors and clinical outcomes. Chest. 2001. doi: 10.1378/chest.120.2.555 [DOI] [PubMed] [Google Scholar]
- 4.Raoof S, Feigin D, Sung A, Raoof S, Irugulpati L, Rosenow EC. Interpretation of plain chest roentgenogram. Chest. 2012;141(2):545–558. doi: 10.1378/chest.10-1302 [DOI] [PubMed] [Google Scholar]
- 5.Hinton G Deep learning-a technology with the potential to transform health care. JAMA - J Am Med Assoc. 2018. doi: 10.1001/jama.2018.11100 [DOI] [PubMed] [Google Scholar]
- 6.Retson TA, Besser AH, Sall S, Golden D, Hsiao A. Machine learning and deep neural networks in thoracic and cardiovascular imaging. J Thorac Imaging. 2019. doi: 10.1097/rti.0000000000000385 [DOI] [PMC free article] [PubMed] [Google Scholar]
- 7.Wang X, Peng Y, Lu L, Lu Z, Bagheri M, Summers RM. ChestX-ray8 : Hospital-scale Chest X-ray Database and Benchmarks on Weakly-Supervised Classification and Localization of Common Thorax Diseases.:2097–2106. [Google Scholar]
- 8.Zech JR, Badgeley MA, Liu M, Costa AB, Titano JJ, Oermann EK. Variable generalization performance of a deep learning model to detect pneumonia in chest radiographs: A cross-sectional study. PLoS Med. 2018;15(11):1–17. doi: 10.1371/journal.pmed.1002683 [DOI] [PMC free article] [PubMed] [Google Scholar]
- 9.Rajpurkar P, Irvin J, Ball RL, et al. Deep learning for chest radiograph diagnosis: A retrospective comparison of the CheXNeXt algorithm to practicing radiologists. PLoS Med. 2018;15(11):e1002686. doi: 10.1371/journal.pmed.1002686 [DOI] [PMC free article] [PubMed] [Google Scholar]
- 10.Erickson BJ, Korfiatis P, Kline TL, Akkus Z, Philbrick K, Weston AD. Deep Learning in Radiology: Does One Size Fit All? J Am Coll Radiol. 2018. doi: 10.1016/j.jacr.2017.12.027 [DOI] [PMC free article] [PubMed] [Google Scholar]
- 11.Recasens A, Kellnhofer P, Stent S, Matusik W, Torralba A. Learning to zoom: A saliency-based sampling layer for neural networks. In: Lecture Notes in Computer Science (Including Subseries Lecture Notes in Artificial Intelligence and Lecture Notes in Bioinformatics).; 2018. doi: 10.1007/978-3-030-01240-3_4 [DOI] [Google Scholar]
- 12.Avendi M, Kheradvar A, Jafarkhani H. Fully automatic segmentation of heart chambers in cardiac MRI using deep learning. J Cardiovasc Magn Reson. 2016;18(S1):2–4. doi: 10.1186/1532-429x-18-s1-p35126738482 [DOI] [Google Scholar]
- 13.Miller RW, Zhuge Y, Arora BC, et al. Brain tumor segmentation using holistically nested neural networks in MRI images. Med Phys. 2017;44(10):5234–5243. doi: 10.1002/mp.12481 [DOI] [PMC free article] [PubMed] [Google Scholar]
- 14.Wang S, Zhou M, Liu Z, et al. Central focused convolutional neural networks: Developing a data-driven model for lung nodule segmentation. Med Image Anal. 2017;40:172–183. doi: 10.1016/j.media.2017.06.014 [DOI] [PMC free article] [PubMed] [Google Scholar]
- 15.Wang K, Mamidipalli A, Retson T, et al. Automated CT and MRI Liver Segmentation and Biometry Using a Generalized Convolutional Neural Network. Radiol Artif Intell. 2019;1(2):180022. doi: 10.1148/ryai.2019180022 [DOI] [PMC free article] [PubMed] [Google Scholar]
- 16.Shih G, Wu CC, Halabi SS, et al. Augmenting the National Institutes of Health Chest Radiograph Dataset with Expert Annotations of Possible Pneumonia. Radiol Artif Intell. 2019. doi: 10.1148/ryai.2019180041 [DOI] [PMC free article] [PubMed] [Google Scholar]
- 17.Ronneberger O, Fischer P, Brox T. U-net: Convolutional networks for biomedical image segmentation. In: Lecture Notes in Computer Science (Including Subseries Lecture Notes in Artificial Intelligence and Lecture Notes in Bioinformatics). Vol 9351; 2015:234–241. doi: 10.1007/978-3-319-24574-4_28 [DOI] [Google Scholar]
- 18.Otsu N A Threshold Selection Method from Gray-Level Histograms. IEEE Trans Syst Man Cybern. 2008. doi: 10.1109/tsmc.1979.4310076 [DOI] [Google Scholar]
- 19.Youden WJ. Index for rating diagnostic tests. Cancer. 2006. doi: [DOI] [PubMed] [Google Scholar]
- 20.Jaiswal AK, Tiwari P, Kumar S, Gupta D, Khanna A, Rodrigues JJPC. Identifying pneumonia in chest X-rays: A deep learning approach. Meas J Int Meas Confed. 2019;145:511–518. doi: 10.1016/j.measurement.2019.05.076 [DOI] [Google Scholar]
- 21.Kallianos K, Mongan J, Antani S, et al. How far have we come? Artificial intelligence for chest radiograph interpretation. Clin Radiol. 2019. doi: 10.1016/j.crad.2018.12.015 [DOI] [PubMed] [Google Scholar]
- 22.Taylor AG, Mielke C, Mongan J. Automated detection of moderate and large pneumothorax on frontal chest X-rays using deep convolutional neural networks: A retrospective study. PLoS Med. 2018. doi: 10.1371/journal.pmed.1002697 [DOI] [PMC free article] [PubMed] [Google Scholar]


