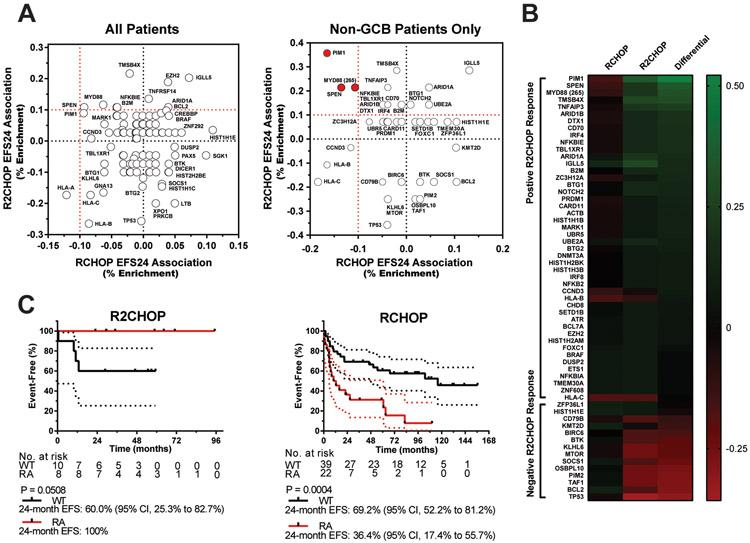
Figure 1: Identification of DNA Alterations that Predict High-risk non-GCB DLBCL that Respond to R2CHOP.
(A) Association of individual genes with EFS24 response to RCHOP (x-axis) and R2CHOP (y-axis) are compared on an XY scatter plot. The data from both GCB and non-GCB patients are plotted in the left panel; data from non-GCB patients only are plotted in the right panel. (B) Heatmap showing differential enrichment of alterations in non-GCB patients who fail EFS24 with RCHOP but achieve with R2CHOP. Scale shown represents percentage enriched in EFS24 population. Genes with 10% or lesser favorability in RCHOP and 10% or greater favorability in R2CHOP were designated as EFS24 responder alterations (RA). (C) Kaplan-Meier curves for event free survival of R2CHOP (N=18) and RCHOP (N=61) treated cases. 95% CI ranges are shown as dotted lines.

