

Abstract
During development, oligodendrocytes contact and wrap neuronal axons with myelin. Similar to neurons and synapses, excess myelin sheaths are produced and selectively eliminated, but how elimination occurs is unknown. Microglia, the resident immune cells of the CNS, engulf surplus neurons and synapses. To determine if microglia also prune myelin sheaths, we used zebrafish to visualize and manipulate interactions between microglia, oligodendrocytes, and neurons during development. We found that microglia closely associate with oligodendrocytes and specifically phagocytose myelin sheaths. By using a combination of optical, genetic, chemogenetic, and behavioral approaches we revealed that neuronal activity bidirectionally balances microglial association with neuronal cell bodies and myelin phagocytosis in the optic tectum. Furthermore, multiple strategies to deplete microglia caused oligodendrocytes to maintain excessive and ectopic myelin. Our work reveals a neuronal activity-regulated role for microglia in modifying developmental myelin targeting by oligodendrocytes.
INTRODUCTION
Neuronal axon conduction velocity is supported by myelin, a specialized, proteolipid-rich membrane produced by glial cells. During development, oligodendrocytes generate numerous nascent myelin sheaths along axons. Neuronal activity promotes the formation and maturation of myelin sheaths1–3 and can bias which axons are selected for myelination1,4. Sensory enrichment and deprivation paradigms in both mice and humans can modify oligodendrogenesis and myelination in relevant brain regions5–7, raising the possibility that changes in myelin support the development of higher cognitive functions. Consistent with this possibility, new myelin is required for at least some types of learning8.
An underappreciated dimension of myelin plasticity is myelin elimination. Similar to neurons and synapses of the developing CNS, myelin is first overproduced and then partially eliminated9. How myelin sheaths are removed is unknown. Microglia, the resident immune cell type of the CNS, eliminate surplus neurons and synapses during development. Microglia detect and respond to neuronal activity10,11, notably engulfing synapses in an activity-regulated manner to direct development of the visual system12. In neurological and neurodegenerative diseases, this synaptic elimination program can reemerge maladaptively to promote disease progression13. Notably, microglial phagocytosis of myelin also is a feature of neural disease and injury14,15. Therefore, to explain developmental myelin elimination, we hypothesized that microglia engulf myelin sheaths during development to sculpt myelination.
To test this hypothesis, we manipulated and directly observed interactions between microglia, myelin, and neurons in vivo using zebrafish as a model system. We found that microglia are intimately associated with oligodendrocytes and specifically phagocytose myelin sheaths, leaving cell bodies intact. We used multiple strategies to manipulate neuronal activity and demonstrated that microglia are attracted to active neurons at the expense of myelin phagocytosis and conversely, microglia phagocytose more myelin and contact fewer neurons when neuronal activity is silenced. By eliminating microglia, we found evidence that microglia remove excess myelin sheaths and prevent ectopic myelination of cell bodies. Our data establish that microglia limit developmental myelination and thereby extend our understanding of the mechanistic basis of myelin plasticity.
RESULTS
Microglia survey myelinated axon tracts
Our first objective was to determine if a relationship exists between microglia and oligodendrocytes during development. To visualize microglia, we established a transgenic line of zebrafish, Tg(mpeg1.1:mVenus-CAAX), in which mpeg1.1 regulatory DNA drives expression of membrane-tethered mVenus-CAAX in microglia and macrophages. Crossing this line to animals carrying Tg(mbpa:mCherry-CAAX), a transgene that labels myelinating oligodendrocyte membrane with mCherry, permitted us to see microglia-oligodendrocyte interactions (Fig. 1a). In the spinal cord at 4 days post-fertilization (dpf), the time at which Tg(mbpa:mCherry-CAAX) expression becomes visible, spinal cord microglia almost exclusively occupied the myelinated tracts of the dorsal and medial longitudinal fasciculi. By counting microglia in each of these tracts over developmental time, we found that microglia had an early bias for localization in the medial longitudinal fasciculus of the ventral spinal cord but occupied the tracts equally by 8 dpf (Fig. 1b). To learn if the change in microglia distribution correlates with a change in oligodendrocyte number, we counted oligodendrocyte cell bodies in dorsal and ventral tracts in a 3.5 hemisegment region. Similarly to microglia, oligodendrocytes were first more numerous in the ventral tract but became more equally distributed between tracts by 8 dpf (Fig. 1c, d). Comparing the dorsal to ventral ratio of oligodendrocytes and microglia revealed that they were nearly evenly matched in both locations over developmental time (Fig. 1e). Because microglia are motile cells, we sought to determine the extent of their surveillance of the myelinated tracts. To accomplish this, we performed timelapse imaging of the spinal cord and assessed the frequency of microglia migrating through a 3.5 hemisegment region. We found that regions were visited by a migrating microglia roughly every 4 h (Fig. 1f, g). These observations reveal that spinal cord microglia associate with oligodendrocytes during development and suggest that microglia are sufficiently motile to comprehensively survey myelinated axon tracts.
Figure 1. Microglia dynamically engage with myelin sheaths in the spinal cord.
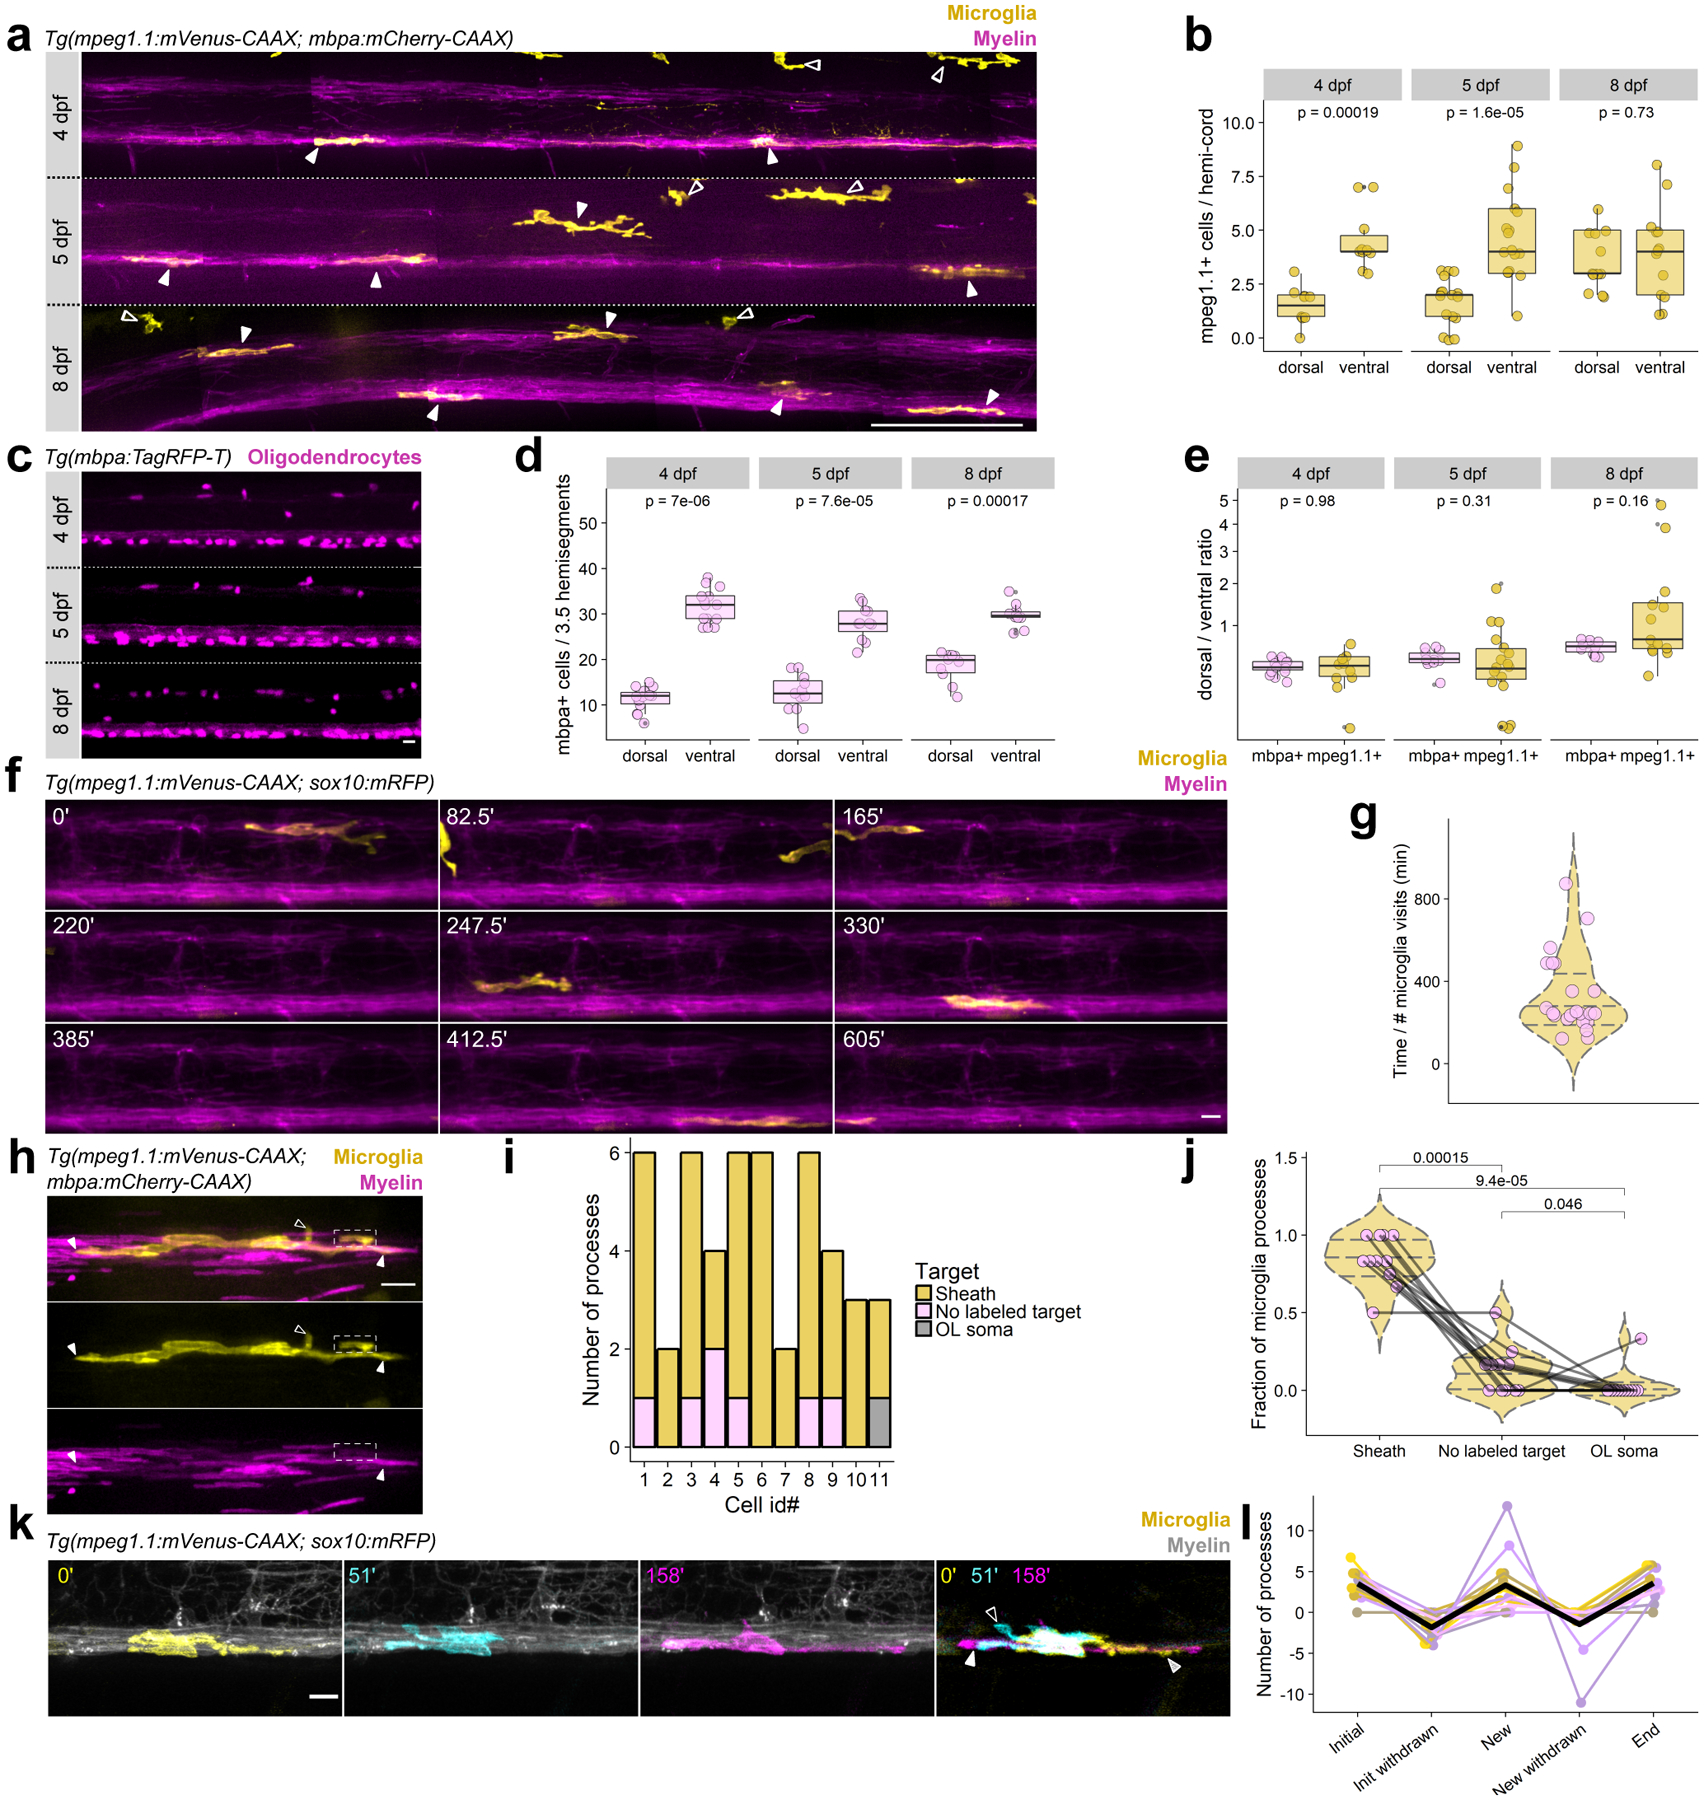
(a) Lateral tile scans of spinal cords of Tg(mpeg1.1:mVenus-CAAX; mbpa:mCherry-CAAX) larvae at 4, 5, and 8 dpf. Closed arrowheads mark microglia and open arrowheads mark peripheral macrophages. Scale bar, 50 μm. (b) Microglia counts in dorsal and ventral tracts (hemi-cord) in 4, 5, and 8 dpf larvae. Wilcox rank-sum test, n=fish/cells, n=10/60 4 dpf, 17/109 5 dpf, 13/97 8 dpf. (c) Oligodendrocytes in 3.5 hemisegments in the spinal cord of Tg(mbpa:TagRFP-T) larvae at 4, 5, and 8 dpf. Scale bar, 10 μm. (d) Oligodendrocyte counts in dorsal and ventral tracts (3.5 hemisegments) in 4, 5, and 8 dpf larvae. Wilcox rank-sum test, n=fish/cells, n=14/602 4 dpf, 11/448 5 dpf, 10/482 8 dpf. (e) Ratios of dorsal/ventral cell counts for mbpa+ oligodendrocytes and mpeg1.1+ microglia at 4, 5, and 8 dpf, for cells counted in (b) and (d). Data in (b), (d), and (e) analyzed by Wilcox rank-sum test. (f) Timelapse imaging frames over 10 h in Tg(mpeg1.1:mVenus-CAAX; sox10:mRFP) larvae at 4 dpf. (g) Time between microglia visits. Each point represents the timelapse acquisition time divided by the number of microglia visits to the imaging field of view; each point is one larva (n=22 larvae). Violin plot lines mark quantiles (25, 50, 75 percentile) and colors are meaningless. (h) A microglia (yellow) in the dorsal spinal cord of a Tg(mpeg1.1:mVenus-CAAX; mbpa:mCherry-CAAX) larva. Closed arrowheads mark close associations of microglial processes with myelin sheaths (magenta rectangles); open arrowheads mark processes extending toward unlabeled targets; dashed box shows a process enveloping a sheath. (i) Distribution of microglial processes per cell associated with myelin sheaths, oligodendrocyte somas, or unlabeled targets for n=11 cells (11 fish). (j) Fraction of microglial processes in (i) plotted per target type, Wilcox rank-sum test with Bonferroni-Holm correction for multiple comparisons. Each point represents one microglia. (k) Timelapse imaging frames of a microglia in a Tg(mpeg1.1:mVenus-CAAX; sox10:mRFP) larva, pseudocolored to show cell morphology at three different time points and merged. Striped arrowhead marks a process present at 0’ that is absent at 51’ (initial, withdrawn); open arrowhead marks a process generated during the imaging period that later disappears (new, withdrawn); closed arrowhead marks a process that is generated during the imaging period and is maintained at the end of the imaging window (new). (l) Number of processes generated and withdrawn by microglia during 1 hour of timelapse imaging; black trace is the mean (n=14 microglia in 14 fish). Scale bars, 10 μm.
We next assessed how microglia interact with oligodendrocytes. During larval stages, microglia have few, mostly primary, processes. We determined that most processes associated with myelin sheaths rather than oligodendrocyte cell bodies or putative targets unlabeled by our transgenic reporters (Fig. 1h–j). Timelapse imaging revealed that microglia processes were not static but were continually retracted and extended within myelinated tracts labeled by Tg(sox10:mRFP) (Fig. 1k, l). These dynamic behaviors are consistent with the possibility that microglia survey a large fraction of nascent myelin sheaths in the spinal cord.
Microglia phagocytose myelin sheaths but not oligodendrocytes
To learn if myelin-associated microglia are phagocytic we performed imaging experiments to detect intracellular calcium transients, a signature of phagocytic microglia and macrophages16,17. To visualize calcium dynamics, we generated a transgenic line, Tg(mpeg1.1:GCaMP6s-CAAX), which labels microglia membrane with the calcium indicator GCaMP6s-CAAX. By imaging microglia in 4 dpf larvae, we found numerous spontaneous calcium events within process tips, branches, and the cell body. To distinguish calcium transients from membrane fluctuations that occur during cellular movement, we imaged microglia in larvae carrying both GCaMP6s-CAAX and another membrane-tethered fluorophore, mScarlet-CAAX, at 4 dpf and detected and investigated events with the calcium imaging toolbox, AQuA (Fig. 2a). We found that calcium events were distinguishable from membrane movement events on the basis of fluorescence change, dF/F (Fig. 2b), so we set a threshold for calcium events to include only those exceeding dF/F > 0.05. By this criterion, 100% of microglia exhibited calcium transients during a 10 min acquisition (Supplementary Table 1). To determine if these calcium events represent phagocytic activity at microglia-myelin contacts, we next performed calcium imaging on Tg(mpeg1.1:GCaMP6s-CAAX; sox10:mRFP) larvae (Fig. 2c, Supplementary Videos 1, 2). Microglia exhibited transients both within processes contacting sheaths and those not contacting sheaths. Of the 645 filtered calcium events we detected in 31 microglia, we further filtered events to examine the sheath-contacting status of the largest calcium events (dF/F > 0.10, area > 3 μm2), which yielded 41 events in 9/31 cells. These events predominantly occurred at contacts with myelin sheaths (Fig. 2d) and were distinguishable from non-sheath-contacting events on the basis of event duration (Fig. 2e, Extended Fig. 1), consistent with these events representing a specific signaling program within sheath-contacting processes. Indeed, we found that sheath-contacting processes exhibiting calcium transients were sometimes followed by sheath disappearance (Fig. 2f, Supplementary Videos 3, 4), consistent with calcium signaling as a signature of phagocytic activity.
Figure 2. Microglia phagocytose myelin sheaths during developmental myelination.
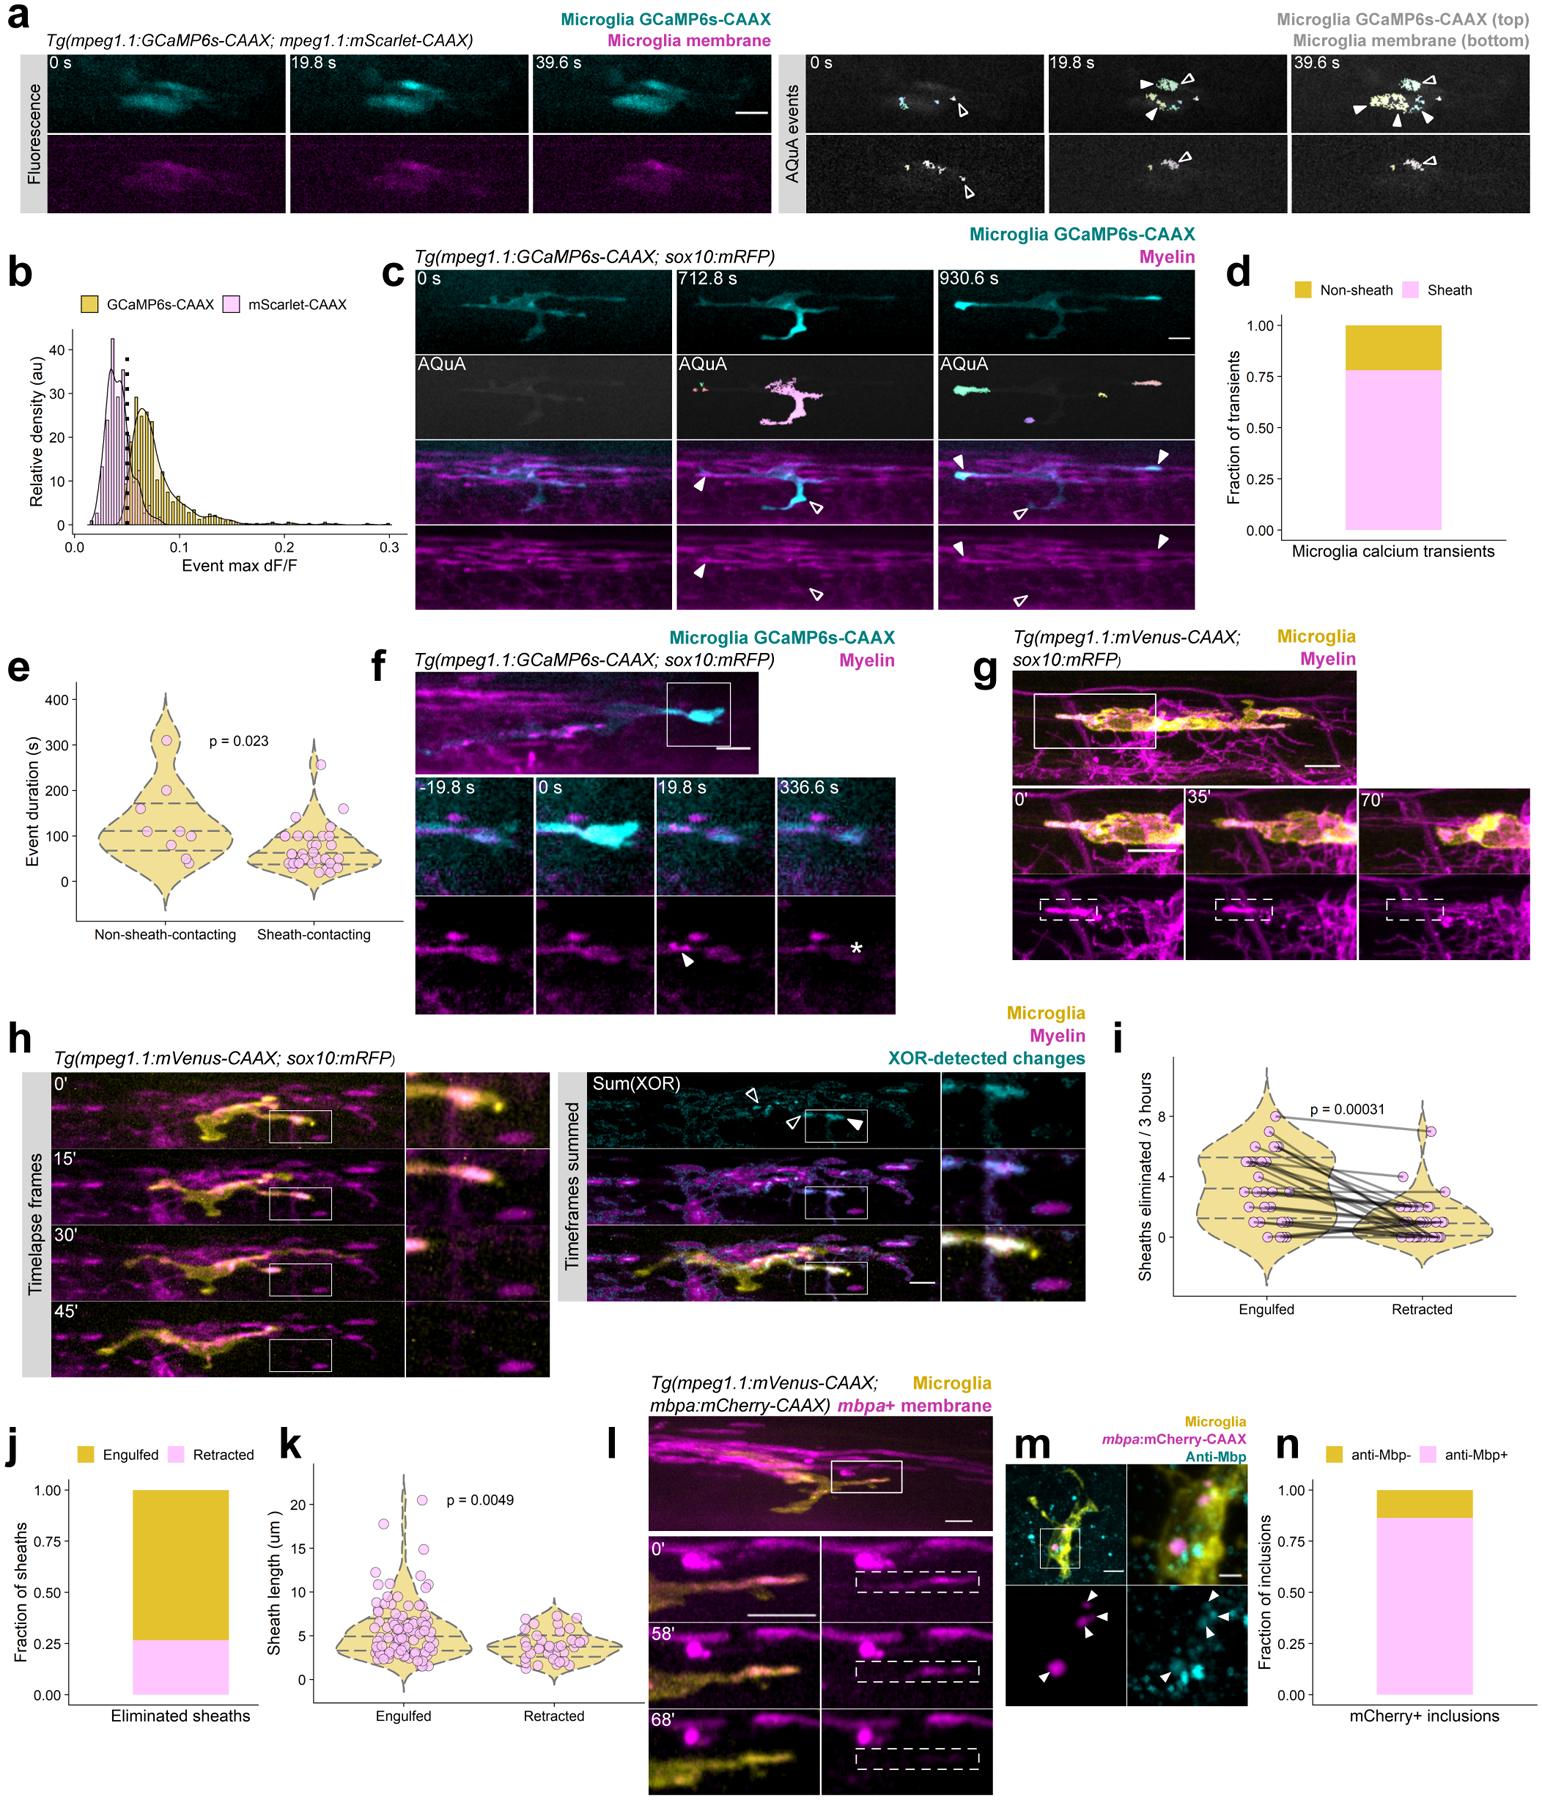
(a) Timelapse imaging (left) and AQuA transient detection in a microglia carrying dual reporters for membrane fluorescence (mScarlet-CAAX) and membrane calcium (GCaMP6s-CAAX). Open arrowheads label membrane events present in both channels; closed arrowheads mark calcium transients. (b) Histogram of membrane and calcium event dF/F values (649 calcium events in 31 cells, 228 membrane events in 9 cells) shows that events are separable by dF/F; therefore, only events >0.05 dF/F were considered calcium transients. (c) Timelapse imaging of filtered calcium transients (dF/F > 0.05) in a microglia interacting with myelin. Closed arrowheads mark events occurring at points of contact with sheaths; open arrowheads mark events at non-sheath-contacting processes. (d, e) Fraction of large calcium events (d) and event duration (e) associated with sheath-contacting and non-contacting processes. Wilcox rank-sum test; n=32/9 filtered events from 9 cells/9 fish. (f) Timelapse imaging of a microglia calcium transient and phagocytosis of contacted material (arrowheads mark blebbing; asterisk marks loss of signal). (g) Timelapse imaging of a microglia engulfing a nascent myelin sheath. (h) Analysis scheme for detecting myelin sheaths eliminated by phagocytosis or retraction. Timelapse frames (left) are processed by consecutive exclusive-or (XOR) calculation to generate an image of lost sheaths (cyan); those engulfed by microglia are engulfed (closed arrowheads) whereas those lost but not contacted are retracted. (i) Paired comparison of number of sheaths lost by engulfment and retraction in 3 h in 30 microglia from 30 animals. Each pair-connected line is one animal; Wilcox-rank sum test. (j) Relative fractions of sheaths across all timelapse acquisitions that were engulfed or retracted. (k) Lengths of sheaths eliminated by engulfment vs retraction; Wilcox rank-sum test (n=135 sheaths from 30 cells/30 fish). (l) Representative example of myelin sheaths in mbpa+ oligodendrocytes eliminated by microglia. (m, n) Immunohistochemistry and quantification of anti-Mbp (cyan) inclusions within microglia in animals carrying Tg(mbpa:mCherry-CAAX) to label oligodendrocyte membrane. n=44 mCherry-CAAX+ inclusions in 11 cells in 7 fish. All scale bars, 10 um.
To investigate phagocytosis of myelin sheaths directly, we next performed timelapse imaging in 4 dpf Tg(mpeg1.1:mVenus-CAAX; sox10:mRFP) larvae. Similar to our observations of apparent sheath loss following calcium events (Fig. 2f), our timelapse imaging experiments captured occasional whole-sheath engulfment events by microglia (Fig. 2g, Supplementary Video 5). To determine the relative proportion of sheaths eliminated by engulfment and retraction, we performed timelapse imaging of microglia and their surrounding 3.5 hemisegment territory for 3 h. To identify sheaths that disappeared during timelapse in an semi-automatic and unbiased way, we used the myelin channel frames to generate a series of images in which the exclusive-or (XOR) operation is performed on consecutive frames, creating a series of the signals that change over time (see Methods, Supplementary Table 2). Summing these XOR frames and merging with the time-summed myelin channel identified sheaths that disappeared over time, while keeping us blinded to microglia location and thus sheath association (Fig. 2h). Tagged sheaths were then tracked in the original timelapse to detect microglial engulfment or lack of microglial contact (retraction). We found that although both engulfment and retraction contribute to sheath elimination, microglia engulfment accounted for the majority (~70%) of sheath elimination at this stage (Fig. 2i, j). Furthermore, sheaths engulfed by microglia were longer than those that were retracted (Fig. 2k), raising the possibility that engulfment targets more mature sheaths. Consistent with this possibility, timelapse imaging of microglia interacting with mbpa+ oligodendrocytes revealed similar sheath engulfment (Fig. 2l). We validated these observations of myelin phagocytosis using an alternative method to visualize myelin within microglia. Specifically, we performed immunohistochemistry to detect myelin basic protein (Mbp) in tissue obtained from Tg(mpeg1.1:mVenus-CAAX; mbpa:mCherry-CAAX) larvae. Nearly all mCherry-CAAX inclusions in microglia were Mbp+, indicating that mCherry-CAAX inclusions represent phagocytosed myelin in living larvae (Fig. 2m, n, Extended Fig. 2).
Following engulfment, fluorescent material was only briefly visible within microglia before fluorescence disappears, limiting our ability to estimate the fraction of microglia that phagocytose myelin during development (Fig. 3a). This rapid disappearance likely results from degradation by phagosome acidification. We therefore predicted that inhibiting the acidification of phagosomes would delay the breakdown of phagocytosed myelin and allow us to determine the fraction of microglia that phagocytose myelin membrane (Fig. 3a, b). To inhibit phagosome acidification, we treated 4 dpf larvae with bafilomycin A1 for 1 h prior to imaging. Microglia in Tg(mpeg1.1:mVenus-CAAX; mbpa:mCherry-CAAX) larvae treated with bafilomycin had more and brighter myelin inclusions than microglia of larvae treated with vehicle (Fig. 3b). We confirmed that myelin inclusions were contained within microglia by viewing cells in 3D (Supplementary Video 6). Morphological segmentation allowed us to obtain measurements of these inclusions (Fig. 3c). We found that when larvae were treated with DMSO control, myelin inclusions were evident in about 2/3 of all microglia, with the remaining 1/3 containing no detectable inclusions. However, treatment with bafilomycin to acutely delay myelin breakdown revealed that all microglia contained myelin inclusions, suggesting that all spinal cord microglia participate in myelin pruning by phagocytosis (Fig. 3d). Bafilomycin did not change the area of individual inclusions (Fig. 3e), but the total area of inclusions per microglia was increased (Fig. 3f), consistent with stalled myelin breakdown within microglia. Because oligodendrocytes can start myelinating at any time between 4 and 8 dpf, we also tested whether myelin phagocytosis detectable by bafilomycin might change over developmental time. We found no difference in the number of myelin inclusions per microglia at 4, 5, or 8 dpf, consistent with continuous myelin pruning by microglia over the course of developmental myelination (Fig. 3g).
Figure 3. Microglia phagocytose myelin sheaths with minimal phagocytosis of oligodendrocyte somas.

(a) Strategy for delaying the breakdown of phagocytosed myelin with bafilomycin A1. (b) Microglia in Tg(mpeg1.1:mVenus-CAAX; mbpa:mCherry-CAAX) larvae treated with DMSO or bafilomycin (1 μm) for 1 hour prior to imaging. Arrowheads mark round myelin inclusions inside microglia. (c) Example sum-projected image of a microglia containing mRFP inclusions (top) with morphological segmentation performed using MorphoLibJ to identify inclusions (bottom). (d) Histogram depicting the number of myelin inclusions per microglia in DMSO and bafilomycin-treated larva. (e-g) Morphological segmentation on sum-projected images of microglia in 4 dpf Tg(mpeg1.1:mVenus-CAAX; mbpa:mCherry-CAAX) larvae that were treated with either DMSO or bafilomycin prior to imaging. Each point represents one inclusion (e) or microglia (f, g); points shaded so overlapping points are visible (DMSO, n=22 cells from 22 larvae containing 48 inclusions; bafilomycin, n=22 cells/22 larvae/175 inclusions). (e) Area (μm2) of myelin inclusions inside microglia, Wilcox rank-sum test. (f) Total myelin inclusion area (μm2) per microglia, Wilcox rank-sum test. (g) Number of myelin inclusions per microglia in bafilomycin-treated larvae over the course of developmental myelination (4–8 dpf). Kruskal-Wallis test, n=fish/cells/inclusions, n=10/10/74 4 dpf, 9/9/79 5 dpf, 12/12/101 8 dpf. (h) Max-projection images of spinal cord oligodendrocytes (magenta) in larvae treated with either DMSO or bafilomycin A1 and live-stained with acridine orange (green). (i-k) Quantification of mbpa+ cells (i), acridine orange cells (j), and mbpa+ cells stained by acridine orange (k) in 3.5 hemisegments and analyzed by Wilcox rank-sum test for n=fish/cells, n=14/602 DMSO, 16/742 bafilomycin. (l) Schematic of transgenic oligodendrocyte reporters that label either oligodendrocyte membrane (mCherry-CAAX) or cytosol (TagRFP). (m) Examples of microglia in either Tg(mpeg1.1:mVenus-CAAX; mbpa:mCherry-CAAX) or Tg(mpeg1.1:mVenus-CAAX; mbpa:TagRFP-T) 4 dpf larvae, treated with either DMSO or bafilomycin A1 prior to imaging. Arrowheads mark myelin inclusions. (n) Number of mCherry-CAAX and TagRFP inclusions per microglia in each of the four groups presented in (m), Wilcox rank-sum test (n=fish/cells/inclusions, n=12/12/18 mCherry-CAAX DMSO, 10/10/74 mCherry-CAAX bafilomycin, 6/6/0 TagRFP DMSO, 8/8/1 TagRFP bafilomycin). Scale bars, 10 μm.
Although we only observed microglial phagocytosis of individual myelin sheaths, in principle, microglia might also engulf entire oligodendrocytes. To investigate this possibility, we first labeled oligodendrocytes undergoing apoptosis using the vital dye acridine orange (Fig. 3h). We found that mbpa+ oligodendrocyte apoptosis was rare and that the frequency was not changed by bafilomycin (Fig. 3h–k, Extended Fig. 3). Therefore, dying oligodendrocytes are not likely the source of mCherry-CAAX inclusions in microglia. Next, we tested the possibility that microglia engulf entire live oligodendrocytes. To do so, we repeated our mCherry-CAAX engulfment experiments using an additional oligodendrocyte reporter line, Tg(mbpa:TagRFP-T), in which the same mbpa regulatory DNA drives expression of cytosolic TagRFP-T. Because most oligodendrocyte cytosol is extruded from myelin sheaths, this line primarily labels oligodendrocyte cell bodies (Fig. 3l). We predicted that if microglia phagocytose entire oligodendrocytes then this oligodendrocyte somatic label would also be detectable within microglia. However, we very rarely detected TagRFP-T within microglia in DMSO or bafilomycin-treated larvae (Fig. 3m, n). These data suggest that microglia specifically engulf myelin sheaths with negligible phagocytosis of oligodendrocyte cell bodies.
Myelin phagocytosis is bidirectionally regulated by neuronal activity
Microglia contact numerous myelin sheaths (Fig. 1f–j) but do not phagocytose all sheaths. What determines the amount of myelin that microglia phagocytose? Previous data showed that neuronal activity can both promote and suppress microglial interactions with cellular targets. For example, active neuronal cell bodies were more frequently contacted by microglia in zebrafish optic tectum10. By contrast, inhibiting retinal ganglion cell activity increased microglia engulfment of synapses from axons projecting to lateral geniculate nucleus12. Together, these observations suggest that elevated neuronal activity can shift microglia away from interaction with synapses and toward neuronal cell bodies. We therefore hypothesized that neuronal activity similarly tunes microglial interaction with neuronal cell bodies and myelinated axons, thereby regulating myelin sheath phagocytosis by microglia. To test this, we investigated microglia in the periventricular neuronal cell body layer of optic tectum (Fig. 4a, a’). Approximately 10 microglia occupy the cell body layer of each tectal hemisphere18, positioned between the somas of unmyelinated periventricular neurons and a separate population of heavily myelinated axons that comprise the tectal commissure19 (Fig. 4a, Supplementary Video 7). We thus tested the possibility that microglia interacting with active neuronal somas would be less likely to phagocytose myelin from the commissural axons, and conversely, that silencing cell body layer somas would predispose microglia to interact with and phagocytose commissural myelin.
Figure 4. Neuronal activity regulates microglia-neuron interactions.
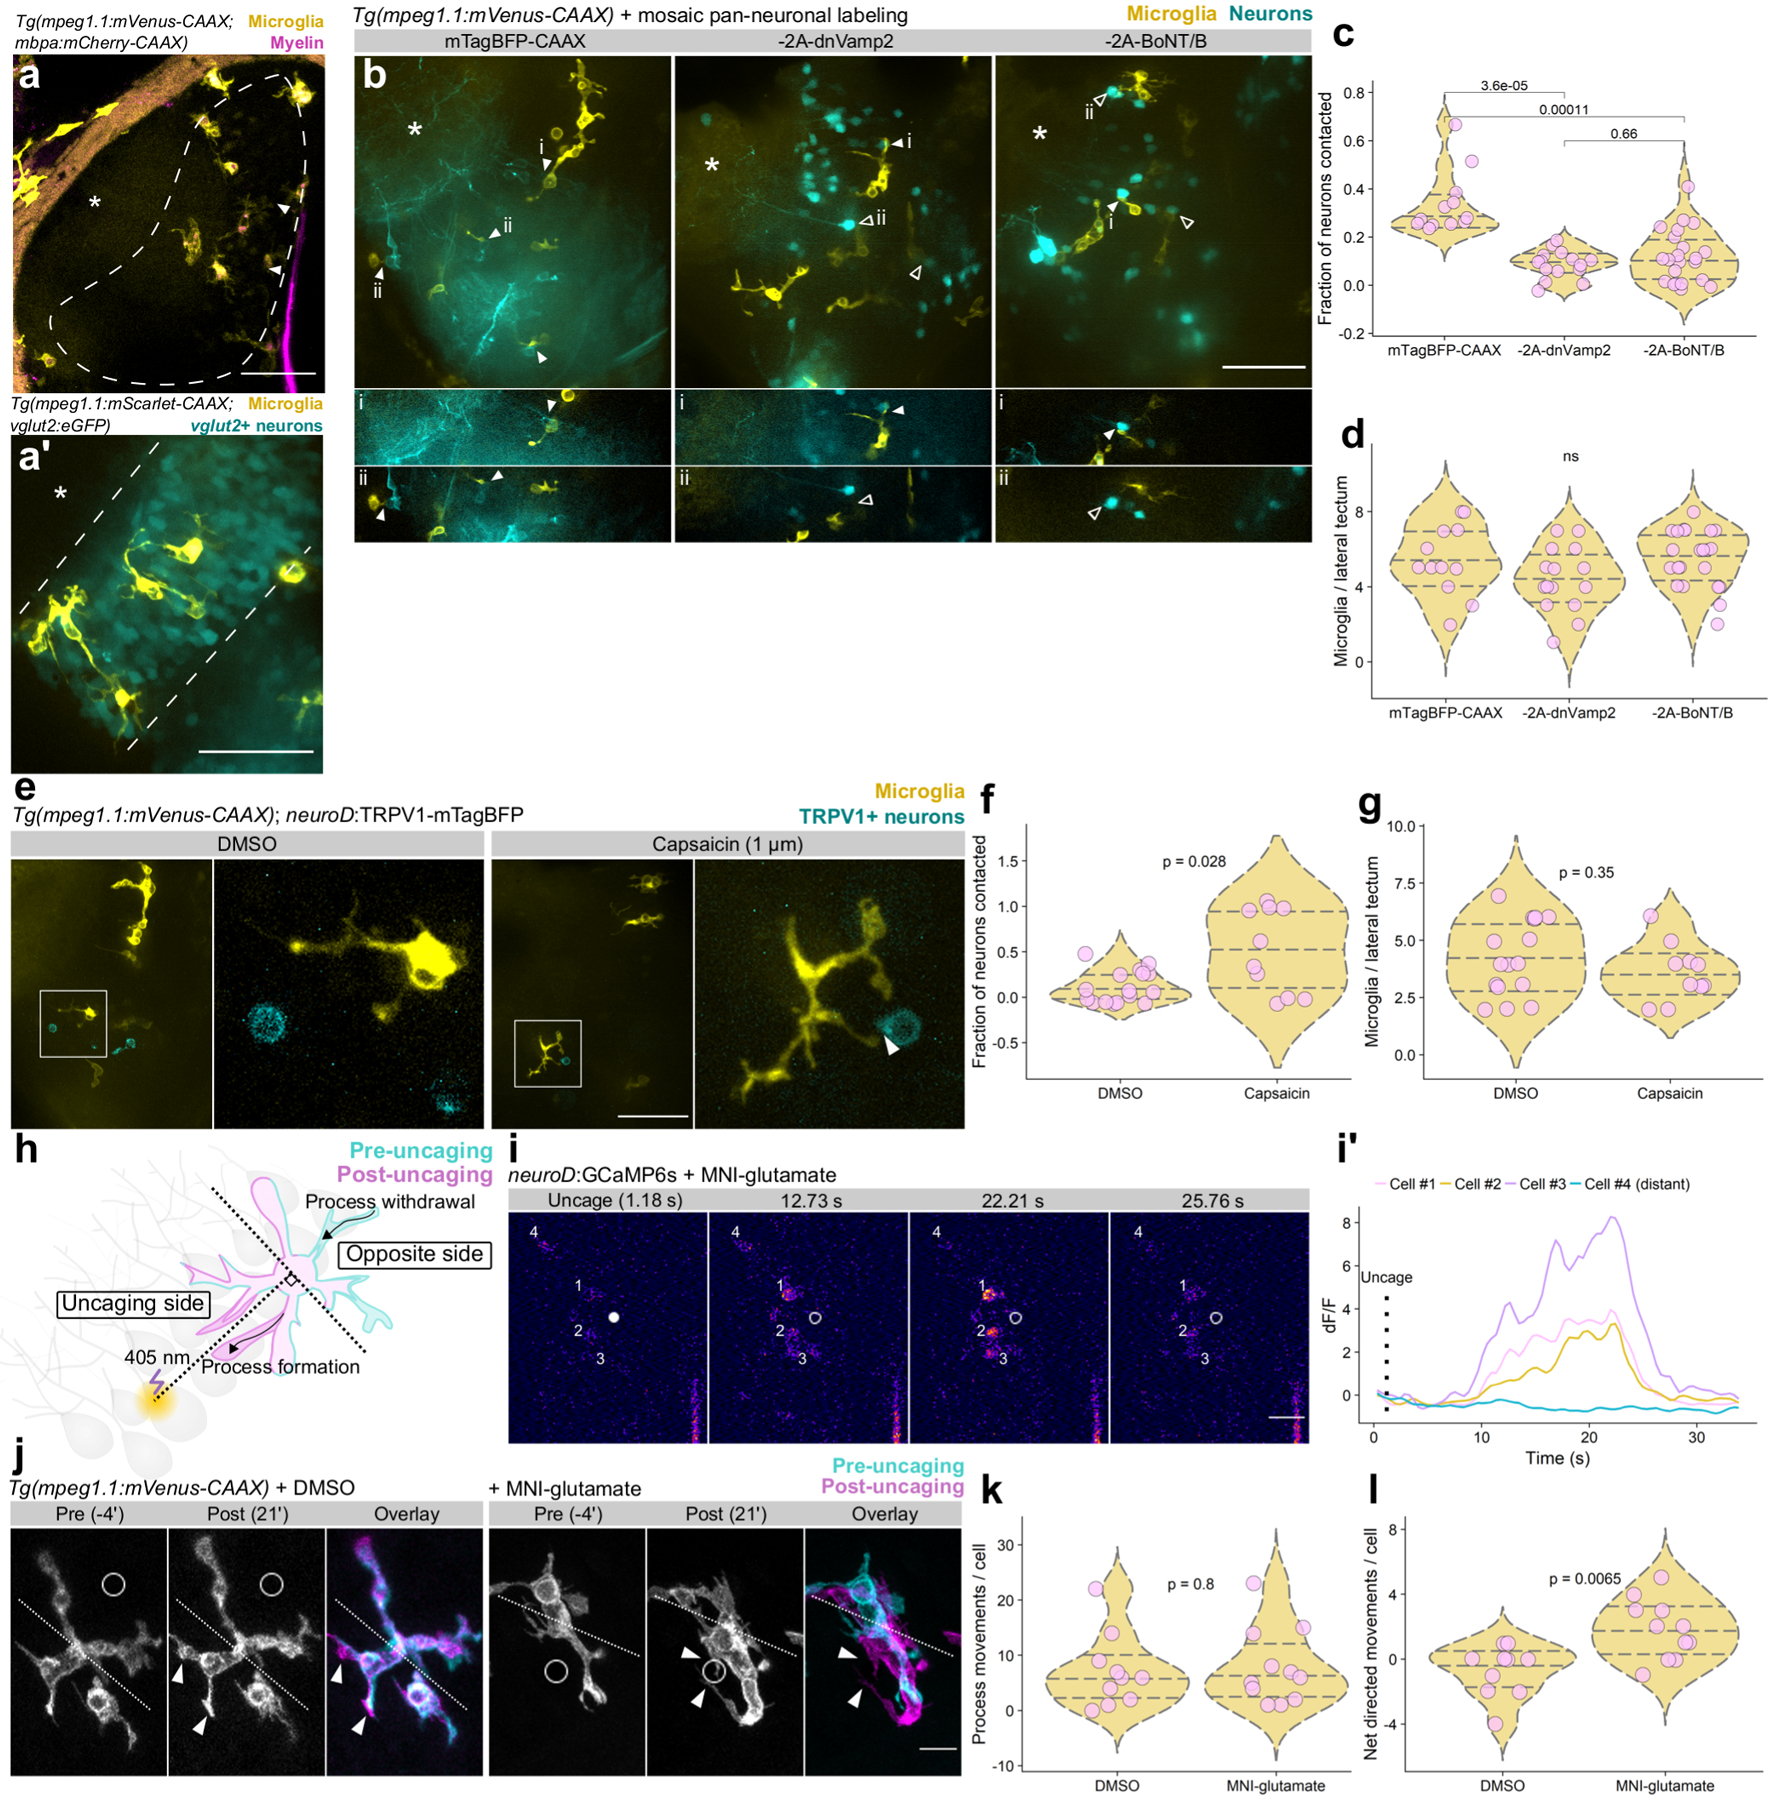
(a) Coronal view of microglia and myelin in one hemisphere of optic tectum in a live Tg(mpeg1.1:mVenus-CAAX; mbpa:mCherry-CAAX) 5 dpf larva. Dashed line marks the cell body layer, asterisks marks the neuropil layer, and arrowheads indicate the tectal commissure. (a’) Lateral view of microglia in the cell body layer. Microglia labeled by Tg(mpeg1.1:mScarlet-CAAX) and cell body layer glutamatergic neurons labeled by Tg(vglut2:eGFP). (a) and (a’) are representative images from 10 larvae. Scale bars, 50 μm. (b) Top panels, max projection images of optic tectum (lateral view) in Tg(mpeg1.1:mVenus-CAAX) larvae mosaically expressing neuroD:mTagBFP-CAAX or neuroD:mTagBFP-CAAX-2A-dnVamp2/BoNT/B (−2A-dnVamp2, −2A-BoNT/B). Panels below show single optical sections containing microglial-neuron contacts (closed arrowheads) or absence of contact (open arrowheads). Asterisks mark neuropil. Scale bar, 50 μm. (c) Fraction of neuron somas contacted per tectal field of view in each of the groups in (b), analyzed by Wilcox rank-sum test with Bonferroni-Holm correction for multiple comparisons. (d) Number of microglia per tectal field of view for each group in (b), analyzed by Kruskal-Wallis test. For (b-d), n=fish/neurons/microglia, n=12/166/65 mTagBFP-CAAX, 15/487/66 −2A-dnVamp2, 22/398/121 −2A-BoNT/B. (e) Max-projection images of microglia (yellow) and neurons sparsely expressing TRPV1-mTagBFP (cyan) in optic tectum of larvae treated with DMSO vehicle or 1 μm capsaicin. Closed arrowhead marks a microglia-neuron contact. Scale bar, 50 μm. (f, g) Quantification of the fraction of TRPV1-mTagBFP+ neurons contacted by microglia (f) and the number of microglia per lateral tectum field of view (g). Each dot represents one larval tectum, analyzed by Wilcox rank-sum test (n=fish/neurons, n=16/62 DMSO, 10/19 capsaicin). (h) Schematic of glutamate uncaging and analysis of microglial motility. (i, i’) Example frames of glutamate uncaging near neurons sparsely-labeled with GCaMP6s. Closed dot marks the point of uncaging, open dot shows the position after uncaging, and cell numbers match transient traces in (i’). Representative example from one of 9 larvae (Extended Fig. 4). Scale bar, 20 μm. (j) Timelapse imaging frames of microglia in larvae treated with DMSO vehicle or MNI-glutamate, before and after focal 405 nm uncaging at the open circle. Dotted line divides microglia into uncaging and opposite sides (described in (h)) and arrowheads indicate newly formed processes. Scale bar, 10 μm. (k, l) Total process extensions and retractions per cell in each group (k) and net movements toward the uncaging point (l). Wilcox rank-sum test, n=fish/microglia, n=10/10 DMSO, 11/11 MNI-glutamate.
We first tested the effects of manipulating neuronal activity on microglia interactions with neuronal somas. To do so, we silenced a subset of cell body layer neurons marked by fluorescent protein expression. Specifically, we injected 1-cell stage Tg(mpeg1.1:mVenus-CAAX; mbpa:mCherry-CAAX) embryos with a plasmid designed to bicistronically express dominant-negative Vamp2 (dnVamp2), a variant lacking the transmembrane domain, or botulinum toxin (BoNT/B) with mTagBFP-CAAX under control of a pan-neuronal driver. As a control, we mosaically labeled neurons with mTagBFP-CAAX alone. Because expression was mosaic pan-neuronal, we excluded larvae in which tectal commissure axons were labeled so that we could specifically test the role of cell body layer inhibition. We acquired z-stack confocal images of the tectal cell body layer at 4 dpf and determined the fraction of labeled neuronal somas contacted by microglia (Fig. 4b). Whereas neuronal inhibition did not change the number of microglia, microglia made fewer contacts on the cell bodies of inhibited neurons than on control neurons (Fig. 4c, d), consistent with the possibility that reducing neuronal activity reduces microglia interaction with somas.
To determine if neuronal activity biases microglia to contact somas, we mosaically activated cell body layer neurons by expressing the capsaicin-gated channel, TRPV1 (Rattus norvegicus) fused to mTagBFP in Tg(mpeg1.1:mVenus-CAAX) larvae. At 4 dpf, we treated larvae for 2 h with capsaicin (1 μM) to activate neurons expressing the channel, or with DMSO as a control, and then determined the fraction of TRPV1-mTagBFP+ neurons contacted by microglia. Neurons activated by capsaicin more frequently received somatic contact by microglia (Fig. 4e, f), despite an unchanged number of available microglia (Fig. 4g). To learn how microglia acutely respond to soma activation, we locally increased neuronal activity in the cell body layer by photouncaging MNI-glutamate (Fig. 4h). We determined that our uncaging protocol elicited neuronal Ca2+ transients in sparsely-labeled neuroD:GCaMP6s neurons most reliably within a 20 μm distance (Fig. 4i, i’, Extended Fig. 4), consistent with previous findings10. We then used this measurement to determine the distance between microglia and our uncaging target sites. We uncaged MNI-glutamate or DMSO control within 20 μm of microglia and performed timelapse imaging of process extension and retraction toward and away from the uncaging point (Fig. 4j, Supplementary Video 8). We found that microglia in both groups underwent the same number of process movements (Fig. 4k), but glutamate uncaging caused microglia to elaborate processes in the direction of uncaging and to retract processes from the opposite side (see Methods) (Fig. 4l, Supplementary Video 8). Together, these data demonstrate that activity bidirectionally governs microglial interactions with neuronal somas.
If neuronal activity regulates microglial interaction with neuronal somas, could activity also reciprocally determine microglial phagocytosis of myelin from the tectal commissure? To test this possibility, we measured the amount of myelin phagocytosed by microglia upon neuronal inhibition with dnVamp2 and BoNT/B (Fig. 5a). Similarly to spinal cord, optic tectum microglia contained phagocytosed myelin (Fig. 5a). However, when neurons were silenced with either dnVamp2 or BoNT/B, optic tectum and spinal cord microglia contained many more myelin inclusions (Fig. 5b), and the total area of myelin inclusions per microglia was increased (Fig. 5c), despite no appreciable changes in microglial area or the size of myelin inclusions (Fig. 5d, e). Together, these data indicate that microglia engulf more myelin from the tectal commissure when neuronal cell body layer activity is suppressed.
Figure 5. Neuronal activity regulates myelin phagocytosis by microglia.
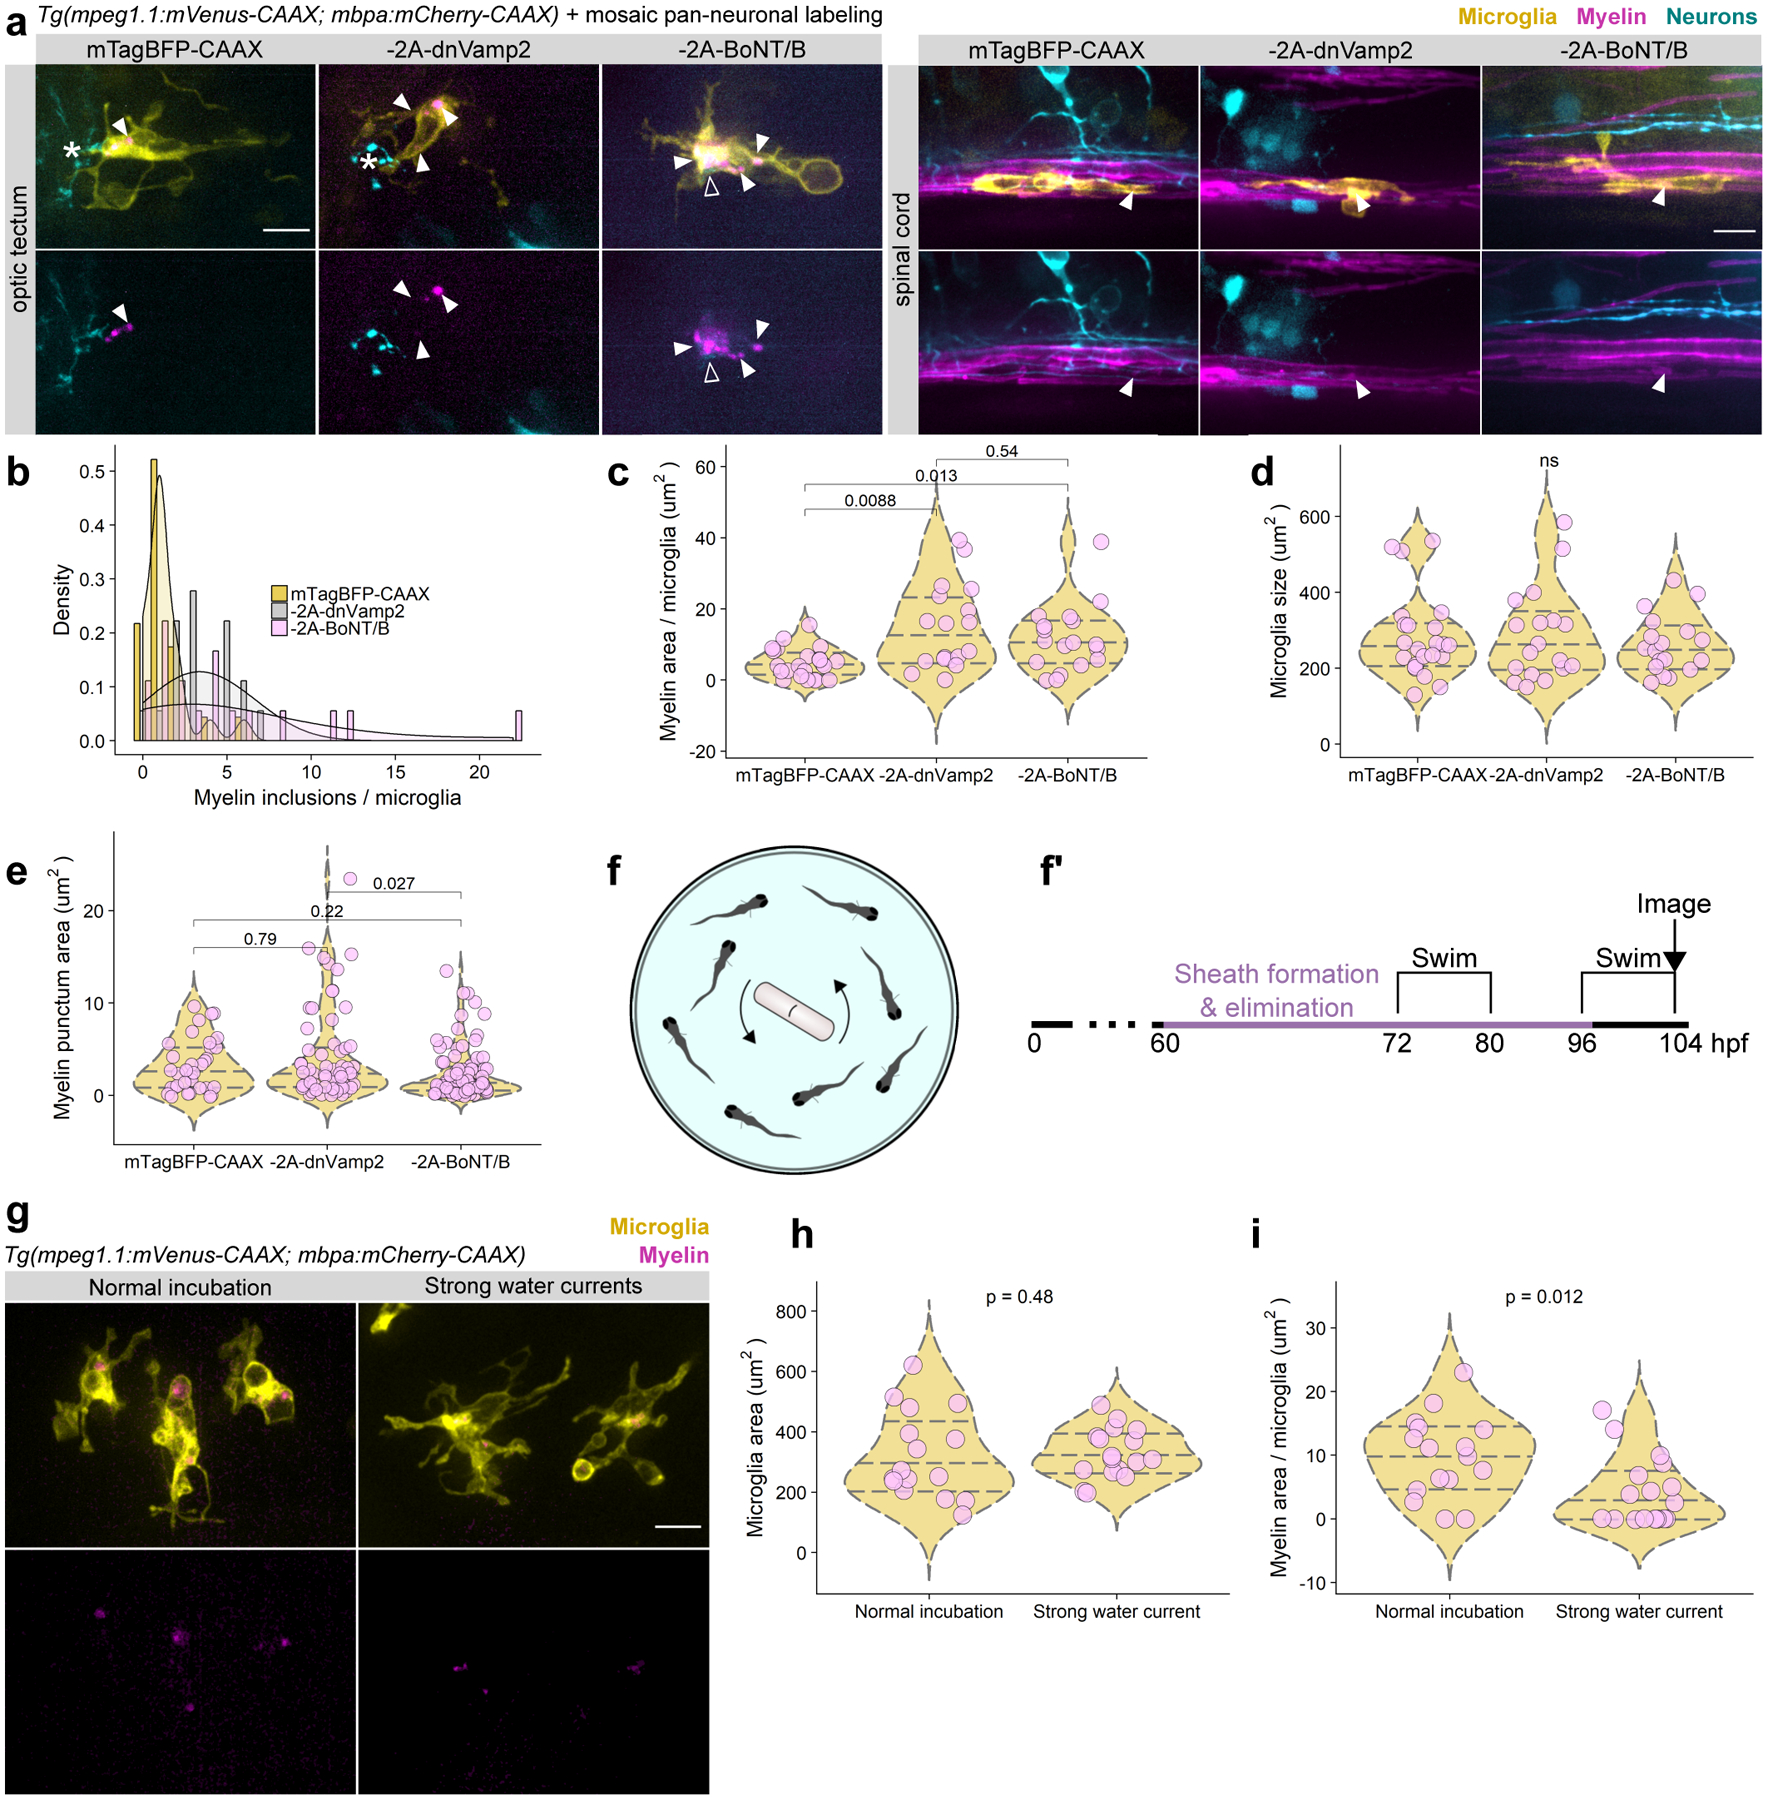
(a) Microglia in the optic tectum and spinal cord in larvae carrying Tg(mpeg1.1:mVenus-CAAX; mbpa:mCherry-CAAX) to label microglia and myelin and mosaically expressing either neuroD:mTagBFP-CAAX or neuroD:mTagBFP-CAAX-2A-dnVamp2/BoNT/B (−2A-dnVamp2, −2A-BoNT/B). Closed arrowheads mark myelin inclusions inside microglia (magenta); open arrowheads mark neuronal inclusions (cyan); asterisks mark microglial processes contacting neurons. Scale bars, 10 μm. (b-e) MorphoLibJ morphological segmentation on sum-projected images of optic tectum microglia in 4 dpf in each group in (a). Each point represents one microglia (c, d) or inclusion (e) (n=fish/microglia/inclusions, n=18/23/30 mTagBFP-CAAX, 18/18/63 −2A-dnVamp2, 18/18/87 −2A-BoNT/B). (b) Histogram depicting the number of myelin inclusions inside microglia. (c) Total myelin inclusion area per microglia, Wilcox rank-sum test with Bonferroni-Holm correction for multiple comparisons. (d) Microglia area, Kruskal-Wallis test. (e) Area of individual myelin inclusions inside microglia, Wilcox rank-sum test. (f, f’) Schematic and timeline of strong water current-induced forced swimming to increase neuronal activity in optic tectum. (g) Representative examples of microglia containing myelin inclusions in normal incubation and forced swim paradigms. Scale bar, 10 μm. (h, i) Microglia area (h) and myelin inclusion area (i) per cell in each group, Wilcox rank-sum test (n=fish/microglia, n=12/16 normal, 13/17 strong currents).
To test if sustained increased activity in the cell body layer is sufficient to reduce myelin phagocytosis from the tectal commissure, we used a strong water current paradigm, in which a magnetic stir bar generates strong water currents that force larvae to orient themselves and swim against the currents. Such visuomotor behaviors activate optic tectum20 and this specific paradigm upregulated proteins associated with the optic tectum, consistent with tectal activation21. We placed Tg(mpeg1.1:mVenus-CAAX; mbpa:mCherry-CAAX) larvae in strong water currents for two consecutive days, followed immediately by live-imaging of myelin inclusions in tectal microglia (Fig. 5f–g). We found that exposing larvae to strong water currents did not alter the morphology or size of tectal microglia (Fig. 5h), but microglia engulfed less myelin (Fig. 5i). Taken together with our observations that microglia engulfed more myelin upon inhibition of cell body layer neurons (Fig. 5a–c), these data suggest that microglia phagocytose myelin in a bidirectional neuronal activity-regulated manner.
Microglia regulate myelin targeting by oligodendrocytes
Microglia eliminate some, but not all myelin sheaths (Fig. 2), and microglia phagocytose myelin in a neuronal activity-regulated manner (Fig. 4, 5). Does microglial myelin phagocytosis refine myelin sheath number or targeting? To answer this, we eliminated microglia using three independent approaches and measured myelination by individual oligodendrocytes (Fig. 6a, b). First, we used an antisense morpholino oligonucleotide (MO) designed to block translation of mRNA encoding interferon regulatory factor-8 (Irf8), which is required for macrophage specification and microglia development22. Second, we targeted Csf1r function, which is required for macrophage invasion of the CNS and microglial distribution23, by using a Csf1r inhibitor that has been used previously in larval zebrafish24. Because both of these methods eliminate microglia early in development, and microglia support OPC development25,26, we took a third strategy to eliminate microglia specifically after myelination onset. We generated a transgenic line, Tg(mpeg1.1:NTR-IRES-eGFP-CAAX), in which microglia express an enhanced variant of E.coli nitroreductase (NfsBT41Q/N71S/F124T) (NTR) to induce mpeg1.1+ cell death upon treating larva with the actuator, metronidazole. We quantified microglial ablation by each of these three strategies by adapting a neutral red assay previously used for quantifying microglia23 and determined that they eliminate ~95, ~45, and ~75% of microglia, respectively (Fig. 6c, d).
Figure 6. Microglial ablation during myelination increases myelin sheath number.

(a) Schematic of microglial development and three approaches to ablate microglia. (b) Timeline for labeling individual oligodendrocytes by microinjection at the 1-cell stage and ablating microglia either by coinjection with Irf8 translation blocking morpholino, treatment with Csf1r inhibitor GW2580, or nitroreductase (NTR) treatment with metronidazole (Mtz). (c) Brightfield images of live neutral red-stained larvae in each of three ablation groups. Arrowheads mark examples of neutral red-labeled microglia in optic tectum (small red dots). Scale bar, 100 μm. (d) Quantification of neutral red-labeled microglia in the optic tectum of larvae in each group. Each dot represents the microglia count in one larva. Wilcox rank-sum test, left to right, n=fish/microglia, n=10/319, 15/35, 12/357, 11/206, 10/296, 10/279, 10/288, 16/120. (e) Example spinal cord oligodendrocytes labeled by myrf:mScarlet-CAAX in each group. Asterisks mark oligodendrocyte somas and arrowheads indicate myelinated cell bodies. Scale bar, 10 μm. (f, g, h) Quantification of sheath number (f), length (g), and ectopic soma wraps (h, example in (e)) in each group. Each point represents one oligodendrocyte (f), sheath (g), or soma wrap (h). Wilcox rank-sum test, left to right, n=cells/fish/sheaths, n=15/15/163, 27/27/503, 15/15/156, 16/16/229, 12/12/121, 11/11/124, 15/15/139, 15/15/223). Scale bars, 10 μm.
To assess how microglia might refine myelin sheath formation, we examined formation of myelin sheaths by individual oligodendrocytes in larvae in which microglia were eliminated using these approaches. To do so, we microinjected Tol2.myrf:mScarlet-CAAX DNA into 1-cell stage embryos to scatter-label oligodendrocytes via Tol2-mediated transgenesis (Fig. 6b). At 104 hpf, we imaged oligodendrocytes in each of the eight groups (Fig. 6e, Extended Fig. 5a). We found that microglial depletion did not change mbpa+ oligodendrocyte number or distribution (Extended Fig. 5b,c). However, tracing myelin sheaths formed by individual oligodendrocytes revealed that upon microglial depletion (Irf8 MO, GW2580, NTR+/metronidazole) oligodendrocytes had more sheaths than oligodendrocytes in corresponding control groups (Fig. 6e, 6f) and these sheaths were also shorter in length (Fig. 6g). Furthermore, oligodendrocytes in the two severe depletion groups (Irf8 MO, NTR+/metronidazole) formed a number of spherical ensheathments, a phenomenon recently described as ectopic ensheathment of neuronal cell bodies27 (Fig. 6h). These data indicate that microglial sheath pruning corrects myelin targeting and refines myelination by oligodendrocytes.
DISCUSSION
Our work identifies microglia as mediators of myelin refinement by pruning sheaths during development. Previous work established that microglial signaling to adhesion G protein-coupled receptors on oligodendrocyte precursor cells (OPCs) promotes their differentiation, survival, and myelinogenesis25,26. Recently, single cell RNA-seq analysis of rodent microglia detected Mbp mRNA, a myelin transcript that is enriched in myelin sheaths, within white matter microglia28. This finding raised the possibility that microglia also engulf myelin under normal physiological conditions. By directly observing microglia-myelin interactions over development, we have discovered that microglia selectively phagocytose myelin sheaths to sculpt myelination.
What regulates the amount of myelin phagocytosed by microglia? We tested the possibility that neuronal activity regulates myelin engulfment and found that microglial myelin phagocytosis is increased upon neuronal silencing and decreased with activation (Fig. 5). This is reminiscent of previous studies that showed reducing neuronal activity limits myelin coverage of axons and increasing activity can bias axons for myelination and promote myelin growth3,4. Our work suggests that myelin plasticity is not confined to the axon-myelin unit but is additionally modifiable by other cell types, including microglia. How might microglia locate developing myelinated tracts? Volume transmission of extra-synaptic ATP from axons to oligodendrocyte lineage cells has been hypothesized to promote the myelination of white matter tracts29. In addition to signaling to oligodendrocyte lineage cells, ATP is sufficient to promote microglial translocation30 and process extension in zebrafish optic tectum10. If such volume cues to OPCs also are sensed by microglia, ATP might regulate myelination by steering microglia toward or away from target neurons. Our work in the optic tectum suggested that the activity of one population of neurons, those in the periventricular cell body layer, dictated the microglial phagocytosis of myelin from a different population of axons, those in the tectal commissure (Fig. 5). This raises the intriguing possibility that the firing patterns of specific populations of neurons may regulate the myelination of nearby populations by directing microglial target interactions, perhaps contributing to the stereotyped myelination patterns of different axon tracts (Extended Fig. 6).
If microglia contribute to myelin plasticity, then brain regions with different densities of microglia, or different microglial states, might exhibit differences in myelin plasticity. During the larval stages we examined, microglia are present in the retina and optic tectum, and sparsely in the spinal cord and forebrain, but are largely absent from other regions23. Recent work indicates that the myelination of at least one population of spinal cord neurons, the commissural primary ascending (CoPA) interneurons, is myelinated despite expression of tetanus neurotoxin to suppress activity31. CoPA axons project within the DLF and are myelinated earlier than other neuron types32. One possibility for the insensitivity of CoPA myelination to silenced neuronal activity is that very few dorsal microglia are present at this stage (Fig. 1a, b), possibly preventing activity-regulated myelin phagocytosis. Somewhat conversely, treating mice with clinically-relevant doses of methotrexate, a chemotherapeutic agent that induces persistent inflammatory microglia (CD68+, Iba1+), was sufficient to counteract activity-dependent myelin growth upon optogenetic stimulation3,33. Together, these data support a role for microglial availability and state in regulating the dynamic range of activity-dependent myelination available to different brain regions.
Previously, the elimination of nascent myelin wraps was attributed to oligodendrocyte membrane resorption, a process referred to as “retraction”1,2,34,35. Here, we have shown that microglia also participate in myelin refinement by phagocytosing myelin sheaths (Fig. 2h–k). How do cell autonomous process retraction and microglial pruning work together to guide myelin patterning during development? We have learned some properties of microglia-myelin interactions that may distinguish roles for each of these mechanisms. A larval zebrafish that has ~160 oligodendrocytes in the spinal cord may elaborate upwards of 2400 nascent wraps prior to elimination. It is thus unlikely that the ~12 spinal cord microglia (Fig. 1b) are numerous and motile enough to assess each nascent wrapping attempt. Indeed, extrapolating from our timelapse motility data, the average number of processes per microglia and the number of microglia, we estimate that spinal microglia contact ~1600 sheaths over a 24 h period. However, nearly all microglia we examined contained phagocytosed, Mbp+ myelin (Fig. 2m, n, Extended Fig. 2) and microglial depletion consistently increased sheath number and ectopic wrapping (Fig. 6). Additionally, the activity-regulated effects on myelin phagocytosis we describe here are similar to effects reported on sheath retraction, with neuronal silencing both increasing myelin elimination by phagocytosis (Fig. 5) and nascent sheath retraction1. Together, these observations suggest that microglial myelin pruning complements autonomous retraction of newly forming myelin sheaths. Why might multiple mechanisms be necessary to eliminate nascent myelin? During wrapping, synthesized myelin is thought to spread over the axon surface like a liquid droplet36, raising the possibility that oligodendrocyte processes that begin synthesizing myelin may not be easily retracted. Additionally, the formation of adhesive contacts between nascent sheaths and axons may preclude facile withdrawal37,38, requiring pruning to disrupt attachment. Consistent with these possibilities, we found that sheaths engulfed by microglia were longer than those that were retracted (Fig. 2k). These observations raise the possibility that microglial myelin elimination extends the period of elimination after a developmental window for autonomous retraction has closed, perhaps due to the fluidity or adhesion of myelin.
What molecular cues might regulate phagocytosis? Mice deficient for multiple components of the classical branch of the complement cascade had extra synapses39 and reduced synapse engulfment by microglia12, raising the possibility that complement may also tag myelin sheaths for elimination. Consistent with this possibility, the outer lamellar myelin protein myelin oligodendrocyte glycoprotein (MOG) binds the complement initiator C1q directly40, myelin phagocytosis in vitro was augmented by complement41, and multiple sclerosis lesions in postmortem brain tissue were immunoreactive for C3d, a cleavage product of complement component C342. However, just as recent work indicates that microglial synapse engulfment is complement-independent in some brain regions43, studies of myelin phagocytosis have produced a number of complement-independent candidates that also appear to regulate myelin phagocytosis, including Fc-receptor gamma and scavenger receptor-AI/II44. Identifying the cues responsible for directing myelin removal, and the possibility that such a code may also be used by synapses, will likely inform strategies for treating myelin phagocytosis in disease.
Microglia are increasingly recognized for their roles in normal CNS development. Within the last two decades, we have learned that microglia dynamically survey their environment in the absence of injury45, in a manner that was recently unveiled to be directed by local noradrenergic tone46,47. Microglial interactions with both neurons and glia support development of the nervous system by eliminating structures and secreting trophic factors12,48, influenced by and potentially contributing to regionalization of the brain49. Recently, a 10 month-old patient with a lethal mutation in CSF1R, a receptor required for microglial survival, was found to lack microglia and had epilepsy, agenesis of the corpus callosum, and leukodystrophy, underscoring the important and numerous roles that microglia serve in development of the nervous system50. By revealing that microglia tune CNS myelination, our study now raises the possibility that interactions between microglia, neurons, and oligodendrocytes contribute to the development of brain function.
METHODS
Zebrafish lines and husbandry
All animal work was approved by the Institutional Animal Care and Use Committee at the University of Colorado School of Medicine. Zebrafish embryos were raised at 28.5°C in embryo medium and staged according to hours or days post fertilization (hpf/dpf) and morphological criteria51.
We used the previously established transgenic lines Tg(sox10:mRFP)vu234, Tg(mbpa:tagRFP)co25, Tg(vglut2:eGFP)52, and Tg(mbpa:mCherry-CAAX)co13.
We also generated and used the new lines Tg(mpeg1.1:mVenus-CAAX)co56, Tg(mpeg1.1:NTR-IRES-eGFP-CAAX)co57, Tg(mpeg1.1:mScarlet-CAAX)co62, and Tg(mpeg1.1:GCaMP6s-CAAX)co65. All other reporters were expressed by transient transgenesis to achieve sparse labeling.
Plasmid construction and generation of transgenic zebrafish
Tol2 expression plasmids were generated by Multisite Gateway cloning and injected into 1-cell embryos with Tol2 mRNA to generate transient transgenic animals. The following entry clones53 were used in LR recombination reactions to generate expression plasmids:
p5E-neuroD, p5E-myrf, p5E-mpeg1.154
pME-NTR (NfsBT41Q/N71S/F124T)55, pME-mTagBFP-CAAX no stop, pME-mTagBFP-CAAX with stop, pME-mVenus-CAAX, pME-mScarlet-CAAX, pME-GCaMP6s-CAAX38, pME-GCaMP6s, pME-TRPV1 (Rattus norvegicus)56
p3E-polyA, p3E-2A-dnVamp238, p3E-2A-BoNT/B38, p3E-IRES-eGFP-CAAX, p3E-mTagBFP
pDEST-Tol2-pA, pDEST-Tol2-CG2 (green heart marker), pDEST-Tol2-CR2 (red heart marker)
To generate pME-GCaMP6s and pME-TRPV1 we PCR amplified attB1-attB2 flanked coding sequences of GCaMP6s and TRPV1 using templates pGP-CMV-GCaMP6s (Addgene #40753) and UAS:TRPV1-TagRFP56 and the following primers:
attB1-GCaMP6s: GGGGACAAGTTTGTACAAAAAAGCAGGCTACCATGGGTTCTCATCATCATCA
attB2-GCaMP6s: GGGGACCACTTTGTACAAGAAAGCTGGGTTCTTCGCTGTCATCATTTGTACA
attB1-TRPV1: GGGGACAAGTTTGTACAAAAAAGCAGGCTACCATGGAACAACGGGCTAGCTTA
attB2-TRPV1: GGGGACCACTTTGTACAAGAAAGCTGGGTTTTTCTCCCCTGGGACCATGG
attB1-attB2-flanked amplicons were gel purified, recombined with pDONR-221 to generate pMEs, Sanger sequenced, and then LR-recombined with entry vectors to generate Tol2 expression plasmids neuroD:GCaMP6s-pA-CR2 and neuroD:TRPV1-mTagBFP-pA-CR2.
Drug treatments
Bafilomycin A1 (Tocris, cat. 1334) was diluted in DMSO and larvae were treated with 1 μM in embryo medium for 1 hour at 28.5° before mounting larvae in agarose for live imaging. An equivalent volume of DMSO (0.1%) was used as vehicle control.
Metronidazole (Sigma, M1547) was diluted to 10 mM in 0.1% DMSO in embryo medium immediately prior to use for nitroreductase-mediated cell ablation55. Metronidazole is light sensitive, so all four treatment groups were kept in the incubator in the dark starting at administration (80 hpf).
Neutral red (Sigma, N7005) was diluted to 2.5 μg/ml in embryo medium and administered to 4 dpf larvae, raised in 0.003% PTU (Sigma, P7629) to prevent pigmentation, for 2.5 hours at 28.5° in the dark23,57. Following staining, larvae were washed 2–3 times in fresh media and monitored until nonspecific tissue redness washed out (30 min-1 hour) before mounting larvae dorsal-down in low-melt agarose for widefield, brightfield imaging (10x) of optic tectum microglia.
GW2580 (ApexBio, A1655) was diluted in DMSO and administered at 100 μm in embryo medium to 48 hpf larvae with drug refresh every 24 h. An equivalent volume of DMSO (0.2%) was used as vehicle control.
Capsaicin (Sigma, M2028) was diluted in DMSO and administered at 1 μm in embryo medium 2 h prior to imaging. An equivalent volume of DMSO (0.1%) was used as vehicle control.
MNI-glutamate (Tocris, cat. 1490) was diluted in DMSO to 50 mM and administered at 1 μm in embryo medium 1 h prior to imaging. An equivalent volume of DMSO (0.02%) was used as vehicle control. After 1 h, a small incision was made to larval tails to assist pancuronium bromide NMJ paralysis for timelapse imaging (see Imaging & image analysis). Larvae were kept in the dark as much as possible during treatment, paralysis, and agarose mounting. MNI-glutamate and DMSO were focally uncaged with a 405 nm laser applied to a circular ROI (~2.5 μm radius) in the center of the acquired z-stack (microglia) or in the same plane of imaging (neurons).
Acridine orange (Sigma, A6014) was diluted in embryo medium to 3 μg/ml and larvae were treated for 30 min, washed twice, and immediately live-imaged58.
Strong water currents / forced swim paradigm
Larvae were placed in 30 mm dishes with or without a stir bar and maintained at 28.5° on a stir plate at 350 rpm for 8 hours a day for two consecutive days, at 3 and 4 dpf21, followed immediately by live-imaging of myelin inclusions in tectal microglia.
Morpholino injection
A published translation-blocking antisense morpholino oligodendrocyte directed against Irf859 (GeneTools) (TCAGTCTGCGACCGCCCGAGTTCAT) was diluted to 2 mM in water and used to prepare a 1.5 ng/nl injection solution that also contained Tol2 mRNA and Tol2.myrf:mScarlet-CAAX DNA for oligodendrocyte labeling. 3 nl of injection solution was injected into the yolk of 1-cell stage embryos. Control injection solution was similar except morpholino was replaced with an equivalent volume of water.
Immunohistochemistry
6 dpf Tg(mpeg1.1:mVenus-CAAX; mbpa:mCherry-CAAX) larvae were fixed at 4 °C overnight in 4% paraformaldehyde/1X PBS. Larvae were washed in PBS and embedded in 1.5% agar/30% sucrose blocks placed in 30% sucrose overnight at 4 °C. Blocks were frozen in 2-methyl butane chilled by immersion in liquid nitrogen. 20 μm sections were cut and collected on microscope slides. Sections were rehydrated with PBS, washed with PBS containing 0.1% Triton X-100 (PBSTx), and then blocked with 2% goat serum/2% bovine serum albumin in PBSTx for 1 h at room temperature. Rabbit anti-Mbpa antibody60 was applied at 1:200 dilution in blocking solution overnight at 4 °C. The sections were washed with PBSTx and then incubated with Alexa Fluor 647 goat anti-rabbit antibody (Jackson ImmunoResearch, 111-606-044) at 1:200 dilution in blocking solution for 2 h at room temperature. Slides were washed again with PBSTx, covered with Vectashield, and coverslipped.
Statistics & Reproducibility
All statistics were performed in R (version 3.4.1) with RStudio. Plots were generated using dplyr and ggplot2 packages with cowplot package formatting and all statistical tests were performed using ggpubr functions. We used the two-tailed Wilcox rank-sum test (Mann-Whitney), with no assumption of normality, for all unpaired comparisons. For multiple comparisons, we first assessed global significance using the Kruskal-Wallis test, followed by pairwise Wilcox rank-sum tests with Bonferroni-Holm correction for multiple comparisons. Violin plots and box plots show quantiles (25, 50, 75%) with the central line marking the median. Violin plot colors are not meaningful and only the axes specify the groups. For other plot types, including stacked bar plots and histograms, legends are provided to explain grouping colors. We considered p<0.05 the threshold for statistical significance and provided exact p-values; p-values > 0.05 are listed as ns. All representative images that are shown are derived from the data sets analyzed, so the number of n biological replicates is the number of times each imaging experiment was performed. Embryos and larvae were randomly allocated to groups. All image analysis was performed blind by using the Fiji plugin Lab-utility-plugins/blind-files. Image acquisition was not blinded but identical anatomical regions were imaged in all larvae.
Imaging & image analysis
We performed live-imaging on larvae embedded in 1.2% low-melt agarose containing either 0.02% tricaine or 0.3 mg/ml pancuronium bromide (Sigma, P1918) for immobilization. We acquired images using a Plan Apochromat 20x/0.8 NA (with 1.6x optivar) air, C-Apochromat 40x/1.1 NA water, and 63x/1.2 NA water immersion objectives on a Zeiss LSM 880 and a Zeiss CellObserver Spinning Disk confocal system equipped with a Photometrics Prime 95B camera. We collected images of neutral red-stained larvae using a Zeiss AxioObserver microscope. After collecting images with Zen (Carl Zeiss), we performed all processing and analysis using Fiji/ImageJ.
Neuronal calcium imaging
Embryos were injected at the 1-cell stage with Tol2 mRNA and Tol2.neuroD:GCaMP6s. Mosaically-labeled neurons in the hindbrain and midbrain were imaged at ~4 Hz for 50 s following uncaging of MNI-glutamate or DMSO. Identifiable cell bodies were traced in Fiji, along with a background ROI, and mean fluorescence intensity values for each cell at each time point were background-subtracted and divided by the average fluorescence intensity of frames prior to uncaging (baseline) to generate dF/F values. We considered dF/F events over 0.5 as transients, which generally correlated with visible changes in GCaMP6s fluorescence. The distance of each cell centroid to the uncaging point was measured by linear ROI to determine the distance of cells vs likelihood of exhibiting a transient in response to uncaging.
Microglia calcium imaging
4 dpf larvae were timelapse-imaged using a 20x air objective with 1.6x optivar. Z-stacks of 5 slices with Nyquist (oversampled) spacing were acquired every 5–20 s for 10–20 min. Single-channel images were processed in AQuA61 (Fiji) with parameters listed in Supplementary Table 3. For mScarlet-CAAX events, all events were used for analysis. Following determination that most of these membrane “events” fell below dF/F <0.05, we filtered GCaMP6s-CAAX events such that dF/F >0.05. A smaller filtered dataset, containing only events with dF/F > 0.10 and area > 3 μm2 was generated in R and used to assess sheath-contacting and non-contacting process transients.
Sheath engulfment vs retraction analysis
Tg(mpeg1.1:mVenus-CAAX; sox10:mRFP) 4 dpf larvae were timelapse-imaged using a 20x air objective with 1.6x optivar (spinning disk details). Z-stacks of uniform (Nyquist) slice number and spacing were acquired in the spinal cord every 10–15 min for 3 hours. At each time point, slices were sum-projected to preserve all signal for intensity-based analysis. Then, frames were registered to correct for drift and corrected for photobleaching using the exponential fit method. To identify myelin changes over time in an automated and unbiased way, the myelin channel was then subjected to a custom written progressive exclusive-or (XOR) processing scheme (Supplementary Table 2), in which the Image Calculator performs the XOR operation on consecutive timelapse frames and generates a new series of frames containing only signal present in frame i or frame i+1 but not both, therefore only including signal from the myelin transgene that changes over time in the original timelapse. This progressive XOR series was then sum-projected to generate an output image containing all changes in the myelin transgene signal over time. Merging with the original timelapse, projected into a single frame, marked sheaths that had disappeared (or appeared) during the timelapse acquisition. We then examined the fate of these XOR-identified sheaths in the original timelapse. Sheaths that appeared or disappeared were examined for microglial contact in the original timelapse: those that appeared to be engulfed and were marked by our XOR series were counted as phagocytosed. Non-contacted sheaths that disappeared were counted as retracted.
Microglia process motility analysis
Larvae were immobilized by immersion in pancuronium bromide (Sigma, P1918) 0.3 mg/ml, aided by a small incision at the tip of the tail, prior to mounting in agarose. Timelapse z-stack frames were acquired every 2.5 min for 1 hour. Movies were max-projected at every time frame, registered to correct for drift, and cells were manually tracked from frame to frame for process maintenance, withdrawal, or formation of new processes. Events occurring at distalmost (usually primary or secondary) processes were tracked. In response to glutamate uncaging, two values were calculated: total process movements, and net directed process movements. Total process movements = uncaging new + uncaging lost + opposite new + opposite lost, and net directed process movements = (uncaging new + opposite lost) – (uncaging lost + opposite new), where the uncaging side is the side of the microglia facing (orthogonal to) the uncaging site, and the opposite side is the side of the microglia facing away.
Myelin inclusion measurements
Z-stack images of microglia, acquired with uniform optical sectioning and number of slices, were sum-projected in Fiji. The microglia border was manually traced, and the background was cleared. The channels were split and the myelin channel was subjected to morphological segmentation using the Fiji plugin MorphoLibJ62. Specific parameters were: object image, gradient type=morphological, gradient radius=1px, watershed segmentation tolerance=60 (spinal cord) or 20 (optic tectum). Watershed segmentation values were predetermined on sample images of microglia from each of the two regions. Following segmentation, the wand tool was used to trace watershed ROIs and ROI and total cell area values were saved for downstream analysis in R.
Sheath length measurements
Z-stack images of oligodendrocytes, acquired with uniform optical sectioning, were traced in 3D using the Fiji plugin Simple Neurite Tracer63. The number of paths (sheaths) belonging to a single oligodendrocyte is the number of sheaths per cell and the path length in 3D is the sheath length. Default parameters were used, except cursor snapping = 2 XY pixels. Path lengths were exported to R for analysis.
Extended Data
Extended Figure 1. Calcium events in microglia contacting myelin sheaths compared to non-sheath contacting processes and comparison with proximal vs distal events.

(a, b) Max dF/F (a) and event area (b) for large events (dF/F >0.1, area > 3 μm2) at non-sheath-contacting and sheath-contacting processes of microglia at 4 dpf in Tg(mpeg1.1:GCaMP6s-CAAX; sox10:mRFP) larvae. Wilcox rank-sum test, n=41 events from 9 microglia in 9 fish. (c, d) To distinguish if distance from cell soma is responsible for sheath-contacting vs non-contacting event differences, we split 645 events that occurred in 31 cells (31 fish) into distal and proximal halves and assessed event dF/F (c) and duration (d); both ns by Wilcox rank-sum test.
Extended Figure 2. Anti-Mbpa detects myelin within microglia.
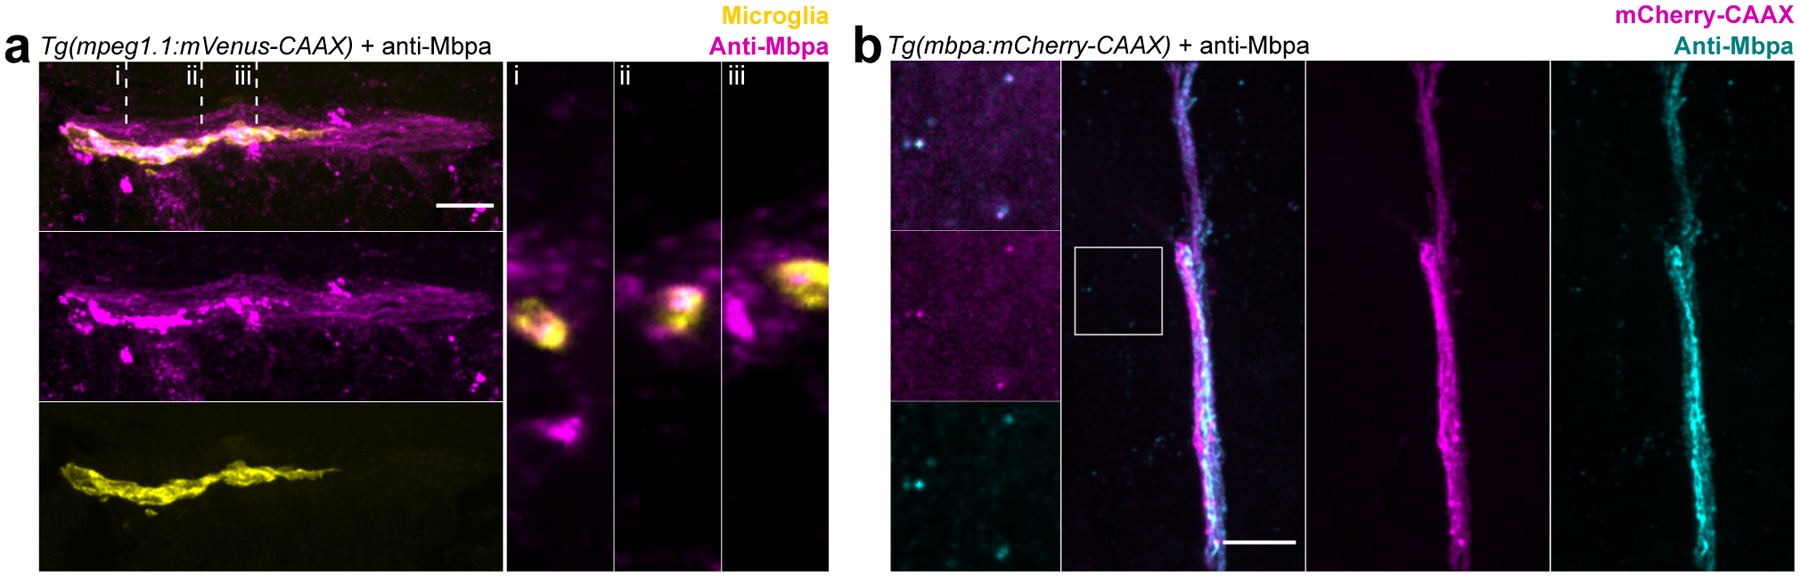
(a) Coronal section of Tg(mpeg1.1:mVenus-CAAX) 6 dpf larval spinal cord stained with anti-Mbpa to detect myelin. Note anti-Mbpa inclusions (magenta) within microglia (yellow) in orthogonal views (right panels) taken at the locations marked (i), (ii), (iii). (b) Coronal section of Tg(mbpa:mCherry-CAAX) 6 dpf tectal commissure stained with anti-Mbpa (cyan) to detect myelin. Oligodendrocyte membrane (mCherry-CAAX) colocalizes with anti-Mbpa (cyan), both in the intact commissure and as a limited amount of extracellular debris (inset). Scale bars, 10 μm.
Extended Figure 3. Acute treatment of larvae with bafilomycin A1 does not affect oligodendrocyte myelination.
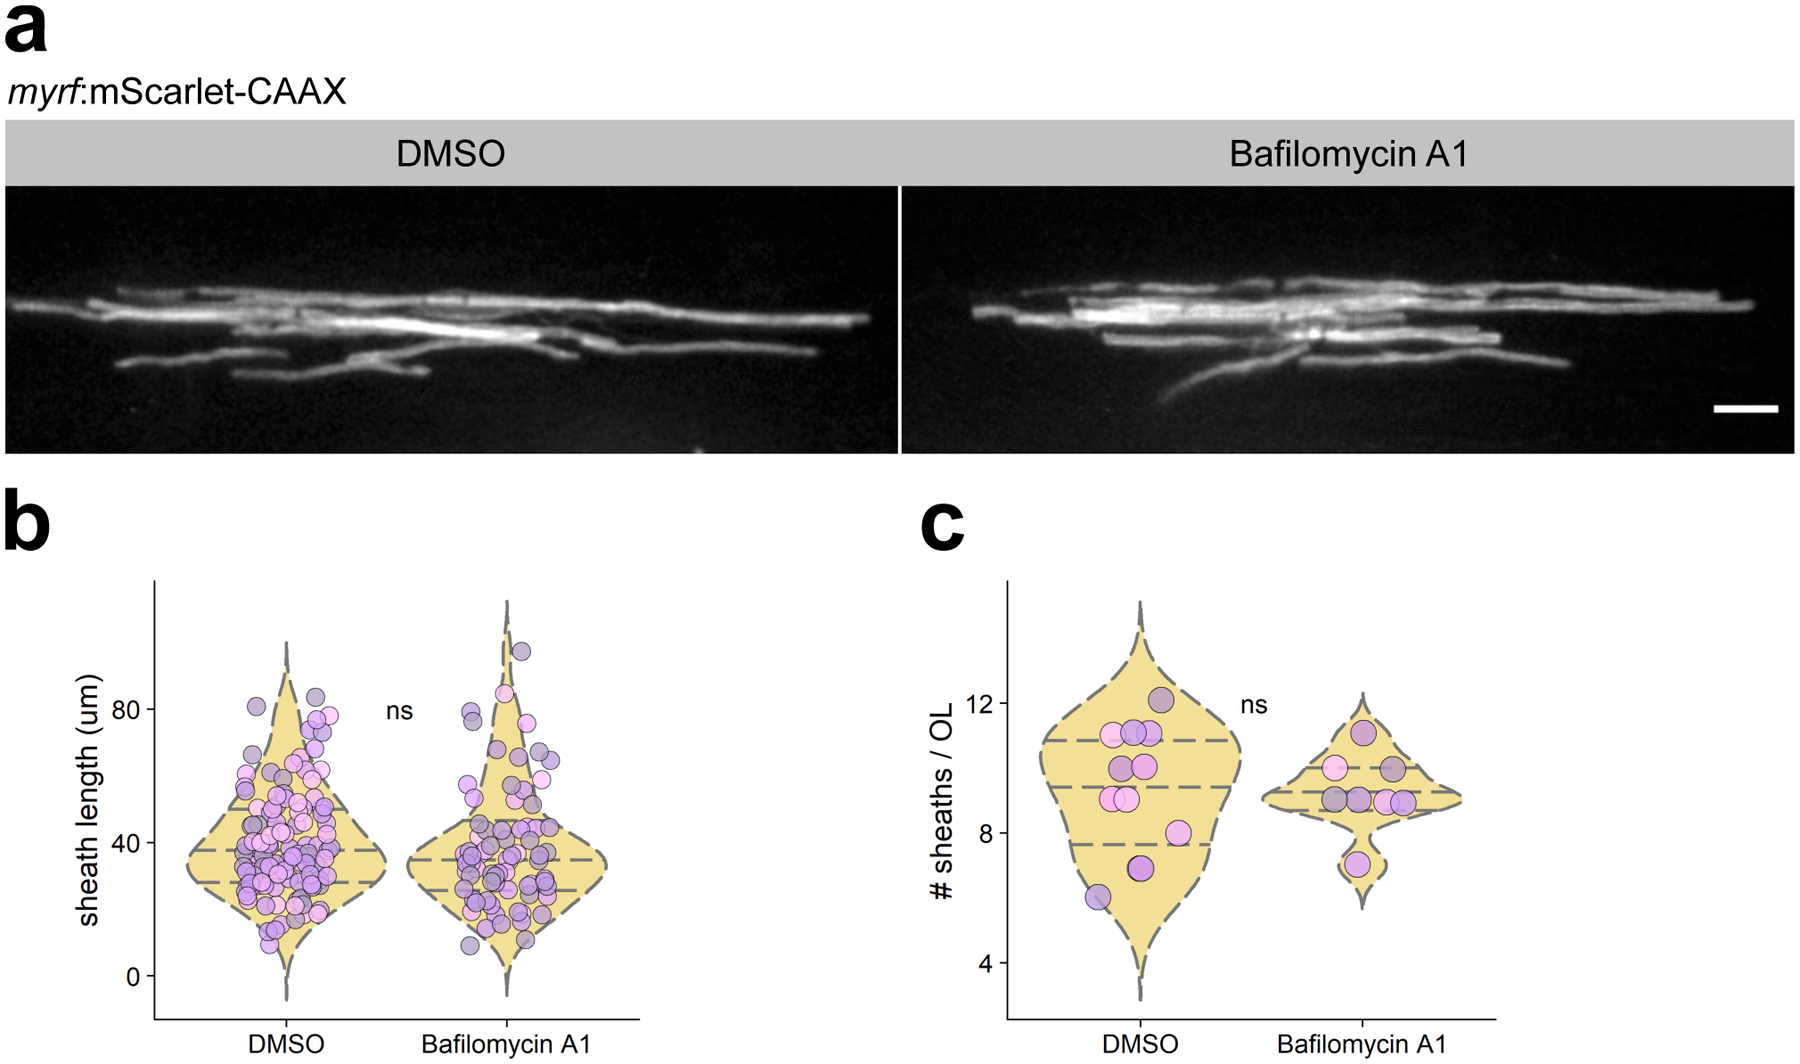
(a) Individual oligodendrocytes in transient-transgenic myrf:mScarlet-CAAX expressing larvae treated with bafilomycin A1 or DMSO. Scale bar, 10 μm. (b, c) Quantification of sheath length and number of oligodendrocytes in each treatment group. n=12 larvae/12 fish (DMSO), 8 larvae/8 fish (bafilomycin A1). Data in (b) and (c) analyzed by Wilcox rank-sum test.
Extended Figure 4. Glutamate uncaging evokes Ca2+ transients most reliably in neurons located < 20 μm away from the uncaging site.

(a) Ratio of Ca2+ transient-experiencing neurons to those without transients binned in 10 μm bins from the uncaging site. (b) Distance of neurons with Ca2+ transients (defined as dF/F>0.5) or no transients from the uncaging point in larvae treated with DMSO or MNI-glutamate, analyzed by Wilcox rank-sum test (n=fish/neurons, n=5/85 DMSO, 9/70 MNI-glutamate).
Extended Figure 5. Microglia ablation does not change oligodendrocyte number or distribution.

(a) Max projection images of hemi-spinal cords in 4 dpf Tg(mbpa:TagRFP-T) larvae in each microglia ablation group and controls. Scale bar, 10 μm. (b, c) Total number (b) and dorsal/ventral distribution (c) of oligodendrocytes per 3.5 hemisegments in each ablation group paired with corresponding controls, analyzed by Wilcox rank sum test (n=fish/oligodendrocytes, groups left to right, n=9/293, 12/442, 7/222, 8/271, 7/225, 6/209, 8/274, 6/208).
Extended Figure 6. Working model of activity-regulated myelin phagocytosis by microglia.

Microglia phagocytose myelin to regulate myelin sheath number and targeting. Neuronal activity attracts microglia to contact neuronal cell bodies and reduces the amount of myelin that microglia can phagocytose, whereas reductions in neuronal activity promote myelin phagocytosis from axons.
Supplementary Material
Acknowledgments:
We thank M Preston (InVivo Biosystems, Eugene, OR) and J Hines (Winona State University, Winona, MN) for providing pME-NTR and p5E-myrf plasmids, respectively, and W Macklin, E Hughes, and S Bromley-Coolidge for comments on the manuscript.
Funding: This work was supported by US National Institutes of Health (NIH) grant R01 NS095679 and a gift from the Gates Frontiers Fund to B.A. and a National Science Foundation Graduate Research Fellowship (DGE-1553798) to A.N.H. The University of Colorado Anschutz Medical Campus Zebrafish Core Facility was supported by NIH grant P30 NS048154.
Footnotes
Competing interests: The authors declare no competing interests.
Data, code, and materials availability: All data are available in the manuscript, the source data files, or the supplementary materials. Fiji scripts are available in the supplementary materials. All plasmids and transgenic zebrafish are available by request.
REFERENCES
- 1.Hines JH, Ravanelli AM, Schwindt R, Scott EK & Appel B Neuronal activity biases axon selection for myelination in vivo. Nat. Neurosci 18, 683–689 (2015). [DOI] [PMC free article] [PubMed] [Google Scholar]
- 2.Mensch S et al. Synaptic vesicle release regulates myelin sheath number of individual oligodendrocytes in vivo. Nat. Neurosci 18, 628–30 (2015). [DOI] [PMC free article] [PubMed] [Google Scholar]
- 3.Gibson EM et al. Neuronal activity promotes oligodendrogenesis and adaptive myelination in the mammalian brain. Science (80-.) 344, (2014). [DOI] [PMC free article] [PubMed] [Google Scholar]
- 4.Mitew S et al. Pharmacogenetic stimulation of neuronal activity increases myelination in an axon-specific manner. Nat. Commun 9, (2018). [DOI] [PMC free article] [PubMed] [Google Scholar]
- 5.Scholz J, Klein MC, Behrens TEJ & Johansen-Berg H Training induces changes in white-matter architecture. Nat. Neurosci 12, 1370–1371 (2009). [DOI] [PMC free article] [PubMed] [Google Scholar]
- 6.Hughes EG, Orthmann-Murphy JL, Langseth AJ & Bergles DE Myelin remodeling through experience-dependent oligodendrogenesis in the adult somatosensory cortex. Nat. Neurosci 21, 696–706 (2018). [DOI] [PMC free article] [PubMed] [Google Scholar]
- 7.Sampaio-Baptista C et al. Motor skill learning induces changes in white matter microstructure and myelination. J Neurosci 33, 19499–19503 (2013). [DOI] [PMC free article] [PubMed] [Google Scholar]
- 8.McKenzie IA et al. Motor skill learning requires active central myelination. Science (80-.) 346, 318–322 (2014). [DOI] [PMC free article] [PubMed] [Google Scholar]
- 9.Liu P, Du J & He C Developmental pruning of early-stage myelin segments during CNS myelination in vivo. Cell Res. 23, 962–964 (2013). [DOI] [PMC free article] [PubMed] [Google Scholar]
- 10.Li Y, Du X, Liu C, Wen Z-L & Du J Reciprocal regulation between resting microglial dynamics and neuronal activity in vivo. Dev. Cell 23, 1189–202 (2012). [DOI] [PubMed] [Google Scholar]
- 11.Tremblay M-È, Lowery RL & Majewska AK Microglial Interactions with Synapses Are Modulated by Visual Experience. PLoS Biol. 8, e1000527 (2010). [DOI] [PMC free article] [PubMed] [Google Scholar]
- 12.Schafer DP et al. Microglia Sculpt Postnatal Neural Circuits in an Activity and Complement-Dependent Manner. Neuron 74, 691–705 (2012). [DOI] [PMC free article] [PubMed] [Google Scholar]
- 13.Hong S et al. Complement and microglia mediate early synapse loss in Alzheimer mouse models. Science 352, 712–716 (2016). [DOI] [PMC free article] [PubMed] [Google Scholar]
- 14.Neumann H, Kotter MR & Franklin RJM Debris clearance by microglia: an essential link between degeneration and regeneration. Brain 132, 288–95 (2009). [DOI] [PMC free article] [PubMed] [Google Scholar]
- 15.Uranova NA, Vikhreva OV, Rachmanova VI & Orlovskaya DD Ultrastructural alterations of myelinated fibers and oligodendrocytes in the prefrontal cortex in schizophrenia: a postmortem morphometric study. Schizophr. Res. Treatment 2011, 325789 (2011). [DOI] [PMC free article] [PubMed] [Google Scholar]
- 16.Pozner A et al. Intracellular calcium dynamics in cortical microglia responding to focal laser injury in the PC::G5-tdT reporter mouse. Front. Mol. Neurosci 8, 12 (2015). [DOI] [PMC free article] [PubMed] [Google Scholar]
- 17.Eichhoff G, Brawek B & Garaschuk O Microglial calcium signal acts as a rapid sensor of single neuron damage in vivo. Biochim. Biophys. Acta - Mol. Cell Res 1813, 1014–1024 (2011). [DOI] [PubMed] [Google Scholar]
- 18.Sieger D, Moritz C, Ziegenhals T, Prykhozhij S & Peri F Long-Range Ca2+ Waves Transmit Brain-Damage Signals to Microglia. Dev. Cell 22, 1138–1148 (2012). [DOI] [PubMed] [Google Scholar]
- 19.Bai Q, Sun M, Stolz DB & Burton EA Major isoform of zebrafish P0 is a 23.5 kDa myelin glycoprotein expressed in selected white matter tracts of the central nervous system. J. Comp. Neurol 519, 1580–1596 (2011). [DOI] [PMC free article] [PubMed] [Google Scholar]
- 20.Nevin LM, Robles E, Baier H & Scott EK Focusing on optic tectum circuitry through the lens of genetics. BMC Biology 8, (2010). [DOI] [PMC free article] [PubMed] [Google Scholar]
- 21.Langebeck-Jensen K, Shahar OD, Schuman EM, Langer JD & Ryu S Larval Zebrafish Proteome Regulation in Response to an Environmental Challenge. Proteomics 19, (2019). [DOI] [PubMed] [Google Scholar]
- 22.Shiau CE, Kaufman Z, Meireles AM & Talbot WS Differential Requirement for irf8 in Formation of Embryonic and Adult Macrophages in Zebrafish. PLoS One 10, e0117513 (2015). [DOI] [PMC free article] [PubMed] [Google Scholar]
- 23.Herbomel P, Thisse B & Thisse C Zebrafish Early Macrophages Colonize Cephalic Mesenchyme and Developing Brain, Retina, and Epidermis through a M-CSF Receptor-Dependent Invasive Process. Dev. Biol 238, 274–288 (2001). [DOI] [PubMed] [Google Scholar]
- 24.Green LA, Nebiolo JC & Smith CJ Microglia exit the CNS in spinal root avulsion. PLOS Biol. 17, e3000159 (2019). [DOI] [PMC free article] [PubMed] [Google Scholar]
- 25.Wlodarczyk A et al. A novel microglial subset plays a key role in myelinogenesis in developing brain. EMBO J. 36, 3292–3308 (2017). [DOI] [PMC free article] [PubMed] [Google Scholar]
- 26.Giera S et al. Microglial transglutaminase-2 drives myelination and myelin repair via GPR56/ADGRG1 in oligodendrocyte precursor cells. Elife 7, (2018). [DOI] [PMC free article] [PubMed] [Google Scholar]
- 27.Almeida RG et al. Myelination of Neuronal Cell Bodies when Myelin Supply Exceeds Axonal Demand. Curr. Biol 28, 1296–1305.e5 (2018). [DOI] [PMC free article] [PubMed] [Google Scholar]
- 28.Li Q et al. Developmental Heterogeneity of Microglia and Brain Myeloid Cells Revealed by Deep Single-Cell RNA Sequencing. Neuron 101, 207–223.e10 (2019). [DOI] [PMC free article] [PubMed] [Google Scholar]
- 29.Fields RD Volume transmission in activity-dependent regulation of myelinating glia. Neurochem. Int 45, 503–9 (2004). [DOI] [PubMed] [Google Scholar]
- 30.Davalos D et al. ATP mediates rapid microglial response to local brain injury in vivo. Nat. Neurosci 8, 752–758 (2005). [DOI] [PubMed] [Google Scholar]
- 31.Koudelka S et al. Individual Neuronal Subtypes Exhibit Diversity in CNS Myelination Mediated by Synaptic Vesicle Release. Curr. Biol (2016). doi: 10.1016/j.cub.2016.03.070 [DOI] [PMC free article] [PubMed] [Google Scholar]
- 32.Nelson HN et al. Individual neuronal subtypes control initial myelin sheath growth and stabilization. bioRxiv 809996 (2019). doi: 10.1101/809996 [DOI] [PMC free article] [PubMed] [Google Scholar]
- 33.Geraghty AC et al. Loss of Adaptive Myelination Contributes to Methotrexate Chemotherapy-Related Cognitive Impairment. Neuron 250–265.e8 (2019). doi: 10.1016/j.neuron.2019.04.032 [DOI] [PMC free article] [PubMed] [Google Scholar]
- 34.Baraban M, Koudelka S & Lyons DA Ca2+ activity signatures of myelin sheath formation and growth in vivo. Nat. Neurosci 21, 19–23 (2018). [DOI] [PMC free article] [PubMed] [Google Scholar]
- 35.Hughes EG, Orthmann-Murphy JL, Langseth AJ & Bergles DE Myelin remodeling through experience-dependent oligodendrogenesis in the adult somatosensory cortex. Nat. Neurosci 21, 696–706 (2018). [DOI] [PMC free article] [PubMed] [Google Scholar]
- 36.Nawaz S et al. Actin Filament Turnover Drives Leading Edge Growth during Myelin Sheath Formation in the Central Nervous System. Dev. Cell 34, 139–151 (2015). [DOI] [PMC free article] [PubMed] [Google Scholar]
- 37.Elazar N et al. Axoglial Adhesion by Cadm4 Regulates CNS Myelination. Neuron (2018). doi: 10.1016/J.NEURON.2018.11.032 [DOI] [PMC free article] [PubMed] [Google Scholar]
- 38.Hughes AN & Appel B Oligodendrocytes express synaptic proteins that modulate myelin sheath formation. Nat. Commun 10, 4125 (2019). [DOI] [PMC free article] [PubMed] [Google Scholar]
- 39.Stevens B et al. The Classical Complement Cascade Mediates CNS Synapse Elimination. Cell 131, 1164–1178 (2007). [DOI] [PubMed] [Google Scholar]
- 40.Brunner C, Lassmann H, Waehneldt TV, Matthieu JM & Linington C Differential ultrastructural localization of myelin basic protein, myelin/oligodendroglial glycoprotein, and 2’,3’-cyclic nucleotide 3’-phosphodiesterase in the CNS of adult rats. J. Neurochem 52, 296–304 (1989). [DOI] [PubMed] [Google Scholar]
- 41.van der Laan LJ et al. Macrophage phagocytosis of myelin in vitro determined by flow cytometry: phagocytosis is mediated by CR3 and induces production of tumor necrosis factor-alpha and nitric oxide. Artic. J. Neuroimmunol 70, 145–152 (1996). [DOI] [PubMed] [Google Scholar]
- 42.Barnett MH, Parratt JDE, Cho ES & Prineas JW Immunoglobulins and complement in postmortem multiple sclerosis tissue. Ann. Neurol 65, 32–46 (2009). [DOI] [PubMed] [Google Scholar]
- 43.Gunner G et al. Sensory lesioning induces microglial synapse elimination via ADAM10 and fractalkine signaling. Nat. Neurosci 22, 1075–1088 (2019). [DOI] [PMC free article] [PubMed] [Google Scholar]
- 44.Rotshenker S et al. Galectin-3/MAC-2, ras and PI3K activate complement receptor-3 and scavenger receptor-AI/II mediated myelin phagocytosis in microglia. Glia 56, 1607–1613 (2008). [DOI] [PubMed] [Google Scholar]
- 45.Nimmerjahn A, Kirchhoff F & Helmchen F Resting microglial cells are highly dynamic surveillants of brain parenchyma in vivo. Science 308, 1314–8 (2005). [DOI] [PubMed] [Google Scholar]
- 46.Stowell RD et al. Noradrenergic signaling in the wakeful state inhibits microglial surveillance and synaptic plasticity in the mouse visual cortex. Nat. Neurosci 22, 1782–1792 (2019). [DOI] [PMC free article] [PubMed] [Google Scholar]
- 47.Liu YU et al. Neuronal network activity controls microglial process surveillance in awake mice via norepinephrine signaling. Nat. Neurosci 22, 1771–1781 (2019). [DOI] [PMC free article] [PubMed] [Google Scholar]
- 48.Brown GC & Neher JJ Microglial phagocytosis of live neurons. Nat. Rev. Neurosci 15, 209–216 (2014). [DOI] [PubMed] [Google Scholar]
- 49.De Biase LM et al. Local Cues Establish and Maintain Region-Specific Phenotypes of Basal Ganglia Microglia. Neuron 95, 341–356.e6 (2017). [DOI] [PMC free article] [PubMed] [Google Scholar]
- 50.Oosterhof N et al. Homozygous Mutations in CSF1R Cause a Pediatric-Onset Leukoencephalopathy and Can Result in Congenital Absence of Microglia. Am. J. Hum. Genet 104, 936–947 (2019). [DOI] [PMC free article] [PubMed] [Google Scholar]
- 51.Kimmel CB, Ballard WW, Kimmel SR, Ullmann B & Schilling TF Stages of embryonic development of the zebrafish. Dev. Dyn 203, 253–310 (1995). [DOI] [PubMed] [Google Scholar]
- 52.Higashijima S-I, Mandel G & Fetcho JR Distribution of prospective glutamatergic, glycinergic, and GABAergic neurons in embryonic and larval zebrafish. J. Comp. Neurol 480, 1–18 (2004). [DOI] [PubMed] [Google Scholar]
- 53.Kwan KM et al. The Tol2kit: A multisite gateway-based construction Kit for Tol2 transposon transgenesis constructs. Dev. Dyn 236, 3088–3099 (2007). [DOI] [PubMed] [Google Scholar]
- 54.Ellett F, Pase L, Hayman JW, Andrianopoulos A & Lieschke GJ mpeg1 promoter transgenes direct macrophage-lineage expression in zebrafish. Blood 117, e49–56 (2011). [DOI] [PMC free article] [PubMed] [Google Scholar]
- 55.Mathias JR, Zhang Z, Saxena MT & Mumm JS Enhanced cell-specific ablation in zebrafish using a triple mutant of Escherichia coli nitroreductase. Zebrafish 11, 85–97 (2014). [DOI] [PMC free article] [PubMed] [Google Scholar]
- 56.Chen S, Chiu CN, McArthur KL, Fetcho JR & Prober DA TRP channel mediated neuronal activation and ablation in freely behaving zebrafish. Nat. Methods 13, 147–50 (2016). [DOI] [PMC free article] [PubMed] [Google Scholar]
- 57.Shiau CE, Monk KR, Joo W & Talbot WS An Anti-inflammatory NOD-like Receptor Is Required for Microglia Development. Cell Rep. 5, 1342–1352 (2013). [DOI] [PMC free article] [PubMed] [Google Scholar]
- 58.Almeida R & Lyons D Oligodendrocyte Development in the Absence of Their Target Axons In Vivo. PLoS One 11, e0164432 (2016). [DOI] [PMC free article] [PubMed] [Google Scholar]
- 59.Li L, Jin H, Xu J, Shi Y & Wen Z Irf8 regulates macrophage versus neutrophil fate during zebrafish primitive myelopoiesis. Blood 117, 1359–1369 (2011). [DOI] [PubMed] [Google Scholar]
- 60.Kucenas S, Wang W Der, Knapik EW & Appel B A selective glial barrier at motor axon exit points prevents oligodendrocyte migration from the spinal cord. J. Neurosci 29, 15187–15194 (2009). [DOI] [PMC free article] [PubMed] [Google Scholar]
- 61.Wang Y et al. Accurate quantification of astrocyte and neurotransmitter fluorescence dynamics for single-cell and population-level physiology. Nat. Neurosci 22, 1936–1944 (2019). [DOI] [PMC free article] [PubMed] [Google Scholar]
- 62.Legland D, Arganda-Carreras I & Andrey P MorphoLibJ: integrated library and plugins for mathematical morphology with ImageJ. Bioinformatics 32, btw413 (2016). [DOI] [PubMed] [Google Scholar]
- 63.Longair MH, Baker DA & Armstrong JD Simple Neurite Tracer: open source software for reconstruction, visualization and analysis of neuronal processes. Bioinformatics 27, 2453–2454 (2011). [DOI] [PubMed] [Google Scholar]
Associated Data
This section collects any data citations, data availability statements, or supplementary materials included in this article.