

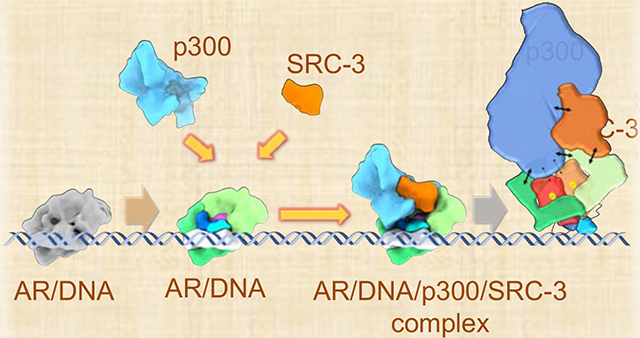
Graphical Abstract
Keywords: Androgen receptor, coactivator, SRC-3, p300, complex, cryoEM, structure
Summary
Steroid receptors activate gene transcription by recruiting coactivators to initiate transcription of their target genes. For most nuclear receptors, the ligand-dependent activation function domain-2(AF-2) is a primary contributor to the NR transcriptional activity. In contrast to other steroid receptors such as ERα, the activation function of androgen receptor(AR) is largely dependent on its ligand-independent AF-1 located in its N-terminal domain(NTD). It remains unclear why AR utilizes a different AF domain from other receptors despite that NRs share similar domain organizations. Here we present cryoEM structures of DNA-bound full-length AR and its complex structure with key coactivators, SRC-3 and p300. AR dimerization follows a unique head-to-head and tail-to-tail manner. Unlike ERα, AR directly contacts a single SRC-3 and p300. The AR NTD is the primary site for coactivator recruitment. The structures provide a basis for understanding assembly of the AR:coactivator complex and its domain contributions for coactivator assembly and transcriptional regulation.
eTOC Blurb:
Androgen receptor forms a large complex with different coactivators to regulate transcription. Yu et al. demonstrate the first structures of DNA-bound full length androgen receptor and its assembled complex with coactivators using cryo-EM.
Introduction
Androgen receptor (AR) is an androgen-activated transcription factor, which plays a key role in regulating expression of genes that are critical for male sexual development and differentiation, skeletal muscle growth, metabolism, nervous system development, as well as prostate cancer initiation and progression. Upon binding to the androgenic hormones testosterone and its metabolite, 5α-dihydrotestosterone (DHT), AR dissociates from heat shock proteins in the cytoplasm, dimerizes, and translocates into the nucleus where it binds specific DNA sequences (Androgen Response Elements, AREs) to regulate downstream target gene transcription. AR belongs to the nuclear hormone receptor superfamily, which additionally includes steroidal estrogen receptors (ERα, ERβ), progesterone receptors (PR-A, PR-B), glucocorticoid receptor (GR), and mineralocorticoid receptor (MR). All steroid receptors are comprised of three major functional domains: a highly variable N-terminal domain (NTD), a conserved central DNA binding domain (DBD), and a C-terminal ligand binding domain (LBD). The transcriptional activation functions of the receptors reside in both the NTD (a constitutively active AF-1) and LBD (a ligand-dependent AF-2), through which essential coactivators usually are recruited with DNA-bound receptors to activate transcription (Warnmark et al., 2003).
Upon ligand binding, the steroid receptor LBD undergoes a conformational change and presents a hydrophobic groove (AF-2) at the surface to interact with a LXXLL motif present in coactivators such as steroid receptor coactivators (SRCs) (Heery et al., 1997). SRCs, in turn, recruit other coactivators that are capable of promoting histone modifications or chromatin remodeling, such as the p300/CBP histone acetyltransferases, to stimulate transcriptional initiation. Unlike estrogen-bound estrogen receptor, the androgen-bound AR has a strong AF-1 function and a relatively weak AF-2 function. AF-2 deletion mutants of AR or AR splicing variants lacking LBD still possess potent transcription activation functions (Guo et al., 2009; Jenster et al., 1995; Jenster et al., 1991; Simental et al., 1991). The coactivator binding groove in the AF-2 domain of AR has a low binding affinity for the LXXLL motif present in SRCs (He et al., 1999). Instead, it preferentially binds to a FXXLF motif existing in the AR NTD (Dubbink et al., 2006; Dubbink et al., 2004; He et al., 2004). A strong amino terminal – carboxyl terminal (N/C) interaction between the NTD FXXLF motif and the coactivator binding groove of the LBD is reported to be a unique feature of AR. This N/C interaction is considered necessary for full AR transcriptional activity (He et al., 2000; He et al., 2002; Li et al., 2006). The underlying mechanism as to why the AF-1 of AR is its dominant activation domain and how its N/C interaction contributes to coactivator recruitment and AR transcriptional activity remains unclear.
The LBD and DBD X-ray crystal structures of AR have been solved separately (Matias et al., 2000; Sack et al., 2001; Shaffer et al., 2004). Structural information on the largest and strongest activation domain (the NTD AF-1) of AR is still lacking. Previously published full-length nuclear hormone receptor structures (Chandra et al., 2008; Chandra et al., 2013; Lou et al., 2014; Orlov et al., 2012) also do not present any NTD information. The precise structural role of AR interdomain interactions in the context of full-length receptor dimerization and coactivator recruitment for regulating transcription initiation remains elusive. To address these issues, we determined the three-dimensional structure of androgen-occupied ARE DNA-bound full-length AR reconstructed using electron cryo-microscopy (cryo-EM), and further solved a three-dimensional structure of the complex of AR bound to ARE DNA with its key coactivators, SRC-3 and p300. Our studies here provide a complete visualization of the three-dimensional domain organization of full-length AR and its contributions to coactivator recruitment.
Results
The structure of ARE DNA-bound full-length AR
To elucidate the structure of the DNA-bound AR complexes, we solved six structures of specific AR complexes with antibodies to localize specific domains/components within the complex. All recombinant proteins (AR, SRC-3, and p300) were expressed and purified in-house and pre-tested for activity in our cell-free ARE-driven transcription system. AR complexes were formed by incubating protein components with biotinylated ARE DNA, followed by DNA pull-down with streptavidin beads and release of complexes from the beads with a restriction enzyme. The resulting compositionally variable assemblies were imaged and classified computationally to produce particle populations for three-dimensional (3-D) analysis.
We first solved the structure of the DNA-bound AR dimers (Figure 1A). Synthetic androgen R1881-occupied purified AR (Supplementary Figure 1A) was bound to a 32 bp ARE-containing oligonucleotide. Supplementary Figure 1B and 1C show a representative raw image of ARE-DNA/AR complex and reference-free 2D averages. These data produced a structure of the complex at ~13 Å resolution (Figure 1A and Supplemental Figure 1D, 1E). The starting map of the refinement was generated from scratch and the overall structure was validated using subtomogram averaging performed in a different region of the same grid (Supplemental Figure 1F). AR forms a homodimer upon androgen binding. Interestingly, we did not observe a pseudo 2-fold axis for this dimer, unlike the one previously observed for the ERα dimer (Yi et al., 2015).
Figure 1. ARE DNA bound AR density map and segmentation.
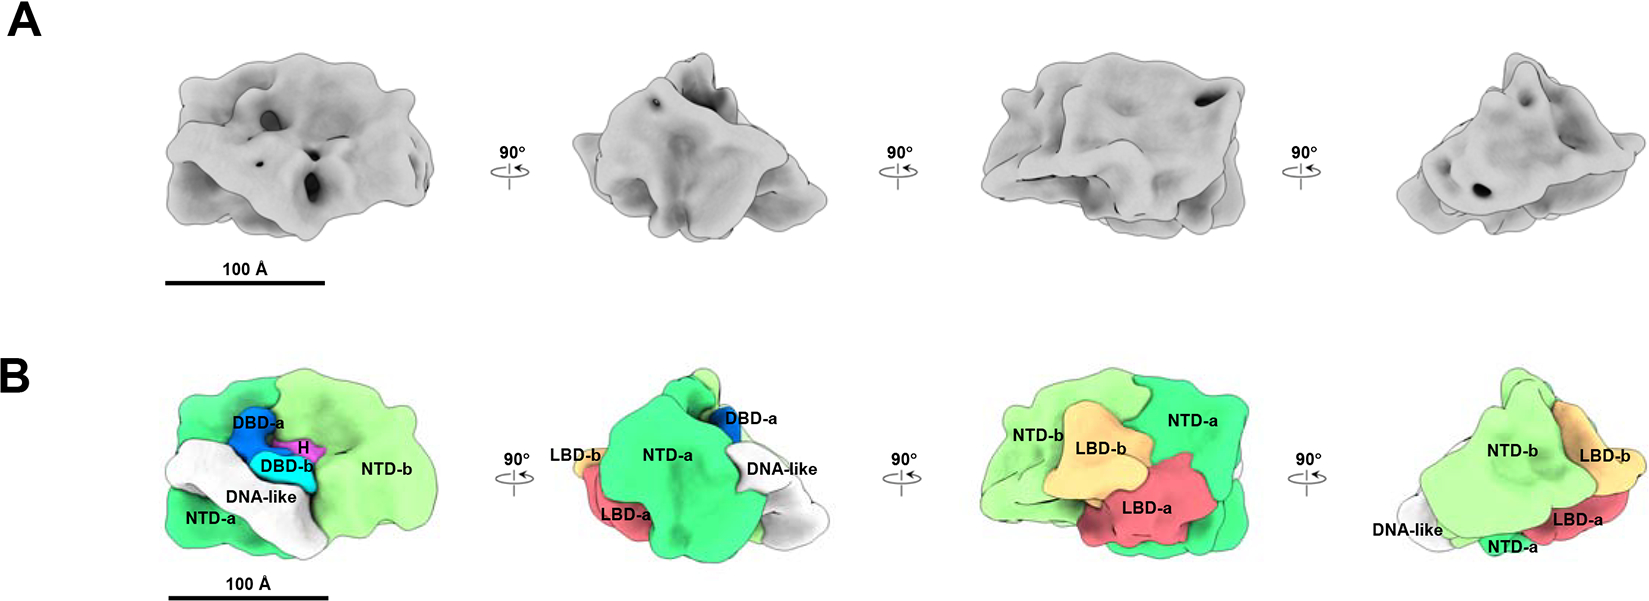
(A) Cryo-EM density of ARE-DNA/AR at resolution ~12.6 Å viewed from different orientation rotating in vertical direction. (B) Segmentation result of ARE-DNA/AR. The segments of two ARs are shown as -a and -b separately. The functional domains of AR are annotated in different colors. NTD: N-terminal domain (Green and light Green), LBD: ligand binding domain (Orange and Red), DBD: DNA binding domain (Blue and light Blue), H: the Hinge region (Purple) between DBD and LBD and one DNA-like feature is shown in White. See also Supplemental Figure 1 and Supplemental Table 1.
To identify individual domains in the AR density map and understand the structural basis for dimerization, we solved two additional structures in the presence of antibodies. We used two monoclonal AR antibodies, processed to Fabs, specifically recognizing AR NTD (AR-Ab1, recognizing residues 98–503; AR-Ab2, recognizing residues 39–97) (Figure 2A and 2B). Each of the two Fabs then was incubated with the ARE-DNA/AR complex followed by cryo-EM single particle analysis. As shown in Supplemental Figure 2B–2D, the Fab labeled AR density maps are consistent with the map without Fab labeling (Figure 1A and Supplemental Figure 2A) except for the additional densities representing Fabs. AR-Ab1 recognizes the AF-1 domain (McEwan, 2004) and thus was used to label the NTD region. Two Fab densities were observed in the map (Figure 2A and Supplemental Figure 2B, 2C), indicating the positions of two NTDs in the AR dimer. AR-Ab2 recognizes the region adjacent to the FXXLF motif (amino acids 23–27) at the very N-terminus of AR. The FXXLF motif contacts the C-terminal LBD and mediates an AR N/C interaction [6–8]. Thus, the AR-Ab2 binding site labels the region in close proximity to the N-terminal end of AR as well as the interface between the NTD and LBD. Interestingly, only one AR-Ab2 density was found (Figure 2B and Supplemental Figure 2D, 2E). This likely is due to different conformations of the two NTDs where the Ab2 recognition site at one of the AR monomer’s NTD may be inaccessible due to the N/C interaction. The non-symmetric feature in the ARE-DNA/AR dimer and the fact that Ab2 only recognizes one NTD in the structure indicate that two AR N/C interactions are not identical in the complex. The NTD not recognized by Ab2 shows more overlap with other segmented domains (the two LBDs) and has less exposed areas in the density, suggesting that it may be more engaged in both inter- and intra-molecular N/C interactions compared to the other NTD.
Figure 2. NTD and LBD annotation validation by antibody labeling.
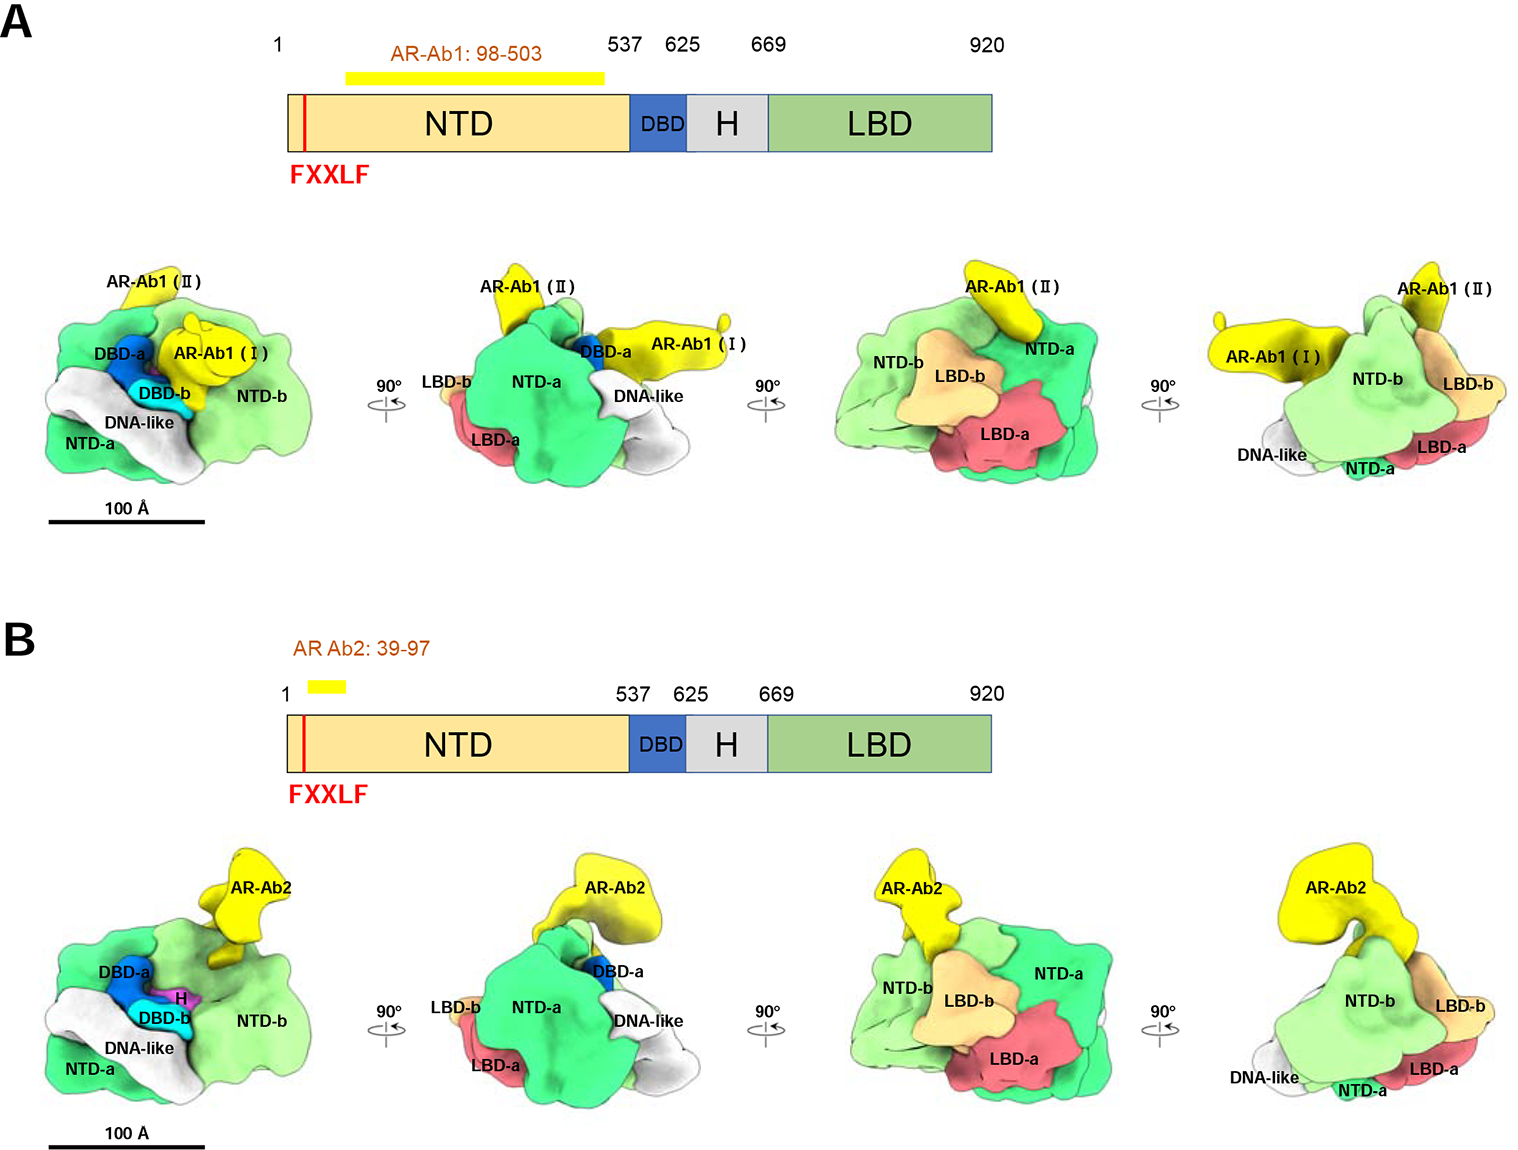
(A) AR-Ab1 labels the NTDs. Top panel, schematic representation of AR functional domains. The long yellow bar represents the region (residues 98–503) recognized by the AR-Ab1. The vertical red bar represents the FXXLF motif (residue 23–27). Bottom panel, AR-Ab1 (yellow) binding to the NTD-a and -b in segmented ARE-DNA/AR density. The stronger antibody density is labeled as AR-Ab1 (Ⅰ) and the other one is labeled as AR-Ab1 (Ⅱ). (B) AR-Ab2 labels the NTD and the interface between the NTD and LBD. Top panel, AR-Ab2 recognizes the residues 39–97 (horizontal yellow bar) at the N-terminal end of AR, which is adjacent to the FXXLF, a motif mediating the interaction between NTD and LBD. Bottom panel, the AR-Ab2 (yellow) binding to the NTD-b in segmented ARE-DNA/AR density. It is located close to the interface between NTD-b and LBD-b, consistent with the segmentation result. See also Supplemental Figure 2.
The ARE-DNA/AR dimer complex was segmented using Segger (Pintilie and Chiu, 2012) in Chimera (Pettersen et al., 2004) as described in the Methods section (Figure 1B). The volume ratio of the segmented components is consistent with the ratio of corresponding domain residues (NTD:DBD:LBD is 537:88:251). We globally searched and docked the LBD dimer crystal structure (PDB ID: 5jjm) into the ARE-DNA/AR density map (Supplemental Figure 2F); while it is uncertain whether full length AR dimerizes in a similar way to the truncated one in the crystal (Nadal et al., 2017), this density does dock into our structure in a location and orientation consistent with our Fab labeling results (Figure 2B and Supplemental Figure 2D, 2E). The DBD is observed binding to a DNA-like feature (Figure 1B). Both the DBD and the DNA-like feature fit well with the AR DBD crystal structure (PDB ID: 1r4i) and a similar-length DNA structure (Supplemental Figure 2G, 2H). Our resolved LBDs are located in the center of the AR dimer and they sit on top of the DNA-bound DBDs (Figure 1B and Supplemental Figure 2G, 2H). This LBD-DBD domain arrangement is similar to the HNF4α dimer that was solved by X-ray crystallography (Chandra et al., 2013), which is different from the non-symmetric PPARγ-RXRα dimer (Chandra et al., 2008) or the X-shape LBD-DBD crossing arrangement in RXRα-LXRβ dimer (Lou et al., 2014). The combination of the antibody locations, crystal structure docking and the observed DNA position allow us to construct a putative domain map of the ARE-DNA/AR complex (Figure 1B). We observe that the two NTDs surround the LBD dimer so that only a small portion of the LBD is exposed. In addition to LBD and DBD, which form a tight dimerization interface at the center, both NTDs also connect to each other to contribute to AR dimerization. Interestingly, the two NTDs appear to adopt different conformations causing an asymmetric appearance of the dimer (Figure 1B). This asymmetry also is supported by observed differences in the density of the two bound antibodies, with one exhibiting much stronger binding to the dimer (Figure 2A, Supplemental Figure 2B, 2C).
The assembly of functionally active ARE DNA-bound AR/SRC-3/p300 complex
Next we assembled an ARE DNA-bound AR/SRC-3/p300 complex using purified recombinant proteins. Before proceeding with structural studies, we completed an in vitro functional assay to insure the assembled complex components were biologically active. Cell-free transcription of a 3xARE-Adenovirus E4 reporter gene was monitored by RT-qPCR after template DNA was assembled into chromatin using HeLa cell core histones. In this system, HeLa cell nuclear extract provides the basal RNA polymerase II machinery to recognize the minimal E4 promoter and “activated” transcription is observed as an increase from basal upon addition of AR, SRC-3, and p300. As shown in Supplemental Figure 4A, AR alone modestly increased reporter mRNA levels in the presence of R1881. The addition of p300 and SRC-3 significantly boosted transcriptional activation, confirming that the assembled complex was functionally active.
To determine the structure of the ARE DNA-bound AR/SRC-3/p300 complex assembled in the presence of R1881, we employed a larger (324 bp) biotinylated DNA fragment from an enhancer of the human KLK3 (PSA) gene that contained a single well-characterized ARE (Cleutjens et al., 1997). The reason we chose this long ARE-containing DNA rather than a short ARE oligo is for the purpose of complex purification. After pulldown of complexes with streptavidin magnetic beads, complexes were released from the beads by restriction enzyme digestion and then applied onto EM grids following standard single-particle Cryo-EM pipeline. Representative raw images and reference-free 2D class averages of the complex are shown in Supplemental Figure 3A, 3B. Using RELION software (Scheres, 2012), we resolved a density map of the ARE DNA-bound AR/SRC-3/p300 complex, which has observed dimensions of ~150 × 180 × 220 Å (Figure 3A). The resolution of the complex map was estimated to be ~20 Å based on the Gold standard Fourier Shell Correlation (FSC) (Supplemental Figure 3C, 3D) (Henderson et al., 2012). Segmentation of the complex was performed with consideration of all available information, including previously known structures of individual components (SRC-3 and p300) (Yi et al., 2017; Yi et al., 2015) and sub-complexes (ARE-DNA/AR) (Figure 1), as well as two additional antibody bound structures (AR-Ab1 and SRC-3-Ab, respectively) (Supplemental Figure 3E–3G). Using the same component identification strategy as the one for ARE-DNA/AR complex, we segmented and labeled all components within the ARE-DNA/AR/SRC-3/p300 complex (Figure 3B). The two antibody-bound density maps are consistent with the ARE-DNA/AR/SRC-3/p300 density map with an obvious protruding density, which indicates the location of specific targeting components in the complex. The volume ratio between each component is in agreement with the ratio of their molecular weights, further validating the segmentation.
Figure 3. The ARE DNA-bound AR/SRC-3/p300 complex density map and segmentation.
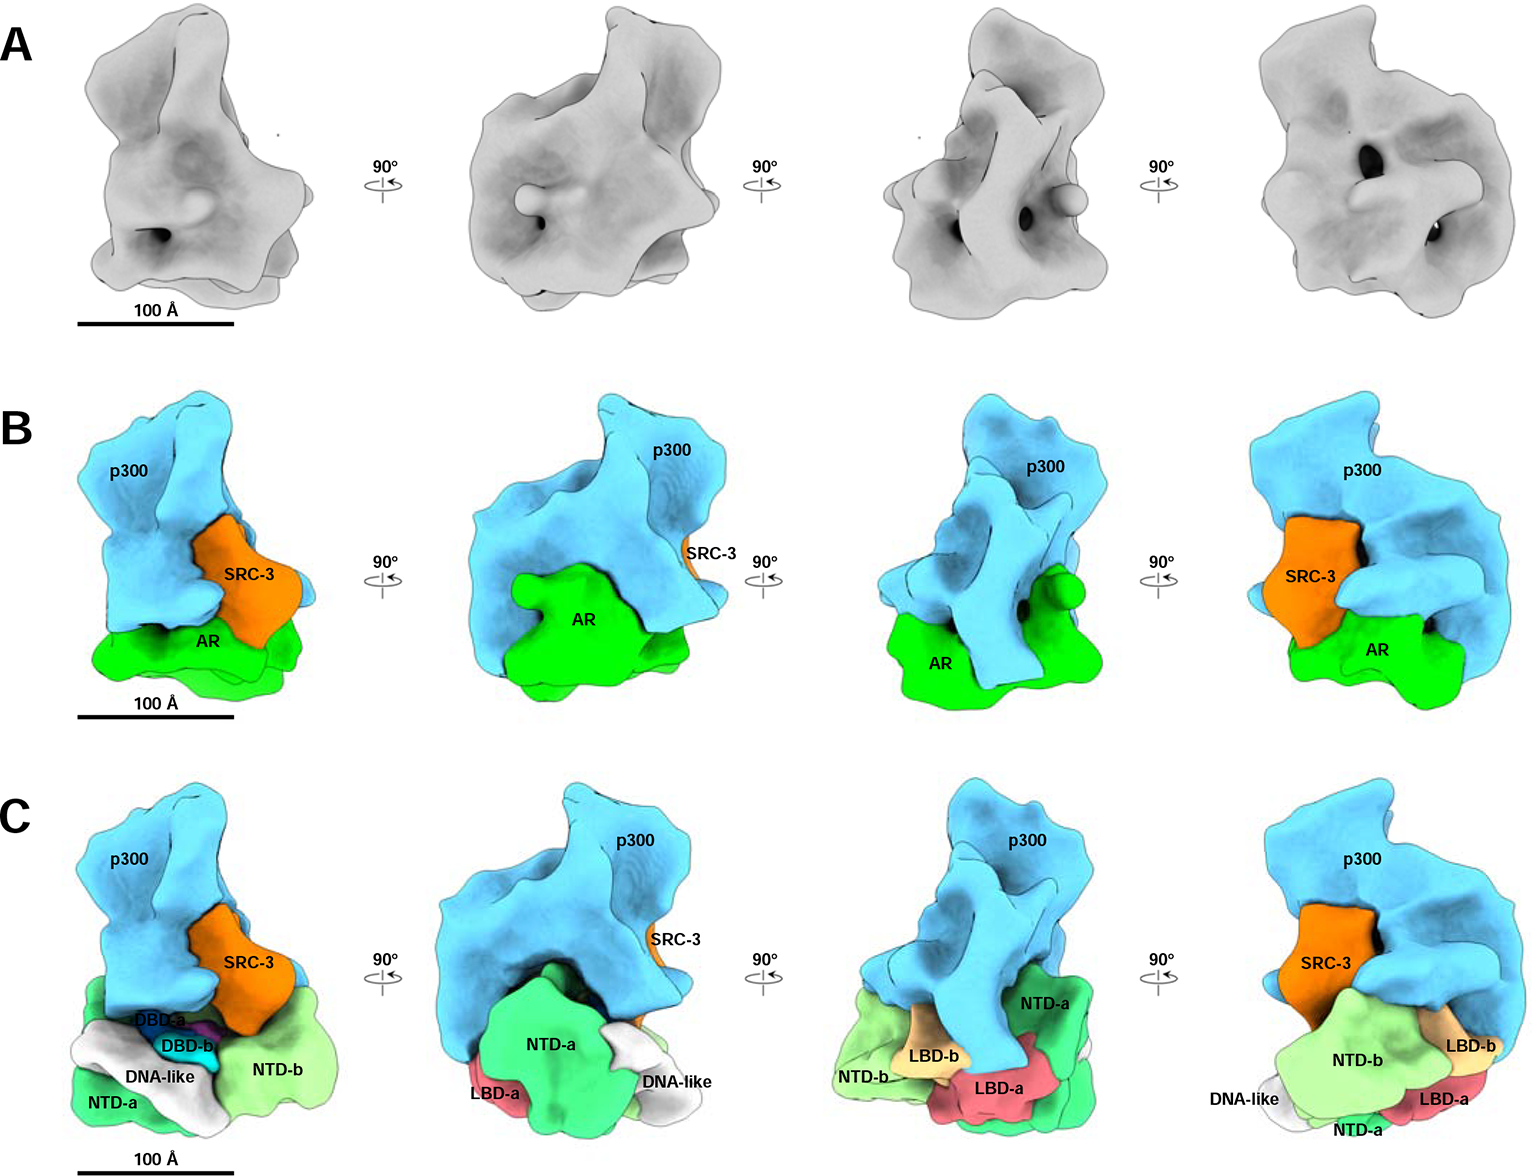
(A) Cryo-EM density map of the ARE DNA-bound AR/SRC-3/p300 complex at resolution ~20 Å. Shown are 4 different angles of the map rotating every 90 degrees. (B) Segmentation of ARE-DNA/AR/SRC-3/p300. Each component was segmented to annotate different proteins: AR, Green; SRC-3, Orange; p300, Blue, respectively. (C) The assembled ARE-DNA/AR/SRC-3/p300 structure with segmented ARE-DNA/AR density (Figure 1B) replacing the AR density. The p300 density mainly interacts with two NTDs of AR and has a small area touches the two LBDs. See also Supplemental Figure 3, 4, 5 and Supplemental Table 1.
We observed only one SRC-3 in the ARE-DNA/AR/SRC-3/p300 complex. The singular binding is validated by observing only a single SRC-3-Ab bound to the complex (Supplemental Figure 3G, 3H). Further, we find p300 directly interacts with AR, without bridging through SRC-3, which is completely unlike that for ERα (Yi et al., 2015). To understand which domain within AR is involved in the recruitment of each coactivator, we applied the AR antibody (AR-Ab1) to the AR/coactivator complex so as to recognize the location of the AR-Ab1 binding region (Supplemental Figure 3E, 3F). Only one AR-Ab1 density was found in the overall ARE-DNA/AR/SRC-3/p300/AR-Ab1 density. Superimposing the ARE-DNA/AR/AR-Ab1 density with ARE-DNA/AR/SRC-3/p300/AR-Ab1 demonstrated that the presence of p300 blocks the second Fab binding site of AR in the larger coactivator-bound complex (Supplemental Figure 4C). This suggests that AR AF-1 is responsible for p300 recruitment since majority of AR-Ab1 binding region is the AF-1 (aa 142–485) (McEwan, 2004). Using this Fab density as an anchor, we were able to dock the segmented ARE-DNA/AR density (Figure 1B) into the AR region within the complex and determine the spatial AR domain arrangement in the AR/larger coactivator complex (Figure 3C).
Based on the structure (Figure 3C), we did not observe that SRC-3 directly contacts the AR LBDs. The interaction between SRC-3 and the AR NTD is clearly observed in our structural data. SRC-3 interacts with the NTD of AR monomer-b. p300 largely contacts the NTDs of both AR monomers (-a and -b in Figure 3C). A small area of p300 also touches both LBDs. Thus, the NTD of AR appears to play a major role in recruiting both SRC-3 and p300. This coactivator assembly mechanism is different from ERα-mediated coactivator recruitment (Yi et al., 2015) and implies that AR-recruited SRC-3 and p300 may have different conformations from ERα-recruited coactivators. Indeed, we observed different conformations of SRC-3 and p300 in the two NR complexes (Supplemental Figure 5A–5C).
We also docked the AR-Ab2-labeled AR dimer structure into the AR/coactivator complex (Figure 2B) and found that this antibody is located right next to SRC-3 binding site (Supplemental Figure 5D, 5E.), indicating that the region interacting with SRC-3 is close to AR N-terminal FXXLF motif, where N/C interaction occurs.
AR recruits SRC-3 and p300 mainly through its NTD
To verify that the AR NTD is essential for SRC-3 recruitment, we generated two flag epitope-tagged AR deletion mutants either lacking the LBD (1–669 amino acids) or lacking the NTD and part of DBD(600–920 amino acids). Full-length flag-tagged AR or the deletion mutants were expressed in 293T cells, purified with anti-flag antibody beads, and then incubated with purified SRC-3 protein in the presence of R1881. A co-immunoprecipitation (co-IP) experiment was carried out using an SRC-3 antibody to analyze the interaction between SRC-3 and purified full-length AR or its deletion mutants. As shown in Figure 4A, the 1–669aa mutant of AR interacts with SRC-3 similar to the level of association with full-length AR. In contrast, the 600–920aa mutant has lost this interaction, suggesting that the NTD, but not the LBD, is important for the AR interaction with SRC-3.
Figure 4. The AR NTD is essential for SRC-3 and p300 coactivator recruitment.
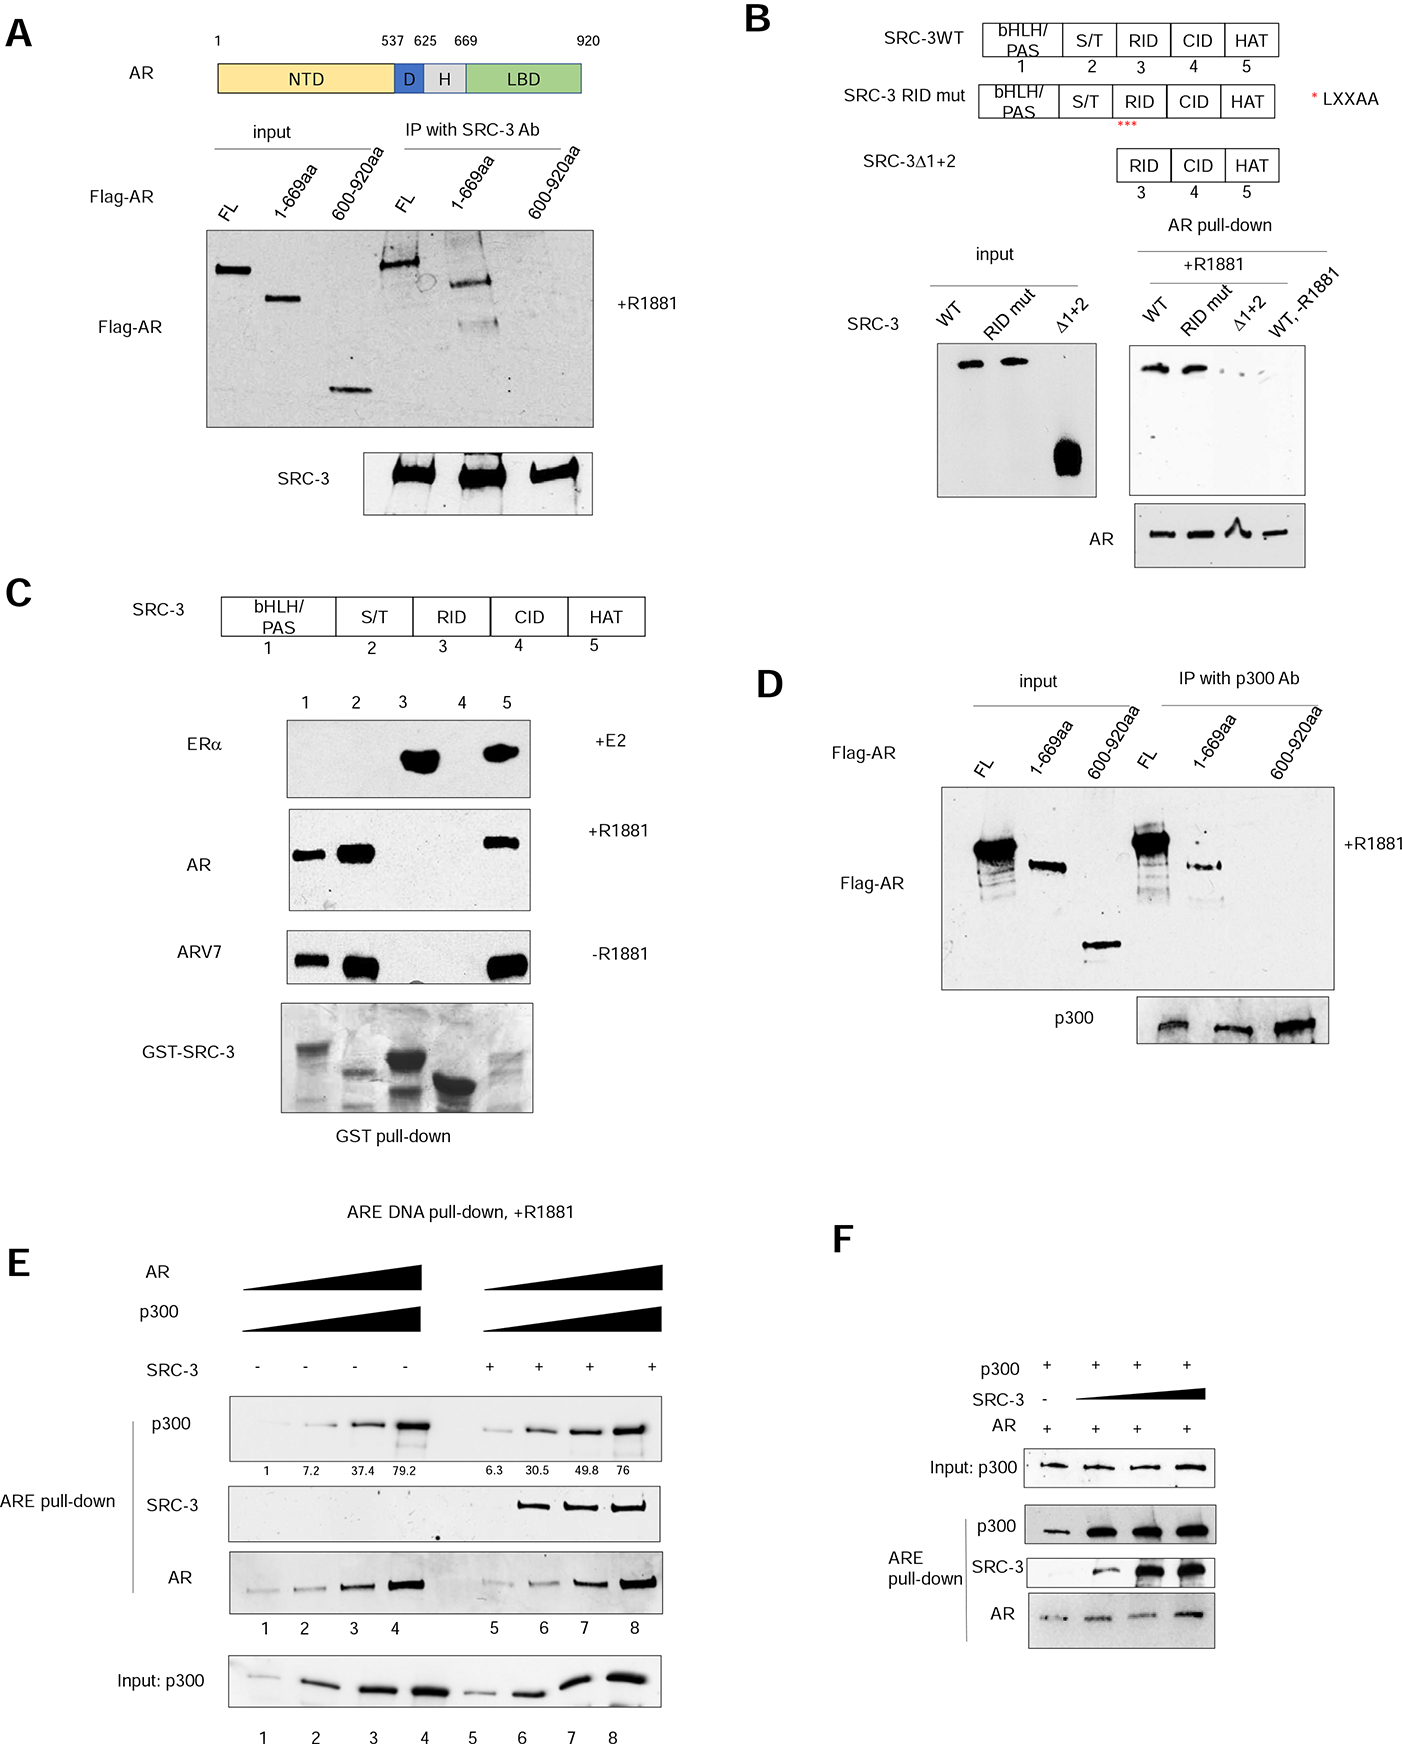
(A) AR interacts with SRC-3 through its N-terminal domain (NTD) in vitro. Purified flag-tagged full-length AR, AR(1–669aa) or AR (600–920aa) was incubated with purified, recombinant SRC-3 in the presence of 1 μM R1881 followed by co-immunoprecipitation using an SRC-3-specific antibody. (B) Deletion of two N-terminal domains of SRC-3, but not RID LXXAA mutations, abolished AR-SRC-3 interaction in vitro. Flag-tagged SRC-3 wild-type (WT) or mutant was transiently transfected into 293T cells and the lysates were incubated with purified, recombinant AR protein in the absence or presence of 1μM R1881 followed by co-immunoprecipitation using an AR-specific antibody. Red asterisks represent mutation of the three LXXLL motifs present in SRC-3 RID into LXXAA. (C) The SRC-3 RID does not interact with AR in a GST pull-down assay. Glutathione-sepharose beads bound to different GST-SRC-3 fragments were incubated with purified ERα, AR or ARV7 protein in the absence or presence of corresponding ligand. Top 3 panels, Immunoblotting analysis of glutathione bead-bound receptor proteins. Bottom panel, Coomassie blue staining of the different tested GST-SRC-3 fragments. (D) AR interacts with p300 through its N-terminal domain in vitro. Purified flag-tagged full-length AR, AR (1–669aa) or AR (600–920aa) was incubated with purified, recombinant p300 in the presence of 1 μM R1881 followed by co-immunoprecipitation using a p300-specific antibody. (E) SRC-3 increases the interaction between AR and p300 when both are at low concentrations. A series of concentrations of purified AR, p300, ARE-containing biotinylated DNA were incubated with or without purified SRC-3 in the presence of 1μM R1881 followed by magnetic streptavidin beads pull-down. Quantitation of p300 pulled-down by ARE DNA is provided underneath the top panel. (F) The effect of different concentrations of purified SRC-3 on the interaction between p300 and AR at low concentrations. Purified p300 protein was incubated with 1μM R1881, AR, and ARE DNA in the absence or presence of increasing concentrations of SRC-3 protein followed by magnetic streptavidin bead pull-down. See also Supplemental Figure 4.
SRC-3 is known to interact with most nuclear hormone receptor LBDs through LXXLL motifs located in its Receptor Interaction Domain (RID) (Heery et al., 1997). Since the AR LBD is dispensable for SRC-3 recruitment, we next determined whether the LXXLL motifs play any role in the interaction between SRC-3 and AR. Replacing leucine residues in the SRC LXXLL motifs with alanine residues has been shown previously to dramatically reduce its binding to ER (Ding et al., 1998). We tested the effects of the LXXLL motif mutation on the association of SRC-3 with AR. Flag-tagged wild-type (WT) SRC-3 or the RID mutant, which contains LXXAA mutations in all three LXXLL motifs within the RID, was transfected into 293T cells. Cell lysates were then incubated with purified AR protein in the absence or presence of R1881 followed by co-IP using an AR-specific antibody. As shown in Figure 4B, R1881 dramatically enhanced WT SRC-3 recruitment to AR. However, mutation of the LXXLL motifs did not affect the interaction between AR and SRC-3. We also performed a similar experiment to determine the association of SRC-3 WT or RID mutant with ERα. In the presence of 17β-estradiol, the SRC-3 RID mutant lost the ability to interact with ERα in contrast to the WT SRC-3 (Supplemental Figure 4B). These results suggest that the domain interaction mechanism between SRC-3 and AR is quite different from its interaction with ERα.
Since LXXLL motifs in SRC-3 are not important for its interaction with AR, we next wanted to determine important regions in SRC-3 that mediate its interaction with AR. SRC-3 contains five distinct domains: bHLH/PAS (Basic Helix-Loop-Helix/Per-Arnt-Sim domain), S/T (Serine/Threonine rich region), RID, CID (CBP/p300 Interaction Domain) and HAT (Histone AcetylTransferase domain) (Figure 4C). Each of these domains was fused to GST and expressed in E.coli (Figure 4C, bottom panel). A GST pull-down experiment then was carried out to test the interaction of purified AR or ERα protein with these GST fusion proteins in vitro in the presence of R1881 or 17β-estradiol, respectively. Consistent with previous reports (Ding et al., 1998; Heery et al., 1997), SRC-3 RID was found to pull-down ERα (Figure 4C). In addition to the RID, the HAT domain also interacted with ERα. However, no interaction was observed between the RID and AR (Figure 4C). Instead, the bHLH/PAS, S/T and HAT domains were each able to pull-down AR in vitro. Consistent with these data, the deletion of the bHLH/PAS and S/T region (SRC-3 Δ1+2) greatly abolished the interaction between SRC-3 and AR in our co-IP experiment (Figure 4B). The differential abilities of GST-HAT and SRC-3 Δ1+2 mutant to interact with AR may be due to the presence of additional domains in the mutant that could potentially mask the AR binding site in the HAT domain. Nevertheless, these results clearly suggest that SRC-3 does not utilize the same surfaces to contact the two steroid hormone receptors. Since the AR NTD appears to be important for recruiting SRC-3 (Figure 3C and Figure 4A), we also tested whether the AR splicing variant V7, which naturally lacks the LBD, also interacts with the same SRC-3 regions as WT AR. Indeed, we found that the same three domains that interact with AR WT also have strong associations with ARV7 (Figure 4C), confirming that the AR NTD mediates the interaction with SRC-3.
In our reconstructed ARE-DNA/AR/SRC-3/p300 complex structure, p300 also appears to directly contact the NTD of AR. We tested whether AR directly interacts with p300 in vitro using purified recombinant proteins. Purified flag tagged full-length AR or its deletion mutants, 1–669aa and 600–920aa, were incubated with purified p300 protein in the presence of R1881 followed by immunoprecipitation using a p300-specific antibody. Immunoblotting was carried out using an anti-flag-specific antibody to detect the level of associated AR. We observed that full-length and 1–669aa fragments, but not the 600–920aa fragment, of AR interacts with p300 (Figure 4D), confirming that the AR NTD is important for interaction with p300.
We next examined whether SRC-3 has any role in the p300-AR interaction. A series of concentrations of purified p300 and AR were incubated in the absence or presence of SRC-3 followed by biotinylated ARE DNA pull-down. We found that SRC-3 significantly increased the p300 recruitment when AR and p300 are at low concentrations (Figure 4E, compare lanes 1, 2 and 5, 6). Addition of SRC-3 did not alter the interaction when AR and p300 at high concentrations probably due to saturated low-affinity between the two proteins. We further tested the effect of increasing concentrations of SRC-3 on low concentration of AR-p300 interaction. We found that the presence of SRC-3 (even with the lowest concentration tested) consistently increased AR-p300 interaction (Figure 4F). These results suggest that SRC-3 can stabilize the interaction between p300 and AR.
Taken together, our cryo-EM structures and biochemical analyses substantiate the following working model (Figure 5). Upon androgen binding, AR dimerizes and undergoes both intra- and inter-molecular N/C interactions. The LBD and DBD are located in the center of the AR dimer forming a tight dimerization interface. The two NTDs within the AR dimer display different modes of N/C interactions, and consequently adopt different conformations to form unique interaction surfaces for recruiting SRC-3 and p300 coactivators, respectively (Supplemental Figure 4C). Our studies now provide a structural basis for understanding AR transcriptional activation functions and demonstrate that the AR NTD plays an essential role in coactivator recruitment.
Figure 5: Model of full-length AR domain organization and its NTD-mediated SRC-3 and p300 coactivator recruitment.
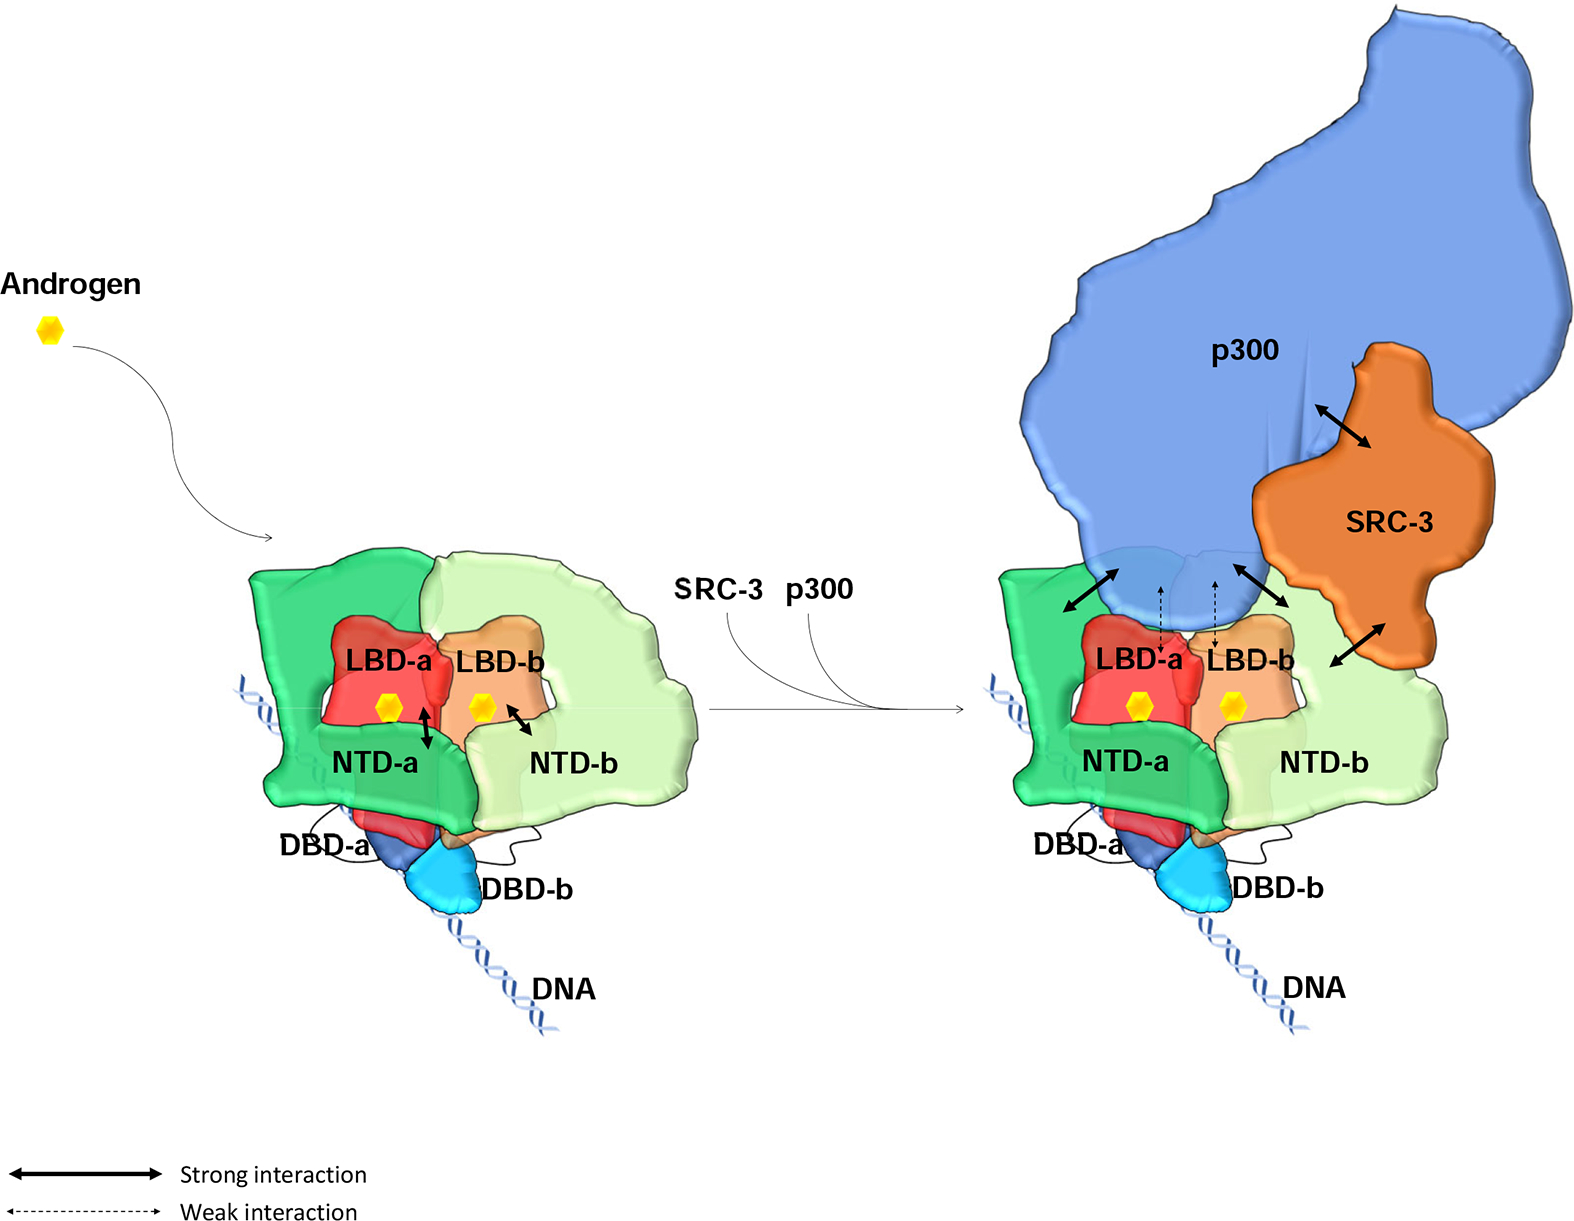
AR dimerizes upon binding to its ligand androgen. Its LBD and DBD are located at the center to form a tight dimerization interface. The two NTDs in the dimer adopt slightly different conformations, wrap around the LBDs, and make tight intra- and inter-molecular N/C interactions. The NTDs also connect to each other to contribute to the dimerization. Through these interactions, AR dimer forms a unique head-to-head and tail-to-tail dimer. AR dimer then recruits key coactivators, SRC-3 and p300, to ARE DNA mainly through its NTDs. One molecule of SRC-3 interacts with one of the AR NTDs (NTD-b) while p300 interacting with both AR NTDs as well as the LBDs to form a stable transcriptionally active complex.
Discussion
Although AR and ERα belong to the same steroid hormone receptor family and have similar domain organizations, they utilize activation domains differently to initiate transcription. A strong N-terminal AF-1 function has been documented for AR, while a ligand-dependent AF-2 in the C-terminus is the major contributor to ERα activity (Jenster et al., 1995; Jenster et al., 1992; Kumar et al., 1987; Tora et al., 1989). Currently the vast majority of nuclear receptor antagonists are designed based on LBD structures. A lack of NTD structural information can be a major challenge for targeting AR activity in pathological conditions such as prostate cancer. The 3-D structure of full-length AR, as well as its complex structure with the two key coactivators presented here, elucidate the underlying differences between AR and ERα coactivator complex assembly and highlight the structural mechanism and importance of the AR NTD in transcription activation.
All steroid hormone receptors form homodimers and bind to palindromic DNA response elements upon ligand binding. We previously found that the full-length ERα dimer forms a symmetric tail-to-tail dimer in the ERα/SRC-3/p300 complex (Yi et al., 2015), consistent with the nature of palindromic DNA binding sequence, symmetric X-ray crystal structures of the ERα LBD (Brzozowski et al., 1997) and DBD dimers (Schwabe et al., 1993). The mode of AR dimer formation, however, is controversial. On one hand, the AR DBD forms a head-to-head dimer on DNA (Shaffer et al., 2004). A symmetric dimeric AR LBD structure was also solved recently (Nadal et al., 2017), suggesting that AR may form a dimer similar to the way ERα dimerizes. On the other hand, an androgen-induced inter-molecular N/C interaction was observed, supporting an anti-parallel dimerization model (Langley et al., 1998; Langley et al., 1995; van Royen et al., 2012). Our agonist-bound full-length ARE-DNA/AR structure now reveals that two LBDs and DBDs are located in the center of the dimer while the two NTDs wrap around the LBDs to make close contacts with each other. All of these domains contribute to the dimerization interface. Consistent with previous reports (Langley et al., 1998; Langley et al., 1995; van Royen et al., 2012), the NTDs also surround the LBDs to make both intra- and inter-molecular N/C interactions. However, the dimer does not exist as an anti-parallel dimer. It also is different from the ERα tail-to-tail dimer, which has a NTD located at one side of the LBD distant from the other NTD located at the opposite side (Yi et al., 2015). Instead, the unique N/C interaction features of AR facilitate an uncommon tail-to-tail and head-to-head dimer formation.
The AR NTD is conserved less across different vertebrate species compared to other domains (van de Wijngaart et al., 2012). It also shares very little homology with other NR NTDs (Lavery and McEwan, 2005). Biochemical and computational analyses suggest that the AR NTD contains intrinsically disordered regions and the isolated NTD exists as a “collapsed” disordered or molten globule-like structure, which represents an intermediate state between a folded globule structure and an unfolded random-coil structure (Lavery and McEwan, 2008b; Reid et al., 2002). Interaction of the NTD with its coactivator binding partners stabilizes the NTD structure and converts the NTD into a protease-resistant conformation (Kumar et al., 2004; Lavery and McEwan, 2008b; Reid et al., 2002). Our ARE-DNA/AR density map clearly depicts the presence of AR NTDs (Figure 1B). Addition of an AR NTD-specific Fab did not significantly alter the NTD density (Supplemental Figure 2B and 2D), suggesting that the NTDs in the context of full-length receptor are less disordered and likely stabilized by its interaction with the LBDs. However, we did observe that the two NTDs adopt different conformations, indicating a plasticity of the NTD to adapt to different conformations likely contingent upon its binding partners.
It is recognized that the AR LBD has a weak transcriptional activation function. Despite high sequence homology and overall structure similarity between AR and ERα LBDs, the AR LBD interacts weakly with LXXLL motif-containing coactivators, such as SRCs, (Brzozowski et al., 1997; Dubbink et al., 2006; He et al., 2004; He et al., 1999; Matias et al., 2000; Nadal et al., 2017). It prefers binding to the FXXLF sequence present in the NTD in contrast to what was seen with the ERα LBD (Dubbink et al., 2006; He et al., 2004; Hsu et al., 2003; Hur et al., 2004). Our AR/coactivator complex structure demonstrates that the difference between the AR and ERα NTD structures is also an important factor contributing to the difference between the two receptors in their interaction with coactivators. This unique FXXLF motif-mediated N/C interaction is not observed in other steroid receptors. Through this interaction the AR NTD covers most of LBD surfaces to limit the accessibility of LBD to coactivators. This could explain why AR has a strong AF-1 function while having a weak AF-2 function.
We observed several major structural differences between the two receptor/coactivator complexes. First, ERα recruits two SRC-3 molecules, while AR only recruits one SRC-3 molecule. Second, SRC-3 mainly interacts with the ERα LBD via its LXXLL motifs, while it interacts with AR NTD mainly through its N-terminal regions. Third, ERα does not directly recruit p300, while AR interacts with p300 mainly through two NTDs. The AR NTD (540–560 amino acids) is substantially longer than ER NTD (180 amino acids). We found previously that the ERα NTDs are located at two sides of the LBD dimer. Two SRC-3 molecules interact with the coactivator binding groove located on each of the LBD monomers (Yi et al., 2015). The relatively large-sized AR NTDs, however, wrap around the LBDs, blocking the access of SRC-3 to the LBD. Consequently, SRC-3 is solely recruited by the AR NTD, and p300 recruitment is stabilized by contacting two AR NTDs. Our structural data is consistent with previous reports that the AR NTD has a strong activation function and that many coactivators, including SRCs and CBP/p300, can be recruited through its AR NTD (Alen et al., 1999; Jenster et al., 1995; Jenster et al., 1992; Lavery and McEwan, 2008a; Quayle et al., 2007). Only one SRC-3 molecule was found in the ARE-DNA/AR/coactivator complex (Supplemental Figure 3G, 3H, Ab labeling). This finding is likely the result of different conformations of the two NTDs. The NTD-b recruits SRC-3. The NTD-a, which appears to adopt a more extended conformation and apparently mediates both intra- and inter-molecular N/C interactions, might not to be optimal for interaction with SRC-3. We also noticed that the two NTD Fabs do not have equal density in the antibody-labeled ARE-DNA/AR density map (Figures 2A and Supplemental Figures 2B, 2C). The labeling efficiency of NTD-a is much lower than NTD-b, suggesting that the Fab recognition epitope is partially buried in NTD-a due to a conformational change as compared to NTD-b. These data further support the notion that different NTD conformations lead to different coactivator recruitments to each individual NTD. Steric hindrance from direct interaction between p300 and AR NTDs could be another reason to prevent recruitment of a second SRC-3 molecule to the complex (Supplemental Figure 4C).
Interestingly, no SRC-3 and full-length AR interaction was observed in the absence of androgen (Figure 4B), even though SRC-3 only interacts with the AR NTD. It was previously shown that an AR N/C interaction is induced upon androgen stimulation (Schaufele et al., 2005). It is likely that androgen-induced N/C interaction positions the NTD in an optimal conformation for interacting with SRC-3. Without androgen stimulation or with AR antagonist treatment, AR NTDs may adopt different conformations and therefore have lower binding affinities with coactivators in the context of full-length receptor. Our AR-Ab2 labeled AR docking into AR/coactivator complex images (Supplemental Figure 5E) reveal that the SRC-3 binding site is right next to AR-Ab2 recognized region (i.e. FXXLF motif adjacent region), further substantiating the importance of N/C interaction-induced NTD conformational change in coactivator recruitment. Disrupting allosteric regulation of the NTD structure conveyed from LBD through the N/C interaction could be one important mechanism for antiandrogens to inhibit coactivator recruitment. On the other hand, antiandrogen-resistant AR mutations, such as an F876L mutation (Balbas et al., 2013), likely cause a LBD structural change, and consequently stabilize the active NTD conformation to convert an antiandrogen (e.g. enzalutamide) into an agonist. However, AR mutants containing an intact NTD (such as LBD-deletions or splicing variants lacking the LBD) are still very active. It is possible that in the absence of their LBDs, the AR NTDs may be in another active conformation that differs from the situation when the LBD is present.
It has been reported that AR positive prostate cancer cells are particularly sensitive to p300 inhibitors comparing to other solid tumor cells (Lasko et al., 2017). P300 inhibitor directly inhibits AR transcriptional activity and H3K27ac deposition at the ARE site (Lasko et al., 2017). Preclinical studies of a p300 inhibitor also reveal efficacy in patient-derived prostate tumor explants (Butler et al., 2019) and the growth of castration-resistant prostate cancer (Jin et al., 2017). The underlying mechanism for tumor selective sensitivity to p300 inhibition is not yet clear. Our structural and protein-protein interaction studies indicate that p300 directly interacts with AR in contrast to its indirect interaction with ERα. This differential interaction mechanism may be one of the factors contributing to p300 inhibitor sensitivity in prostate cancer. Both ERα and AR are primary drivers of breast cancer and prostate cancer development, respectively. Endocrine therapies against these receptors often encounter resistance. The gain-of-function ERα LBD mutations are frequently found in metastatic endocrine-resistant breast cancers (Jeselsohn et al., 2014; Robinson et al., 2013; Spoerke et al., 2016; Toy et al., 2013; Zhang et al., 1997) and recruit elevated levels of the SRC coactivators to EREs (Gates et al., 2018). In castration-resistant prostate cancers, AR splicing variants lacking an LBD, rather than LBD mutations, are important contributors for cancer progression (Antonarakis et al., 2014; Ware et al., 2014; Watson et al., 2010). Our structural studies presented here highlight the importance of the AR NTD in AR coactivator recruitment and provide mechanistic insights for observed differences between ERα and AR mutations in breast and prostate cancer.
STAR Methods
KEY RESOURCES TABLE
| REAGENT or RESOURCE | SOURCE | IDENTIFIER |
|---|---|---|
| Antibodies | ||
| ERα | Santa Cruz | Cat#Sc-8002 |
| SRC-3 | Monoclonal Antibody/Recombinant Protein Expression Core at BCM | N/A |
| AR-Ab1 | Monoclonal Antibody/Recombinant Protein Expression Core at BCM | AR Ab clone #705 |
| AR-Ab2 | Monoclonal Antibody/Recombinant Protein Expression Core at BCM | AR Ab clone #818 |
| Flag M2 beads | Sigma | Cat#F2426 |
| AR | Santa Cruz | Cat#Sc-816 |
| P300 | Santa Cruz | Cat#Sc-584 |
| Flag-HRP | Sigma | Cat#A8592 |
| Chemicals, Peptides, and Recombinant Proteins | ||
| ERα | Thermo Fisher | Cat#A15674 |
| SRC-3 | Monoclonal Antibody/Recombinant Protein Expression Core at BCM | N/A |
| P300 | Monoclonal Antibody/Recombinant Protein Expression Core at BCM | N/A |
| AR | Monoclonal Antibody/Recombinant Protein Expression Core at BCM | N/A |
| Dynabeads™ M-280 Streptavidin | Thermo Fisher | Cat#11205D |
| R1881 | Sigma | Cat#R0908 |
| Glutathione Sepharose 4B | GE Life Sciences | Cat#17075601 |
| Pierce Fab Micro Preparation Kit | Thermo Fisher | Cat#44685 |
| Tri-reagent | Molecular Research Center | Cat#TR118 |
| Turbo DNase | Thermo Fisher | Cat#AM2239 |
| 17β-estradiol | Sigma | Cat#E2758 |
| Experimental Models: Cell Lines | ||
| HEK 293T/17 | Tissue Culture Core (BCM) | Cat#ATCC® CRL-11268™ |
| Sf9 | Monoclonal Antibody/recombinant Protein Expression Core (BCM) | Cat# ATCC® CRL-1711™ |
| Bacterial and Virus Strains | ||
| E.coli BL21 (DE3) | Agilent | Cat#200131 |
| Recombinant DNA | ||
| pCDNA3.1-flag-AR WT/Mut | This study | N/A |
| pCMV-flag-SRC-3 WT/Mut | This study | N/A |
| pGEX-SRC-3 fragments | Yi et al. 2015 Mol. Cell | N/A |
| 3XARE-E4 | This study | N/A |
| Oligonucleotides | ||
| ARE III PCR forward primer | Thermo Fisher | N/A |
| ARE III PCR reverse primer | Thermo Fisher | N/A |
| ARE oligonucleotide | Santa Cruz | Cat#sc-2551 |
| Deposited Data | ||
| CryoEM maps of AR complexes | This study | EMD-22079 and 22080 |
| Software and Algorithms | ||
| EMAN2.2 | https://cryoem.bcm.edu/cryoem/downloads/view_eman2_versions | N/A |
| Relion3.0 | https://www3.mrc-lmb.cam.ac.uk/relion/index.php/Download_%26_install | N/A |
| gctf | https://www2.mrc-lmb.cam.ac.uk/research/locally-developed-software/zhang-software/ | N/A |
| Chimera | https://www.cgl.ucsf.edu/chimera/download.html | N/A |
| ChimeraX | https://www.rbvi.ucsf.edu/chimerax/download.html | N/A |
| Other | ||
| SerialEM | http://bio3d.colorado.edu/SerialEM/ | N/A |
RESOURCE AVAILABILITY
Lead Contact
Further information and requests for resources and reagents should be directed to and will be fulfilled by the Lead Contact, Bert O’Malley (berto@bcm.edu).
Materials Availability
Plasmids generated in this study will be available upon request.
Data and Code Availability
All the cryo-EM maps have been deposited to EMDB under accession code EMD-22079 and EMD-22080.
EXPERIMENTAL MODEL AND SUBJECT DETAILS
Cell line culture
293T Cells were cultured at 37°C in Dulbecco’s Modified Eagle Medium (DMEM, Gibco) supplemented with 10% Fetal Bovine Serum (Gibco) and 100 U/ml Penicillin-Streptomycin (Gibco).
Source organisms
Human AR, SRC-3 and p300 expressing DNA were cloned into baculovirus expression vectors. Recombinant proteins were expressed in Sf9 insect cells (Spinner Culture at 27°C.) through baculovirus infection. GST-tagged human SRC-3 fragmented proteins were expressed in E.coli cultured at 37°C.
METHOD DETAILS
Protein purification
Sf9 insect cells were infected with flag-AR expressing baculoviruses (that were produced in BCM Monoclonal Antibody/recombinant Protein Expression Core Facility). Cells were cultured in the presence of 1 μM R1881 24 hours post-infection. Cells were harvested 48 hours post-infection. Cells were washed and pelleted down at 5,000 rpm for 10 minutes at 4°C. Sf9 cells were further resuspended in lysis buffer (50 mM Tris-HCl, pH8.0; 150 mM NaCl; 100 nM R1881; 0.5% NP40) and lysed using a homogenizer. After 40 minutes centrifugation at 15,000 rpm, the cleared lysate was incubated with Ni-NTA (Qiagen) resins, washed three times with wash buffer (50 mM Tris-HCl, pH8.0; 150 mM NaCl; 100 nM R1881; 0.05% NP40; 25 mM imidazole) and finally eluted with elution buffer (50 mM Tris-HCl, pH8.0; 150 mM NaCl; 100 nM R1881; 0.05% NP40; 300 mM imidazole). Eluted protein was further applied on a gel-filtration column (Superdex 200 Increase 10/300 GL, GE Healthcare) pre-equilibrated with gel filtration buffer (50 mM Tris-HCl, pH8.0; 150 mM NaCl; 100 nM R1881; 0.05% NP40). Purified protein fractions were pooled together (~0.5 mg/ml) and for all the studies.
Cell-free transcription
The 3xARE3–E4 DNA template contains three copies of the ARE-III from the human PSA/KLK3 gene enhancer (Cleutjens et al., 1997) fused to the minimal Adenovirus E4 gene promoter. It was assembled into chromatin using HeLa core histone using a salt dilution method as described (Panigrahi et al., 2018). Each in vitro transcription reaction (50 μL) contained 0.2 pmoles of chromatinized 3xARE3–E4 in 12 mM HEPES-KOH (pH7.9), 12% glycerol, 60 mM KCl, 12 mM MgCl2, 0.12 mM EDTA, 0.3 mM DTT, 1 mM ATP, 0.9 mM acetyl CoA, 2% Poly(vinyl alcohol) diluted in DEPC-treated H2O, 100 nM R1881, and 50 μg of HeLa S3 nuclear extract (NE). The reactions were run in duplicate and the HeLa S3 NE was prepared as described (Foulds et al., 2013). Where indicated, reactions included recombinant AR (1 ng), p300 (6 ng), and/or SRC-3 (3 ng) protein. After incubating at room temperature for 25 min to allow for preinitiation complex assembly, 5 μL of 5 mM NTPs was added to allow for active transcription and the samples were transferred to 30°C for 50 min. 250 μL of Tri-reagent was added to each reaction, mixed by vortexing, and then 15 μL of BAN (4-bromoanisole) was added to phase separate the RNA from the DNA and protein. The RNA was then isolated and purified following the manufacturer’s protocol (Molecular Research Center). The RNA precipitates were dissolved in 35 μL DEPC-treated H2O and then treated with Turbo DNase (Ambion) following manufacturer’s protocol to remove any DNA contamination; 2 μL of each RNA sample (5% of 40 μL final volume) were then used in One-step RT-qPCR reactions (Bioline) utilizing an E4 gene primer pair. An additional qPCR reaction containing 10 fmoles of the template DNA was included to normalize Ct values. Results were normalized to the transcript levels from the reactions without any recombinant protein added (i.e. basal transcription) to determine relative E4 mRNA fold change. Statistical test used was the Student’s t test and p<0.05 was considered significant.
Antibody labeling
An AR NTD-specific monoclonal antibodies and SRC-3-specific monoclonal antibody were processed into Fab fragments using a Fab Micro Preparation Kit (Pierce) following manufacturer’s instructions. 20 μl of ARE-bound AR was incubated with several different concentrations of AR Fabs and the highest concentration of Fab not causing protein sample aggregation was chosen for antibody labeling experiment. 20 μl of the ARE DNA-bound AR/SRC-3/p300 complex was purified after release by restriction enzyme digestion from magnetic streptavidin beads and was then incubated with the AR or SRC-3 Fab fragment on ice for 1 hour. The sample was then subjected to cryo-freezing preparation.
In vitro protein-protein interaction assays
Flag-tagged full-length AR, AR (1–669), or AR (600–920) constructs were transiently transfected into 293T cells. The cells were harvested two days after transfection and lysed in lysis buffer (20mM Tris-HCl, pH 8.0, 125mM NaCl, 0.5% NP-40, 20mM NaF, 0.2mM Na3VO4, 2mM EDTA, 1mM DTT, and protease inhibitors). The cell lysates were incubated with anti-Flag-M2 antibody Sepharose beads (Sigma) for 3 hours, washed 3 times in wash buffer (20mM HEPES pH 7.6, 150mM KCl, 1mM DTT, 0.1% NP-40 (Anatrace), 8% glycerol and protease inhibitor cocktail), and then eluted using 3X flag peptide (Sigma). Equal amounts of eluted AR proteins were then incubated with 20 ng of purified SRC-3 proteins on ice for 3 hours in the presence of 100 nM of R1881 followed by immunoprecipitation using an anti-SRC-3 antibody (produced in house). SRC-3-associated AR proteins were then detected by immunoblotting analysis using an anti-flag M2 antibody (Sigma).
293T cells were transiently transfected with Flag-tagged SRC-3 WT, RID mutant, or Δ1+2 mutant construct and were later lysed in lysis buffer. Cell lysates were incubated with purified AR or ERα protein for 3 hours at 4°C in the absence or presence of 100 nM of R1881 or 17β-estradiol, respectively. Immunoprecipitation was then carried out using an anti-AR (Santa Cruz, N-20) or anti-ERα antibody (Santa Cruz, F-10) followed by immunoblotting analysis using a flag-specific antibody to detect association of SRC-3 with AR or ERα.
For the effect of SRC-3 on AR-p300 in vitro interaction, different concentrations of AR (10, 25, 50 or 100 ng) and p300 (20, 50, 100 or 200 ng) were incubated with 100 ng of biotinylated ARE-containing DNA, 1 μM R1881 in the absence or presence of 50 ng of SRC-3. The AR associated SRC-3 and p300 were then pulled-down using magnetic streptavidin beads followed by Western blot analysis using specific antibodies. For the effect of different concentrations of SRC-3 on low concentrated AR-p300 interaction, 0, 12.5, 25 and 37.5 ng of SRC-3 was incubated with 12.5 ng of AR, 25 ng of p300, 100 ng of biotinylated ARE-containing DNA, and 1 μM R1881 followed by magnetic streptavidin pull-down.
GST pull-down assays
Different GST-fused SRC-3 fragments were expressed in E. coli and bound to 5 μl of glutathione beads for 1 hr at 4°C. After extensive washing in buffer (20mM HEPES pH 7.6, 150mM KCl, 1mM DTT, 0.1% NP-40, 8% glycerol and protease inhibitor cocktail), the beads were then incubated with purified AR or ERα protein (Invitrogen) in the presence of 100 nM R1881 or 100 nM 17β-estradiol (Sigma). GST-SRC-3 associated AR or ERα protein was determined by immunoblotting analysis using an anti-AR (Santa Cruz, N-20) or anti-ERα antibody (Santa Cruz, F-10).
Cryo-EM Specimen Preparation and Data Collection
For the structure of DNA-bound AR, purified flag-tagged AR was incubated with a 32 bp ARE consensus oligo (Santa Cruz, sc-2551) in the presence of 1 μM synthetic androgen R1881. For the structure of DNA-bound AR/SRC-3/p300 complex, a 324 bp long biotinylated ARE containing DNA was used. The DNA was obtained through PCR using AR target gene KLK3/PSA enhancer (ARE-III) as a template (PCR primers: Forward, 5’-ACTGGGACAACTTGCAAACC-3’; Reverse, 5’-ACAGTGTTGGGAGGCAATTC-3’). 0.6 μg of recombinant AR, SRC-3 and p300 proteins were incubated with 200 ng of ARE DNA in the presence of 1 μM R1881 on ice for 1 hour. The mixture was then incubated with 15 μl Dynabeads M280 streptavidin (Invitrogen) for 15 minutes at room temperature followed by restriction enzyme digestion to release the DNA-bound protein complex from the beads.
The sample was kept on ice before vitrification (Dubochet et al., 1988) on the grid. A 3.5 μl aliquot of sample was applied onto a 200-mesh R1.2/1.3 Quantifoil holy carbon grid covered with graphene oxide (GO)-coated grid. After applying the sample, the grid was blotted and rapidly frozen in liquid ethane using a Vitrobot IV (FEI), with constant temperature and humidity during the process of blotting. The grid was stored in liquid nitrogen before imaging.
1,958 movie stacks for ARE-DNA/AR at 300 kV on K2 summit on the NCEF Titan Krios. Images of ARE-DNA/AR were collected in dose fractionation super-resolution counting mode at 105,000x magnification, corresponding to a calibrated physical pixel size of 1.39 Å, with a defocus range from −1.0 to −2.5 μm. The total exposure time for the dataset was 10 s, leading to a total accumulated dose of 50 electrons*Å−2 on the specimen. Each image stack was fractionated into 50 subframes, each with an accumulation time of 0.2 s per frame.
5,741 movie stacks for ARE-DNA/AR/SRC-3/p300 complex were collected at 300 kV on JEM3200FSC electron microscope (JEOL) with an in-column energy filter (30 ev width) equipped with a direct electron detector K2 Summit camera (GATAN). Images of ARE-DNA/AR/SRC-3/p300 were collected semi-automatically by SerialEM (Mastronarde, 2005) in dose fractionation super-resolution counting mode at 20,000x magnification, corresponding to a calibrated physical pixel size of 1.74 Å, with a defocus range from −1.2 to −2.8 μm. The total exposure time for the dataset was 10 s, leading to a total accumulated dose of 53 electrons*Å−2 on the specimen. Each image stack was fractionated into 50 subframes, each with an accumulation time of 0.2 s per frame.
Following the same procedure with ARE-DNA/AR/SRC-3/p300, grids of the ARE-DNA/AR sample with AR-Ab1 or AR-Ab2 and ARE-DNA/AR/SRC-3/p300 sample with AR-Ab2 or SRC-3-Ab were prepared. The images of these four samples were taken in the same procedure as ARE-DNA/AR/SRC-3/p300 mentioned above. The total image numbers of these four samples are shown in Supplemental Table 1.
Cryo-EM data processing
The final frame average of ARE-DNA/AR and ARE-DNA/AR/SRC-3/p300 were computed from averages of every three consecutive frames to correct beam-induced motion correction during exposure by MotionCor2 (Zheng et al., 2017) CTF parameters of the particles in each frame average was determined by program e2ctf.py in EMAN2 (Tang et al., 2007) and Gctf 0.50 (Zhang, 2016). A total of 223,299 particles images for ARE-DNA/AR and 869,561 particles images for ARE-DNA/AR/SRC-3/p300 were automatically boxed out by newly developed e2boxer.py in EMAN2 (Bell et al., 2016) with a box size of 200 × 200 pixels using the averaged sum of 50 raw frames per specimen area. The particle intensity in each frame was weighted according to a radiation damage model (courtesy of B. Bammes of Direct Electron, LP). 2D reference free class averages were computed by RELION 2.2 (Scheres, 2012). Initial models for every reconstruction were generated from scratch by e2initialmodel.py program (Tang et al., 2007) using selected good quality 2D averages based on the 2D averages results. Refinements were carried out by RELION 2.1 (Scheres, 2012), low pass filtered to 60Å, with search angle of 7.5 degrees for 11 iterations and subsequently with an angular sampling of 0.9375 degrees for 14 iterations. 30,958 particles images for ARE-DNA/AR and 53,198 particles images for ARE-DNA/AR/SRC-3/p300 were applied to final reconstruction yielding a resolution of 12.6 Å and 20 Å, respectively, at 0.143 of the Fourier shell correlation (FSC).
Following the same procedure, other antibody related structures were carried out. The particle numbers and final resolution are shown in Supplemental Table 1.
Map segmentation
The global search of LBD dimer crystal structure (PDB ID: 5jjm) docking into the ARE-DNA/AR density map was carried out using the UCSF Chimera 1.14 software. LBD dimer crystal structure was first applied to fitmap search with low pass filtered to specified resolution about 10 Å. In global search, 100 initial placements of the LBD dimer model within the ARE-DNA/AR density map were generated randomly, and then subjected to local optimization. The resulting unique fits are listed in a separate dialog, the Fit List. We chose the highest fitting score in the list at 0.916 with 0.929 inside ratio as the LBD position.
Full segmentation of the complex followed the same protocol as ER complex using Segger in Chimera with watershed algorithm (Pintilie and Chiu, 2012). Regions of each segment were identified by specific antibody labeling first. The ratio between each segmented component volume is consistent with the ratio of corresponding domain masses. The boundary of ARE-DNA/AR segmented domains was determined according to the rigid body docking result of LBD crystal structures and the relative ratios of each domain. The boundary between each component in the ARE-DNA/AR/SRC-3/p300 complex was refined based on the previous knowledge of AR, p300 and SRC-3. The ratio between each component was validated by the molecular weight ratio as described in the previous ER structures (Yi et al., 2017; Yi et al., 2015).
QUANTIFICATION AND STATISTICAL ANALYSIS
The intensities of Western blot bands were quantified using Scion Image. Statistical test used in this study was the Student’s t test using Excel. The n number is three independent experiments with duplicates in each experiment. The error bar represents standard error of the mean (SEM). p<0.05 was considered statistically significant.
Supplementary Material
Supplemental movie 1: ARE DNA-bound AR dimer segmentation and labeling in each functional domain. Related to Figure 1.
Supplemental movie 2: ARE DNA-bound AR/SRC-3/p300 complex cryoEM map with each component labeled and domain segmented ARE-DNA/AR density. Related to Figure 3
Supplemental movie 3: NTD and LBD annotation in ARE DNA-bound AR dimer by antibody labeling. Related to Figure 2.
Highlights:
Full-length AR follows a unique head-to-head and tail-to-tail dimerization
AR LBD and DBD and NTD all form the dimerization interface.
AR interacts with one SRC-3 and one p300
AR N-terminal domain plays a major role in recruiting SRC-3 and p300
Acknowledgements:
This work is supported by NIH-NICHD and grants (HD8818 , HD07857, and NIDDK59820 to B.W.O. , GM080139 and GM121203 to S.L.); DOD W81XWH-15-1-0536 to P.Y.; CPRIT grant (RP150648 to B.W.O., P.Y.); the Robert Welch Foundation (Q-1967-20180324 and BCM BMB department seed funds to Z.W.), and NCI Cancer Center Support Grant P30CA125123 (BCM Monoclonal Antibody/recombinant Protein Expression Core Facility). We acknowledge use of the Cryo-EM supported by Advanced Technology CPRIT Cryo-EM/ET Core (1RP190602) at BCM.
Footnotes
Publisher's Disclaimer: This is a PDF file of an unedited manuscript that has been accepted for publication. As a service to our customers we are providing this early version of the manuscript. The manuscript will undergo copyediting, typesetting, and review of the resulting proof before it is published in its final form. Please note that during the production process errors may be discovered which could affect the content, and all legal disclaimers that apply to the journal pertain.
Declaration of Interests
The authors declare no competing interests.
References
- Alen P, Claessens F, Verhoeven G, Rombauts W, and Peeters B (1999). The androgen receptor amino-terminal domain plays a key role in p160 coactivator-stimulated gene transcription. Mol Cell Biol 19, 6085–6097. [DOI] [PMC free article] [PubMed] [Google Scholar]
- Antonarakis ES, Lu C, Wang H, Luber B, Nakazawa M, Roeser JC, Chen Y, Mohammad TA, Fedor HL, Lotan TL, et al. (2014). AR-V7 and resistance to enzalutamide and abiraterone in prostate cancer. N Engl J Med 371, 1028–1038. [DOI] [PMC free article] [PubMed] [Google Scholar]
- Balbas MD, Evans MJ, Hosfield DJ, Wongvipat J, Arora VK, Watson PA, Chen Y, Greene GL, Shen Y, and Sawyers CL (2013). Overcoming mutation-based resistance to antiandrogens with rational drug design. Elife 2, e00499. [DOI] [PMC free article] [PubMed] [Google Scholar]
- Bell JM, Chen M, Baldwin PR, and Ludtke SJ (2016). High resolution single particle refinement in EMAN2.1. Methods 100, 25–34. [DOI] [PMC free article] [PubMed] [Google Scholar]
- Brzozowski AM, Pike AC, Dauter Z, Hubbard RE, Bonn T, Engstrom O, Ohman L, Greene GL, Gustafsson JA, and Carlquist M (1997). Molecular basis of agonism and antagonism in the oestrogen receptor. Nature 389, 753–758. [DOI] [PubMed] [Google Scholar]
- Butler L, Irani S, Centenera M, Ryan N, Pegg N, and Brooks AN (2019). Preclinical investigation of a small molecule inhibitor of p300/CBP reveals efficacy in patient-derived prostate tumor explants. Journal of Clinical Oncology 37, e16534–e16534. [Google Scholar]
- Chandra V, Huang P, Hamuro Y, Raghuram S, Wang Y, Burris TP, and Rastinejad F (2008). Structure of the intact PPAR-gamma-RXR-nuclear receptor complex on DNA. Nature 456, 350–356. [DOI] [PMC free article] [PubMed] [Google Scholar]
- Chandra V, Huang P, Potluri N, Wu D, Kim Y, and Rastinejad F (2013). Multidomain integration in the structure of the HNF-4alpha nuclear receptor complex. Nature 495, 394–398. [DOI] [PMC free article] [PubMed] [Google Scholar]
- Cleutjens KB, van der Korput HA, van Eekelen CC, van Rooij HC, Faber PW, and Trapman J (1997). An androgen response element in a far upstream enhancer region is essential for high, androgen-regulated activity of the prostate-specific antigen promoter. Mol Endocrinol 11, 148–161. [DOI] [PubMed] [Google Scholar]
- Ding XF, Anderson CM, Ma H, Hong H, Uht RM, Kushner PJ, and Stallcup MR (1998). Nuclear receptor-binding sites of coactivators glucocorticoid receptor interacting protein 1 (GRIP1) and steroid receptor coactivator 1 (SRC-1): multiple motifs with different binding specificities. Mol Endocrinol 12, 302–313. [DOI] [PubMed] [Google Scholar]
- Dubbink HJ, Hersmus R, Pike AC, Molier M, Brinkmann AO, Jenster G, and Trapman J (2006). Androgen receptor ligand-binding domain interaction and nuclear receptor specificity of FXXLF and LXXLL motifs as determined by L/F swapping. Mol Endocrinol 20, 1742–1755. [DOI] [PubMed] [Google Scholar]
- Dubbink HJ, Hersmus R, Verma CS, van der Korput HA, Berrevoets CA, van Tol J, Ziel-van der Made AC, Brinkmann AO, Pike AC, and Trapman J (2004). Distinct recognition modes of FXXLF and LXXLL motifs by the androgen receptor. Mol Endocrinol 18, 2132–2150. [DOI] [PubMed] [Google Scholar]
- Dubochet J, Adrian M, Chang JJ, Homo JC, Lepault J, McDowall AW, and Schultz P (1988). Cryo-electron microscopy of vitrified specimens. Q Rev Biophys 21, 129–228. [DOI] [PubMed] [Google Scholar]
- Foulds CE, Feng Q, Ding C, Bailey S, Hunsaker TL, Malovannaya A, Hamilton RA, Gates LA, Zhang Z, Li C, et al. (2013). Proteomic Analysis of Coregulators Bound to ERalpha on DNA and Nucleosomes Reveals Coregulator Dynamics. Mol Cell. [DOI] [PMC free article] [PubMed] [Google Scholar]
- Gates LA, Gu G, Chen Y, Rohira AD, Lei JT, Hamilton RA, Yu Y, Lonard DM, Wang J, Wang SP, et al. (2018). Proteomic profiling identifies key coactivators utilized by mutant ERalpha proteins as potential new therapeutic targets. Oncogene 37, 4581–4598. [DOI] [PMC free article] [PubMed] [Google Scholar]
- Guo Z, Yang X, Sun F, Jiang R, Linn DE, Chen H, Kong X, Melamed J, Tepper CG, Kung HJ, et al. (2009). A novel androgen receptor splice variant is up-regulated during prostate cancer progression and promotes androgen depletion-resistant growth. Cancer Res 69, 2305–2313. [DOI] [PMC free article] [PubMed] [Google Scholar]
- He B, Gampe RT Jr., Kole AJ, Hnat AT, Stanley TB, An G, Stewart EL, Kalman RI, Minges JT, and Wilson EM (2004). Structural basis for androgen receptor interdomain and coactivator interactions suggests a transition in nuclear receptor activation function dominance. Mol Cell 16, 425–438. [DOI] [PubMed] [Google Scholar]
- He B, Kemppainen JA, Voegel JJ, Gronemeyer H, and Wilson EM (1999). Activation function 2 in the human androgen receptor ligand binding domain mediates interdomain communication with the NH(2)-terminal domain. J Biol Chem 274, 37219–37225. [DOI] [PubMed] [Google Scholar]
- He B, Kemppainen JA, and Wilson EM (2000). FXXLF and WXXLF sequences mediate the NH2-terminal interaction with the ligand binding domain of the androgen receptor. J Biol Chem 275, 22986–22994. [DOI] [PubMed] [Google Scholar]
- He B, Lee LW, Minges JT, and Wilson EM (2002). Dependence of selective gene activation on the androgen receptor NH2-and COOH-terminal interaction. J Biol Chem 277, 25631–25639. [DOI] [PubMed] [Google Scholar]
- Heery DM, Kalkhoven E, Hoare S, and Parker MG (1997). A signature motif in transcriptional coactivators mediates binding to nuclear receptors. Nature 387, 733–736. [DOI] [PubMed] [Google Scholar]
- Henderson R, Sali A, Baker ML, Carragher B, Devkota B, Downing KH, Egelman EH, Feng Z, Frank J, Grigorieff N, et al. (2012). Outcome of the first electron microscopy validation task force meeting. Structure 20, 205–214. [DOI] [PMC free article] [PubMed] [Google Scholar]
- Hsu CL, Chen YL, Yeh S, Ting HJ, Hu YC, Lin H, Wang X, and Chang C (2003). The use of phage display technique for the isolation of androgen receptor interacting peptides with (F/W)XXL(F/W) and FXXLY new signature motifs. J Biol Chem 278, 23691–23698. [DOI] [PubMed] [Google Scholar]
- Hur E, Pfaff SJ, Payne ES, Gron H, Buehrer BM, and Fletterick RJ (2004). Recognition and accommodation at the androgen receptor coactivator binding interface. PLoS Biol 2, E274. [DOI] [PMC free article] [PubMed] [Google Scholar]
- Jenster G, van der Korput HA, Trapman J, and Brinkmann AO (1995). Identification of two transcription activation units in the N-terminal domain of the human androgen receptor. J Biol Chem 270, 7341–7346. [DOI] [PubMed] [Google Scholar]
- Jenster G, van der Korput HA, van Vroonhoven C, van der Kwast TH, Trapman J, and Brinkmann AO (1991). Domains of the human androgen receptor involved in steroid binding, transcriptional activation, and subcellular localization. Mol Endocrinol 5, 1396–1404. [DOI] [PubMed] [Google Scholar]
- Jenster G, van der Korput JA, Trapman J, and Brinkmann AO (1992). Functional domains of the human androgen receptor. J Steroid Biochem Mol Biol 41, 671–675. [DOI] [PubMed] [Google Scholar]
- Jeselsohn R, Yelensky R, Buchwalter G, Frampton G, Meric-Bernstam F, Gonzalez-Angulo AM, Ferrer-Lozano J, Perez-Fidalgo JA, Cristofanilli M, Gomez H, et al. (2014). Emergence of constitutively active estrogen receptor-alpha mutations in pretreated advanced estrogen receptor-positive breast cancer. Clin Cancer Res 20, 1757–1767. [DOI] [PMC free article] [PubMed] [Google Scholar]
- Jin L, Garcia J, Chan E, de la Cruz C, Segal E, Merchant M, Kharbanda S, Raisner R, Haverty PM, Modrusan Z, et al. (2017). Therapeutic Targeting of the CBP/p300 Bromodomain Blocks the Growth of Castration-Resistant Prostate Cancer. Cancer Res 77, 5564–5575. [DOI] [PubMed] [Google Scholar]
- Kumar R, Betney R, Li J, Thompson EB, and McEwan IJ (2004). Induced alpha-helix structure in AF1 of the androgen receptor upon binding transcription factor TFIIF. Biochemistry 43, 3008–3013. [DOI] [PubMed] [Google Scholar]
- Kumar V, Green S, Stack G, Berry M, Jin JR, and Chambon P (1987). Functional domains of the human estrogen receptor. Cell 51, 941–951. [DOI] [PubMed] [Google Scholar]
- Langley E, Kemppainen JA, and Wilson EM (1998). Intermolecular NH2-/carboxyl-terminal interactions in androgen receptor dimerization revealed by mutations that cause androgen insensitivity. J Biol Chem 273, 92–101. [DOI] [PubMed] [Google Scholar]
- Langley E, Zhou ZX, and Wilson EM (1995). Evidence for an anti-parallel orientation of the ligand-activated human androgen receptor dimer. J Biol Chem 270, 29983–29990. [DOI] [PubMed] [Google Scholar]
- Lasko LM, Jakob CG, Edalji RP, Qiu W, Montgomery D, Digiammarino EL, Hansen TM, Risi RM, Frey R, Manaves V, et al. (2017). Discovery of a selective catalytic p300/CBP inhibitor that targets lineage-specific tumours. Nature 550, 128–132. [DOI] [PMC free article] [PubMed] [Google Scholar]
- Lavery DN, and McEwan IJ (2005). Structure and function of steroid receptor AF1 transactivation domains: induction of active conformations. Biochem J 391, 449–464. [DOI] [PMC free article] [PubMed] [Google Scholar]
- Lavery DN, and McEwan IJ (2008a). Functional characterization of the native NH2-terminal transactivation domain of the human androgen receptor: binding kinetics for interactions with TFIIF and SRC-1a. Biochemistry 47, 3352–3359. [DOI] [PubMed] [Google Scholar]
- Lavery DN, and McEwan IJ (2008b). Structural characterization of the native NH2-terminal transactivation domain of the human androgen receptor: a collapsed disordered conformation underlies structural plasticity and protein-induced folding. Biochemistry 47, 3360–3369. [DOI] [PubMed] [Google Scholar]
- Li J, Fu J, Toumazou C, Yoon HG, and Wong J (2006). A role of the amino-terminal (N) and carboxyl-terminal (C) interaction in binding of androgen receptor to chromatin. Mol Endocrinol 20, 776–785. [DOI] [PubMed] [Google Scholar]
- Lou X, Toresson G, Benod C, Suh JH, Philips KJ, Webb P, and Gustafsson JA (2014). Structure of the retinoid X receptor alpha-liver X receptor beta (RXRalpha-LXRbeta) heterodimer on DNA. Nat Struct Mol Biol 21, 277–281. [DOI] [PubMed] [Google Scholar]
- Mastronarde DN (2005). Automated electron microscope tomography using robust prediction of specimen movements. J Struct Biol 152, 36–51. [DOI] [PubMed] [Google Scholar]
- Matias PM, Donner P, Coelho R, Thomaz M, Peixoto C, Macedo S, Otto N, Joschko S, Scholz P, Wegg A, et al. (2000). Structural evidence for ligand specificity in the binding domain of the human androgen receptor. Implications for pathogenic gene mutations. J Biol Chem 275, 26164–26171. [DOI] [PubMed] [Google Scholar]
- McEwan IJ (2004). Molecular mechanisms of androgen receptor-mediated gene regulation: structure-function analysis of the AF-1 domain. Endocr Relat Cancer 11, 281–293. [DOI] [PubMed] [Google Scholar]
- Nadal M, Prekovic S, Gallastegui N, Helsen C, Abella M, Zielinska K, Gay M, Vilaseca M, Taules M, Houtsmuller AB, et al. (2017). Structure of the homodimeric androgen receptor ligand-binding domain. Nat Commun 8, 14388. [DOI] [PMC free article] [PubMed] [Google Scholar]
- Orlov I, Rochel N, Moras D, and Klaholz BP (2012). Structure of the full human RXR/VDR nuclear receptor heterodimer complex with its DR3 target DNA. Embo J 31, 291–300. [DOI] [PMC free article] [PubMed] [Google Scholar]
- Panigrahi AK, Foulds CE, Lanz RB, Hamilton RA, Yi P, Lonard DM, Tsai MJ, Tsai SY, and O’Malley BW (2018). SRC-3 Coactivator Governs Dynamic Estrogen-Induced Chromatin Looping Interactions during Transcription. Mol Cell 70, 679–694 e677. [DOI] [PMC free article] [PubMed] [Google Scholar]
- Pettersen EF, Goddard TD, Huang CC, Couch GS, Greenblatt DM, Meng EC, and Ferrin TE (2004). UCSF Chimera--a visualization system for exploratory research and analysis. J Comput Chem 25, 1605–1612. [DOI] [PubMed] [Google Scholar]
- Pintilie G, and Chiu W (2012). Comparison of Segger and other methods for segmentation and rigid-body docking of molecular components in cryo-EM density maps. Biopolymers 97, 742–760. [DOI] [PMC free article] [PubMed] [Google Scholar]
- Quayle SN, Mawji NR, Wang J, and Sadar MD (2007). Androgen receptor decoy molecules block the growth of prostate cancer. Proc Natl Acad Sci U S A 104, 1331–1336. [DOI] [PMC free article] [PubMed] [Google Scholar]
- Reid J, Kelly SM, Watt K, Price NC, and McEwan IJ (2002). Conformational analysis of the androgen receptor amino-terminal domain involved in transactivation. Influence of structure-stabilizing solutes and protein-protein interactions. J Biol Chem 277, 20079–20086. [DOI] [PubMed] [Google Scholar]
- Robinson DR, Wu YM, Vats P, Su F, Lonigro RJ, Cao X, Kalyana-Sundaram S, Wang R, Ning Y, Hodges L, et al. (2013). Activating ESR1 mutations in hormone-resistant metastatic breast cancer. Nat Genet 45, 1446–1451. [DOI] [PMC free article] [PubMed] [Google Scholar]
- Sack JS, Kish KF, Wang C, Attar RM, Kiefer SE, An Y, Wu GY, Scheffler JE, Salvati ME, Krystek SR Jr., et al. (2001). Crystallographic structures of the ligand-binding domains of the androgen receptor and its T877A mutant complexed with the natural agonist dihydrotestosterone. Proc Natl Acad Sci U S A 98, 4904–4909. [DOI] [PMC free article] [PubMed] [Google Scholar]
- Schaufele F, Carbonell X, Guerbadot M, Borngraeber S, Chapman MS, Ma AA, Miner JN, and Diamond MI (2005). The structural basis of androgen receptor activation: intramolecular and intermolecular amino-carboxy interactions. Proc Natl Acad Sci U S A 102, 9802–9807. [DOI] [PMC free article] [PubMed] [Google Scholar]
- Scheres SH (2012). RELION: implementation of a Bayesian approach to cryo-EM structure determination. J Struct Biol 180, 519–530. [DOI] [PMC free article] [PubMed] [Google Scholar]
- Schwabe JW, Chapman L, Finch JT, and Rhodes D (1993). The crystal structure of the estrogen receptor DNA-binding domain bound to DNA: how receptors discriminate between their response elements. Cell 75, 567–578. [DOI] [PubMed] [Google Scholar]
- Shaffer PL, Jivan A, Dollins DE, Claessens F, and Gewirth DT (2004). Structural basis of androgen receptor binding to selective androgen response elements. Proc Natl Acad Sci U S A 101, 4758–4763. [DOI] [PMC free article] [PubMed] [Google Scholar]
- Simental JA, Sar M, Lane MV, French FS, and Wilson EM (1991). Transcriptional activation and nuclear targeting signals of the human androgen receptor. J Biol Chem 266, 510–518. [PubMed] [Google Scholar]
- Spoerke JM, Gendreau S, Walter K, Qiu J, Wilson TR, Savage H, Aimi J, Derynck MK, Chen M, Chan IT, et al. (2016). Heterogeneity and clinical significance of ESR1 mutations in ER-positive metastatic breast cancer patients receiving fulvestrant. Nat Commun 7, 11579. [DOI] [PMC free article] [PubMed] [Google Scholar]
- Tang G, Peng L, Baldwin PR, Mann DS, Jiang W, Rees I, and Ludtke SJ (2007). EMAN2: an extensible image processing suite for electron microscopy. J Struct Biol 157, 38–46. [DOI] [PubMed] [Google Scholar]
- Tora L, White J, Brou C, Tasset D, Webster N, Scheer E, and Chambon P (1989). The human estrogen receptor has two independent nonacidic transcriptional activation functions. Cell 59, 477–487. [DOI] [PubMed] [Google Scholar]
- Toy W, Shen Y, Won H, Green B, Sakr RA, Will M, Li Z, Gala K, Fanning S, King TA, et al. (2013). ESR1 ligand-binding domain mutations in hormone-resistant breast cancer. Nat Genet 45, 1439–1445. [DOI] [PMC free article] [PubMed] [Google Scholar]
- van de Wijngaart DJ, Dubbink HJ, van Royen ME, Trapman J, and Jenster G (2012). Androgen receptor coregulators: recruitment via the coactivator binding groove. Mol Cell Endocrinol 352, 57–69. [DOI] [PubMed] [Google Scholar]
- van Royen ME, van Cappellen WA, de Vos C, Houtsmuller AB, and Trapman J (2012). Stepwise androgen receptor dimerization. J Cell Sci 125, 1970–1979. [DOI] [PubMed] [Google Scholar]
- Ware KE, Garcia-Blanco MA, Armstrong AJ, and Dehm SM (2014). Biologic and clinical significance of androgen receptor variants in castration resistant prostate cancer. Endocr Relat Cancer 21, T87–T103. [DOI] [PMC free article] [PubMed] [Google Scholar]
- Warnmark A, Treuter E, Wright AP, and Gustafsson JA (2003). Activation functions 1 and 2 of nuclear receptors: molecular strategies for transcriptional activation. Mol Endocrinol 17, 1901–1909. [DOI] [PubMed] [Google Scholar]
- Watson PA, Chen YF, Balbas MD, Wongvipat J, Socci ND, Viale A, Kim K, and Sawyers CL (2010). Constitutively active androgen receptor splice variants expressed in castration-resistant prostate cancer require full-length androgen receptor. Proc Natl Acad Sci U S A 107, 16759–16765. [DOI] [PMC free article] [PubMed] [Google Scholar]
- Yi P, Wang Z, Feng Q, Chou CK, Pintilie GD, Shen H, Foulds CE, Fan G, Serysheva I, Ludtke SJ, et al. (2017). Structural and Functional Impacts of ER Coactivator Sequential Recruitment. Mol Cell 67, 733–743 e734. [DOI] [PMC free article] [PubMed] [Google Scholar]
- Yi P, Wang Z, Feng Q, Pintilie GD, Foulds CE, Lanz RB, Ludtke SJ, Schmid MF, Chiu W, and O’Malley BW (2015). Structure of a biologically active estrogen receptor-coactivator complex on DNA. Mol Cell 57, 1047–1058. [DOI] [PMC free article] [PubMed] [Google Scholar]
- Zhang K (2016). Gctf: Real-time CTF determination and correction. J Struct Biol 193, 1–12. [DOI] [PMC free article] [PubMed] [Google Scholar]
- Zhang QX, Borg A, Wolf DM, Oesterreich S, and Fuqua SA (1997). An estrogen receptor mutant with strong hormone-independent activity from a metastatic breast cancer. Cancer Res 57, 1244–1249. [PubMed] [Google Scholar]
- Zheng SQ, Palovcak E, Armache JP, Verba KA, Cheng Y, and Agard DA (2017). MotionCor2: anisotropic correction of beam-induced motion for improved cryo-electron microscopy. Nat Methods 14, 331–332. [DOI] [PMC free article] [PubMed] [Google Scholar]
Associated Data
This section collects any data citations, data availability statements, or supplementary materials included in this article.
Supplementary Materials
Supplemental movie 1: ARE DNA-bound AR dimer segmentation and labeling in each functional domain. Related to Figure 1.
Supplemental movie 2: ARE DNA-bound AR/SRC-3/p300 complex cryoEM map with each component labeled and domain segmented ARE-DNA/AR density. Related to Figure 3
Supplemental movie 3: NTD and LBD annotation in ARE DNA-bound AR dimer by antibody labeling. Related to Figure 2.
Data Availability Statement
All the cryo-EM maps have been deposited to EMDB under accession code EMD-22079 and EMD-22080.