

Abstract
Mexican American adolescents have an increased risk for obesity compared to non-Hispanic Whites (NHWs), especially as their degree of acculturation increases. Snack intakes can impact diet quality and may affect obesity risk, yet little is known about differences in snack intakes among NHW and Mexican American adolescents from different acculturation groups. This study compared diet quality and snack intakes among NHW and Mexican American adolescents from different acculturation groups. This study used cross-sectional data from 3,636 Mexican American and NHW adolescents in the 2005–2014 National Health and Nutrition Examination Survey. Acculturation was defined based on generational status and language use. Outcomes were Healthy Eating Index-2015 (HEI-2015) score, daily energy intake from snacks, snack frequency, energy value of snacks, and percent contribution of snacks to total daily energy. Analysis of covariance was used to compare outcomes across groups, after adjustment for sex and income. In the full sample, mean HEI-2015 score was 45±0.4. Non-Hispanic White adolescents had modestly poorer diet quality compared to US-born adolescents with a foreign-born parent and Mexican-born adolescents (P<0.001). Mean daily snack intake was 583±16 kcal. Items in the Snacks and Sweets and Beverages categories contributed more than half of the energy provided by snacks. Non-Hispanic White adolescents had a greater total snack intake compared to all language use at home groups, except equal Spanish and English use. Improving the types of foods consumed as snacks has the potential to partially mitigate differences in snack intakes and diet quality among non-Hispanic White and Mexican American adolescents.
Keywords: acculturation, adolescent, diet, snack, Mexican American, disparities
INTRODUCTION
Among US adolescents, the prevalence of obesity is 20% and rising [1]. Poor snack choices can negatively impact overall diet quality and may have implications for obesity risk, although findings are inconsistent [2, 3]. In the US, the contribution of snacks to adolescents’ total daily energy intake increased from 22 to 27% between 1977 and 2006 [4]. Between 1977 and 2014, the number of snacks consumed per day doubled and the percent of adolescents who consumed snacks increased from 61 to 83% [5]. Further, energy-dense, nutrient-poor foods and beverages contribute an increasing amount to total daily snack kilocalories (kcal) among US adolescents [2, 4]. These increases in the quantity and frequency of snacks consumed, along with decreases in snack quality, have occurred in tandem with rising obesity [2, 4, 5].
Ethnic differences in overweight and obesity are well documented, with a greater prevalence among Mexican-Americans versus non-Hispanic Whites (NHWs) [6–8]; however, little is known about ethnic differences in snack intakes among Mexican American and NHW adolescents. Data from NHW, non-Hispanic Black and Hispanic adolescents indicate ethnic variation in snack intakes [5, 9]. However, these studies combine diverse Hispanic sub-groups into a single group, and are therefore unable to provide insight into differences in snack intakes between Mexican-American and NHW adolescents. Given the links between snacking behaviors and obesity, more research is needed to identify ethnic differences in snack intakes and how these differences may contribute to greater obesity prevalence among Mexican-American versus NHW adolescents.
Within the Mexican American population, some adolescents are more acculturated than others with respect to dietary practices [10]. Acculturation is the degree to which immigrants integrate into society by adopting behaviors of their host country [11, 12]. Overweight and obesity prevalence is higher among individuals with a greater degree of integration into Western societies [13–15]. The changes in dietary behaviors that occur with acculturation most often have a negative impact on the healthfulness of the diet and may partially explain greater obesity among more acculturated individuals [16]. Mexico is one of the largest sources of immigrants to the United States [17] and obesity prevalence is particularly high among Mexican American youth compared to other ethnic groups [18, 19]. Among Mexican American children and adolescents, increasing integration into American society has been linked to a higher risk for obesity; higher intake of saturated fat, added sugars and sweetened beverages; and lower intake of fruits and vegetables [10, 20–23]. When evaluating differences in snack intakes between NHWs and Mexican Americans, it is therefore important to stratify by the degree of acculturation because this stratification will help distinguish whether differences between NHWs and Mexican Americans apply to all acculturation groups, or if there are specific acculturation groups that are driving ethnic differences. Despite heterogeneity among Mexican American adolescents with respect to their degree of acculturation, no studies compare snack intakes among NHW and Mexican American adolescents from different acculturation groups.
If acculturation is associated with detrimental changes in snack intakes, this could provide insight into the factors driving ethnic disparities in obesity among Mexican American versus NHW adolescents. Identifying differences in diet quality and snack intakes among Mexican Americans and NHWs may support the development of effective strategies to reduce health disparities and the burden of obesity among Mexican American adolescents. The objective of this paper is to assess diet quality and snack intakes among Mexican American and NHW adolescents from the 2005–2014 NHANES, with a focus on differences between NHWs and Mexican Americans from different acculturation groups.
METHODS
Study design and data source.
Cross-sectional data from the 2005–2014 National Health and Nutrition Examination Surveys (NHANES) were analyzed [24]. Acculturation status was determined based on generational status and language use at home. Participants were selected using a complex, multistage, stratified sampling design [25]. For the current study, data from five, 2-year NHANES cycles (2005–2014) were aggregated into a single cross-sectional dataset. No NHANES restricted variables were used in the analysis. All NHANES data collection protocols were approved by The National Center for Health Statistics’ Research Ethics Review Board. Written informed consent was obtained from all individual participants included in the study or their proxies.
Sample participants.
The dataset included 3,947 adolescents, defined as individuals aged 12–19 years, with complete data on diet and sociodemographic characteristics. Self-reported data from 3,636 adolescents and their caregivers were included in the analyses. Adolescents with total energy intakes below 500 kcal/day were considered implausible reporters, and those individuals were excluded from the analysis (n=305). Mexican American adolescents with missing acculturation data for language use at home (n=6) were excluded from the analysis. Non-Hispanic white adolescents were included as a reference group. Compared to NHWs, obesity prevalence among Mexican-American adolescents is higher and increasing at a more rapid pace [19].
Acculturation measures.
To assess the differences in dietary intakes by levels of acculturation, methods similar to those described by Liu and colleagues [10] were used to classify adolescents. Acculturation status was operationalized in two ways: generational status and language use at home.
Place of birth was collected during the in-home interview as part of the demographic questionnaire. Generational status was defined based on adolescents’ place of birth as well as their parents’ place of birth and was operationalized using two questions. An adult proxy responded on behalf of participants who were under 16 years of age. First, participants or their proxies were asked “In what country (were you/was the sample participant) born?” Second, the household reference person was asked “In what country were you born?” The household reference person was defined as the household member who owned or rented the residence where the adolescent lived and was assumed to be the parent or primary caregiver of the adolescent. Adolescents were categorized into Mexican-born child if the adolescent was born in Mexico; US-born child, foreign-born parent if the adolescent was US born but the household reference person was non-US born; and US-born child, US-born parent if the adolescent and household reference person were both US born.
Information from the acculturation questionnaire was used to determine language use. For language use at home, Mexican Americans in NHANES were asked, “What language (do you/does the sample participant) usually speak at home?” Adolescents were categorized into one of five groups: only Spanish, more Spanish than English, equal Spanish and English, more English than Spanish, or only English. For the current study, adolescents in the “only Spanish” (n=239) and “more Spanish than English” (n=251) groups were merged into one group for analyses because of small sample sizes.
Dietary assessment.
Dietary intakes were estimated from one in-person, interviewer-administered 24-hr dietary recall. All other variables reported in the current study were collected through in-home interviews. The Automated Multiple Pass Approach developed by the US Department of Agriculture (USDA) [26] was used to assess children’s dietary intakes. Interviewers were trained to collect the specific foods and corresponding quantities and self-defined eating occasion (meals and snacks) for all foods and beverages consumed from midnight-to-midnight of the prior day. Adolescents were the primary respondents for the dietary recall in all 2-year NHANES cycles, and only received assistance from a parent, if necessary. Nutrients were estimated using the Food and Nutrition Database for Dietary Studies (FNDDS) [27]. MyPlate intake equivalents were estimated using the Food Patterns Equivalents Database (FPED) [27].
Healthy Eating Index-2015.
The Healthy Eating Index-2015 (HEI-2015) is a measure of diet quality that assesses how well individuals adhere to the 2015–2020 Dietary Guidelines for Americans [28, 29]. In the most recent version of the index (HEI-2015), individual diets are scored based on intake of 9 food groups (total fruit, whole fruit, total vegetables, greens & beans, whole grains, milk/dairy, total protein foods, seafood and plant proteins, refined grains), 1 nutrient (sodium), 1 nutrient ratio (fatty acid ratio), added sugars and saturated fats. Respondents are scored between zero and 100, with higher scores representing better diet quality [29]. A density approach (intakes per 1,000 kcal) is used for all HEI components except for the fatty acid ratio. Mean HEI scores, on a given day, were estimated using a simple scoring method.
Snacking intakes and food contributions to energy from snacks.
Eating occasions were categorized as snacks for these analyses based on respondents’ designation of a specified eating occasion that was not described as breakfast, lunch, dinner or supper. Total snack intake (kcal/day) was calculated as the sum of energy consumed at each snacking occasion over a 24-hour period. Snack frequency was defined as the number of unique snacking occasions during a 24-hour period regardless of the quantity of food consumed at each occasion. Average snacking portion (kcal/snack) was calculated from the total energy obtained from snack divided by the snack frequency. The proportion of the total daily energy intake obtained from snacks was calculated from the total snack intake divided by the total daily energy intake [30].
The individual foods and beverages consumed as snacks were classified using the What We Eat in America food categories [27]. The major food categories include Milk and Dairy, Protein Foods, Mixed Dishes, Grains, Snacks and Sweets, Fruit, Vegetables, Nonalcoholic Beverages, Alcoholic Beverages, Water, Fats and Oils, Condiments and Sauces, Sugars, Infant Formula and Baby Food and Other. Energy intake from the 14 What We Eat in America food categories as a percent of total snack intake was calculated as (snacking energy intakes from food category / total snack intake)*100%.
Analysis.
In the NHANES study design, adolescents, persons of low-income and Mexican Americans were intentionally oversampled in some cycles between 2005 and 2014 [24]; therefore, sample weights were used to avoid biased estimates at the national level. Reported sample sizes are unweighted. All variables were continuous except for acculturation status (categorical) and child sex (binary). Means and standard errors for all continuous variables and the proportion of male/female participants were calculated for the full sample and by acculturation status. Analysis of variance (ANOVA) was used to compare demographic characteristics for continuous variables among NHWs and Mexican American adolescents from different acculturation groups. Chi-square tests were used to compare the proportion of male/female participants by acculturation status.
Analysis of covariance (ANCOVA) was used to compare dietary outcomes (total daily energy intake, HEI-2015 score, total snack intake, snack frequency, snack portion, and snack intake as a proportion of total daily energy intake) among NHWs and Mexican American adolescents from different acculturation groups after adjustment for covariates (child sex and the ratio of family income to poverty (PIR)). A PIR below 1 indicates that the family is below the poverty threshold. Means reported for dietary outcomes are adjusted for covariates and weighted to be nationally-representative. All statistical analyses were conducted with SPSS software (version 21, IBM SPPS Inc, Chicago, IL) [31]. The Complex Sampling module in SPSS was used for computations that included standard errors or p-values to account for the complex sampling design. Statistical significance was set a priori at α = 0.05.
RESULTS
The final sample included 3,636 adolescents for generational status and 3,630 adolescents for language use at home (see Table 1 for demographics). Income was higher among more versus less acculturated adolescents for both generational status (PIR = 2.3 vs. 1.0, p < 0.001) and language use at home (PIR = 2.5 vs. 1.1, p < 0.001). Mean age ranged from 15.1 to 16.2 years and the proportion of female adolescents ranged from 45.6 to 49.9%.
Table 1.
Demographic characteristics by generational status and language use at home of Mexican American and Non-Hispanic white adolescents in the U.S., estimated from NHANES, 2005–2014
| Generational status | |||||
|---|---|---|---|---|---|
| Sample characteristics | Full sample (n=3,636) | Non-Hispanic White (n=1,856) | US-born child, US-born parent (n=558) | US-born child, Mex-born parent (n=773) | Mexican-born child (n=449) |
| Family PIRa* | 2.7 (0.1) | 3.0 (0.1) | 2.3 (0.1) | 1.4 (0.1) | 1.0 (0.04) |
| Number of people in household* | 4.4 (0.05) | 4.2 (0.1) | 4.6 (0.2) | 5.2 (0.1) | 5.4 (0.1) |
| Age, y* | 15.5 (0.1) | 15.5 (0.1) | 15.4 (0.2) | 15.2 (0.1) | 16.1 (0.1) |
| % female | 48.7 | 48.9 | 48.9 | 47.6 | 46.3 |
| Language use at home | |||||
| Sample characteristics | Only English (n=382) | More English than Spanish (n=376) | Equal Spanish and English (n=526) | Only or mostly Spanish (n=490) | |
| Family PIRa* | 2.5 (0.2) | 1.7 (0.1) | 1.2 (0.1) | 1.1 (0.1) | |
| Number of people in household* | 4.8 (0.2) | 5.1 (0.1) | 5.2 (0.1) | 4.9 (0.1) | |
| Age, y* | 15.1 (0.1) | 15.2 (0.1) | 15.4 (0.1) | 16.2 (0.2) | |
| % female | 45.6 | 46.9 | 49.9 | 47.9 | |
PIR=Ratio of family income to poverty
Omnibus significance level for ANOVA (P<0.05)
For generational status, total daily energy intakes and HEI scores are shown in Table 2. Mean energy intake in the full sample was 2197 ± 22 kcal. Non-Hispanic white adolescents had a significantly higher total daily energy intake compared to US-born adolescents with a foreign-born parent, after controlling for PIR and child sex (p = 0.046). On the day of intake, mean HEI score was 45.1 ± 0.4. Non-Hispanic white adolescents had significantly poorer overall diet quality compared to US-born adolescents with a foreign-born parent and Mexican-born adolescents (p < 0.001).
Table 2.
Mean daily energy intake, HEI-2015 score and snack intake by generational status of Mexican American and Non-Hispanic white adolescents in the U.S., estimated from NHANES, 2005–2014. Mean (SE)
| Generational status | |||||
|---|---|---|---|---|---|
| Dietary Intakes | Non-Hispanic White (n=l,856)a | US-born child, US-born parent (n=558) | US-born child, foreign-born parent (n=773) | Mexican-born child (n=449) | Pb |
| Total energy intake (kcal/day) | 2207 (25) | 2184 (60) | 2076 (57) | 2130 (82) | 0.267 |
| HEI-2015 score | 44.5 (0.4) | 45.5 (0.9) | 47.9 (0.7)* | 49.6 (1.3)* | <0.001 |
| Total snack intake (kcal/day) | 603 (21) | 496 (33)* | 480 (31)* | 546 (52) | 0.005 |
| Snack frequency (times/day) | 2.3 (0.05) | 2.2 (0.1) | 2.2 (0.1) | 2.2 (0.1) | 0.689 |
| Snack portion (kcal/snack) | 277 (12) | 226 (11)* | 218 (14)* | 233 (17) | 0.009 |
| Snack intake as a % of total daily energy intake (%) | 26.4 (0.7) | 21.4 (0.9)* | 22.8 (1.2)* | 22.5 (1.4)* | <0.001 |
Reported sample sizes are unweighted.
Omnibus significance level for ANCOVA after adjustment for child sex and PIR.
Signifies a statistically significant difference (P<0.05) from the reference population (Non-Hispanic white).
For generational status, snacking intakes are shown in Table 2. Mean total snack intake in the full sample was 582.7 ± 16.3 kcal/day. Non-Hispanic white adolescents had a significantly higher total snack intake compared to US-born adolescents with a US-born parent (p = 0.01) and US-born adolescents with a foreign-born parent (p = 0.002). In the full sample, snack intake accounted for 25.6 ± 0.6% of total daily energy intake. Non-Hispanic White adolescents had a higher snack intake as a percent of total daily energy intake than all generational status groups. Snacking frequency was 2.3 ± 0.04 times/day in the full sample and did not vary by generational status. Mean snack portion was 269 ± 9 kcal/snack. Non-Hispanic White adolescents consumed a larger snack portion compared to US-born adolescents with a US-born parent (p = 0.005) and US-born adolescents with a foreign-born parent (p = 0.003).
Total daily energy intake and HEI scores stratified by language use at home are shown in Table 3. Energy intake did not differ by language use at home. As assessed by the HEI, NHW adolescents had significantly poorer overall diet quality compared to adolescents who spoke only or mostly Spanish (p < 0.001), Spanish and English (p < 0.001) or mostly English (p = 0.01). Snacking intakes by language use at home are shown in Table 3. Non-Hispanic White adolescents had a greater total snack intake, and snack intake as a percent of total daily energy intake, compared to all language use at home groups, except for equal Spanish and English. Snacking frequency did not vary by language use at home. Non-Hispanic White adolescents consumed a significantly larger snack portion compared to all language use at home groups except for adolescents from homes that speak Spanish and English equally.
Table 3.
Mean daily energy intakes, HEI-2015 scores and snack intakes by language use at home of Mexican American and Non-Hispanic white adolescents in the U.S., estimated from NHANES, 2005–2014. Mean (SE)
| Language use at home | ||||||
|---|---|---|---|---|---|---|
| Dietary Intakes | Non-Hispanic White (n=1,856) | Only English (n=382) | More English than Spanish (n=376) | Equal Spanish and English (n=526) | Only or mostly Spanish (n=490)a | Pb |
| Total energy intake (kcal/day) | 2207 (25) | 2132 (79) | 2087 (57) | 2184 (89) | 2105 (64) | 0.227 |
| HEI score | 44.5 (0.4) | 44.7 (1.0) | 47.2 (1.0)* | 48.6 (0.9)* | 48.9 (0.9)* | <0.001 |
| Total snack intake (kcal/day) | 603 (21) | 499 (33)* | 438 (35)* | 603 (48) | 446 (37)* | <0.001 |
| Snack frequency (times/day) | 2.3 (0.05) | 2.2 (0.1) | 2.1 (0.1) | 2.3 (0.1) | 2.1 (0.1)* | 0.096 |
| Snack portion (kcal/snack) | 277 (12) | 229 (14)* | 198 (15)* | 250 (15) | 218 (17)* | 0.002 |
| Snack intake as a % of total daily energy intake (%) | 26.4 (0.7) | 22.7 (1.1)* | 20.8 (1.3)* | 24.8 (1.2) | 20.1 (1.2)* | <0.001 |
Reported sample sizes are unweighted.
Omnibus significance level for ANCOVA after adjustment for child sex and PIR.
Signifies a statistically significant difference (P<0.05) from the reference population (Non-Hispanic white)
The proportional contribution of What We Eat in America food categories to total snack intake is shown in Figure 1a for generational status and Figure 1b for language use at home. The leading source of snacking energy for each acculturation group was foods in the Snacks and Sweets category (savory snacks, crackers, bars, sweet bakery products, candy, desserts) which contributed between 36.7 and 43.6% of total snack kcal. Beverages (juice, diet and sweetened beverages, coffee and tea) were the second leading source of snacking energy, contributing between 15.5 and 21.9% of total snack kcal. Foods and beverages in the Milk and Dairy and Mixed Dishes food categories contributed between 6.7 and 15% of total snack kcal. Fruits, Vegetables, Grains and Protein Foods were consumed infrequently as snacks in all acculturation categories.
Figure 1a.

Proportional contribution of What We Eat in America food categories to total snack intake by generational status among Mexican American adolescents in the U.S., estimated from NHANES, 2005–2014a
aExcludes depiction of condiments, sugars, water and other categories with <1% contribution to total snack intake
Fig 1b.
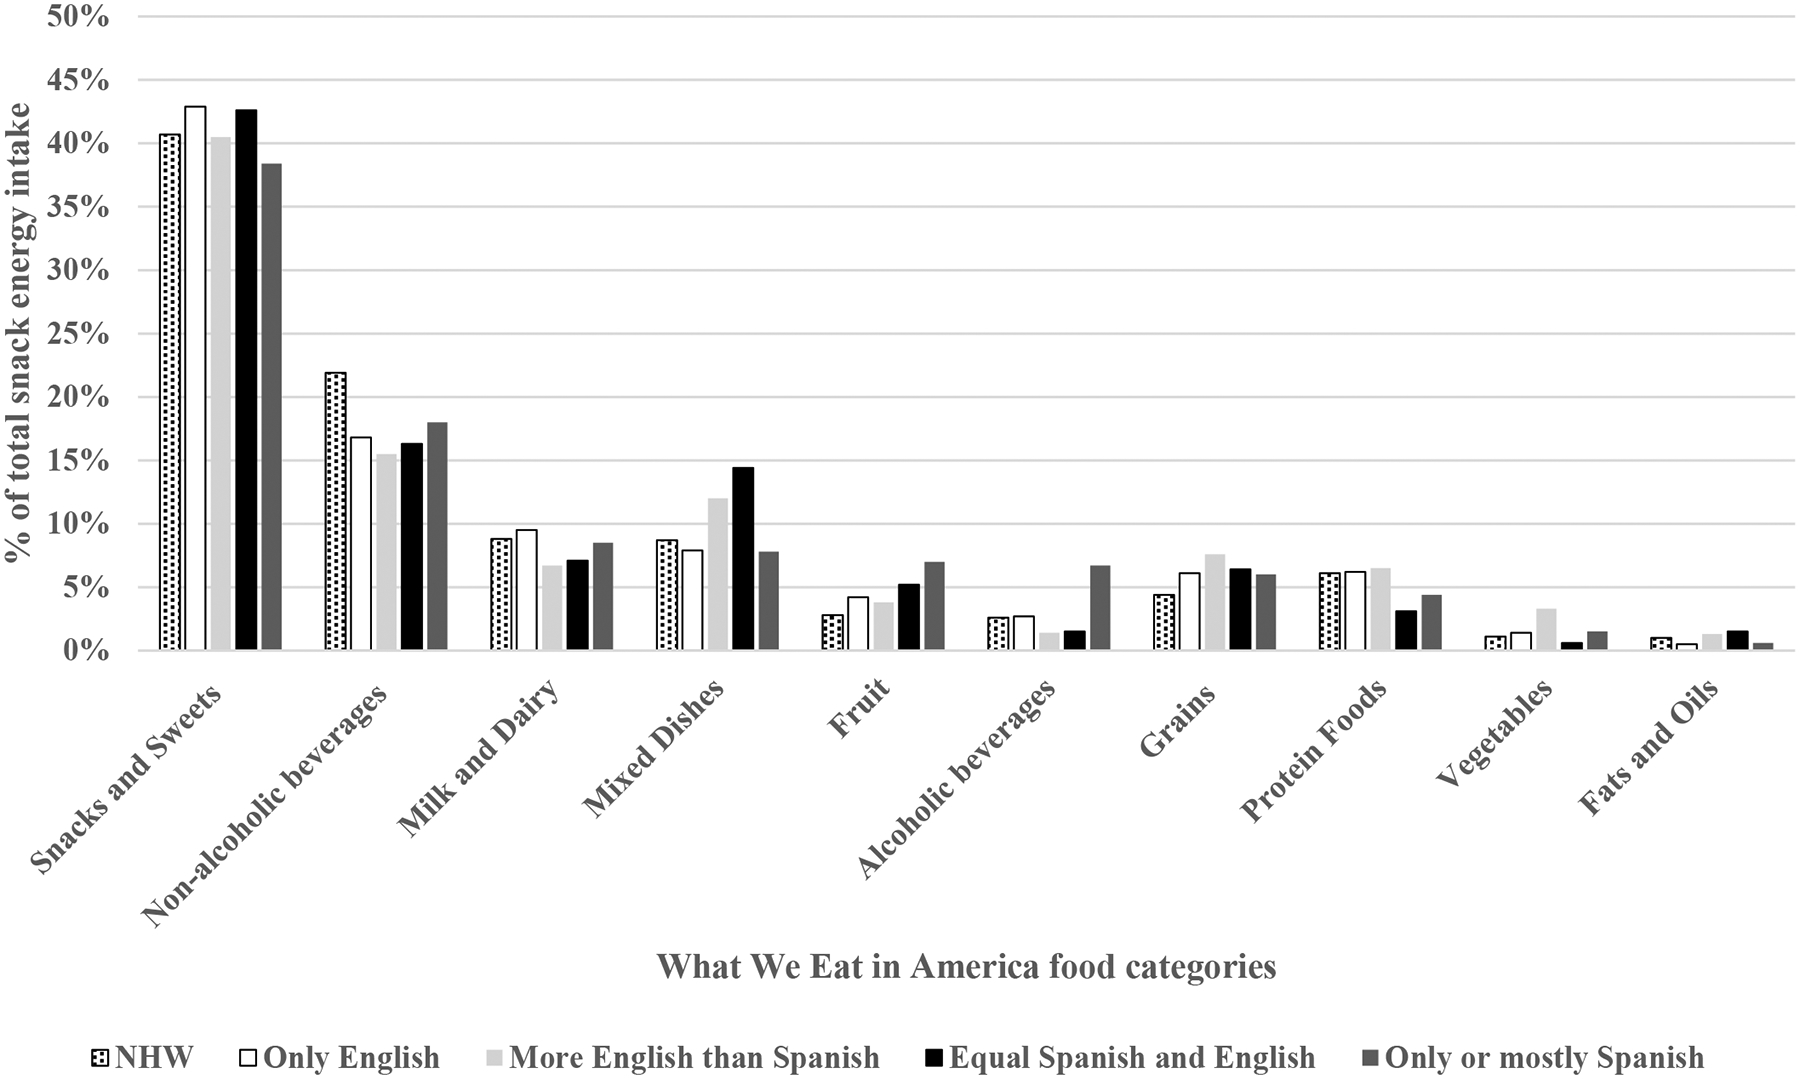
Proportional contribution of What We Eat in America food categories to total snack intake by language use at home among Mexican American adolescents in the U.S., as estimated from NHANES, 2005–2014a
aExcludes depiction of condiments, sugars, water and other categories with <1% contribution to total snack intake
DISCUSSION
This study evaluated the relationship between acculturation status and diet quality as well as dietary intakes during snacking occasions among Mexican American adolescents compared with their NHW counterparts. The current study provides novel data on modest differences in diet quality between NHW and Mexican American adolescents from different acculturation groups using two measures of acculturation and the newest version of the HEI (HEI-2015). The findings related to (1) a non-linear association between acculturation and diet, and (2) variation in the acculturation-diet association by acculturation indicator highlight the complexity of ethnic variation in diet in the context of acculturation.
This study presents a unique approach to assessing ethnic variation in diet by comparing snack intakes among Mexican American adolescents from different acculturation groups and NHWs. In all groups, diet quality was low on the day dietary intake was assessed, and foods and beverages in the Snack and Sweets and Non-alcoholic categories that are commonly consumed as snacks [2, 32] made a substantial contribution to snack intakes. The finding that less acculturated Mexican American adolescents had higher diet quality than NHWs, but more acculturated Mexican Americans did not, generally matches the findings of previous acculturation-diet studies that used alternate measures of diet quality or were conducted in different age groups [10, 16, 20–22, 33, 34], suggesting that the findings are robust. The current study builds on previous work by including NHW adolescents as a reference population. Previous studies that included NHWs as a reference population were conducted among samples with wide age ranges that included young children and adults [22, 34, 35], and were therefore unable to determine the association among adolescents [22, 35]. The current study also builds on previous work by using more recent data from a nationally representative sample and an updated version of the HEI (HEI-2015).
This cross-sectional study provided evidence that snack portions and the contribution of snacks to total daily energy intake are greater among NHW compared to Mexican American adolescents from most acculturation groups, controlled for poverty status and sex. Although absolute differences in snack portions across groups were small, an extra 40 kcal at each snacking occasion across 14 snack occasions per week could potentially drive clinically meaningful differences in energy intake or weight status over an extended period, assuming no corresponding reduction in energy consumed during meals [36, 37]; however the impact of energy intake from snacks would be lower among adolescents with a higher energy requirement. The greater contribution of snacks to total daily energy intake among more acculturated adolescents is concerning because the majority of snack kcal came from the Snacks and Sweets and Beverages categories.
The contribution of snacks to total daily energy intake was substantial, and thus, understanding snack quality and the types of foods and beverages that are consumed as snacks is critical. Snack quality has declined over time among US children and adolescents, including increases in intake of salty snacks, candy and sports drinks, and decreases in milk and fruit intake, during snacking occasions [4]. Yet little is known about the variation in snack composition by acculturation status among Mexican American and NHW adolescents. Descriptively, the two leading sources of snack energy in all groups were snacks and sweets and beverages, which was higher than the contribution of fruits, vegetables or milk and dairy.
Snacking frequency was similar across groups. The only exception was a slightly lower snacking frequency among Spanish speakers compared to NHWs. Snacking behaviors among children and adolescents in Mexico may provide insight into the absence of variation in snacking frequency. In Mexico, adolescents consume snacks more than once per day on average [38]. Further, in both Mexico and the US, the proportion of children who consume a snack is greater than 75% [39]. Therefore, understanding the effects of acculturation on the nutritional status of Mexican American adolescents requires attention to the types of foods and beverages consumed as snacks and the energy consumed at each snacking occasion.
In addition to the differences in snack intakes and diet quality described above, two findings highlight the complexity of the association between acculturation and diet among adolescents. First, the observed variation in snack intakes was not uniform across acculturation indicators. Language use at home identified differences in snack intakes that were not observed when generational status was used as the indicator of acculturation. Total snack intake, snack frequency and snack portion size varied significantly between NHWs and the least acculturated language group (Only or Mostly Spanish), but no significant differences were detected between NHWs and the least acculturated group by generational status (Mexican-born child). In contrast, when generational status was used as the indicator of acculturation, significant differences were detected between NHWs and bi-cultural adolescents (US-born child, Mexican-born parent), but not between NHWs and bi-cultural adolescents by language use at home (Equal English and Spanish). This variation in the association by indicator has also been documented for other dietary outcomes (dairy, meat, fiber) in Latino populations in the United States [16]. This finding has important methodological implications for research on acculturation and dietary assesment because, if the association between acculturation and snack intakes varies depending on the acculturation indicator, acculturation indicators may not be interchangeable.
A second finding that highlights the complexity of the association between acculturation and diet is the observed non-linear association between acculturation and snack intakes. Interestingly, the association was non-linear for some dimensions of snacking, but not for others (e.g., for some dimensions of snacking, the least acculturated adolescents were more similar to NHWs than to other Mexican American adolescents). Differences by indicator may occur if language use at home reflects different underlying cultural or environmental conditions than generational status. Studies that evaluate the mechanism by which acculturation influences diet should carefully consider the choice of acculturation indicator.
Causal pathways between acculturation status and snack intakes or diet quality could vary by acculturation indicator if generational status and language use at home each reflect different dimensions of acculturation [40, 41]. Generational status may reflect family- or household-level acculturation because place of birth for the parent and the adolescent are used to define generational status. Generational status may therefore have a stronger association with snacks purchased by parents or consumed at home in the family context. In contrast, language use may better reflect acculturation at the individual-level because language acquisition requires motivation among adolescents to integrate into society and to adopt the norms of the host culture. Adolescents’ language use at home may therefore have a stronger association with foods and beverages procured by adolescents themselves, such as snacks purchased in school vending machines [42] or at corner stores on the way home from school [43]. Future studies could uncover distinct causal pathways by evaluating mediators of the association between each acculturation indicator and dietary outcomes.
The association between acculturation and diet likely results from changes in culture and environmental conditions that accompany integration into a high-income, industrialized country [44–46]. Culturally, ethnic Mexican identities are tied to the preparation and consumption of ethnic Mexican foods [47]. If integration into American culture among youth is associated with a loss of ethnic identity [48], then traditional Mexican foods high in fiber (e.g., fruit, vegetables) and low in fat (e.g., boiled legumes), may become increasingly less important in the diet. Further, integration into American society involves increasing access to obesogenic food environments [49]. Indeed, acculturation among Mexican Americans is positively associated with purchasing of fast foods, ready-to-eat foods and foods prepared outside the home [50], and some of these foods will likely be adopted as snacks. These food purchasing habits have, in turn, been linked to greater intake of soft drinks and dietary fat among Mexican American children and adolescents [51]. While these modern food conveniences are increasingly available in Mexico due to ongoing economic and nutrition transitions [52, 53], access is greater among urban and higher-income segments of the Mexican population [54]. Qualitative studies could shed light on the factors that contribute to a shift in food purchasing habits with acculturation, such as immigrants’ desire to participate in the dominant American food culture, the relatively low cost and convenience of fast foods, emerging food preferences or neighborhood food availability. Future studies could also evaluate characteristics of the built environment as mediators between acculturation and snack intakes or diet quality. For example, NHANES includes geocoded variables for respondents, such as regionality or urbanicity of residence that could be analyzed in conjunction with the USDA’s Food Access Resource Atlas to link diet and obesity to surrounding food environments.
The current study has several strengths. First, the complex sampling design with sample weights used in NHANES produces nationally representative data that allows for estimates at the population level. Second, the use of two different measures of acculturation (language use and generational status) provided an opportunity to consider whether the findings are robust across measures of acculturation. Third, this study is novel because it evaluates variation in snack intakes by acculturation status and considers possible mechanistic differences among acculturation indicators. Here, we highlighted the diet of Mexican Americans specifically, while other studies compared diet by acculturation status among Hispanic or Latino groups composed of multiple culturally diverse sub-populations [55].
Nevertheless, the current study has several limitations. First, single day, self-report dietary data are prone to measurement error at the individual level due to inaccurate estimation of portion size and poor recall of past intake [56, 57]. However, the USDA 5-step multiple-pass method used in NHANES minimizes misreporting by using probes to help participants to recall past intake and 3-dimensional food models and the USDA Food Model Booklet to support accurate estimation of portion size [58]. Second, participants subjectively defined what constituted a “snack” versus a “meal”. There may be cultural differences in how adolescents define snacks, which could influence variation in estimates of snack intakes across groups. An important methodological consideration in future studies is whether the researcher or study participant is defining what constitutes a snacking occasion. Third, estimates of the association between acculturation and diet may have been altered by confounding factors not included in the statistical models, such as total daily energy intake and age. To account for the wide variation in energy intake across individuals, we included the variable “snack intake as a percent of total daily energy intake” in addition to absolute measures of snack intake. Further, many HEI-2015 components are energy-adjusted (e.g., cup equivalents per 1,000 kcal). For age, it was assumed that differences in mean age of less than one year across acculturation groups would not affect estimates of the association between acculturation and diet; although this assumption merits further study. Fourth, misclassification of family acculturation status could have occurred because NHANES collected these data only from the participating caregiver (i.e., it is possible that some participants had one caregiver born in the US and the other born outside the US), a study design challenge encountered for most large cohorts. Finally, the cross-sectional design of NHANES did not allow for tracking changes in diet with increasing acculturation in the same individual; instead we provide population-level comparisons by acculturation group.
In some respects, acculturation can be detrimental to the nutritional health of adolescents, and so there are a number of clinical implications to the findings reported here Among Mexican Americans, a greater degree of acculturation is associated with higher obesity [19, 59], lower diet quality [34] and, as shown here, a greater contribution of low quality snacks to total daily energy intake. Minimizing the effects of acculturation on adolescent nutritional health should include support for healthier snacking habits. Specifically, increasing the proportional contribution of fruits, vegetables and protein-rich foods to snacking occasions while decreasing the proportional contribution of energy-dense snacks and sweets and beverages may lead to improvements in overall diet quality and reductions in obesity risk [60]. Supporting healthier snacking habits could also include reducing intake frequency of low-quality snacks. Despite the secular increases in snack frequency in the US, intervening on snack frequency alone is unlikely to have a meaningful impact on obesity risk [2]. Given that the observed variation in snack intakes by acculturation status was not uniform across acculturation indicators in this study, interventions to support improved snack intakes at different stages of acculturation should carefully consider how at risk populations are defined and what various acculturation indicators actually represent.
Conclusions
In conclusion, snack portion sizes and the contribution of snacks to total daily energy intake were substantial and were greater among NHW compared to Mexican-American adolescents from most acculturation groups. Future studies could further explore the nutrition-related implications of acculturation, especially anchored within local contexts of the built environment. In studies on dietary acculturation, the selection of acculturation measures is an important methodological concern and may have implications for our understanding of health disparities.
Funding:
The first author received salary support from the National Institutes of Health (NIH T32 DK007658).
Footnotes
Publisher's Disclaimer: This Author Accepted Manuscript is a PDF file of a an unedited peer-reviewed manuscript that has been accepted for publication but has not been copyedited or corrected. The official version of record that is published in the journal is kept up to date and so may therefore differ from this version.
Conflicts of interest: Dr. Bekelman, Dr. Johnson and Dr. Taylor declare that they have no conflict of interest.
Research involving human participants: All procedures performed in studies involving human participants were in accordance with the ethical standards of the institution and/or national research committee (The National Center for Health Statistics’ Research Ethics Review Board, #2018–01) and with the 1964 Helsinki declaration and its later amendments or comparable ethical standards.
Informed consent: Informed consent was obtained from all individual participants included in the study.
REFERENCES
- 1.Ogden CL, Carroll MD, Lawman HG, Fryar CD, et al. Trends in Obesity Prevalence Among Children and Adolescents in the United States, 1988–1994 Through 2013–2014. JAMA, 2016; 315(21):2292–9. [DOI] [PMC free article] [PubMed] [Google Scholar]
- 2.Larson N and Story M. A review of snacking patterns among children and adolescents: what are the implications of snacking for weight status? Child Obes, 2013; 9(2):104–15. [DOI] [PubMed] [Google Scholar]
- 3.Larson NI, Miller JM, Watts AW, Story MT, et al. Adolescent Snacking Behaviors Are Associated with Dietary Intake and Weight Status. J Nutr, 2016; 146(7):1348–55. [DOI] [PMC free article] [PubMed] [Google Scholar]
- 4.Piernas C and Popkin BM. Trends in snacking among U.S. children. Health Aff (Millwood), 2010; 29(3):398–404. [DOI] [PMC free article] [PubMed] [Google Scholar]
- 5.Dunford EK and Popkin BM. 37 year snacking trends for US children 1977–2014. Pediatr Obes, 2018; 13(4):247–255. [DOI] [PMC free article] [PubMed] [Google Scholar]
- 6.Hill SE, Bell C, Bowie JV, Kelley E, et al. Differences in Obesity Among Men of Diverse Racial and Ethnic Background. Am J Mens Health, 2017; 11(4):984–989. [DOI] [PMC free article] [PubMed] [Google Scholar]
- 7.Bhupathiraju SN and Hu FB. Epidemiology of Obesity and Diabetes and Their Cardiovascular Complications. Circ Res, 2016; 118(11):1723–35. [DOI] [PMC free article] [PubMed] [Google Scholar]
- 8.Ogden CL, Flegal KM, Carroll MD, and Johnson CL. Prevalence and trends in overweight among US children and adolescents, 1999–2000. JAMA, 2002; 288(14):1728–32. [DOI] [PubMed] [Google Scholar]
- 9.Bleich SN and Wolfson JA. Trends in SSBs and snack consumption among children by age, body weight, and race/ethnicity. Obesity (Silver Spring), 2015; 23(5):1039–46. [DOI] [PMC free article] [PubMed] [Google Scholar]
- 10.Liu JH, Chu YH, Frongillo EA, and Probst JC. Generation and acculturation status are associated with dietary intake and body weight in Mexican American adolescents. J Nutr, 2012; 142(2):298–305. [DOI] [PubMed] [Google Scholar]
- 11.Gibson M Immigrant Adaptation and Patterns of Acculturation. Human Development, 2001; 44:19–23. [Google Scholar]
- 12.Berry J Contexts of acculturation, in Cambridge handbook of acculturation psychology, D B. Sam JW, Editor. 2006, Cambridge University Press: New York, NY: p. 27–42. [Google Scholar]
- 13.Alidu L and Grunfeld EA. A systematic review of acculturation, obesity and health behaviours among migrants to high-income countries. Psychol Health, 2018; 33(6):724–745. [DOI] [PubMed] [Google Scholar]
- 14.McLeod DL, Buscemi J, and Bohnert AM. Becoming American, becoming obese? A systematic review of acculturation and weight among Latino youth. Obes Rev, 2016; 17(11):1040–1049. [DOI] [PubMed] [Google Scholar]
- 15.Delavari M, Sonderlund AL, Swinburn B, Mellor D, et al. Acculturation and obesity among migrant populations in high income countries–a systematic review. BMC Public Health, 2013; 13:458. [DOI] [PMC free article] [PubMed] [Google Scholar]
- 16.Ayala GX, Baquero B, and Klinger S. A systematic review of the relationship between acculturation and diet among Latinos in the United States: implications for future research. J Am Diet Assoc, 2008; 108(8):1330–44. [DOI] [PMC free article] [PubMed] [Google Scholar]
- 17.Pew Research Center. More Mexicans leaving than coming to the US. [cited 2018 October 1]; Available from: http://www.pewhispanic.org/2015/11/19/more-mexicans-leaving-than-coming-to-the-u-s/
- 18.Albrecht SS and Gordon-Larsen P. Ethnic differences in body mass index trajectories from adolescence to adulthood: a focus on Hispanic and Asian subgroups in the United States. PLoS One, 2013; 8(9):e72983. [DOI] [PMC free article] [PubMed] [Google Scholar]
- 19.Maldonado LE and Albrecht SS. Does the Immigrant Advantage in Overweight/Obesity Persist over Time in Mexican American Youth? NHANES 1988–1994 to 2005–2014. Obesity (Silver Spring), 2018; 26(6):1057–1062. [DOI] [PMC free article] [PubMed] [Google Scholar]
- 20.Yoshida Y, Scribner R, Chen L, Broyles S, et al. Role of Age and Acculturation in Diet Quality Among Mexican Americans - Findings From the National Health and Nutrition Examination Survey, 1999–2012. Prev Chronic Dis, 2017; 14:E59. [DOI] [PMC free article] [PubMed] [Google Scholar]
- 21.Reininger B, Lee M, Jennings R, Evans A, et al. Healthy eating patterns associated with acculturation, sex and BMI among Mexican Americans. Public Health Nutr, 2017; 20(7):1267–1278. [DOI] [PMC free article] [PubMed] [Google Scholar]
- 22.Eldeirawi K, Koenig MD, Persky V, and Chavez N. Nativity and serum concentrations of antioxidants in Mexican American children: a cross-sectional study. Nutrients, 2014; 6(4):1598–607. [DOI] [PMC free article] [PubMed] [Google Scholar]
- 23.Loren DM, Bohnert A, and Santiago CD. Measures of Acculturation and Relations to zBMI among Mexican-Origin Youth. J Racial Ethn Health Disparities, 2019; 6(2):364–370. [DOI] [PubMed] [Google Scholar]
- 24.Centers for Disease Control and Prevention and National Center for Health Statistics (NCHS). National Health and Nutrition Examination Survey Data. 2019.
- 25.Centers for Disease Control and Prevention. National Health and Nutrition Examination Survey, MEC in-person dietary interviewer’s procedure manual. 2009; Available from: https://www.cdc.gov/nchs/data/nhanes/nhanes_09_10/MECInterviewers.pdf.
- 26.Moshfegh AJ, Rhodes DG, Baer DJ, Murayi T, et al. The US Department of Agriculture Automated Multiple-Pass Method reduces bias in the collection of energy intakes. Am J Clin Nutr, 2008; 88(2):324–32. [DOI] [PubMed] [Google Scholar]
- 27.U.S. Department of Agriculture Food and Nutrition Service. USDA Food and Nutrient Database for Dietary Studies. Food Surveys Research Group Home Page. 2018. [cited 2018; Available from: https://www.fns.usda.gov/cacfp/meals-and-snacks.
- 28.Krebs-Smith SM, Pannucci TE, Subar AF, Kirkpatrick SI, et al. Update of the Healthy Eating Index: HEI-2015. J Acad Nutr Diet, 2018; 118(9):1591–1602. [DOI] [PMC free article] [PubMed] [Google Scholar]
- 29.DeSalvo KB, Olson R, and Casavale KO. Dietary Guidelines for Americans. JAMA, 2016; 315(5):457–8. [DOI] [PubMed] [Google Scholar]
- 30.Shriver LH, Marriage BJ, Bloch TD, Spees CK, et al. Contribution of snacks to dietary intakes of young children in the United States. Matern Child Nutr, 2017. [DOI] [PMC free article] [PubMed] [Google Scholar]
- 31.IBM Corp. IBM SPSS Statistics for Windows. Released 2012, IBM Corp: Armonk, NY. [Google Scholar]
- 32.Larson N, Story M, Eisenberg ME, and Neumark-Sztainer D. Secular Trends in Meal and Snack Patterns among Adolescents from 1999 to 2010. J Acad Nutr Diet, 2016; 116(2):240–50 e2. [DOI] [PMC free article] [PubMed] [Google Scholar]
- 33.Montez JK and Eschbach K. Country of birth and language are uniquely associated with intakes of fat, fiber, and fruits and vegetables among Mexican-American women in the United States. J Am Diet Assoc, 2008; 108(3):473–80. [DOI] [PubMed] [Google Scholar]
- 34.Batis C, Hernandez-Barrera L, Barquera S, Rivera JA, et al. Food acculturation drives dietary differences among Mexicans, Mexican Americans, and Non-Hispanic Whites. J Nutr, 2011; 141(10):1898–906. [DOI] [PMC free article] [PubMed] [Google Scholar]
- 35.Frisco ML, Quiros S, and Van Hook J. One Size May Not Fit All: How Obesity Among Mexican-Origin Youth Varies by Generation, Gender, and Age. Demography, 2016; 53(6):2031–2043. [DOI] [PMC free article] [PubMed] [Google Scholar]
- 36.Piernas C and Popkin BM. Increased portion sizes from energy-dense foods affect total energy intake at eating occasions in US children and adolescents: patterns and trends by age group and sociodemographic characteristics, 1977–2006. Am J Clin Nutr, 2011; 94(5):1324–32. [DOI] [PMC free article] [PubMed] [Google Scholar]
- 37.Livingstone MB and Pourshahidi LK. Portion size and obesity. Adv Nutr, 2014; 5(6):829–34. [DOI] [PMC free article] [PubMed] [Google Scholar]
- 38.Duffey KJ, Rivera JA, and Popkin BM. Snacking is prevalent in Mexico. J Nutr, 2014; 144(11):1843–9. [DOI] [PMC free article] [PubMed] [Google Scholar]
- 39.Wang D, van der Horst K, Jacquier EF, Afeiche MC, et al. Snacking Patterns in Children: A Comparison between Australia, China, Mexico, and the US. Nutrients, 2018; 10(2). [DOI] [PMC free article] [PubMed] [Google Scholar]
- 40.Fox M, Thayer Z, and Wadhwa PD. Assessment of acculturation in minority health research. Soc Sci Med, 2017; 176:123–132. [DOI] [PMC free article] [PubMed] [Google Scholar]
- 41.Schwartz SJ, Unger JB, Zamboanga BL, and Szapocznik J. Rethinking the concept of acculturation: implications for theory and research. Am Psychol, 2010; 65(4):237–51. [DOI] [PMC free article] [PubMed] [Google Scholar]
- 42.Centers for Disease Control and Prevention. Competitive foods and beverages available for purchase in secondary schools–selected sites, United States, 2006. MMWR Morb Mortal Wkly Rep, 2008; 57(34):935–8. [PubMed] [Google Scholar]
- 43.Borradaile KE, Sherman S, Vander Veur SS, McCoy T, et al. Snacking in children: the role of urban corner stores. Pediatrics, 2009; 124(5):1293–8. [DOI] [PubMed] [Google Scholar]
- 44.Martin MA, Van Hook JL, and Quiros S. Is socioeconomic incorporation associated with a healthier diet? Dietary patterns among Mexican-origin children in the United States. Soc Sci Med, 2015; 147:20–9. [DOI] [PMC free article] [PubMed] [Google Scholar]
- 45.Himmelgreen DA, Cantor A, Arias S, and Romero Daza N. Using a biocultural approach to examine migration/globalization, diet quality, and energy balance. Physiol Behav, 2014; 134:76–85. [DOI] [PubMed] [Google Scholar]
- 46.Zhang D, van Meijgaard J, Shi L, Cole B, et al. Does neighbourhood composition modify the association between acculturation and unhealthy dietary behaviours? J Epidemiol Community Health, 2015; 69(8):724–31. [DOI] [PMC free article] [PubMed] [Google Scholar]
- 47.Ramirez AS, Golash-Boza T, Unger JB, and Baezconde-Garbanati L. Questioning the Dietary Acculturation Paradox: A Mixed-Methods Study of the Relationship between Food and Ethnic Identity in a Group of Mexican-American Women. J Acad Nutr Diet, 2018; 118(3):431–439. [DOI] [PMC free article] [PubMed] [Google Scholar]
- 48.Berry JW, Phinney JS, Sam DL, and Vedder P. Immigrant Youth: Acculturation, Identity, and Adaptation. Applied Psychology: An International Review, 2006; 55(3):303–332. [Google Scholar]
- 49.Swinburn B, Egger G, and Raza F. Dissecting obesogenic environments: the development and application of a framework for identifying and prioritizing environmental interventions for obesity. Prev Med, 1999; 29(6 Pt 1):563–70. [DOI] [PubMed] [Google Scholar]
- 50.Langellier BA, Brookmeyer R, Wang MC, and Glik D. Language use affects food behaviours and food values among Mexican-origin adults in the USA. Public Health Nutr, 2015; 18(2):264–74. [DOI] [PMC free article] [PubMed] [Google Scholar]
- 51.Ayala GX, Baquero B, Arredondo EM, Campbell N, et al. Association between family variables and Mexican American children’s dietary behaviors. J Nutr Educ Behav, 2007; 39(2):62–9. [DOI] [PubMed] [Google Scholar]
- 52.Corvalan C, Garmendia ML, Jones-Smith J, Lutter CK, et al. Nutrition status of children in Latin America. Obes Rev, 2017; 18 Suppl 2:7–18. [DOI] [PMC free article] [PubMed] [Google Scholar]
- 53.Popkin BM and Reardon T. Obesity and the food system transformation in Latin America. Obes Rev, 2018. [DOI] [PMC free article] [PubMed] [Google Scholar]
- 54.Mendoza A, Perez AE, Aggarwal A, and Drewnowski A. Energy density of foods and diets in Mexico and their monetary cost by socioeconomic strata: analyses of ENSANUT data 2012. J Epidemiol Community Health, 2017; 71(7):713–721. [DOI] [PubMed] [Google Scholar]
- 55.Perez-Escamilla R and Putnik P. The role of acculturation in nutrition, lifestyle, and incidence of type 2 diabetes among Latinos. J Nutr, 2007; 137(4):860–70. [DOI] [PubMed] [Google Scholar]
- 56.Beaton GH, Burema J, and Ritenbaugh C. Errors in the interpretation of dietary assessments. Am J Clin Nutr, 1997; 65(4 Suppl):1100S–1107S. [DOI] [PubMed] [Google Scholar]
- 57.Poslusna K, Ruprich J, de Vries JH, Jakubikova M, et al. Misreporting of energy and micronutrient intake estimated by food records and 24 hour recalls, control and adjustment methods in practice. Br J Nutr, 2009; 101 Suppl 2:S73–85. [DOI] [PubMed] [Google Scholar]
- 58.Ahluwalia N, Dwyer J, Terry A, Moshfegh A, et al. Update on NHANES Dietary Data: Focus on Collection, Release, Analytical Considerations, and Uses to Inform Public Policy. Adv Nutr, 2016; 7(1):121–34. [DOI] [PMC free article] [PubMed] [Google Scholar]
- 59.Popkin BM and Udry JR. Adolescent obesity increases significantly in second and third generation U.S. immigrants: the National Longitudinal Study of Adolescent Health. J Nutr, 1998; 128(4):701–6. [DOI] [PubMed] [Google Scholar]
- 60.Tripicchio GL, Kachurak A, Davey A, Bailey RL, et al. Associations between Snacking and Weight Status among Adolescents 12–19 Years in the United States. Nutrients, 2019; 11(7). [DOI] [PMC free article] [PubMed] [Google Scholar]