

Abstract
A hallmark of metastasis is the adaptation of tumor cells to new environments. Metabolic constraints imposed by the serine and glycine-limited brain environment restrict metastatic tumor growth. How brain metastases overcome these growth-prohibitive conditions is poorly understood. Here, we demonstrate that 3-phosphoglycerate dehydrogenase (PHGDH), which catalyzes the rate-limiting step of glucose-derived serine synthesis, is a major determinant of brain metastasis in multiple human cancer types and preclinical models. Enhanced serine synthesis proved important for nucleotide production and cell proliferation in highly aggressive brain metastatic cells. In vivo, genetic suppression and pharmacological inhibition of PHGDH attenuated brain metastasis, but not extracranial tumor growth, and improved overall survival in mice. These results reveal that extracellular amino acid availability determines serine synthesis pathway dependence, and suggests that PHGDH inhibitors may be useful in the treatment of brain metastasis.
Keywords: Brain Metastasis, Metabolism, 3-Phosphoglycerate Dehydrogenase (PHGDH), Cerebrospinal Fluid (CSF), Amino Acids, Serine, Glycine, Nutrient Availability
Introduction
Metastasis is the end result of an evolutionary process in which tumor cells adapt to different tissue environments (1,2). Despite efforts to identify novel oncogenic mutations that drive distant metastasis, whole-genome sequencing studies have revealed striking similarities in the array of driver gene mutations between primary tumors and paired metastases (3,4). These findings raise the possibility that cancer cell-specific metabolic adaptation, imposed by the selective pressure of the metastatic niche, enable tumor cells to colonize distant organs. Targeting these metabolic vulnerabilities of metastasis may offer effective treatments for cancers that have spread to distant organs such as the brain.
Brain metastasis (BrM) is the most common intracranial malignancy in adults and is often fatal (5–8). Growing evidence indicates that brain metastases possess unique metabolic characteristics compared to metastases at other sites (9–12). Multiple studies have shown that the establishment and growth of brain metastases depend on cooperative cellular interactions between tumor cells and specialized cells within the central nervous system (CNS), including astrocytes, microglia, neurons, and endothelial cells (5,9–11,13–18). Surprisingly, very little is known about how cancer cells adapt metabolically to the microenvironment of the brain, which is nearly devoid of growth factors, metabolic intermediates and proteins (19–21). Both the brain interstitial fluid (ISF) and cerebrospinal fluid (CSF), which buffers and bathes the brain and spinal cord, are severely depleted of amino acids relative to plasma (20,22,23). It is unknown if the amino acid-depleted environment of the ISF or CSF selects for targetable metabolic dependencies in brain metastases.
Amino acids are important for the biosynthesis of proteins, nucleotides, lipids, antioxidants, and tricarboxylic acid (TCA) cycle intermediates, all of which are needed for cell growth. When exogenous amino acids are limiting, cells can synthesize non-essential amino acids (NEAAs) de novo, including serine, glycine and aspartate (24–35). Diversion of glycolytic intermediates into the serine and glycine biosynthesis pathway is commonly observed in melanoma and triple-negative breast cancer (TNBC; ER−/PR−/Her2−) (36,37). This specific metabolic alteration is driven by the increased expression of 3-phosphoglycerate dehydrogenase (PHGDH) through focal genomic amplifications, transcriptional changes, or post-translational regulation (36–39). Attempts to therapeutically target PHGDH with small molecules have largely yielded modest results in vivo (40–43). Therefore, we postulated that the phenotypic penetrance of PHGDH inhibitors may depend on local extracellular serine and glycine concentrations within the tumor microenvironment.
Here we investigate the mechanisms contributing to metastatic cancer cell survival within the brain microenvironment. We demonstrate that limited microenvironmental serine and glycine enforce brain metastasis dependency on de novo serine synthesis. Genetic suppression and pharmacological inhibition of PHGDH suppressed brain metastasis in vivo, but not extracranial tumor growth. These results indicate that the limited nutrient environment of the brain selects for cancer cells with distinct metabolic dependencies, and suggests that improved PHGDH inhibitors could be clinically useful in treating patients with brain metastasis.
Results
PHGDH and Glucose-Derived Serine are Enriched in Aggressive TNBC Brain Metastatic Cells
To gain insight into the molecular events underlying brain metastasis, we analyzed both the proteomes and labeled metabolomes of parental, aggressive, and indolent TNBC brain metastatic (BrM) cells (44–47). To generate BrM clones that differ in their ability to colonize the brain, we performed in vivo selection using the MDA-MB-231 TNBC cell line (Fig. 1A) (5,11,13,14,18). Aggressive TNBC BrM cells generated multifocal lesions in the cerebrum, cerebellum, and brain stem of mice, whereas indolent TNBC BrM cells failed to form detectable brain metastases at ~10 weeks (2.5 months) (Fig. 1B, C; Supplementary Fig. S1A).
Figure 1: Generation and characterization of aggressive and indolent brain metastatic cells.
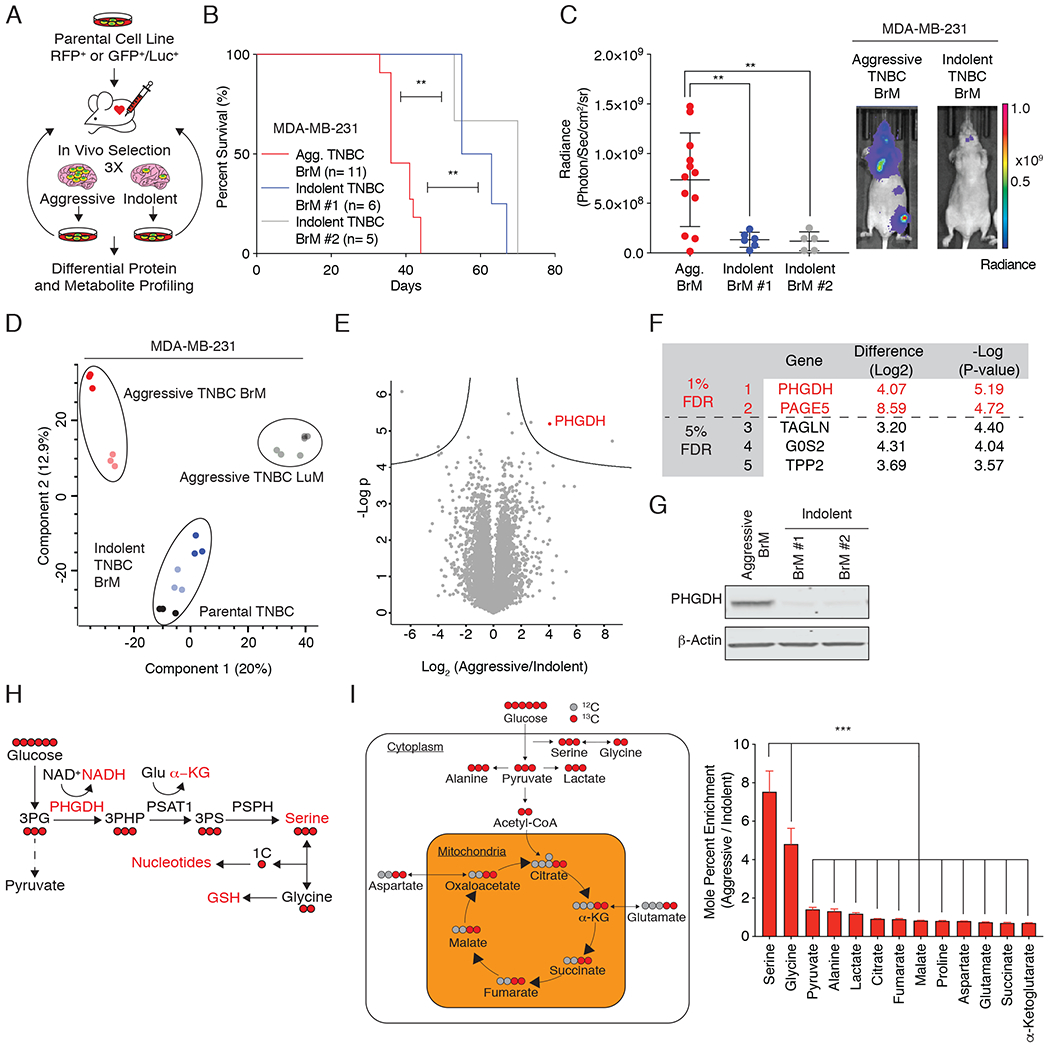
(A) Schematic of the generation and characterization of TNBC BrM cells.
(B) Kaplan-Meier plot showing disease-specific survival of mice injected with aggressive TNBC (black) or indolent (blue and grey) BrM cells. Significance was tested using the log-rank test.
(C) Radiance (photons/second/cm2/sr) as measured by bioluminescence imaging (BLI) of aggressive and indolent TNBC BrM cells four weeks after intracardiac injection.
(D) Principal component analysis (PCA) plot of proteome derived from two aggressive brain metastatic clones (shades of red), two aggressive lung metastatic cells (shades of gray), two indolent brain metastatic cells (shades of blue), and parental MDA-MB-231 TNBC cells (shades of black).
(E) Volcano plot of the P-value vs. the log2 protein abundance differences between aggressive and indolent TNBC BrM cells. Solid lines indicate FDR < 0.01.
(F) List of the five most significant differentially expressed proteins between aggressive and indolent TNBC BrM cells.
(G) Immunoblot of PHGDH expression in aggressive and indolent TNBC BrM cells.
(H) Schematic of the glucose-derived serine biosynthesis pathway. 3PHP (3-phosphohydroxypyruvate); 3PS (3-phospho-serine); 1C (one-carbon unit); GSH (reduced glutathione); PHGDH (phosphoglycerate dehydrogenase); PSAT (phospho-serine aminotransferase); PSPH (phosphoserine phosphatase). Glucose-derived carbon atoms are indicated in red.
(I) Mole percent enrichment of metabolite labeling by U-13C-glucose in aggressive vs. indolent TNBC BrM cells.
For this and all subsequent figures, * indicates statistical significance with p<0.05, ** indicates p<0.005, and *** indicates p<0.0005. Significance is measured with the Mann-Whitney U test unless otherwise indicated.
Comparative proteomic expression profiling of aggressive and indolent TNBC BrM cells that differ in their capacity to colonize the brain using an optimized, high-sensitivity, label-free protein expression profiling workflow quantified ~7,000 proteins per sample with excellent reproducibility (Supplementary Fig. S1B–D) (45–48). Our analysis yielded protein expression profiles of the parental, indolent, and aggressive TNBC BrM cells that segregated independently by principal component analysis, indicating that each population is phenotypically distinct (Fig. 1D). PHGDH, the first enzyme in the glucose-derived serine biosynthesis pathway, was the most significantly upregulated protein in aggressive TNBC BrM cells compared to the indolent TNBC BrM cells (FDR < 0.01; Fig. 1E–G).
PHGDH catalyzes the first and rate-limiting step in the canonical, glucose-derived serine synthesis pathway, and uses NAD+ as a cofactor to oxidize the glycolytic intermediate 3-phosphoglycerate to 3-phosphohydroxypyruvate (3-PHP) (Fig. 1H). Subsequent enzymes in the serine synthesis pathway convert 3-PHP into serine via transamination (phosphoserine aminotransferase 1, PSAT1) and phosphate ester hydrolysis (phosphoserine phosphatase, PSPH). Serine is essential for synthesis of proteins and other biomolecules needed for cell proliferation, including glycine, cysteine, nucleotides, phosphatidylserine, sphingosine, and charged folates required for one-carbon metabolism (49).
To understand the metabolic consequences of increased PHGDH expression in brain metastasis, we cultured aggressive and indolent TNBC BrM cells with uniformly carbon-labeled 13C glucose (U-13C-glucose) and measured the mole percent enrichment of glucose-derived metabolites by gas chromatography-mass spectrometry (GC-MS). Interestingly, glucose-derived serine and glycine exhibited the greatest increase in glucose-derived 13C incorporation in aggressive TNBC BrM cells compared to indolent TNBC BrM cells (Fig. 1I). This observation supports the hypothesis that glucose-derived serine and glycine synthesis is significantly up-regulated in aggressive TNBC BrM cells relative to indolent TNBC BrM cells.
Brain Metastases from Different Tumor Types Upregulate Serine Synthesis
To determine if enhanced serine synthesis is a generalized feature of brain metastasis, we sought to validate our findings in additional models of breast cancer and melanoma brain metastasis. Approximately one-quarter of human breast cancers have amplifications in the human epidermal growth factor receptor 2 (HER2) proto-oncogene, and up to 50% of patients with HER2-positive breast cancer are at risk of developing brain metastasis (50). To test if direct implantation of a HER2-positive breast cancer cell line, BT474, in the brain parenchyma resulted in a functional increase in serine synthesis relative to tumors in the mammary fat pad (MFP) in vivo, we infused tumor-bearing mice with 13C glucose and examined serine labeling in tumor tissue. BT474 brain metastatic tumors exhibited a 2-fold increase in serine labeling from glucose compared to the MFP tumors, consistent with the finding that PHGDH expression was increased in intracranial tumor cells compared to cells implanted into the MFP (Fig. 2A, Supplementary Fig. S2A, B). In addition, isolated patient-derived, estrogen-positive (ER+) circulating tumor cells (CTCs) that exhibited tropism towards the brain (BrM3) had a dramatic increase in PHGDH expression compared to first-generation parental clones (BrX50 Parental) (Supplementary Fig. S2C, D).
Figure 2: Preclinical models recapitulate enrichment of serine synthesis genes observed in human brain metastases.
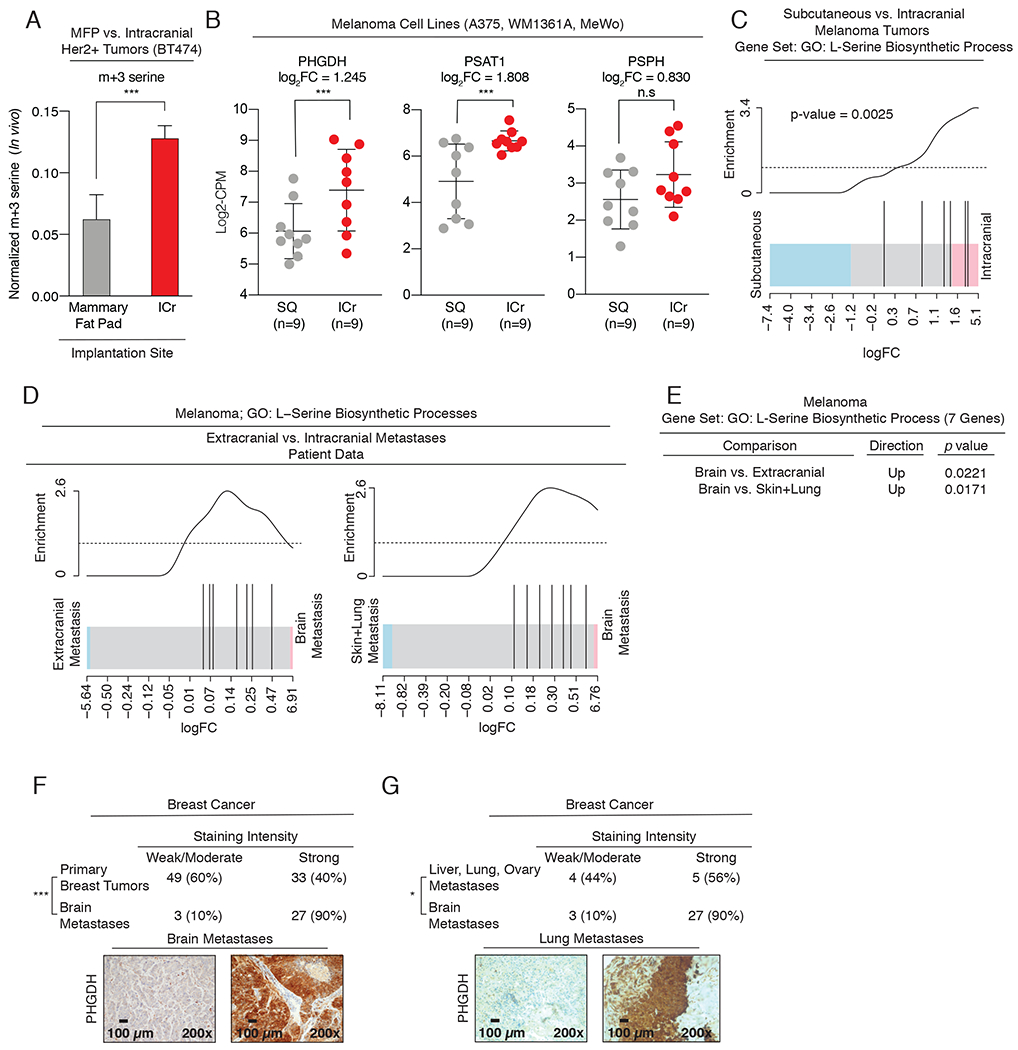
(A) In vivo serine (m+3) labeling from U-13C-glucose in tumors derived from BT474 HER2+ breast cancer cells implanted into the mammary fat pad (MFP) or Intracranially (ICr).
(B) RNAseq expression of serine synthesis pathway genes, PHGDH, PSAT1, and PSPH, in implanted melanoma intracranial (ICr) tumors and subcutaneous (SQ) tumors derived from A375, WM1361A, and MeWo melanoma cell lines.
(C) L-serine biosynthesis gene ontology (GO) analysis of RNAseq data in ICr melanoma brain metastases relative to SQ tumors in mice.
(D) L-serine GO analysis of RNAseq data from melanoma brain metastases and extracranial metastases in patients.
(E) p-values for (D) showing enrichment of L-serine biosynthesis genes in brain metastases relative to extracranial metastases (lung, liver, bone, and intestine).
(F) Immunohistochemical analysis of PHGDH expression in human breast cancer brain metastases and primary breast tumors. Significance was determined using Fisher’s exact test. p-value = 0.0001. Scale bar, 100 μm.
(G) Immunohistochemical analysis of PHGDH expression in human breast cancer brain metastases and extracranial metastases. Significance was determined using Fisher’s exact test. p-value = 0.037 . Scale bar, 100 μm.
Next, we analyzed and compared transcriptomic data collected from three melanoma cell lines (A375, WM1361A, and MeWo) implanted subcutaneously and intracranially. Transcript levels for PHGDH and PSAT1 were increased in intracranial tumors relative to subcutaneous tumors (Fig. 2B). Furthermore, gene ontology (GO) analysis revealed that the serine biosynthesis gene set was significantly enriched in intracranial tumors relative to subcutaneously implanted tumors (Fig. 2C). These experimental results indicate that increased PHGDH expression and serine synthesis are characteristic of breast cancer and melanoma brain metastasis, and suggest that glucose-derived serine synthesis may be a general feature of human brain metastasis.
Human Brain Metastases Display Enhanced Expression of Serine Synthesis Genes
Breast cancer and melanoma are the second- and third- most common causes of brain metastases. To address the clinical relevance of our experimental findings, we analyzed two independent clinical cohorts of brain metastases and TCGA breast cancer RNA expression data. First, GO transcriptomic analysis revealed that the serine biosynthesis gene set is enriched in melanoma brain metastases relative to both extracranial metastases (lung, bone, liver, and intestine) and primary tumors (Fig. 2D, E). Next, immunohistochemical (IHC) staining for PHGDH expression in a cohort of patients with breast cancer brain metastasis showed 90% (27 out of 30) of breast cancer brain metastases had elevated PHGDH expression (Fig. 2F). This was a significantly higher percentage than the ~40% (33 out of 82) of primary breast tumors with high PHGDH expression as reanalyzed from a previously published cohort (36). Notably, PHGDH expression was also significantly higher in breast cancer brain metastases than breast cancer extracranial metastases (lungs, liver, and ovaries) (Fig. 2G). Finally, analysis of Oncomine data indicated that PHGDH expression is 4-fold higher in TNBC tumors (n=46) than other breast cancer subtypes (n=250; from TCGA breast invasive carcinoma), and that PHGDH expression in breast cancer with metastatic events at 3 years (n=140) is 2-fold higher than breast cancer without metastatic events at 3 years (n=48) (Supplementary Fig. S2E, F) (14). These clinical data indicate that PHGDH expression is enriched in breast cancer and melanoma brain metastases relative to primary tumors and extracranial metastases.
The Brain is a Serine- and Glycine-Limited Environment
Cancer cells that colonize the brain encounter an environment deprived of exogenous serine and glycine. With the exception of glutamine, both serine and glycine are among the least abundant amino acids in the brain ISF and the CSF relative to the plasma (Supplementary Fig. S3A) (20,23). In agreement with previous studies, the concentrations of serine and glycine in mouse CSF are ~28uM and ~5uM, respectively, and are about 4- and 50-fold lower than the concentrations of these amino acids in mouse plasma (~100 and ~250 μM, respectively) (Supplementary Fig. S3B) (20,23).
PHGDH is Required for Cell Proliferation in Serine- and Glycine- Limited Environments
To understand the consequences of limited microenvironmental serine and glycine on brain metastasis metabolism and proliferation, we developed cell culture media with serine and glycine concentrations comparable to plasma and CSF (Plasma, CSF, and -Ser/-Gly media) (Supplementary Fig. S3C). We then measured the incorporation of 13C glucose into serine and glycine in aggressive and indolent TNBC BrM cells. PHGDH-expressing aggressive BrM cells derived 5% of their serine from glucose when cultured plasma media. This increased to ~20% and ~25% in CSF and -Ser/-Gly media, respectively. In contrast, indolent BrM cells derived no more than ~15% of their serine from glucose regardless of the extracellular serine and glycine concentrations (Fig. 3A; Supplementary Fig. S3D, E).
Figure 3: Aggressive TNBC brain metastases are serine prototrophs.
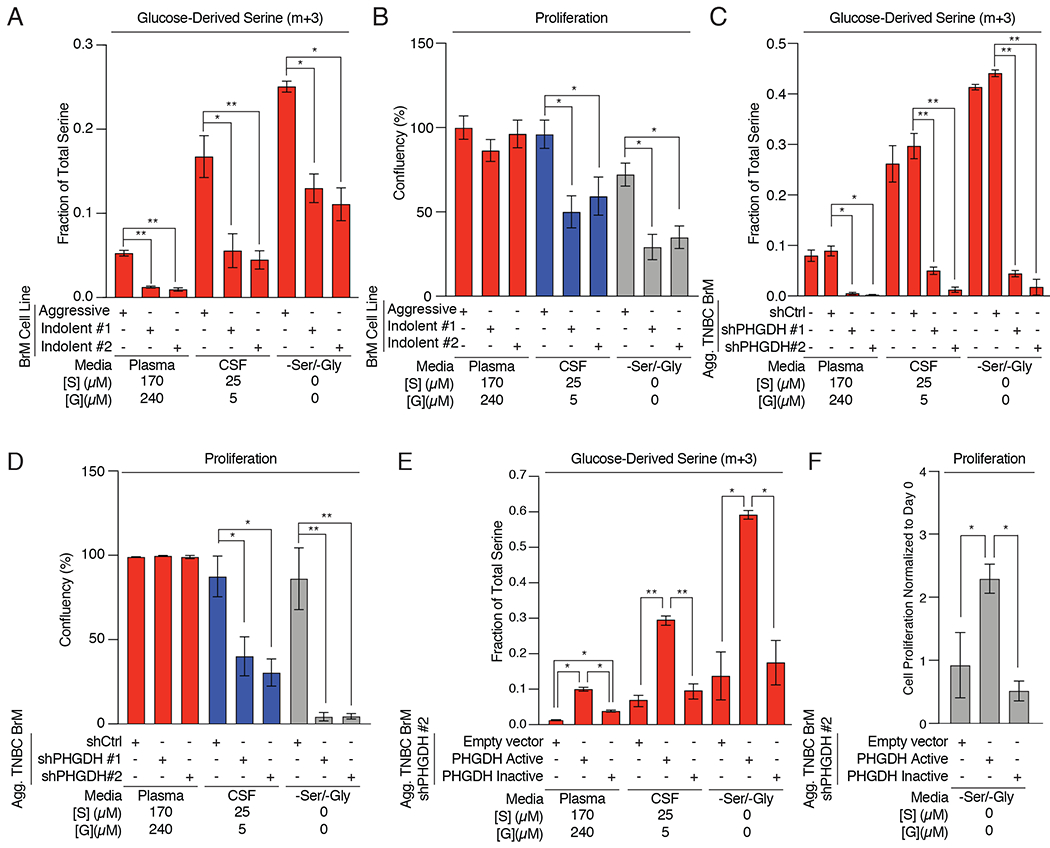
(A) Fractional labeling of intracellular U-13C-glucose-derived m+3 serine from aggressive or indolent brain metastatic cells grown in Plasma, CSF, or -Ser/-Gly media.
(B) Proliferative capacity of aggressive or indolent TNBC BrM cells grown in Plasma, CSF, or -Ser/-Gly media.
(C) Fractional labeling of intracellular U-13C-glucose-derived serine from aggressive brain-trophic cell lines expressing a control shRNA (shCtrl) or PHGDH shRNA (shPHGDH #1 or shPHGDH #2)
(D) Proliferative capacity of aggressive TNBC BrM cells expressing a control shRNA (shCtrl) or PHGDH shRNA (shPHGDH #1 or shPHGDH #2).
(E) Fractional labeling of intracellular U-13C-glucose -derived serine in aggressive TNBC BrM cells with a PHGDH shRNA (shPHGDH #2) expressing either an empty vector (EV) control, catalytically active or catalytically inactive, shRNA-resistant PHGDH.
(F) Proliferative capacity of PHGDH knockdown aggressive TNBC BrM cells with a PHGDH shRNA (shPHGDH #2) expressing either an empty vector (EV) control, catalytically active or catalytically inactive, shRNA-resistant PHGDH.
Cell proliferation data was monitored over 4-6 days using an Incucyte or Multisizer Coulter Counter. Error bars represent standard deviations.
Serine is essential for the production of one-carbon units needed for cell proliferation and can be taken up from the extracellular microenvironment or synthesized from glucose. We reasoned that aggressive and indolent TNBC BrM cells should proliferate at comparable rates in plasma media where extracellular serine and glycine are abundant. In contrast, only PHGDH-expressing, aggressive TNBC BrM cells should proliferate under serine- and glycine-limiting conditions. Measurements of cell proliferation using an automated live cell analysis platform confirmed that aggressive TNBC BrM cells proliferated in CSF and -Ser/-Gly media, whereas indolent TNBC BrM cells proliferated poorly in these conditions (Fig. 3B). These results suggest that cells require high serine synthesis pathway activity to proliferate in serine- and glycine- limiting conditions.
If PHGDH was responsible for the differential proliferation rates of aggressive and indolent BrM cells, suppression of PHGDH should also inhibit aggressive TNBC BrM cell growth in CSF and –Ser/-Gly media. We depleted PHGDH using two independent short hairpin RNAs (shPHGDH #1 and #2; Supplementary Fig. S3F) and determined its on both glucose-derived serine synthesis and cell proliferation. In plasma media, serine labeling fell by ~5–fold in PHGDH-depleted cells, but serine pools remained comparable to control hairpin (shCtrl) cells (Fig. 3C; Supplementary Fig. S3G, H). However, PHGDH suppression decreased serine pools by 30-50% in cells cultured in CSF or -Ser/-Gly media (Supplementary Fig. S3H). These results demonstrate PHGDH is required to maintain serine pathway activity and cell proliferation in serine- and glycine- limiting conditions (Fig. 3D).
To ensure that this phenotype was due to the catalytic activity of PHGDH, we reconstituted PHGDH-depleted cells with catalytically active or inactive, shRNA-resistant PHGDH (Supplementary Fig. S3I). Expression of catalytically active PHGDH restored glucose-derived serine production and cell proliferation in both CSF or -Ser/-Gly media, while expression of a catalytically inactive PHGDH mutant (D175N, R236K, H283A; Supplementary Fig. S3J) failed to restore serine synthesis (Fig. 3E; Supplementary Fig. 3K, L) and cell growth (Fig. 3F) in serine- and glycine- limited conditions. These results confirm that PHGDH activity promotes glucose-derived serine synthesis, and enables cells to proliferation in a serine- and glycine-limited environments, such as the brain.
PHGDH Enables Brain Metastasis
Our in vitro findings demonstrate that serine synthesis is essential for cancer cell growth in microenvironments comparable to the brain interstitium. To determine if PHGDH was necessary for brain metastasis in vivo, we injected aggressive TNBC BrM cells expressing either a non-targeting hairpin (shCtrl) or two independent PHGDH-targeting hairpins (shPHGDH #1 and shPHGDH #2) into the left ventricle of athymic nude mice, and monitored metastatic progression by BLI. PHGDH suppression decreased the burden of brain metastasis and improved the survival of mice bearing brain metastases (Fig. 4A, B). The 12-day improvement in median survival in mice induced by PHGDH depletion is comparable to prior studies using similar models (10,11,14,51). To determine if PHGDH suppression attenuated brain metastasis formation in a different tumor type, we depleted PHGDH a non-small cell lung adenocarcinoma (NSCLC) cell line (H1975, aggressive NSCLC BrM) and induced brain metastases by intracardiac injection. Consisitent with our data in aggressive TNBC BrM cells, PHGDH depletion in aggressive NSCLC BrM cells also suppressed brain metastasis in mice and improved overall survival (Fig. 4C, D; Supplementary Fig. S4A). These data demonstrate that PHGDH suppression attenuates breast and lung cancer brain metastasis in mice.
Figure 4. Genetic manipulation of PHGDH modulates brain metastasis.
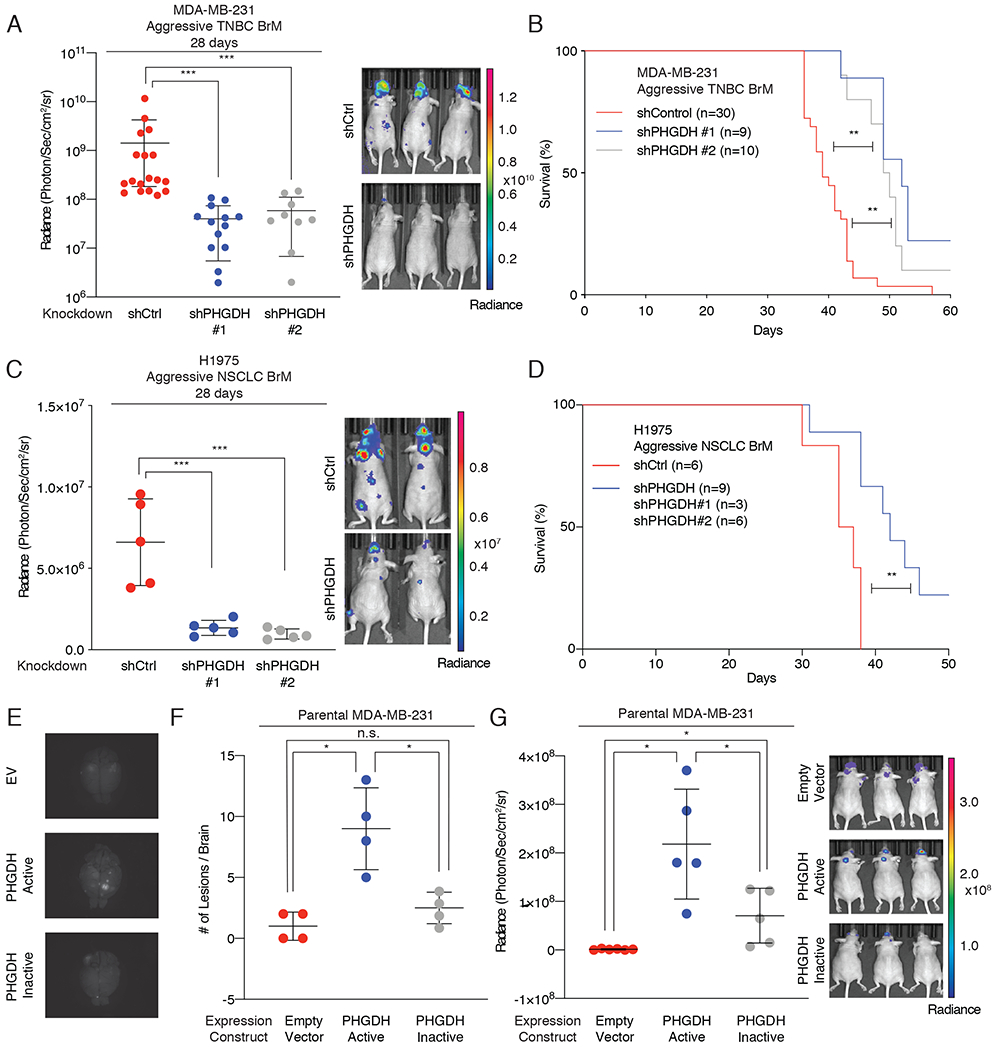
(A) Radiance of brain metastasis-bearing mice measured at 28 days following intracardiac injection of aggressive TNBC BrM cells expressing either a control shRNA hairpin or shRNA hairpin targeting PHGDH.
(B) Kaplan-Meier plot showing disease-specific survival of mice injected with Aggressive TNBC BrM cells expressing either a control shRNA (shCtrl) or PHGDH shRNA (shPHGDH #1 or shPHGDH #2). Significance was tested using the log-rank test.
(C) Radiance of brain metastasis-bearing mice measured at 28 days following intracardiac injection of NSCLC aggressive BrM cells expressing either a control shRNA hairpin or shRNA hairpin suppressing PHGDH.
(D) Kaplan-Meier plot showing disease-specific survival of mice injected with NSCLC aggressive BrM cells expressing either a control shRNA (shCtrl) or PHGDH shRNA (combined shPHGDH #1 and shPHGDH #2). Significance was tested using the log-rank test.
(E) Representative images of GFP-positive brain metastatic lesions derived from tumor bearing mice injected with parental MDA-MB-231 cells expressing either an empty vector (EV) control, catalytically active PHGDH, or catalytically inactive PHGDH.
(F) Quantitation of brain metastases from parental MDA-MB-231 brain metastases by direct GFP visualization of isolated brains.
(G) Radiance of mice measured at 28 days following intracardiac injection with parental MDA-MB-231 cells expressing an empty vector control, catalytically active PHGDH or catalytically inactive PHGDH.
To determine if PHGDH was sufficient to promote brain metastasis, we injected mice with parental MDA-MB-231 TNBC cells that expressed catalytically active PHGDH or catalytically inactive PHGDH (Supplementary Fig. S4B). Parental MDA-MB-231 do not express PHGDH endogenously and do not exhibit brain tropism when inoculated into mice. Surprisingly, the expression of catalytically active PHGDH was sufficient to promote brain metastasis, whereas expression of catalytically inactive PHGDH or an empty vector control failed to increase brain metastasis formation significantly (Fig. 4E–G; Supplementary Fig. S4C). Notably, we did not observe bioluminescence signal in other organs, suggesting that PHGDH activity primarily potentiates brain metastasis. Furthermore, tail vein injection of parental MDA-MB-231 cells expressing catalytically active PHGDH exhibited a non-significant trend towards increased lung metastases (LuM) by BLI, but this was not confirmed by histology (Supplementary Fig. S4D, E). Moreover, suppression of PHGDH in our aggressive TNBC LuM model did not affect lung metastasis burden (Supplementary Fig. S4F). These observations support a model in which enhanced glucose-derived serine pathway activity promotes brain metastasis.
Pharmacological Inhibition of PHGDH Suppresses Cell Growth in Serine- and Glycine- Limited Environments
First-generation PHGDH inhibitors impede the growth of PHGDH-dependent primary tumors, but these tool compounds have moderate potency, with IC50s in the ~10μM range. Second-generation PHGDH inhibitors have higher potency and improved pharmacokinetic and pharmacodynamic properties. Because PHGDH enzymatic activity is sufficient to promote brain metastasis in vivo, we tested second-generation PHGDH inhibitors in our models of brain metastasis.
PH-719 and PH-755 (Raze Therapeutics) are second-generation PHGDH inhibitors with nanomolar potency in vitro (52). Both PH-719 and PH-755 blocked glucose-derived serine synthesis (Fig. 5A, B, Supplementary Fig. S5A, B) regardless of exogenous serine and glycine concentrations. However, both PH-719 and PH-755 inhibited the proliferation of aggressive TNBC BrM cells (Fig. 5C; Supplementary Fig. S5C), brain-trophic melanoma cells (Fig. 5D), patient-derived short-term culture (STC) 12-273 melanoma BrM cells (Fig. 5E), and patient-derived clear cell renal cell carcinoma BrM cells (CCRCC BrM) (Fig. 5F) when cultured in serine- and glycine-limiting conditions. Additionally, treatment of four PHGDH dependent cell lines (HT1080, HCC70, MDA-MB-468, and BT-20), and three melanoma cell lines (12-273, 5B1, and A2058) in dose-response assays with PH-719 or PH-755 demonstrated that PHGDH inhibitors had EC50 values for cell growth inhibition of 0.5-5μM when cultured in CSF or –Ser/-Gly media (Supplementary Fig. S5D, E). In contrast, two PHGDH-independent cell lines (MDA-MB-231 and ZR-75-1) exhibited a 6 to 10-fold higher EC50 for PH-719 (Supplementary Fig. S5D). Moreover, PH-719 blocked invasion of aggressive TNBC BrM cells selectively in –Ser/-Gly media (Supplementary Fig. S5F). These results support the hypothesis that extracellular serine and glycine availability modulates cellular sensitivity to second-generation PHGDH inhibitors.
Figure 5. Pharmacological inhibition of PHGDH decreases serine synthesis and cell proliferation.
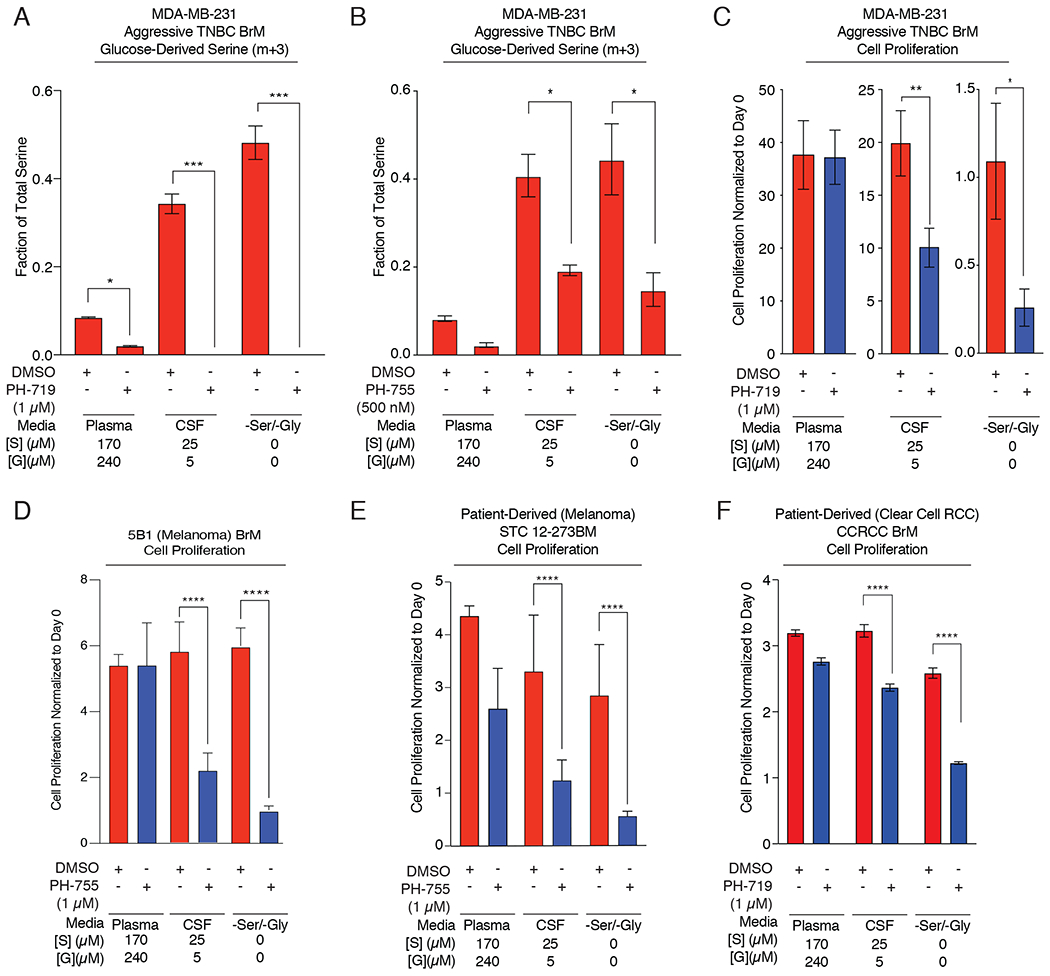
(A) Fractional labeling of intracellular U-13C-glucose-derived m+3 serine from aggressive TNBC BrM cells treated with DMSO or 1 μM of the PHGDH inhibitor PH-719 in Plasma, CSF, or -Ser/-Gly media.
(B) Fractional labeling of intracellular U-13C-glucose-derived m+3 serine from aggressive TNBC BrM cells treated with DMSO or 1 μM of the PHGDH inhibitor PH-755 in Plasma, CSF, or -Ser/-Gly media.
(C) Proliferative capacity of aggressive TNBC BrM cells treated with DMSO or PH719 (1 μM) in Plasma, CSF, or -Ser/Gly media.
(D) Anchorage independent growth of 5B1 brain-trophic melanoma cells grown in plasma, CSF, or -Ser/-Gly media treated with DMSO (control; red bars) or 1 μM PH-755 (blue bars) for 5 days.
(E) Anchorage independent proliferation of patient-derived Short-Term Culture 12-273 Melanoma Brain Metastasis (STC 12-273BM) melanoma cells grown in plasma, CSF, or -Ser/-Gly media treated with DMSO (control; red bars) or 1 μM PH-755 (blue bars) for 5 days.
(F) Proliferation capacity of patient-derived Clear Cell Renal Cell Carcinoma (CCRCC) Brain Metastasis cells grown in plasma, CSF, or -Ser/-Gly media treated with DMSO (control; red bars) or 1 μM PH-719 (blue bars) for 5 days.
Pharmacological Inhibition of PHGDH Attenuates Brain Metastasis
PH-755 is orally bioavailable and has a >24-hour half-life in mice (Supplementary Fig. 6A). To evaluate the effect of PH-755 on established brain metastases in vivo, we seeded the brains of immunodeficient mice with aggressive TNBC BrM cells for 1.5 weeks before treatment with vehicle or PH-755 (300mg/kg twice daily by oral gavage) (Fig. 6A, B; Supplementary Fig. S6B). PH-755 treatment reduced brain metastatic burden and extended the survival of mice (Fig. 6A, B; Supplementary Fig. S6C, D). Interestingly, while PH-755 attenuated breast cancer brain metastasis, it failed to restrict tumor growth of aggressive TNBC BrM cells implanted into the mammary fat pad (Supplementary Fig. S6E). Moreover, PH-755 treatment impeded the progression of intracranially implanted patient-derived clear cell renal cell carcinoma brain metastatic tumors (Fig. 6C). These data provide proof of concept that small molecule PHGDH inhibition reduces the growth of established brain metastasis.
Figure 6. Pharmacological inhibition of PHGDH attenuates brain metastasis.
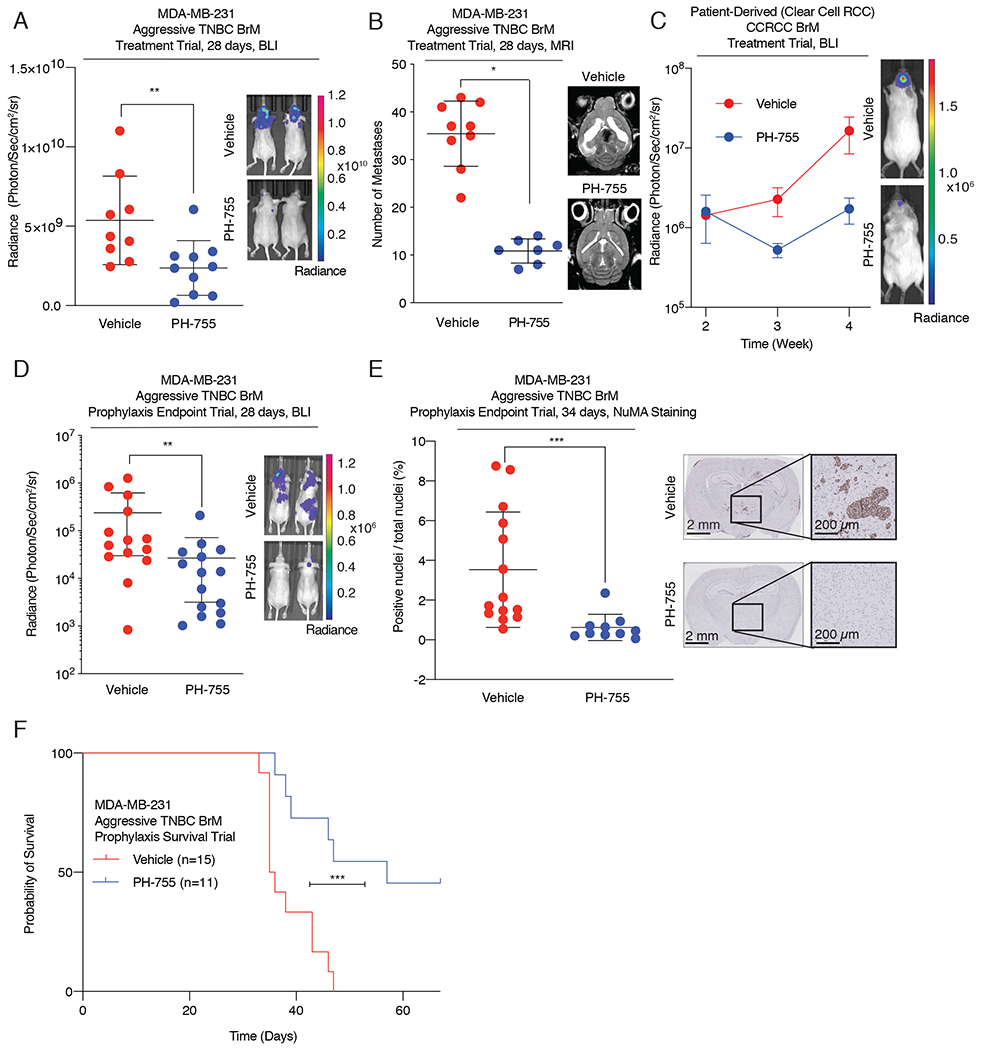
(A) Radiance, measured at 28 days post intracardiac injection, of aggressive TNBC BrM-bearing mice treated with vehicle or 300 mg/kg of PH-755 twice daily. Treatment began 1.5 weeks after the initial introduction of cancer cells into mice.
(B) Quantification of brain metastatic lesions by magnetic resonance imaging (MRI) from mice treated with vehicle control or 300mg/kg of PH-755 twice daily.
(C) Radiance of RCC BrM PDX brain metastasis-bearing mice treated with vehicle or 300 mg/kg of PH-755 twice daily. Treatment began 2 weeks after the initial introduction of cancer cells into mice. Error bars indicate standard error of the mean (SEM).
(D) Radiance, measured at 28 days post intracardiac injection, of aggressive TNBC BrM-bearing mice treated prophylactically with vehicle or 300 mg/kg PH-755 twice daily.
(E) Quantitation by IHC of human Nuclear Mitotic Apparatus (NuMA)-positive nuclei relative to total nuclei count, indicating the burden of brain metastases, from mice treated prophylactically with vehicle or PH-755. Tissue was harvested 34 days post injection
(F) Kaplan-Meier plot showing overall survival of mice treated prophylactically with vehicle or 300 mg/kg PH-755 twice daily.
Prevention of brain metastasis would also benefit patients with cancers that have a high propensity to spread to the brain (53). To test whether prophylactic treatment with PHGDH inhibitors would attenuate brain metastasis formation, we administered PH-755 for 24 hours prior to left ventricular inoculation of aggressive TNBC brain metastatic cells into athymic nude mice. Prophylactic PH-755 treatment substantially increased metastasis-free survival and reduced brain metastasis burden compared to vehicle treatment (Fig. 6D, E; Supplementary Fig. S6F–H). Notably, the frequency and size of brain metastatic lesions were ~20 times greater in mice treated with vehicle than in mice treated with PH-755, and no metastases were identified in ~50% of the PH-755 treatment group (Fig. 6E, Supplementary Fig. S6I). Most impressively, prophylactic PH-755 treatment increased the overall survival of brain metastasis-bearing mice by a median of 21.5 days, with minimal lung and liver metastatic burden (Fig. 6F; Supplementary Fig. S7A). Notably, this survival benefit is greater than most other monotherapies tested in similar murine models of brain metastasis (10,11).
To determine the pharmacodynamic consequences of serine synthesis inhibition, we quantified amino acid concentrations in the plasma and CSF of tumor-bearing mice treated with vehicle or PH-755. PH-755 lowered plasma and CSF serine concentrations, but did not affect the concentrations of most other amino acids or metabolites (Supplementary Fig. S7B–E). U-13C-glucose labeling of mice fasted for 6 hours revealed that PH-755 decreased glucose incorporation into serine in both the plasma and dissected brain metastases (Supplementary Fig. S7F–H). In addition, we used real-time metabolic imaging with hyperpolarized (HP) [1-13C] pyruvate to determine if PH-755 treatment affected the dynamic rate of conversion of pyruvate to lactate in intracranially implanted aggressive TNBC BrM cells. The rate of conversion of pyruvate to lactate (kPL) measured 3 hours after PH-755 treatment was significantly decreased in TNBC BrM brain metastases in PH-755-treated mice compared to vehicle-treated mice (70%, p<0.05) (Supplementary Fig. S7I). Mice treated with PH-755 did not lose weight during the 8-week treatment in spite of the potential systemic toxicities of inhibiting serine biosynthesis (Supplementary Fig. S7J). These data serve as proof of concept that PHGDH inhibitors might be useful in the treatment and prevention of brain metastases.
PHGDH Inhibition in Serine and Glycine-Limited Media Generates DNA Damage and Impedes Cell Cycle Progression Through Selective Nucleotide Depletion
To investigate the potential mechanisms responsible for reduced cell growth in limited-serine microenvironments following PHGDH inhibition, we performed comparative phospho-proteomics on PHGDH depleted aggressive TNBC BrM cells cultured in plasma or –Ser/-Gly media. Unexpectedly, we found that PHGDH suppression selectively induced a substantial increase in phosphorylation of proteins involved in the DNA damage response. These proteins included, among others, 53BP1, RAD50, and γ-H2A.X (Fig. 7A, Supplementary Fig. S8A). To confirm these findings pharmacologically, treatment of aggressive TNBC BrM cells with PH-719 induced 53BP1 and γ-H2A.X foci formation selectively in cells cultured in –Ser/-Gly media, indicative of a DNA damage response (Fig. 7B, C; Supplementary Fig. S8B, C).
Figure 7. PHGDH inhibition promotes the DNA damage response in a low-serine environment.
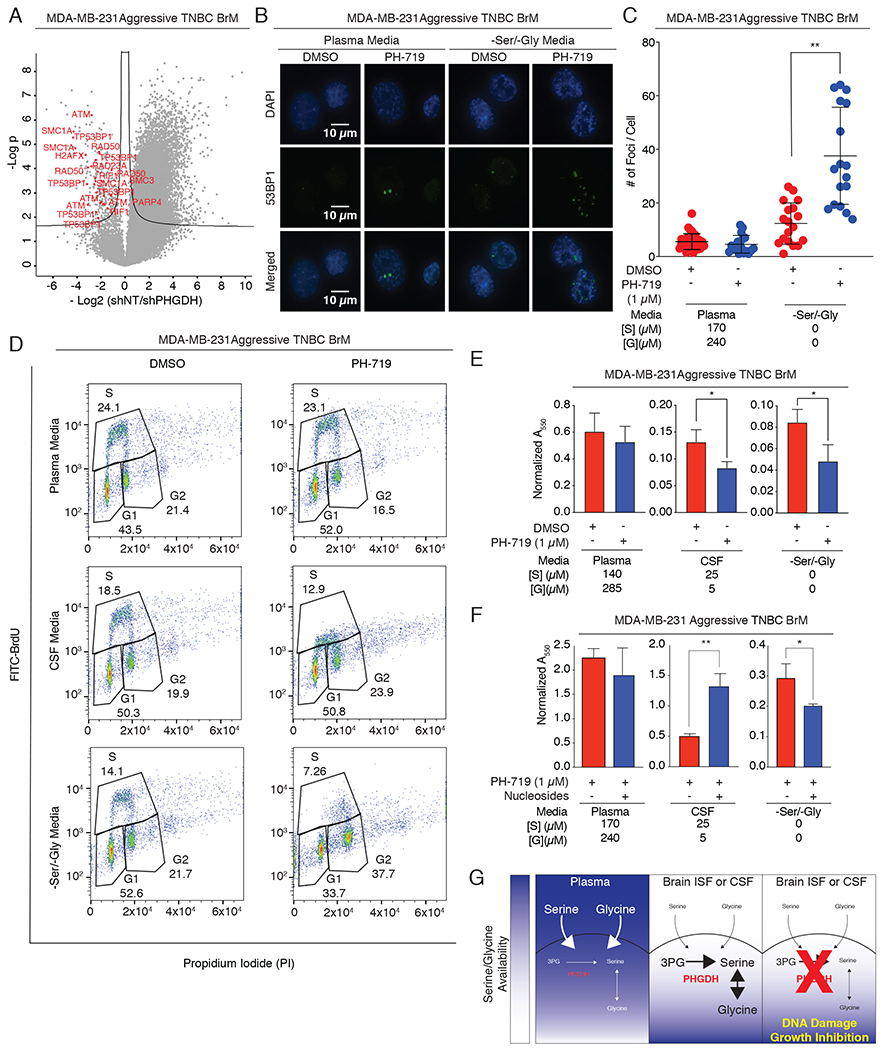
(A) Volcano plot of the p value vs. the log2 phospho-protein abundance differences between aggressive BrM cells expressing a control shRNA or PHGDH shRNA cultured in –Ser/-Gly media (line: FDR < 0.05). Each dot represents a phosphorylation site.
(B) Immunofluorescence staining for 53BP1 foci in aggressive TNBC BrM cells treated with DMSO or the PHGDH inhibitor PH-719 in plasma or -Ser/-Gly media.
(C) Quantitation of 53BP1 foci per cell in (B).
(D) Cell cycle distribution of aggressive TNBC BrM cells cultured in plasma, CSF, or -Ser/-Gly media, and treated with DMSO or PH-719 for 12-16hrs. Cells were labeled with FITC-BrdU for 1 hr and stained with Propidium Iodide (PI).
(E) Quantitation of colony formation assay of aggressive TNBC BrM cells in the absence or presence of PH-719 cultured in plasma, CSF, or –Ser/-Gly media.
(F) Quantitation of nucleoside rescue of in the presence of absence of PH-719.
(G) Working model of brain metastasis sensitization to PHGDH inhibition. In the extracranial microenvironment, abundant exogenous serine and glycine compensate for inhibition of endogenous glucose-derived serine synthesis. The serine- and glycine-limited microenvironment of the brain imposes a metabolic dependency on serine and glycine synthesis, resulting in DNA damage and attenuation of brain metastasis progression when PHGDH is inhibited in brain metastases.
Because serine is the precursor of nucleotides that are needed for DNA synthesis, replication and repair, we hypothesized that the selective induction of DNA damage may be a result of nucleotide depletion. To determine if the selective induction of DNA damage by PHGDH inhibition resulted in reduced DNA synthesis and cell cycle arrest, we treated aggressive TNBC BrM cells with PH-719, and determined cell cycle profiles by FITC-BrdU incorporation, followed by flow cytometry. PHGDH inhibition in plasma media had little effect on cell cycle distributions, but PHGDH inhibition in CSF and –Ser/-Gly media reduced overall labeling with BrdU, suggesting decreased nucleotide incorporation and potentially impaired replication fork elongation throughout the early, mid, and late S-phase cell cycle (Fig. 7D; Supplementary Fig. S8D). Intriguingly, while PHGDH inhibition under -Ser/-Gly conditions resulted in little or no BrdU incorporation in early S-phase, there appeared to be some evidence of replication during late S-phase, perhaps due to DNA repair. These results suggest that serine synthesis inhibition in conditions with low microenvironmental serine induces DNA damage and impedes cell cycle progression.
To demonstrate that increased PHGDH expression in serine limiting conditions promoted clonogenic survival, we overexpressed catalytically active or catalytically inactive PHGDH in parental MDA-MB-231 cells and carried out colony formation assays. Expression of catalytically active, but not catalytically inactive PHGDH promoted colony formation in CSF and –Ser/-Gly media (Supplementary Fig. S8E). To determine if PHGDH inhibition decreased clonogenic survival when exogenous serine and glycine were limiting, we carried out colony formation assays of aggressive TNBC BrM cells treated with PH-719. PHGDH inhibition significantly reduced aggressive TNBC BrM colony formation selectively in CSF and –Ser/-Gly media, but not in plasma media (Fig. 7E, Supplementary Fig. S8F). These data demonstrate that PHGDH activity is important for clonogenic cell survival when exogenous serine and glycine are limiting.
To delineate whether the selective DNA damage response due to PHGDH inhibition was caused by a reduction in serine and glycine incorporation into nucleotides, we performed metabolomics on U-13C-glucose labeled cells where PHGDH activity was perturbed. Genetic depletion and pharmacological inhibition of PHGDH depleted AMP and GMP pools in aggressive TNBC BrM cells when extracellular serine and glycine were limiting (Supplementary Fig. S9A–D). Interestingly, PHGDH inhibition or suppression did not perturb NAD:NADH ratios, but did reduce NADPH:NADP ratios in CSF or –Ser/-Gly media, suggesting a potential redox defect (Supplementary Fig. S9E–H). Ribose-5-phosphate pools slightly increased selectively following PHGDH inhibition, consistent with decreased incorporation into nucleotide synthesis (Supplementary Fig. S9I, J). Finally, nucleoside supplementation increased colony formation of aggressive TNBC BrM cells treated with PHGDH inhibitor in CSF media (Fig. 7F, Supplementary Fig. S9K), suggesting that nucleotide synthesis limited tumor cell growth when exogenous serine and glycine concentrations are low.
PHGDH activity is important for mitochondrial redox homeostasis in hypoxia (54). To determine if hypoxia limited cancer cell proliferation in limiting serine and glycine conditions, we grew aggressive TNBC BrM cells in normoxia (21% oxygen) and hypoxia (1% oxygen) in plasma, CSF, and -Ser/-Gly media. Hypoxia proportionally reduces aggressive brain metastatic cell proliferation in plasma and CSF media, suggesting that limiting exogenous serine and glycine do not synergize with hypoxia to reduce aggressive TNBC BrM cell proliferation (Supplementary Fig. S9L). These data demonstrate that PHGDH inhibition, in CSF-like conditions, selectively depletes nucleotide pools and triggers a DNA damage response that results in delayed cell cycle progression (Fig. 7G).
Discussion
Brain metastases arise from diverse primary tumors and are a major contributor to cancer mortality. We postulate that nutrient limitation in the brain microenvironment exerts a profound selection for cancer cells that efficiently synthesize serine. Using preclinical models of brain metastasis, we demonstrate that de novo glucose-derived serine synthesis enables brain metastasis formation, and that small molecule inhibitors of PHGDH reduce brain metastasis burden and improve overall survival in mice (Fig. 7G). Conceptually, these findings advance the notion that cancer cells from disparate origins may converge to adopt similar metabolic phenotypes in a given metastatic target tissue (10,55–57). Whether other organ sites in addition to the brain, such as the lung, liver or bone impose unique metabolic dependencies will be worth exploring in future studies.
Our data demonstrate that interstitial, rather than bulk tissue, serine and glycine concentrations dictate brain metastasis dependence on serine synthesis and sensitivity to PHGDH inhibition. Microdialysis measurements of circulating serine and glycine levels in the adipose interstitium are 2 and 3 times higher than in the plasma, respectively, suggesting that these amino acids are not always limiting for primary breast tumors (23). This is consistent with the possibility that PHGDH is dispensable for primary tumor growth. Indeed, PHGDH is expressed in ~40% of primary human breast cancers (33,36,37). However, this subset of breast cancers with high PHGDH expression is associated with poorer survival and may have a higher propensity to metastasize to the brain, This also agrees with our hypothesis that PHGDH enables cancer cells to overcome the selection pressure imposed by the nutrient-limited environment of the brain, where serine concentrations are below the reported Km values for the primary serine transporters ASCT1 and ASCT2 (Serine Km ≈ 56μM) (58).
Recent sequencing studies have found that primary tumors and brain metastases evolve independently and represent genetically distinct and divergent populations. These studies have led to the identification of several clinically relevant and actionable mutations in EGFR, ERBB2, CDK4/6, and the PI3K/Akt/mTOR pathway in brain metastases (16,59,60). In the recent HER2CLIMB trial, tucatinib, a small molecule HER2 inhibitor, improved progression-free survival by 2.2 months in patients with brain metastases (61–63). In addition, combined immune checkpoint blockade with ipilimumab and nivolumab induced intracranial responses in up to 30%, respectively, in patients with melanoma brain metastases (62). Although these promising data demonstrate intracranial efficacy of targeted therapies and immunotherapies, a substantial fraction of patients do not respond to these agents, making novel treatments for brain metastases an ongoing and significant unmet clinical need.
Copy number alterations in MYC, YAP1, and MMP13 have also been identified in patients with lung cancer brain metastases (60). Intriguingly, oncogenic mutations in MYC induce serine, glycine and nucleotide biosynthesis by regulating the expression of SHMT2, which converts serine to glycine for folate and nucleotide synthesis (64–67). These findings suggest that MYC may drive metabolic adaption to the brain microenvironment, and that SHMT1/2 inhibitors may be also be useful for treating brain metastases (68–71).
PHGDH inhibitors may help treat brain metastases, but will also inhibit de novo serine synthesis in non-malignant proliferative and non-proliferative cells. Previous studies have shown that PHGDH is highly expressed in radial glial cells, antitumor CD8+ T-cells, Tregs, astrocytes, macrophages, and endothelial cells, all of which are dependent on functional glucose-derived serine synthesis for their respective functions (52,72–75). Interestingly, inhibition of serine synthesis in Tregs appear to inhibit Treg attenuation of immune responses and promote anti-tumor immunity (73). This suggests that inhibition of serine synthesis may not be exclusively immunosuppressive. Additionally, humans with hypomorphic mutations in PHGDH exhibit developmental delay that can be ameliorated by serine supplementation, suggesting that transitory PHGDH inhibition following completion of neuronal development may be tolerable. Moreover, a recent study found that systemic depletion of PHGDH was well tolerated in multiple highly proliferative tissues in adult mice (76). These results suggest that PHGDH inhibitors may be well tolerated, provided that adequate serine and glycine are available in the diet. While our study found no evidence of neurotoxicity or weight loss due to PHGDH inhibition, future studies will be needed to determine the side effects of PHGDH inhibition and its interactions with other cancer therapies – particularly radiation therapy, the primary treatment modality for brain metastases.
Ultimately, the development of novel therapies that target the metabolic vulnerabilities in cancer will require a deep understanding of the interplay between intermediary metabolism and the cellular microenvironment. While our current study does not examine the exchange of nutrients among tumor cells, astrocytes and neurons, we recognize that this is a promising and exciting area of brain metastasis research. Here, we demonstrate that metabolic constraints imposed by the nutrient-limited brain microenvironment confer brain metastasis dependency on serine synthesis. The tolerability and selective efficacy of second-generation PHGDH inhibitors provide proof-of-concept evidence that tailored antimetabolite therapy may complement existing treatment modalities and could improve the management of brain metastasis.
Methods
Cell Culture and Media
Cells were grown in Dulbecco’s MEM (DMEM) without glucose, glutamine, serine, glycine, and sodium pyruvate (US Biological D9802-01) or DMEM media with L-Glutamine and Sodium Bicarbonate, without glucose, serine, and glycine with 100 iu / mL penicillin and 100 μg/mL streptomycin. Serine and glycine were prepared as 100x DMEM stocks in water and sterile filtered. Glucose, glutamine, serine, and glycine were added to the media as needed. Melanoma short term culture 12-273 brain metastasis (STC 12-273BM) were grown in DMEM media as described above with an additional 1 % (v/v) of MEM nonessential amino acids (Thermo Fisher #11140076). A 100x amino acid stock and a non-essential amino acid mix lacking serine and glycine was prepared as a 50x stock and added to the media, along with serine and glycine as needed. Dialyzed inactivated fetal bovine serum (dIFS) was added to all media to 10% (v/v) and the complete media was filtered through a 0.2 μm filter prior to use. Cells were grown in 10 cm dishes in a 5% CO2, ambient oxygen incubator and trypsinzed when confluent (roughly every three days). Cell lines were authenticated by STR profiling (Duke DNA Analysis Facility, Durham, NC) and tested negative monthly for mycoplasma by PCR.
Knockdown and overexpression constructs
Luciferase expression was achieved using pLVX plasmid (expressing eGFP and luciferase; gift of E. Hernando) and cells stably expressing luciferase were sorted for eGFP expression. PHGDH expression was achieved using the pMXS retroviral expression system and pCW57.1 lentiviral expression system. Cells were selected using G418 (0.5mg/ml) or puromycin (2μg/ml), respectively. Stable knockdown of human PHGDH was achieved using shRNAs in pLKO as previously described (41). 2-4 distinct shRNA hairpins were screened per target. shRNA sequences and TRC accession numbers are listed in Supplementary Table S1. shNT was obtained from Sigma-Aldrich (Mission SHC202). Catalytically inactive PHGDH constructs are available from Addgene as follows: pCW-codon optimized catalytically inactive PHGDH (154903) and pMXS-catalytically inactive PHGDH (154906).
Growth Curves
For growth curves, cells were grown for 4-6 days and counted using an Incucyte (Essen Biosciences) or a Z2 Coulter Counter (Beckman Coulter). For low attachment growth assays, cells were seeded in 24-well plates (Corning CLS3473) in the appropriate media and counted using a Z2 Coulter Counter after 1 and 5 days. Small molecule dose-response curves were printed using an D300e Digital Dispenser (HP Specialty Printing Systems) with [DMSO] <0.5% of the culture volume and cell growth was measured by Cell Titer Glo (Promega) after 4 days. All plots, curve fitting, and statistical analysis were carried out with GraphPad Prism.
Proteomic and Phospho-proteomic Profiling
2x10⁶ cells were collected and washed three times with cold PBS before flash-freezing the samples in liquid nitrogen and shipping on dry ice. Control and brain metastases samples were thawed on ice and prepared following the in-stage tip sample preparation method with minor modifications.(77) Briefly, 100μL of the reducing alkylating sodium deoxycholate buffer (PreOmics, Martinsried, Germany) was added to the samples before protein denaturation at 100°C for 20 min. Samples were further homogenized by 15-min sonication in a Biorupter (30s on/off cycles, high settings). Proteins were then digested by Lys-C and trypsin overnight at 37°C on a shaker set at 1,200RPM. Peptides were acidified to a final concentration of 0.1% trifluoroacetic acid (TFA) for SDB–RPS binding and desalted before LC-MS/MS analysis. Samples were measured on a quadrupole Orbitrap mass spectrometer (Q Exactive HF, Thermo Fisher Scientific, Rockford, IL, USA) coupled to an EASYnLC 1200 ultra-high-pressure system (Thermo Fisher Scientific) via a nanoelectrospray ion source.(78,79) About 1μg of peptides was loaded on a 40-cm HPLC-column (75μm inner diameter; in-house packed using ReproSil-Pur C18-AQ 1.9-μm silica beads; Dr Maisch GmbH, Germany). Peptides were separated using a linear gradient from 3% to 23% B in 82 min and stepped up to 40% in 8 min at 350nL per min where solvent A was 0.1% formic acid in water and solvent B was 80% acetonitrile and 0.1% formic acid in water. The total duration of the gradient was 100 min. Column temperature was kept at 60°C by a Peltier element-containing, in-house developed oven. The mass spectrometer was operated in ‘top-15’ data-dependent mode, collecting MS spectra in the Orbitrap mass analyzer (60 000 resolution, 300-1650 m/z range) with an automatic gain control (AGC) target of 3E6 and a maximum ion injection time of 25 ms. The most intense ions from the full scan were isolated with a width of 1.4 m/z. Following higher-energy collisional dissociation (HCD) with a normalized collision energy (NCE) of 27%, MS/MS spectra were collected in the Orbitrap (15 000 resolution) with an AGC target of 1E5 and a maximum ion injection time of 25 ms. Precursor dynamic exclusion was enabled with a duration of 20 s. Tandem mass spectra were searched against the 2015 Uniprot human databases (UP000005640_9606 and UP000005640_9606_additional) using MaxQuant version 1.5.3.34 with a 1% FDR at the peptide and protein level, peptides with a minimum length of seven amino acids with carbamidomethylation as a fixed modification and protein N-terminal acetylation and methionine oxidations as variable modifications (Cox, J., Mann, M. 2008)(80). Enzyme specificity was set as C-terminal to arginine and lysine using trypsin as protease, and a maximum of two missed cleavages were allowed in the database search. The maximum initial mass tolerance for precursor and fragment ions was 4.5 ppm and 20 ppm, respectively. If applicable, peptide identifications by MS/MS were transferred between runs to minimize missing values for quantification with a 0.7 min window after retention time alignment. Label-free quantification was performed with the MaxLFQ algorithm using a minimum ratio count of 1. Statistical and bioinformatics analysis was performed with Perseus software (version 1.5.5.0), Microsoft Excel, and R statistical software. Proteins that were identified in the decoy reverse database or only by site modification were not considered for data analysis. Median of technical triplicates (referring to independent sample preparations) were calculated and mean log2 ratios of biological duplicates (two metastases and two control tissues collected at different locations of the pleural cavity), and the corresponding p-values were visualized with volcano plots. We used t-tests for binary comparisons and SAM with s0 = 0.1 and a FDR < 0.05 or <0.01 for the assessment of t-test results in volcano plots. The FDR was corrected for multiple hypotheses based on permutation-based FDR correction. Raw data are available from PRIDE (accession number pending).
Western Blotting
Tissue and cell lysates were prepared using RIPA buffer (Cell Signaling Technologies) supplemented with protease inhibitor cocktail (Thermo Fisher Scientific). Protein concentrations were quantitated using BioRad Protein Assay. Equal amounts of protein (10-30μg) were separated on 4-12% Bolt bis-tris plus gels (Thermo Fisher Scientific) and transferred to Immobilon FL PVDF membranes (Millipore Sigma), which were blocked in 5% milk in TBS-T at room temperature for 1 hour and incubated with primary antibodies at 4°C overnight. Blots were incubated with anti-mouse and anti-rabbit secondary antibodies conjugated to HRP (Cell Signaling Technologies) at room temperature for 1 hour before visualization with Pierce ECL Western Blotting Substrate in a BioRad ChemiDoc Plus Imaging system. Blots were stripped with RestorePlus Western Blot Stripping Buffer (Thermo) prior to probing for the loading control.
The following primary antibodies were used: PHGDH (rabbit polyclonal, Sigma #HPA021241; rabbit mAb, Cell Signaling Technologies – CST #66350), ERK2 (rabbit mAb, Abcam #ab32081); β-actin (mouse mAb, Abcam #ab8226; rabbit mAb, CST #8457); HSP90 (rabbit polyclonal, CST #4874); Rad50 Antibody (Rabbit polyclonal, CST #3427), Phospho-Rad50 (Ser635) (Rabbit polyclonal, CST #14223), Phospho-ATM (Ser1981) (D6H9, Rabbit mAb, CST #5883), ATM (D2E2, Rabbit mAb, CST #2873).
Immunofluorescence
Cells were fixed with ice-cold methanol for 15 minutes or 4% paraformaldehyde. Subsequently, cells were permeabilized and blocked with 2% BSA. Primary antibody was added at 1:500 in 1% TBST+1% BSA overnight at 4°C. After 3 washes with 1x PBS, secondary antibody was added at 1:400 with DAPI. After 30 minutes at room temperature, cells were mounted with Prolong Diamond Antifade Mount (Life Technologies). Antibodies used were: 53BP1 (rabbit polyclonal, Novus Biologicals #NB100-304), H2A.X (rabbit polyclonal, Bethyl #A300082A), γ-H2A.X (rabbit polyclonal, phospho-S139; Abcam #ab2893).
Immunohistochemistry
Clinical specimens were obtained and data handled under NYULMC IRB Protocol i19-01549. Immunohistochemistry was performed on 10% neutral buffered formalin fixed, paraffin-embedded human and murine tissue sections. Sections were collected at 5-microns onto plus slides (Fisher Scientific, Cat # 22-042-924) and stored at room temperature prior to use. Unconjugated, polyclonal rabbit anti-human Phosphoglycerate Dehydrogenase (Sigma Aldrich Cat# HPA021241 Lot# GR268490-13 RRID: AB_10680001) was used for human tissues. Unconjugated, polyclonal rabbit anti-human Nuclear Mitotic Apparatus Protein (Abcam Cat# 97585 Lot# B115626 RRID: AB_1855299) was used for murine xenograft samples.
Chromogenic Immunohistochemistry was performed on a Ventana Medical Systems Discovery XT instrument with online deparaffinization and using Ventana’s reagents and detection kits unless otherwise noted. Sections for Phosphoglycerate Dehydrogenase labeling were antigen retrieved in Ventana Cell Conditioner 2 (Citrate pH6.0) at 95°C for 20 minutes. Sections for Nuclear Mitotic Apparatus Protein were deparaffinized in xylene and rehydrated in graded ethanol followed by rinsing in deionized water. Epitope retrieval was performed in a 1200-Watt microwave oven at 100% power in 10mM sodium citrate buffer, pH 6.0 for 10 minutes. Slides were allowed to cool for 30 minutes, rinsed in distilled water, and loaded onto the instrument. Endogenous peroxidase activity was blocked with 3% hydrogen peroxide for 4 minutes. Phosphoglycerate Dehydrogenase antibody was diluted 1:100 in Ventana diluent (Ventana Discovery Antibody Diluent, cat# 760-108) and incubated for 3 hours at room temperature. Nuclear Mitotic Apparatus Protein was diluted 1:7000 in Tris-BSA (25mM Tris, 15mM NaCL, 1% BSA, pH 7.2) and incubated for 12 hours. Both antibodies were detected with goat anti-rabbit HRP conjugated multimer for 8 minutes. The immune complexes were visualized with 3,3 diaminobenzidine and enhanced with copper sulfate. Slides were washed in distilled water, counterstained with hematoxylin, dehydrated and mounted with permanent media. Appropriate positive and negative controls were run in parallel to study sections. Imaging was carried out with a Hamamatsu NanoZoomer whole-slide scanner.
For PHGDH scoring, the same board-certified pathologist (M. Snuderl) who evalauted the specimens scored PHGDH specimens in a blinded fashion for the intensity of PHGDH staining using a scale of 0-3, representing none, weak, moderate, and strong staining (36). PHGDH scoring for extracranial metastases was carried out by a board-certified pathologist (P. Cotzia) who reviewed the brain metastases for concordance. The use of the tumor samples was approved by the NYULMC IRB (protocol S16-00122). Data were analyzed using Fisher’s exact test. NuMA staining was quantitated by automated counting of positive and total nuclei using Visiopharm Image Analysis Software.
Metabolite Profiling: Steady-State and Labeling Experiments
Cells were evenly seeded at 250,000 cells per well in a 6-well plate and allowed to attach for 24 hrs. Prior to all labeling experiments, cells were pretreated with 1 μM compound or the equivalent volume of DMSO in DMEM for 1 hr. For steady-state metabolite concentrations, cells were washed with PBS before pretreatment in DMEM lacking serine and glycine. For labeling experiments, U-13C-glucose (Cambridge Isotope Laboratories CLM-1396-PK) replaced the corresponding unlabeled glucose DMEM component. Cells were washed in 4 °C 0.9%(w/v) NaCl in LCMS-grade water and extracted in 1mL/well of 3:1:2 methanol:water:chloroform with 500 nM 13C, 15N-amino acids (Cambridge Isotope Laboratories MSK-A2-1.2) as internal extraction standards. The extraction solvent was dried in a SpeedVac and metabolite samples were stored at −80C until analysis. Triplicate identically seeded and treated cells were trypsinized and analyzed with a Multisizer Coulter Counter (Beckman Coulter) to obtain cell counts and total cell volumes for normalization.
LC-MS analysis was carried out as described.(40) In brief, metabolites were resuspended in 100 μL LC-MS grade water and run on a SeQuant ZIC-pHILIC column (2.1x150 mm, 5 μm, Millipore-Sigma) on a Dionex UltiMate 3000 UPLC using a 0 to 80% gradient of 20 mM ammonium carbonate and 0.1% ammonium hydroxide, pH 9, in water. Mobile phase was introduced into the ionization source of a high-field Q Exactive Mass Spectrometer (QE HF; Thermo Fisher Scientific) running in polarity switching mode and metabolites were identified by retention time, accurate mass, and fragmentation. Metabolite peaks were integrated with Skeleton (NYU Metabolomics Core Resource Laboratory) and normalized to internal standards and total cell volume. m/z ratios for 13C -labeled metabolites were calculated using Skeleton and IsoMETLIN and corrected for isotopic abundance.(81)
GC-MS analysis was carried out and analyzed as described.(82) In brief, dried, extracted metabolites were derivatized using a MOX-tBDMCS method and analyzed by GC-MS using a DB-35MS column (30m x 0.25mm i.d., 0.25μm) in an Agilent 7890B gas chromatograph interfaced with a 5977B mass spectrometer. Metabolites were identified by unique fragments and retention time in comparison to known standards. Peaks were picked in OpenChrom and integrated and corrected for natural isotopic abundance using in-house algorithms adapted from Fernandez et al. (83–85).
For glucose derivation, frozen and dried metabolites from the aqueous phase were dissolved in 50 μl of 2 wt% hydroxylamine hydrochloride (HOX) in pyridine and incubated at 90°C for 1 hour. Next, 100 μl of propionic anhydride was added and the samples were kept at 60°C for 30 minutes. The samples were dried under nitrogen gas, and resuspended in 100 μl of ethyl acetate, transferred to glass GCMS vials and capped.
Animal studies
Animal experiments were performed in accordance with protocols approved by the Weill Cornell Medicine, NYULMC, MIT, and MGH Institutional Animal Care and Use Committees (IACUC; Weill Cornell protocol 2013-0116; NYULMC protocol IA16-01862, MIT protocol 0119-001-22). For knockdown and inhibitor experiments, the minimum group size per arm was 12 for an anticipated difference of 55% between arms assuming a type I error probability of 0.05 and a power of 80%. We used 15 animals per arm in case of animal loss during intracardiac injection or subsequent procedures.
Intracardiac injection to induce brain metastases was performed as previously described.(1) Briefly, cells were trypsinized and washed with PBS and a 1x10⁵ cells (in 100μl of PBS) were injected into the left cardiac ventricle of female 5-6 week old athymic nude (nu/nu) mice (Jackson Laboratory strain 002019). Mice were then immediately injected with D-luciferin (150 mg/kg−1) and subjected to bioluminescence imaging (BLI) using a IVIS Spectrum Xenogen instrument (Caliper Life Sciences) to ensure systemic dissemination of tumor cells. Metastatic burden was measured weekly after injection using BLI for up to 17 weeks. BLI images were analyzed using Living Image Software v.2.50. Disease-specific survival endpoints were met when the mice died or met the criteria for euthanasia under the IACUC protocol and had radiographic evidence of metastatic disease. T2 MR Imaging (0.5mm slices) was obtained using a Bruker Biospec 94/30 USR 9.4 Tesla Small Animal MRI with a B-GA 20S gradient system in the MSKCC Rodent Imaging Core.
For orthotopic tumor implantation, 2.5x10⁵ cells in 100μl of PBS were mixed 1:1 with Matrigel (BD Biosciences) and injected into the fourth mammary fat pad. Only one tumor was implanted per animal. Primary tumors were surgically excited when they reached ~1.5cm in the largest dimension and metastatic dissemination was assessed using BLI imaging at 1-3-week intervals for up to 30 weeks. Distant metastasis-free survival endpoint was met when BLI signal was seen outside of site of primary tumor transplantation.
Mammary fat pad (MFP) and brain xenografts were generated in female nude mice of 8-9 weeks of age as previously described.(86) Briefly, to generate MFP tumors 5×10⁶ BT474 cells were resuspended in 50μL of a 1:1 ratio of PBS and Matrigel Matrix, High Concentration (BD Biosciences, 354248). For brain tumors, 1×10⁵ BT474 cells were diluted in 1μL of PBS and stereotactically injected into the left frontal lobe of the mouse brain. The day before implantation of tumor cells, a 0.36-mg or 0.72-mg 17beta-estradiol pellet (Innovative Research of America, SE121) was implanted subcutaneously.
To derive short-term cultures from primary tumors and metastases, animals were imaged then sacrificed. Ex-vivo BLI was subsequently performed on harvested organs to define the precise location of the metastatic lesion. Primary tumors and metastases were subsequently mechanically dissociated, cultured in DMEM and sorted for eGFP to exclude host cells.
PH-755 was administered to mice to a dose of 300 mg/kg twice daily by oral gavage as a suspension in PBS containing 0.5% methylcellulose and 0.5% Tween 80. For brain histology, mice were deeply anesthetized with isoflurane and perfused with 10% formalin in PBS prior to sacrifice. Brains were harvested and fixed for 24 hours in 10% formalin followed by 48 hours in 70% ethanol, sectioned, and embedded for H&E staining. Data represent the mean of two independent observers using FIJI to measure brain and metastasis size.
CSF was isolated as previously described.(11) Whole blood was obtained by cardiac puncture into heparinized collection tubes (BD Microtainer), which were centrifuged at 1000 x g at 4°C for 10 minutes. The plasma was flash-frozen until analysis. For LC-MS analysis, 20μL of plasma were extracted with 80μL 80:20 methanol:water with 500nM 13C, 15N-amino acids (Cambridge Isotope Laboratories MSK-A2-1.2) as internal extraction standards and centrifuged at ≥15000 x g at 4 °C for 10 minutes. The supernatant was dried in a SpeedVac and stored at −80 °C until GC-MS or LC-MS analysis.
Differences in luminescence and in metastasis area were analyzed using the Mann-Whitey U test. Kaplan-Meier survival curves were compared using the log-rank test.
Glucose Infusions in Mice
Catheters were surgically implanted into the jugular vein of tumor bearing animals three days before the infusion experiment. Prior to the initiation of the study, mice were fasted for 6 hours. U-13C-glucose (Cambridge Isotope Laboratories) was infused at a constant rate of 30 mg/kg/min for twelve hours into conscious, free-moving animals, after which the animals were terminally anesthetized with 120 mg/kg sodium pentobarbital. Blood was collected immediately by cardiac puncture, and tumors were harvested quickly, within five minutes of sacrifice. Tissues were frozen using a BioSqueezer (BioSpec Products) and stored at −80°C for subsequent metabolite extraction and analysis.
Tissue GC-MS measurements
Tissues were harvested quickly, rapidly crushed and frozen using a BioSqueezer and 10-30mg of tissue was weighed out for extraction. Metabolites were extracted using ice-cold HPLC-grade methanol, water, and chloroform at a volume ratio of 600:300:400 (usually 600μL:300μL:400μL. Samples were vortexed for 10 minutes at 4°C and centrifuged for 10 minutes at 21,000g and 4°C to separate the top, aqueous layer and the bottom, organic layer. Each layer was collected and dried under nitrogen gas, and stored at −80°C for subsequent analysis by liquid or gas-chromatography mass-spectrometry.
Pharmacokinetic and Pharmacodynamic Measurements
For in vivo labeling, mice were fasted for 6 hours starting from midnight and injected intraperitoneally with 2 g/kg of U-13C-glucose and sacrificed 60 minutes later. Following cardiac puncture to recover plasma, the brain was removed and visualized using a Leica M205 FA fluorescence stereo dissecting scope and metastases dissected quickly using a scalpel and forceps. Tissues were quenched at liquid nitrogen temperatures using a BioSqueezer (BioSpec Products) and stored at −80°C. Tissue samples were weighed, extracted in 200μL 3:1:2 methanol:water:chloroform / mg of tissue, and the polar fraction was recovered, dried on a speedvac, and stored at −80°C until LC-MS analysis or derivatization for GC-MS analysis.
Pharmacokinetic data were obtained from groups of n ≥ 3 mice that were administered PH-755 by oral gavage in suspension at the indicated doses and whole blood drawn and plasma isolated at the indicated timepoints. PH-755 was quantitated by LC-MS using a standard curve.
Cell Cycle Analysis
Cells were treated with DMSO or PH-719 for 12 hrs prior to the addition of BrdU at a final concentration of 10μM. After 2hrs of BrdU labeling, cells were collected and fixed in 70% ethanol. Subsequently, ethanol-suspended cells were centrifuged at 200 x g for 5 minutes. The ethanol was removed and the cell pellet was suspended in 5ml 1x PBS before centrifuge at 200 x g for 5 minutes. Excess PBS was removed, and 100μL of staining buffer containing anti-BrdU-FITC was added and allowed to incubate for 1 hr at room temperatures. 900μL 1:1,000 DAPI solution was added, and incubated for 40 minutes in the dark room at room temperature. Approximately 2x10⁶ cells were sorted using a FACScalibur (BD Biosciences) flow cytometer. Results were analyzed using FlowJo (FlowJo, LLC).
In Vitro Invasion Assay
For the invasion and migration assays we used the cytoselect cell invasion (CBA-110) kits. In brief, 5x10⁴ cells were suspended in serum-free medium and placed on top of the membrane. Medium containing serum was placed at the bottom. PHGDH inhibitor or vehicle, if needed, were added to both the top and bottom compartments. Cells that had invaded to the inferior surface of the collagen membrane were stained and counted 24 hrs. later.
Colony Formation Assay
Aggressive brain metastatic cells were counted and seeded at 400 cells / well in a standard 6-well plate (Nunc) in full media. The media was exchanged on the following day and PHGDH inhibitors or DMSO were added. Cells were incubated for 10 days, fixed with 10% formalin, and stained with crystal violet. Sigma EmbryoMax Nucleosides purchased as a 100x stock were diluted to 1x for rescue experiments. After photography, the crystal violet was quantitated by dissolving in 500μL of 10% acetic acid and absorbance measured at 590 nm. Data were normalized to plating efficiency as measured by A590 24 hours after plating.
Isolation of Patient-Derived CTCs
Patient-derived CTCs used in this study (BrX50 CTC line) were previously reported.(87,88) In brief, peripheral blood from metastatic breast cancer patients were processed by CTC-iChip. CD45/CD15 conjugated magnetic beads were used to deplete white blood cells, and antibody agnostic circulating tumor cells were collected in the effluent. These CTCs were cultured in 4% oxygen, in RPMI with bFGF, EGF, and B27 supplementation. Once CTCs proliferated to have enough biological material for in vivo work, they were transduced with a GFP-luciferase expressing construct and injected by intracardiac injection into NSG mice. These mice were followed for 5-8 months for metastatic relapse by bioluminescent imaging. At endpoint, metastatic lesions were resected and sorted for GFP+ cells. To obtain second-generation and third-generation brain metastatic derivatives, cells were expanded in culture, and additional rounds of in vivo injection (~100K cells/mouse) was performed.
Generation of RCC PDX Model
A patient-derived xenograft (PDX) model of human renal cell carcinoma brain metastasis was generated by transplanting freshly obtained surgically excised tumor specimens from patients who had given consent under the IRB approved protocol (MSKCC IRB #O6-107) into female immunocompromised NOD/SCID/IL2Rγnull (NSG) mice (Jackson Laboratories strain 005557) subcutaneously. All relevant IRB and ethical regulations were followed (MSKCC IRB # 17-067). Tumors were maintained till the tumor size reached around 1.5 cubic cm each for a maximum of three serial passages. In brief, half of the freshly obtained tumor tissue (about 200-400 mg bulk) were cut into 4-8mm pieces and directly re-transplanted subcutaneously for passaging. The other half was minced into 2-4mm pieces in serum-free MEM medium with nonessential amino acids (Cat. No. 41500018, Thermo Fisher Scientific), transiently transduced with a lentiviral vector expressing pUltra-Chili–Luc plasmid (Addgene plasmid: 48688), and re-transplanted into mice subcutaneously. To generate PDX-derived cell lines, the PDX tumor was chopped into 1-2mm3 pieces and incubated in Accutase (AT104; Innovative Cell Technologies) for cell detachment and separation over 1-2 h. The dissociated tissues were sieved through 100-μm cell strainers and the cells were pelleted by centrifugation at 1,200 rpm (Eppendorf Centrifuge 5810 R). The pellets were washed and resuspended in the RPMI buffer with 10% FBS including Penn/Strep antibiotic cocktail for generating the primary PDX derived cells. All the above sources of the PDX tumor were verified to form tumor subcutaneously and orthotopically at the primary kidney site as well as at the other metastatic sites such as lung and brain. Typically, PDX tumor growth became palpably evident during the first 2-4 weeks after engraftment and tumors were harvested after an additional 4-8 weeks of growth following institutional RARC supervised and IACUC approved animal protocol. Primary tumor growth and metastases were followed using BLI or spectrum CT imaging.
RNA-sequencing (RNA-seq)
HTSeq-count (v0.9.1) tool was applied with its default settings to count uniquely aligned reads from 77 RNA-seq BAM files downloaded from the European Genome–Phenome Archive (EGA; accession number EGAS00001003672. G. M. Fischer and M. A. Davies provided raw expected counts acquired from A375, MEWO, and WM1361A intracranial (ICr) (n=3 each) and subcutaneous (SQ) (n=3 each) xenografts as previously described. For all analyses, counts were normalized using the TMM method and generalized linear models were used for differential expression analyses. Comparisons of interest were performed using functions from the edgeR and limma/voom Bioconductor packages in R (v3.6.1). Lowly expressed genes were filtered as follows: filterByExpr function for clinical samples and genes with an average log2−(CPM+0.5) < 0 for A375, MEWO, and WM1361A ICr and SQ xenografts. Blocking was performed to account for differences in patients or cell lines.
Pathways were assessed between ICr and SQ xenografts and between 35 melanoma brain metastases (MBMs) and 42 patient-matched extracranial metastases (ECMs) from multiple accession sites using the R package fry on default settings. The voom-transformed expression matrices were used as the initial inputs, and the Gene Ontology (GO) gene set “GO:0006564; L-Serine Biosynthetic Processes” was used in comparisons. In parallel, a preranked GSEA (GSEA-P) was implemented on the clinical samples using the GenePattern module GSEAPreranked (v6.0.10). Gene sets featured 70 previously characterized KEGG metabolic pathways included in a single .gmt file. Rank metric was calculated as the sign of log2-FCs multiplied by the inverse of p-values calculated using the edgeR/limma/voom pipeline. GSEA-P was performed on the rank metric–sorted list of genes using the “classic” Kolmogorov-Smirnov scoring scheme. Finally, site specific pathway analyses were performed between 4 MBMs and 5 patient-matched lung metastases, 12 MBMs and 12 patient-matched skin metastases, and 15 MBMs and 17 patient-matched skin/lung metastases using the fry package with the abovementioned settings.
In vitro enzyme activity
The D175N, R236K, H283A catalytically inactive mutant of PHGDH was constructed by overlapping PCR. N-terminally 6xHis tagged wild-type and catalytically inactive PHGDH were expressed, purified, and assayed as described (40).
Hyperpolarization using DNP and MRS acquisition
35 μL mixture of [1-13C] pyruvate (14.2 M, GE Healthcare) and GE trityl radical (15 mM, GE Healthcare) was hyperpolarized by the DNP method using a SPINlab polarizer (5 T, 0.80 K, GE Healthcare). Following polarization for 3h, the frozen sample was rapidly dissolved in TRI buffer (10 mL, 100 mM, pH 7.4) containing 1 mM EDTA (Fisher Scientific, USA) in D2O (Cambridge Isotope Laboratories). The solution was neutralized in a receiving flask containing sodium hydroxide (10N) such that the final solution was pH 7.4. 250 μL of 100 mM hyperpolarized [1-13C]pyruvate was injected intravenously in the tail vein of a catheterized animal in 10 seconds (89). HP pyruvate was injected at a concentration that saturates monocarboxylate transporter 1 (MCT1) (pyruvate Km=2.14mM) (90). Immediately after completion of the HP pyruvate injection, 13C data were acquired using a 3T MRI system (Bruker) using a 1H/13C volume RF coil; T2-TurboRare images were acquired for anatomic localization, covering the whole tumor (TE/TR=79.46/3570.6ms, Rare Factor= 8, 30x40x14 of FOV, with thickness of 2-mm for slices). A preliminary dynamic slab study on a small group of mock mice was performed. (n=3) The mock model was generated with stereotactic injection of 2μL of normal saline into their brain 3 weeks before imaging experiment. An axial two-dimensional echo-planar spectroscopic imaging (2DEPSI) sequence was used to acquire the HP spectra (80mm x 40mm FOV, 10-mm slab thickness, sweep width= 3,125 Hz, spectral points= 256, echo time= 4.84ms, repetition time= 312.5 ms, flip angle 12°), with the timing derived from the previous dynamic studies on mock mice. 3 mice with orthotopic brain tumors were used [each mouse was treated with vehicle via oral gavage and 3 h later was imaged, right after imaging the same mouse treated with PHGDHi (200 mg/Kg) and 3 h later was imaged), resulting in 4 tumor replicates per group. Spectroscopic data were processed using custom software to generate 2D dynamic datasets registered to the corresponding anatomic MRI (MATLAB R2018a, Mathworks) (91). The HP [1-13C]pyruvate signal (PYR) and [1-13C]lactate signal (LAC) were calculated from the area under the respective peaks for each voxel. The dynamic curves were then fit to a two-site exchange model to derive the rate constant kpl, which represents the conversion rate of pyruvate to lactate, using open source software (SIVIC) (92). The T1 of HP [1-13C] pyruvate was measured using a 1 Tesla Spinsolve Spectrometer approximately 147.0 (± 7s) (Magritek, San Diego, CA) with a 5 mm 1H/13C coil as previously described (93).
Supplementary Material
Statement of Significance.
Using proteomics, metabolomics, and multiple brain metastasis models, we demonstrate that the nutrient limited environment of the brain potentiates brain metastasis susceptibility to serine synthesis inhibition. These findings underscore the importance of studying cancer metabolism in physiologically-relevant contexts, and provide a rationale for using PHGDH inhibitors to treat brain metastasis.
Acknowledgements
The authors would like to thank all members of the Mann, Cantley, and Pacold Laboratories for critical feedback. We also thank Xin Li, Christopher Chin and Miriam Sindelar for technical assistance, Tony T. Huang, Steven Gross, Lin Lin, Edouard Mullarky and Costas Lyssiotis for helpful discussions and technical advice, and the NYULH, WCMC and MSK Small Animal Imaging Cores for assistance with MRI and BLI. Wild-type (Addgene plasmid 154917) and codon-optimized PHGDH were a gift of R. Possemato (Addgene plasmids 154915, 154916). We thank Huiyong Zhao (MSK Antitumor Assessment Core) and Arsen Mamakhanyan for technical assistance with Hyperpolarizer experiments. We thank Nelson Moss for pre-consented brain metastasis specimens under approved IRB (177-067). We thank Iman Osman for the gift of the 12-273 short-term culture melanoma cell line. We are grateful for support from Luis Chiriboga and the NYU Center for Bio-specimen Research and Development and the NYU Metabolomics Core Resource Laboratory in acquiring and analyzing data.
Financial Support:
B.N. is supported by a National Science Foundation (NSF) Graduate Research Fellowship and a National Cancer Institute (NCI) of the National Institutes of Health (NIH) under the F99/K00 Career Transition Fellowship (F99CA234950). V.O.V. is supported by a NIH F31 Ruth L. Kirschstein National Research Service Award (NRSA) Pre-doctoral Fellowship (F31 CA250364-01). A.L. and S.M.D. were supported by an NSF Graduate Research Fellowship and T32GM007287. A.A. is supported by the HHMI medical fellows program. R.E. is supported by a Tow Foundation Postdoctoral Fellowship from Center for Molecular Imaging and Nanotechnology (CMINT) at Memorial Sloan Kettering. G.M.F. received research funding from the NIH National Center for Advancing Translational Sciences (TL1TR000369 and UL1TR000371) and The University of Texas MD Anderson Cancer Center (MD Anderson)/UTHealth Graduate School of Biomedical Sciences’ Caroline Ross Fellowship, Schissler Foundation Fellowship, and Presidents’ Research Scholarship. J.H.H. and V.K.R. are supported by the MSKCC NIH/NCI Cancer Center Support Core Grant P30-CA008748. S.F.B. is supported by the NIH (DP5OD026395 High-Risk High-Reward Program), the Department of Defense Breast Cancer Research Breakthrough Award W81XWH-16-1-0315 (Project: BC151244), the Burroughs Wellcome Fund Career Award for Medical Scientists, the Parker Institute for Immunotherapy at MSKCC, the Josie Robertson Foundation, and the MSKCC core grant P30-CA008748. M.Y. is supported by an NCI K22 Career Transition Award (K22 CA175228-01A1), NIH DP2 award (DP2 CA206653), Donald E. And Delia B. Baxter Foundation, Stop Cancer Foundation, Wright Foundation, and is a Pew-Stewart Scholar for Cancer Research. J.Z. is supported by the NIH (R35 CA210057, P50 CA168504), DoD (W81XWH-18-1-0491), and the Breast Cancer Research Foundation. D.M.S. is supported by the NCI of the NIH under Award R03 DA034602-01A1, R01 CA129105, R01 CA103866, and R37 AI047389. D.M.S. is an investigator of the Howard Hughes Medical Institute. K.R.K is supported by the NIH (R01CA237466, R01CA252037 and R21CA212958) and the STARR Cancer Consortium. M.A.D. is supported by the Dr. Miriam and Sheldon G. Adelson Medical Research Foundation, the AIM at Melanoma Foundation, the NIH/NCI (R01 CA121118-06A1 and 2T32CA009666-21), the Cancer Prevention Research Institute of Texas (CPRIT) (RP170401 and RP160183), the MD Anderson Multidisciplinary Research Program, and philanthropic contributions to the Melanoma Moon Shots Program of MD Anderson. R.K.J. and M.G.V.H. were supported by a Dana-Farber Harvard Cancer Center/MIT Koch Institute Bridge Project grant. R.K.J. is also supported by the Lustgarten Foundation; a grant from the Ludwig Center at Harvard; National Cancer Institute Grants P01 CA080124, R01 CA126642, R01 CA085140, R01 CA115767, R01 CA098706, R01 CA208205, U01 CA224173, and R35 CA197743; and US Department of Defense Breast Cancer Research Program Innovator Award W81XWH-10-1-0016. M.G.V.H. is also supported by the NIH (R21CA198028, R01CA168653), the MIT Ludwig Center, the MIT Center for Precision Cancer Medicine, a Stand Up To Cancer Innovative Research Grant, Grant Number SU2C-AACR-IRG-09-16, the Lustgarten Foundation, and a Faculty Scholar Grant from HHMI. Stand Up To Cancer is a division of the Entertainment Industry Foundation. The SU2C research grant is administered by the American Association for Cancer Research, the scientific partner of SU2C. E.H. is supported by the NIH/NCI R01CA2022027. NIH/NCI P01CA206980 (PIs: Berwick,Thomas) and NIH Melanoma SPORE 1P50CA225450 (PIs: Osman, Weber). M.M. is supported by the Max Planck Society for the Advancement of Science, the European Union’s Horizon 2020 research and innovation program (Grant agreement no. 686547; MSmed project), the European Commission 7th Research Framework Program (GA ERC-202120Syg_318987; ToPAG project), and by the Novo Nordisk Foundation for the Clinical Proteomics group (grant NNF15CC0001). L.C.C. is supported by the NIH (NCI R35CA197588 and U54 CA210184), the Breast Cancer Research Foundation, the Gray Foundation Basser Initiative, and gifts from the Lori and Zachary Schreiber Family and the Roger and Susan Hertog Charitable Fund. M.E.P. is supported by a Mary Kay Foundation Cancer Research Grant (17–32), the Shifrin-Myers Breast Cancer Discovery Fund at NYULMC, a V Foundation V Scholar Grant funded by the Hearst Foundation (V2017-004), an NCI K22 Career Transition Award (1K22CA212059), a Career Enhancement Program Grant from the NYU Melanoma SPORE (1P50CA225450; PIs: Osman, Weber), the Tara Miller Melanoma Foundation – MRA Young Investigator Award (MRA YIA 688365), and laboratory-directed research funding from the John and Elaine Kanas Family Foundation. The NYULMC CBRD, Metabolomics Core Resource Laboratory, and NYULMC Cores are partially funded by the NYUPCC Cancer Support Grant, NIH/NCI 5P30CA016087.
Conflicts of Interest:
A.L. is currently employed at a Flagship Venture Laboratories start-up company. J.N. is a consultant for Geode Therapeutics. S.F.B. is a consultant to, serves on the board of directors and scientific advisory board, and is a founder of Volastra Therapeutics. M.A.D. has been a consultant to Roche/Genentech, Array, Novartis, BMS, GSK, Sanofi-Aventis, and Vaccinex, and he has been the PI of funded research grants to his institution by Roche/Genentech, GSK, Sanofi-Aventis, Merck, Myriad, and Oncothyreon. J.Z. is a founder and board director of Crimson Biopharm and Geode Therapeutics. M.G.V.H. is on the scientific advisory board of Agios Pharmaceuticals, Aeglea Biotherapeutics, iTeos Therapeutics, and Auron Therapeutics. D.M.S. is a founder and holds equity in Raze Therapeutics, Navitor Pharmaceuticals, and KSQ Therapeutics. Raze Therapeutics has interests in targeting one-carbon metabolism in cancer. K.R.K serves on the scientific advisory board of NVision Imaging Technologies. L.C.C. owns equity in, receives compensation from, and serves on the board of directors and scientific advisory board, and is a founder of Agios Pharmaceuticals. L.C.C. is a founder of and receives laboratory support from Petra Pharmaceuticals. Agios Pharmaceuticals is identifying metabolic pathways of cancer cells and developing drugs to inhibit such enzymes in order to disrupt tumor cell growth and survival. Petra Pharmaceuticals is a company developing drugs for cancer therapy. M.E.P. is a consultant to and holds equity in Raze Therapeutics and is the recipient of travel funds from Thermo Fisher Scientific. MAD No potential conflicts of interest were disclosed by other authors.
References
- 1.Bakhoum SF, Ngo B, Laughney AM, Cavallo J-A, Murphy CJ, Ly P, et al. Chromosomal instability drives metastasis through a cytosolic DNA response. Nature. 2018;553:467–72. [DOI] [PMC free article] [PubMed] [Google Scholar]
- 2.Smith HA, Kang Y. Determinants of Organotropic Metastasis. Annu Rev Cancer Biol. 2017;1:403–23. [Google Scholar]
- 3.McDonald OG, Li X, Saunders T, Tryggvadottir R, Mentch SJ, Warmoes MO, et al. Epigenomic reprogramming during pancreatic cancer progression links anabolic glucose metabolism to distant metastasis. Nat Genet. 2017;49:367–76. [DOI] [PMC free article] [PubMed] [Google Scholar]
- 4.Jacob LS, Vanharanta S, Obenauf AC, Pirun M, Viale A, Socci ND, et al. Metastatic Competence Can Emerge with Selection of Preexisting Oncogenic Alleles without a Need of New Mutations. Cancer Research. 2015;75:3713–9. [DOI] [PMC free article] [PubMed] [Google Scholar]
- 5.Valiente M, Ahluwalia MS, Boire A, Brastianos PK, Goldberg SB, Lee EQ, et al. The Evolving Landscape of Brain Metastasis. Trends Cancer; 2018;4:176–96. [DOI] [PMC free article] [PubMed] [Google Scholar]
- 6.Kodack DP, Askoxylakis V, Ferraro GB, Fukumura D, Jain RK. Emerging strategies for treating brain metastases from breast cancer. Cancer Cell. 2015;27:163–75. [DOI] [PMC free article] [PubMed] [Google Scholar]
- 7.Achrol AS, Rennert RC, Anders C, Soffietti R, Ahluwalia MS, Nayak L, et al. Brain metastases. Nat Rev Dis Primers. 2019;5:5. [DOI] [PubMed] [Google Scholar]
- 8.Ostrom QT, Wright CH, Barnholtz-Sloan JS. Brain metastases: epidemiology. Handb Clin Neurol. 2018;149:27–42. [DOI] [PubMed] [Google Scholar]
- 9.Chen J, Lee H-J, Wu X, Huo L, Kim S-J, Xu L, et al. Gain of glucose-independent growth upon metastasis of breast cancer cells to the brain. Cancer Research. 2015;75:554–65. [DOI] [PMC free article] [PubMed] [Google Scholar]
- 10.Fischer GM, Jalali A, Kircher DA, Lee W- C, McQuade JL, Haydu LE, et al. Molecular Profiling Reveals Unique Immune and Metabolic Features of Melanoma Brain Metastases. Cancer Discov. 2019;9:628–45. [DOI] [PMC free article] [PubMed] [Google Scholar]
- 11.Boire A, Zou Y, Shieh J, Macalinao DG, Pentsova E, Massagué J. Complement Component 3 Adapts the Cerebrospinal Fluid for Leptomeningeal Metastasis. Cell. 2017;168:1101–13. [DOI] [PMC free article] [PubMed] [Google Scholar]
- 12.Varešlija D, Priedigkeit N, Fagan A, Purcell S, Cosgrove N, O’Halloran PJ, et al. Transcriptome Characterization of Matched Primary Breast and Brain Metastatic Tumors to Detect Novel Actionable Targets. J Natl Cancer Inst. 2019;111:388–98. [DOI] [PMC free article] [PubMed] [Google Scholar]
- 13.Chen Q, Boire A, Jin X, Valiente M, Er EE, Lopez-Soto A, et al. Carcinoma-astrocyte gap junctions promote brain metastasis by cGAMP transfer. Nature. 2016;533:493–8. [DOI] [PMC free article] [PubMed] [Google Scholar]
- 14.Bos PD, Zhang XH-F, Nadal C, Shu W, Gomis RR, Nguyen DX, et al. Genes that mediate breast cancer metastasis to the brain. Nature. 2009;459:1005–9. [DOI] [PMC free article] [PubMed] [Google Scholar]
- 15.Priego N, Zhu L, Monteiro C, Mulders M, Wasilewski D, Bindeman W, et al. STAT3 labels a subpopulation of reactive astrocytes required for brain metastasis. Nat Med. 2018;24:1024–35. [DOI] [PubMed] [Google Scholar]
- 16.Brastianos PK, Carter SL, Santagata S, Cahill DP, Taylor-Weiner A, Jones RT, et al. Genomic Characterization of Brain Metastases Reveals Branched Evolution and Potential Therapeutic Targets. Cancer Discov. 2015;5:1164–77. [DOI] [PMC free article] [PubMed] [Google Scholar]
- 17.Er EE, Valiente M, Ganesh K, Zou Y, Agrawal S, Hu J, et al. Pericyte-like spreading by disseminated cancer cells activates YAP and MRTF for metastatic colonization. Nat Cell Biol. 2018;20:966–78. [DOI] [PMC free article] [PubMed] [Google Scholar]
- 18.Valiente M, Obenauf AC, Jin X, Chen Q, Zhang XH-F, Lee DJ, et al. Serpins promote cancer cell survival and vascular co-option in brain metastasis. Cell. 2014;156:1002–16. [DOI] [PMC free article] [PubMed] [Google Scholar]
- 19.Spector R, Robert Snodgrass S, Johanson CE. A balanced view of the cerebrospinal fluid composition and functions: Focus on adult humans. Exp Neurol. 2015;273:57–68. [DOI] [PubMed] [Google Scholar]
- 20.Dolgodilina E, Imobersteg S, Laczko E, Welt T, Verrey F, Makrides V. Brain interstitial fluid glutamine homeostasis is controlled by blood-brain barrier SLC7A5/LAT1 amino acid transporter. J Cereb Blood Flow Metab. 2016;36:1929–41. [DOI] [PMC free article] [PubMed] [Google Scholar]
- 21.Jones CM, Smith M, Henderson MJ. Reference data for cerebrospinal fluid and the utility of amino acid measurement for the diagnosis of inborn errors of metabolism. Ann Clin Biochem. 2006;43:63–6. [DOI] [PubMed] [Google Scholar]
- 22.Rainesalo S, Keränen T, Palmio J, Peltola J, Oja SS, Saransaari P. Plasma and cerebrospinal fluid amino acids in epileptic patients. Neurochem Res. 2004;29:319–24. [DOI] [PubMed] [Google Scholar]
- 23.Maggs DG, Jacob R, Rife F, Lange R, Leone P, During MJ, et al. Interstitial fluid concentrations of glycerol, glucose, and amino acids in human quadricep muscle and adipose tissue. Evidence for significant lipolysis in skeletal muscle. J Clin Invest. 1995;96:370–7. [DOI] [PMC free article] [PubMed] [Google Scholar]
- 24.Muir A, Vander Heiden MG. The nutrient environment affects therapy. Science. American Association for the Advancement of Science; 2018;360:962–3. [DOI] [PMC free article] [PubMed] [Google Scholar]
- 25.Davidson SM, Papagiannakopoulos T, Olenchock BA, Heyman JE, Keibler MA, Luengo A, et al. Environment Impacts the Metabolic Dependencies of Ras-Driven Non-Small Cell Lung Cancer. Cell Metab. 2016;23:517–28. [DOI] [PMC free article] [PubMed] [Google Scholar]
- 26.Gui DY, Sullivan LB, Luengo A, Hosios AM, Bush LN, Gitego N, et al. Environment Dictates Dependence on Mitochondrial Complex I for NAD+ and Aspartate Production and Determines Cancer Cell Sensitivity to Metformin. Cell Metab. 2016;24:716–27. [DOI] [PMC free article] [PubMed] [Google Scholar]
- 27.Davidson SM, Jonas O, Keibler MA, Hou HW, Luengo A, Mayers JR, et al. Direct evidence for cancer-cell-autonomous extracellular protein catabolism in pancreatic tumors. Nat Med. 2017;23:235–41. [DOI] [PMC free article] [PubMed] [Google Scholar]
- 28.Sullivan MR, Vander Heiden MG. Determinants of nutrient limitation in cancer. Crit Rev Biochem Mol Biol. Taylor & Francis; 2019;282:1–15. [DOI] [PMC free article] [PubMed] [Google Scholar]
- 29.Sullivan MR, Vander Heiden MG. When cancer needs what’s non-essential. Nat Cell Biol. 2017;19:418–20. [DOI] [PubMed] [Google Scholar]
- 30.Garcia-Bermudez J, Baudrier L, La K, Zhu XG, Fidelin J, Sviderskiy VO, et al. Aspartate is a limiting metabolite for cancer cell proliferation under hypoxia and in tumours. Nat Cell Biol. 2018;20:775–81. [DOI] [PMC free article] [PubMed] [Google Scholar]
- 31.Alkan HF, Walter KE, Luengo A, Madreiter-Sokolowski CT, Stryeck S, Lau AN, et al. Cytosolic Aspartate Availability Determines Cell Survival When Glutamine Is Limiting. Cell Metab. 2018;28:706–6. [DOI] [PMC free article] [PubMed] [Google Scholar]
- 32.Muir A, Danai LV, Gui DY, Waingarten CY, Lewis CA, Vander Heiden MG. Environmental cystine drives glutamine anaplerosis and sensitizes cancer cells to glutaminase inhibition. Elife. 2017;6:619. [DOI] [PMC free article] [PubMed] [Google Scholar]
- 33.Sullivan MR, Mattaini KR, Dennstedt EA, Nguyen AA, Sivanand S, Reilly MF, et al. Increased Serine Synthesis Provides an Advantage for Tumors Arising in Tissues Where Serine Levels Are Limiting. Cell Metab. 2019;29:1410–4. [DOI] [PMC free article] [PubMed] [Google Scholar]
- 34.Sullivan MR, Danai LV, Lewis CA, Chan SH, Gui DY, Kunchok T, et al. Quantification of microenvironmental metabolites in murine cancers reveals determinants of tumor nutrient availability. Elife. 2019;8. [DOI] [PMC free article] [PubMed] [Google Scholar]
- 35.Cantor JR, Abu-Remaileh M, Kanarek N, Freinkman E, Gao X, Louissaint A, et al. Physiologic Medium Rewires Cellular Metabolism and Reveals Uric Acid as an Endogenous Inhibitor of UMP Synthase. Cell. 2017;169:258–272.e17. [DOI] [PMC free article] [PubMed] [Google Scholar]
- 36.Possemato R, Marks KM, Shaul YD, Pacold ME, Kim D, Birsoy K, et al. Functional genomics reveal that the serine synthesis pathway is essential in breast cancer. Nature. 2011;476:346–50. [DOI] [PMC free article] [PubMed] [Google Scholar]
- 37.Locasale JW, Grassian AR, Melman T, Lyssiotis CA, Mattaini KR, Bass AJ, et al. Phosphoglycerate dehydrogenase diverts glycolytic flux and contributes to oncogenesis. Nat Genet. 2011;43:869–74. [DOI] [PMC free article] [PubMed] [Google Scholar]
- 38.DeNicola GM, Karreth FA, Humpton TJ, Gopinathan A, Wei C, Frese K, et al. Oncogene-induced Nrf2 transcription promotes ROS detoxification and tumorigenesis. Nature. 2011;475:106–9. [DOI] [PMC free article] [PubMed] [Google Scholar]
- 39.Zhang B, Zheng A, Hydbring P, Ambroise G, Ouchida AT, Goiny M, et al. PHGDH Defines a Metabolic Subtype in Lung Adenocarcinomas with Poor Prognosis. Cell Rep. Cell Press; 2017;19:2289–303. [DOI] [PubMed] [Google Scholar]
- 40.Pacold ME, Brimacombe KR, Chan SH, Rohde JM, Lewis CA, Swier LJYM, et al. A PHGDH inhibitor reveals coordination of serine synthesis and one-carbon unit fate. Nat Chem Biol. 2016;12:452–8. [DOI] [PMC free article] [PubMed] [Google Scholar]
- 41.Mullarky E, Lucki NC, Beheshti Zavareh R, Anglin JL, Gomes AP, Nicolay BN, et al. Identification of a small molecule inhibitor of 3-phosphoglycerate dehydrogenase to target serine biosynthesis in cancers. Proc Natl Acad Sci USA. 2016;113:1778–83. [DOI] [PMC free article] [PubMed] [Google Scholar]
- 42.Reid MA, Allen AE, Liu S, Liberti MV, Liu P, Liu X, et al. Serine synthesis through PHGDH coordinates nucleotide levels by maintaining central carbon metabolism. Nat Commun. 2018;9:5442. [DOI] [PMC free article] [PubMed] [Google Scholar]
- 43.Chen J, Chung F, Yang G, Pu M, Gao H, Jiang W, et al. Phosphoglycerate dehydrogenase is dispensable for breast tumor maintenance and growth. Oncotarget. 2013;4:2502–11. [DOI] [PMC free article] [PubMed] [Google Scholar]
- 44.Geiger T, Cox J, Mann M. Proteomic changes resulting from gene copy number variations in cancer cells. PLoS Genet. 2010;6:e1001090. [DOI] [PMC free article] [PubMed] [Google Scholar]
- 45.Eckert MA, Coscia F, Chryplewicz A, Chang JW, Hernandez KM, Pan S, et al. Proteomics reveals NNMT as a master metabolic regulator of cancer-associated fibroblasts. Nature. 2019;569:723–8. [DOI] [PMC free article] [PubMed] [Google Scholar]
- 46.Doll S, Gnad F, Mann M. The Case for Proteomics and Phospho-Proteomics in Personalized Cancer Medicine. Proteomics Clin Appl. 2019;13:e1800113. [DOI] [PMC free article] [PubMed] [Google Scholar]
- 47.Doll S, Kriegmair MC, Santos A, Wierer M, Coscia F, Neil HM, et al. Rapid proteomic analysis for solid tumors reveals LSD1 as a drug target in an end-stage cancer patient. Mol Oncol. 2018;12:1296–307. [DOI] [PMC free article] [PubMed] [Google Scholar]
- 48.Coscia F, Lengyel E, Duraiswamy J, Ashcroft B, Bassani-Sternberg M, Wierer M, et al. Multi-level Proteomics Identifies CT45 as a Chemosensitivity Mediator and Immunotherapy Target in Ovarian Cancer. Cell. 2018;175:159–170.e16. [DOI] [PMC free article] [PubMed] [Google Scholar]
- 49.Mattaini KR, Sullivan MR, Vander Heiden MG. The importance of serine metabolism in cancer. J Cell Biol. 2016;214:249–57. [DOI] [PMC free article] [PubMed] [Google Scholar]
- 50.Lin NU, Winer EP. Brain metastases: the HER2 paradigm. Clin Cancer Res. 2007;13:1648–55. [DOI] [PubMed] [Google Scholar]
- 51.Hofland KF, Thougaard AV, Dejligbjerg M, Jensen LH, Kristjansen PEG, Rengtved P, et al. Combining etoposide and dexrazoxane synergizes with radiotherapy and improves survival in mice with central nervous system tumors. Clin Cancer Res. 2005;11:6722–9. [DOI] [PubMed] [Google Scholar]
- 52.Rodriguez AE, Ducker GS, Billingham LK, Martinez CA, Mainolfi N, Suri V, et al. Serine Metabolism Supports Macrophage IL-1β Production. Cell Metab. 2019;29:1003–4. [DOI] [PMC free article] [PubMed] [Google Scholar]
- 53.Aupérin A, Arriagada R, Pignon JP, Le Péchoux C, Gregor A, Stephens RJ, et al. Prophylactic cranial irradiation for patients with small-cell lung cancer in complete remission. Prophylactic Cranial Irradiation Overview Collaborative Group. New England Journal of Medicine. 1999;341:476–84. [DOI] [PubMed] [Google Scholar]
- 54.Samanta D, Park Y, Andrabi SA, Shelton LM, Gilkes DM, Semenza GL. PHGDH Expression Is Required for Mitochondrial Redox Homeostasis, Breast Cancer Stem Cell Maintenance, and Lung Metastasis. Cancer Research. 2016;76:4430–42. [DOI] [PubMed] [Google Scholar]
- 55.Schild T, Low V, Blenis J, Gomes AP. Unique Metabolic Adaptations Dictate Distal Organ-Specific Metastatic Colonization. Cancer Cell. 2018;33:347–54. [DOI] [PMC free article] [PubMed] [Google Scholar]
- 56.Basnet H, Tian L, Ganesh K, Huang Y-H, Macalinao DG, Brogi E, et al. Flura-seq identifies organ-specific metabolic adaptations during early metastatic colonization. Elife. 2019;8:5978. [DOI] [PMC free article] [PubMed] [Google Scholar]
- 57.Mashimo T, Pichumani K, Vemireddy V, Hatanpaa KJ, Singh DK, Sirasanagandla S, et al. Acetate is a bioenergetic substrate for human glioblastoma and brain metastases. Cell. 2014;159:1603–14. [DOI] [PMC free article] [PubMed] [Google Scholar]
- 58.Scalise M, Pochini L, Panni S, Pingitore P, Hedfalk K, Indiveri C. Transport mechanism and regulatory properties of the human amino acid transporter ASCT2 (SLC1A5). Amino Acids. 2014;46:2463–75. [DOI] [PubMed] [Google Scholar]
- 59.Ni J, Ramkissoon SH, Xie S, Goel S, Stover DG, Guo H, et al. Combination inhibition of PI3K and mTORC1 yields durable remissions in mice bearing orthotopic patient-derived xenografts of HER2-positive breast cancer brain metastases. Nat Med. 2016;22:723–6. [DOI] [PMC free article] [PubMed] [Google Scholar]
- 60.Shih DJH, Nayyar N, Bihun I, Dagogo-Jack I, Gill CM, Aquilanti E, et al. Genomic characterization of human brain metastases identifies drivers of metastatic lung adenocarcinoma. Nat Genet. 2020;19:1511–7. [DOI] [PMC free article] [PubMed] [Google Scholar]
- 61.Reungwetwattana T, Nakagawa K, Cho BC, Cobo M, Cho EK, Bertolini A, et al. CNS Response to Osimertinib Versus Standard Epidermal Growth Factor Receptor Tyrosine Kinase Inhibitors in Patients With Untreated EGFR-Mutated Advanced Non-Small-Cell Lung Cancer. J Clin Oncol. 2018;36:JCO2018783118–297. [DOI] [PubMed] [Google Scholar]
- 62.Tawbi HA, Forsyth PA, Algazi A, Hamid O, Hodi FS, Moschos SJ, et al. Combined Nivolumab and Ipilimumab in Melanoma Metastatic to the Brain. N Engl J Med. 2018;379:722–30. [DOI] [PMC free article] [PubMed] [Google Scholar]
- 63.Murthy RK, Loi S, Okines A, Paplomata E, Hamilton E, Hurvitz SA, et al. Tucatinib, Trastuzumab, and Capecitabine for HER2-Positive Metastatic Breast Cancer. N Engl J Med. 2020;382:597–609. [DOI] [PubMed] [Google Scholar]
- 64.Vazquez A, Tedeschi PM, Bertino JR. Overexpression of the mitochondrial folate and glycine-serine pathway: a new determinant of methotrexate selectivity in tumors. Cancer Research. 2013;73:478–82. [DOI] [PMC free article] [PubMed] [Google Scholar]
- 65.Vazquez A, Markert EK, Oltvai ZN. Serine biosynthesis with one carbon catabolism and the glycine cleavage system represents a novel pathway for ATP generation. Moreno Y, editor. PLoS ONE. 2011;6:e25881. [DOI] [PMC free article] [PubMed] [Google Scholar]
- 66.Tedeschi PM, Markert EK, Gounder M, Lin H, Dvorzhinski D, Dolfi SC, et al. Contribution of serine, folate and glycine metabolism to the ATP, NADPH and purine requirements of cancer cells. Cell Death Dis. 2013;4:e877–7. [DOI] [PMC free article] [PubMed] [Google Scholar]
- 67.Nikiforov MA, Chandriani S, O’Connell B, Petrenko O, Kotenko I, Beavis A, et al. A functional screen for Myc-responsive genes reveals serine hydroxymethyltransferase, a major source of the one-carbon unit for cell metabolism. Mol Cell Biol. 2002;22:5793–800. [DOI] [PMC free article] [PubMed] [Google Scholar]
- 68.Sun L, Song L, Wan Q, Wu G, Li X, Wang Y, et al. cMyc-mediated activation of serine biosynthesis pathway is critical for cancer progression under nutrient deprivation conditions. Cell Res. 2015;25:429–44. [DOI] [PMC free article] [PubMed] [Google Scholar]
- 69.Morrish F, Isern N, Sadilek M, Jeffrey M, Hockenbery DM. c-Myc activates multiple metabolic networks to generate substrates for cell-cycle entry. Oncogene. 2009;28:2485–91. [DOI] [PMC free article] [PubMed] [Google Scholar]
- 70.Ducker GS, Ghergurovich JM, Mainolfi N, Suri V, Jeong SK, Hsin-Jung Li S, et al. Human SHMT inhibitors reveal defective glycine import as a targetable metabolic vulnerability of diffuse large B-cell lymphoma. Proc Natl Acad Sci USA. 2017;114:11404–9. [DOI] [PMC free article] [PubMed] [Google Scholar]
- 71.Dekhne AS, Ning C, Nayeen MJ, Shah K, Kalpage H, Frühauf J, et al. Cellular Pharmacodynamics of a Novel Pyrrolo[3,2-d]pyrimidine Inhibitor Targeting Mitochondrial and Cytosolic One-Carbon Metabolism. Mol Pharmacol. 2020;97:9–22. [DOI] [PMC free article] [PubMed] [Google Scholar]
- 72.Vandekeere S, Dubois C, Kalucka J, Sullivan MR, García-Caballero M, Goveia J, et al. Serine Synthesis via PHGDH Is Essential for Heme Production in Endothelial Cells. Cell Metab. 2018;28:573–587.e13. [DOI] [PubMed] [Google Scholar]
- 73.Kurniawan H, Franchina DG, Guerra L, Bonetti L, Baguet LS, Grusdat M, et al. Glutathione Restricts Serine Metabolism to Preserve Regulatory T Cell Function. Cell Metab. 2020;31:920–7. [DOI] [PMC free article] [PubMed] [Google Scholar]
- 74.Le Douce J, Maugard M, Veran J, Matos M, Jégo P, Vigneron P-A, et al. Impairment of Glycolysis-Derived l-Serine Production in Astrocytes Contributes to Cognitive Deficits in Alzheimer’s Disease. Cell Metab. 2020;31:503–8. [DOI] [PubMed] [Google Scholar]
- 75.Ma EH, Bantug G, Griss T, Condotta S, Johnson RM, Samborska B, et al. Serine Is an Essential Metabolite for Effector T Cell Expansion. Cell Metab. 2017;25:345–57. [DOI] [PubMed] [Google Scholar]
- 76.Kang YP, Falzone A, Liu M, Saller JJ, Karreth FA, DeNicola GM. PHGDH supports liver ceramide synthesis and sustains lipid homeostasis. bioRxiv. Cold Spring Harbor Laboratory; 2019;1:861–43. [DOI] [PMC free article] [PubMed] [Google Scholar]
- 77.Kulak NA, Pichler G, Paron I, Nagaraj N, Mann M. Minimal, encapsulated proteomic-sample processing applied to copy-number estimation in eukaryotic cells. Nat Methods. 2014;11:319–24. [DOI] [PubMed] [Google Scholar]
- 78.Kelstrup CD, Jersie-Christensen RR, Batth TS, Arrey TN, Kuehn A, Kellmann M, et al. Rapid and deep proteomes by faster sequencing on a benchtop quadrupole ultra-high-field Orbitrap mass spectrometer. J Proteome Res. 2014;13:6187–95. [DOI] [PubMed] [Google Scholar]
- 79.Scheltema RA, Hauschild J- P, Lange O, Hornburg D, Denisov E, Damoc E, et al. The Q Exactive HF, a Benchtop mass spectrometer with a pre-filter, high-performance quadrupole and an ultra-high-field Orbitrap analyzer. Mol Cell Proteomics. 2014;13:3698–708. [DOI] [PMC free article] [PubMed] [Google Scholar]
- 80.Cox J, Mann M. MaxQuant enables high peptide identification rates, individualized p.p.b.-range mass accuracies and proteome-wide protein quantification. Nat Biotechnol. 2008;26:1367–72. [DOI] [PubMed] [Google Scholar]
- 81.Cho K, Mahieu N, Ivanisevic J, Uritboonthai W, Chen Y- J, Siuzdak G, et al. isoMETLIN: a database for isotope-based metabolomics. Anal Chem. 2014;86:9358–61. [DOI] [PMC free article] [PubMed] [Google Scholar]
- 82.Parker SJ, Svensson RU, Divakaruni AS, Lefebvre AE, Murphy AN, Shaw RJ, et al. LKB1 promotes metabolic flexibility in response to energy stress. Metab Eng. 2017;43:208–17. [DOI] [PMC free article] [PubMed] [Google Scholar]
- 83.Wenig P, Odermatt J. OpenChrom: a cross-platform open source software for the mass spectrometric analysis of chromatographic data. BMC Bioinformatics. 2010;11:405–9. [DOI] [PMC free article] [PubMed] [Google Scholar]
- 84.Fernandez CA, Rosiers Des C, Previs SF, David F, Brunengraber H. Correction of 13C mass isotopomer distributions for natural stable isotope abundance. J Mass Spectrom. 1996;31:255–62. [DOI] [PubMed] [Google Scholar]
- 85.Lewis CA, Parker SJ, Fiske BP, McCloskey D, Gui DY, Green CR, et al. Tracing compartmentalized NADPH metabolism in the cytosol and mitochondria of mammalian cells. Mol Cell. 2014;55:253–63. [DOI] [PMC free article] [PubMed] [Google Scholar]
- 86.Kodack DP, Chung E, Yamashita H, Incio J, Duyverman AMMJ, Song Y, et al. Combined targeting of HER2 and VEGFR2 for effective treatment of HER2-amplified breast cancer brain metastases. Proc Natl Acad Sci USA. 2012;109:E3119–27. [DOI] [PMC free article] [PubMed] [Google Scholar]
- 87.Yu M, Bardia A, Aceto N, Bersani F, Madden MW, Donaldson MC, et al. Cancer therapy. Ex vivo culture of circulating breast tumor cells for individualized testing of drug susceptibility. Science. 2014;345:216–20. [DOI] [PMC free article] [PubMed] [Google Scholar]
- 88.Klotz R, Thomas A, Teng T, Han SM, Iriondo O, Li L, et al. Circulating Tumor Cells Exhibit Metastatic Tropism and Reveal Brain Metastasis Drivers. Cancer Discov. 2020;10:86–103. [DOI] [PMC free article] [PubMed] [Google Scholar]
- 89.Dong Y, Eskandari R, Ray C, Granlund KL, Santos-Cunha LD, Miloushev VZ, et al. Hyperpolarized MRI Visualizes Warburg Effects and Predicts Treatment Response to mTOR Inhibitors in Patient-Derived ccRCC Xenograft Models. Cancer Research. 2019;79:242–50. [DOI] [PMC free article] [PubMed] [Google Scholar]
- 90.Harris T, Eliyahu G, Frydman L, Degani H. Kinetics of hyperpolarized 13C1-pyruvate transport and metabolism in living human breast cancer cells. Proc Natl Acad Sci USA. 2009;106:18131–6. [DOI] [PMC free article] [PubMed] [Google Scholar]
- 91.Granlund KL, Tee SS, Vargas HA, Lyashchenko SK, Reznik E, Fine S, et al. Hyperpolarized MRI of Human Prostate Cancer Reveals Increased Lactate with Tumor Grade Driven by Monocarboxylate Transporter 1. Cell Metab. 2020;31:105–114.e3. [DOI] [PMC free article] [PubMed] [Google Scholar]
- 92.Crane JC, Gordon JW, Chen H-Y, Autry AW, Li Y, Olson MP, et al. Hyperpolarized 13 C MRI data acquisition and analysis in prostate and brain at University of California, San Francisco. NMR Biomed. 2020;100:e4280. [DOI] [PMC free article] [PubMed] [Google Scholar]
- 93.Tee SS, DiGialleonardo V, Eskandari R, Jeong S, Granlund KL, Miloushev V, et al. Sampling Hyperpolarized Molecules Utilizing a 1 Tesla Permanent Magnetic Field. Sci Rep. 2016;6:32846–6. [DOI] [PMC free article] [PubMed] [Google Scholar]
Associated Data
This section collects any data citations, data availability statements, or supplementary materials included in this article.