

Abstract
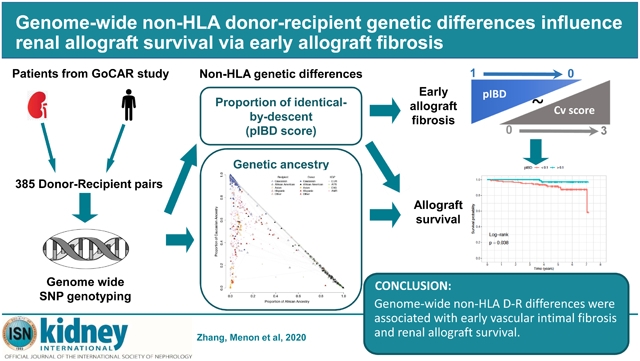
Donor-recipient (D-R) differences at human leukocyte antigen (HLA) loci are currently incorporated into organ sharing, allocation and immunosuppression decisions. However, while acute rejection episodes have substantially diminished, progressive histologic damage occurs in allografts and improved long-term survival remains an unrealized goal among kidney recipients. Here we tested the hypothesis that non-HLA dependent, genome-wide D-R genetic differences could contribute to unchecked alloimmunity with histologic and functional consequences, culminating in long-term allograft failure. Genome-wide single nucleotide polymorphism (SNP) array data, excluding the HLA region, was utilized from 385 transplants to study the role of D-R differences upon serial histology and allograft survival. ADMIXTURE analysis was performed to quantitatively estimate ancestry in each D-R pair and PLINK was used to estimate the proportion of genome-shared identity-by descent (pIBD) between D-R pairs. Subsequently, quantitative measures of recipient ancestry based on non-HLA SNPs was associated with death-censored allograft survival in adjusted Cox models. In D-R pairs of similar ancestry, pIBD was significantly associated with allograft survival independent of HLA mismatches in 224 transplants. Surprisingly, pIBD and recipient ancestry were not associated with clinical or subclinical rejection at any time post-transplant. Significantly, in multivariable analysis, pIBD inversely correlated with vascular intimal fibrosis in 160 biopsies obtained less than one year which in turn was significantly associated with allograft survival. Thus, our novel data show that non-HLA D-R differences associate with early vascular intimal fibrosis and allograft survival.
Keywords: Kidney transplantation, allograft survival, genetic ancestry, identity by descent
Graphical Abstract
Introduction
Kidney transplantation is the most common solid organ transplant in the US with near 20,000 transplants performed in 2017. Modern immunosuppressive strategies have had significant impact on short-term allograft outcomes including rates of acute rejection, without a proportionate observed improvement in long-term allograft outcomes.1 In kidney transplantation, nearly half of all allograft loss is ascribable to distinct etiologies. However, a common histological entity, allograft fibrosis or interstitial fibrosis and tubular atrophy (IF/TA) of unclear etiology accounted for 30-40% of cases of allograft loss in large studies.2, 3 Novel transcriptomic data that specifically interrogated gene expression profiles from this histological entity surprisingly revealed nearly 80% overlap between IF/TA and acute rejection by gene co-expression analysis, relaying a key role for allo-immune mechanisms in IF/TA.4
Allo-immune responses that contribute to allograft damage arise when an adaptive immune response is triggered by the cognate interaction between an major histocompatibility complex (MHC) molecule presenting a donor peptide to its T-cell receptor, i.e., indirect pathway of non-self recognition.5 Adaptive allo-responses are also triggered by the direct and semi-direct pathways of allo-recognition.6 At the genetic level, these processes are largely determined by the human leukocyte antigen (HLA) region of the donor-recipient (D-R) pair. However, aside from this, innate immune cells have recently been shown to have allo- or “non-self” recognition capacities.7, 8 Non-self recognition via innate immune mechanisms was shown to be independent of HLA. These data suggest that unchecked ongoing allo-immune damage may occur in IF/TA and result in allograft loss, and that non-HLA regions within D-R genomes may be important determinants of such allo-responses. A genome-wide, unbiased exploration of DR differences that may impact renal transplant survival has not been undertaken before. It is also unknown whether D-R differences at non-HLA regions may confer greater or additive impact to HLA matching in the current era.
We recently completed the genomics of chronic allograft rejection study (GoCAR).9, 10 Genome-wide SNP array data with phenotype data was available from this large, prospectively followed cohort of kidney D-R pairs. We systematically analyzed the genome-wide genotype data with 1000 Genomes Project11 data as reference panel to quantify individual-level genetic ancestry of donors and recipients, as well as genetic relatedness of D-R pairs. By correlating these genetic measurements with allograft outcomes in our patient cohort (GoCAR), we identified for the first time that genetic ancestry and that “donor-to-recipient genetic distance” were orthogonally associated with specific histologic lesions and long-term allograft survival, independent of HLA loci.
Results
Genomics of Chronic Allograft Rejection (GoCAR) study
The GoCAR study was a prospective, multicenter study. Enrolled patients had clinical data, longitudinal blood draws and serial surveillance biopsies at 0, 3, 12 and 24 months (see Methods). Details of GoCAR enrollees, biopsy analysis and reports from central core have been detailed elsewhere.9, 10
Among enrollees of the parent GoCAR study, genome-wide genotype data was available for a total of 385 D-R pairs, i.e. the study cohort (see Methods; Figure S1). Clinical-epidemiologic characteristics of patients are summarized in Table 1. The median follow-up time was 4.9 years (IQR: 3.8 ~ 6.0 years). Maintenance immunosuppression in the study cohort was homogenous, 97.4% of the 385 D-R pairs on mycophenolate Mofetil or Mycophenolic acid, 91.2% on Tacrolimus, and 81.5% on maintenance prednisone. After quality control, linkage disequilibrium based pruning, and excluding SNPs in MHC region (see Methods), there remained a total of 131,035 SNPs, which were used for the inference of genetic ancestry and inter-personal relatedness.
Table 1.
Demographic and clinicopathologic characteristics of GoCAR donors and recipients in this study.
| Variable | D-R pairs with genotype (n = 385)a |
D-R pairs with biopsies (n = 160)b |
p-valuec |
|---|---|---|---|
| Recipient | |||
| Death censored graft loss (years) | |||
| mean ± SD; median (range) | 4.64 ± 1.68; 4.88 (0.04, 7.28) | 4.42 ± 1.75; 4.61 (0.24, 7.28) | 0.17 |
| # events (%) | 50 (13.0%) | 22 (13.8%) | 0.78 |
| TCMR (years), mean ± SD, median (range) | 1.52 ± 1.16; 1.55 (0, 6.17) | 1.43 ± 1.48; 1.01 (0, 6.17) | 0.47 |
| TCMR >= borderline, # events (%) | 126 (32.7%) | 77 (48.1%) | <0.01 |
| TCMR > borderline, # events (%) | 36 (9.4%) | 25 (15.6%) | 0.04 |
| Recurrent TCMR >= borderline, # events (%) | 59 (15.3%) | 42 (26.3%) | <0.01 |
| Recurrent TCMR > borderline, # events (%) | 25 (6.5%) | 18 (11.3%) | 0.08 |
| Age (years), mean ± SD; median (range) | 50 ± 14; 50 (18, 83) | 49 ± 13; 49 (19, 73) | 0.41 |
| Gender, male, n (%) | 257 (66.8%) | 113 (70.6%) | 0.42 |
| Self-reported race, n (%) | 0.87 | ||
| African American | 73 (19.0%) | 29 (18.1%) | |
| Asian | 25 (6.5%) | 10 (6.3%) | |
| Caucasian | 251 (65.2%) | 104 (65.0%) | |
| Hispanic | 22 (5.7%) | 8 (5.0%) | |
| Other/Unreported | 14 (3.6%) | 9 (5.6%) | |
| Center, n (%) | <0.01 | ||
| Icahn School of Medicine at Mount Sinai | 100 (26.0%) | 43 (26.9%) | |
| Northwestern University | 68 (17.7%) | 5 (3.1%) | |
| University of Michigan | 54 (14.0%) | 27 (16.9%) | |
| University of Wisconsin, Madison | 62 (16.1%) | 14 (8.8%) | |
| University of Sydney | 101 (26.2%) | 71 (44.4%) | |
| HLA mismatch scored, n (%) | 0.52 | ||
| 0 | 39 (10.1%) | 20 (12.5%) | |
| 1 | 54 (14.0%) | 24 (15.0%) | |
| 2 | 145 (37.7%) | 65 (40.6%) | |
| 3 | 147 (38.2%) | 51 (31.9%) | |
| Induction, n (%) | <0.01 | ||
| No induction | 78 (20.3%) | 49 (30.6%) | |
| Non-depletional (IL2 antagonist) | 130 (33.8%) | 61 (38.1%) | |
| Depletional (Thymoglobulin or Campath) | 177 (46.0%) | 50 (31.3%) | |
| Anti-HLA antibodye, presence, n (%) | 122 (31.7%) | 58 (36.3%) | 0.22 |
| Antibody mediate rejection (ABMR), n (%) | 17 (4.4%) | 11 (6.9%) | 0.29 |
| Donor | |||
| Age (years), mean ± SD; median (range) | 43 ± 15; 45 (3, 73) | 43 ± 15; 45 (9, 73) | 0.41 |
| Gender, male, n (%) | 196 (50.9%) | 81 (50.6%) | 1.00 |
| Self-reported race, n (%) | 0.61 | ||
| African American | 38 (9.9%) | 15 (9.4%) | |
| Asian | 9 (2.3%) | 6 (3.8%) | |
| Caucasian | 296 (76.9%) | 127 (79.4%) | |
| Hispanic | 29 (7.5%) | 7 (4.4%) | |
| Other/Unreported | 13 (3.4%) | 5 (3.1%) | |
| Donor type, live donor, n (%) | 194 (50.4%) | 72 (45.0%) | 0.26 |
| CITf (hours), mean ± SD; median (range) | 15.6 ± 8.0; 13.5 (0.3, 40.8) | 14.5 ± 7.8; 11.6 (4.0, 40.8) | 0.30 |
Genome-wide genotype data is available for 385 donor-recipient (D-R) pairs from the parent GoCAR study.
The subset (n = 160 D-R pairs) of the genotyped D-R cohort with biopsies at pre-transplantation and within 1 year post transplantation available for evaluating Banff subscores.
p-value was calculated from unpaired t-test for continuous variables and from Fisher’s exact test for categorical variables.
HLA mismatch score was derived from 2-digit HLA allele typing. The mismatch score was categorized into: 0 (no mismatches), 1 (1-2 mismatches), 2 (3-4 mismatches), and 3 (5-6 mismatches).
The information was reported for 375 of the 385 recipients in genotyped D-R pairs and 151 of the 160 recipients in the subset with biopsies.
Cold ischemia time for deceased donors.
Among the study cohort, a subset of 160 D-R pairs had pre-implantation biopsy and at least one biopsy within the first year post transplantation available for evaluating Banff subscores. There was no significant difference in the distribution of most risk factors between the study cohort and the biopsy subset (Table 1).
Characterization of genetic differences for donor-recipient pairs
In our analyses, besides self-reported race, we applied the following metrics to further characterize genetic differences within donor-recipient pairs: (1) genetic ancestry; (2) identity-by-descent (IBD); (3) HLA matching.
Genetic ancestry.
While the self-reported race for donors and recipients was available (Table 1; Figure 1A), we applied ADMIXTURE12 utilizing 1000 Genomes Project (KGP) data11 to quantify ancestral proportions of our study cohort and define “genetic ancestry” (see Methods; Table S1; Figures 1B, S2, and S3). By comparing self-reported race and genetic ancestry, we identified that self-reported race was inaccurate in 39 (10.1%) donors and 49 (12.7%) recipients (Figure 1B; Table S2). Using genetic ancestry data, there were 102 (26.5%) inter-race and 283 (73.5%) intra-race transplantations in our study cohort, among which 224 (79.1%) were Caucasian-to-Caucasian (C-to-C) D-R pairs (Table S2).
Figure 1. Genetic ancestry of 1000 Genomes Project samples and GoCAR donors and recipients.

(A) Samples from 1000 Genomes Project (KGP) with different ethnicities anchor the location of continental-level ancestries on the space spanned by estimated proportions of African and Caucasian ancestries. GoCAR donors (solid triangle) and recipients (empty triangle) are projected onto the same space and colored based on self-reported race. Donor-recipient pairs are connected by dashed lines. KGP: 1000 Genomes Project; EUR: European; AFR: African; EAS: East Asian; AMR: American. (B) The ancestral composition of each individual in KGP and GoCAR. Each vertical bar represents an individual. The length of colored segments within each bar indicates the estimated proportion of different genetic ancestries. The description of population codes for KGP is shown in Table S1. The ticks under lower panel indicates self-reported race with the same color code in legend of (A).
To further characterize ancestry in a quantitative manner, we mapped all D-R pairs (including admixed populations) onto the 2-D space defined numerically by proportion of African (pAFR) and Caucasian (pEUR) ancestry, which served as “quantitative ancestry” (Figure 1A). pAFR and pEUR accounted for the majority of genetic variability (Figure S2).
Identity-by-descent (IBD).
To quantify the genetic relatedness between donors and recipients in any given D-R pair, irrespective of whether inter-race or intra-race transplants, we adopted the proportion of genome-shared identity-by-descent (pIBD)13, 14 as a measure of inter-personal relatedness (see Methods).
We excluded SNP information from HLA region in pIBD calculations (see Methods). A pIBD value close to 1 corresponds to monozygotic twins. pIBD around 0.5 suggests first-degree relatives, a value around 0.25 second-degree relatives, and so on, while pIBD < 0.1 signifies latent relatedness further than third degree. pIBD provided additional information to genetic ancestry at genome-wide level (Figure S4). For example, Caucasian-to-Caucasian D-R pairs were expected to have high pEUR and low pAFR and were not distinguishable with ancestral information alone (Figure 1A; Figure S4), while they could have various degrees of relatedness reflected by distinct pIBD (Figure S4). In the study cohort, the living donors (LDs) generally had varying degree of kinship with recipients, while deceased donors (DDs) were generally unrelated to recipients with a limited range of pIBD (Figures S4).
HLA matching.
To quantify the mismatch at HLA loci, we defined a 4-level HLA mismatch score based on 2-digit HLA genotype (see methods). D-R pairs with LDs tended to have better HLA matching (smaller HLA mismatch score) than those with DDs (Figure S5A). The distribution of HLA mismatch score was summarized for each combination of genetic ancestries of D-R pairs, among which C-to-C D-R pairs showed better HLA matching (Figure S5B).
Therefore, here, we characterized HLA mismatching as well as non-HLA genetic differences between D-R pairs utilizing genome-wide SNP array data by genetic ancestry and pIBD, which offer complementary genetic information.
Evaluation of genetic risk factors for long-term allograft survival
Here, we evaluated the association of clinical risk factors, and D-R genetic differences (as above), with death-censored allograft loss (DCAL). As Table S3 illustrates, known risk factors, such as deceased donor and induction therapy, were associated with DCAL in univariate Cox regression analysis. Both genetic ancestry and quantitative ancestry (pAFR and pEUR) were associated with DCAL. The hazard ratios (HRs) of pAFR and pEUR were in opposing directions, as pAFR and pEUR are highly inversely correlated (r = −0.8; p < 2.2×10⁻¹⁶; Figure 1A). Further, the association of pAFR (pEUR) with DCAL was considerably more significant for recipients than donors in our study cohort. Finally, among metrics incorporating D-R genetic data, pIBD based on non-HLA mismatches had a stronger association with DCAL than the HLA mismatch score. In summary, the three genetic risk factors, including genetic ancestry, pIBD and HLA mismatch score, were associated with DCAL in unadjusted analysis.
pIBD was associated with long-term allograft survival
As depicted in Figure 1A and Figure S4, D-R differences that may exist within intra-ethnicity transplants were not captured by donor and recipient pAFR. To quantify the association of genetic relatedness in any given D-R pair with DCAL, irrespective of ancestry, we examined pIBD as a predictor for DCAL in multivariable Cox models. pIBD was inversely associated with DCAL, while HLA mismatch score had no significant association (Table 2A).
Table 2.
Association of pIBD with death-censored allograft survival with multivariable Cox regression.
| Variable | HR | 95% CI | p-value |
|---|---|---|---|
| (A) All D-R pairs (n = 385; 50 (13.0%) graft loss events) | |||
| Donor pAFR | 1.29 | (0.49, 3.39) | 0.61 |
| Recipient pAFR | 2.26 | (0.99, 5.18) | 0.05 |
| Induction (ref: No) | |||
| Non-depletional | 2.10 | (0.68, 6.46) | 0.19 |
| Depletional | 2.76 | (0.91, 8.39) | 0.07 |
| HLA mismatch score | 1.03 | (0.72, 1.46) | 0.89 |
| Proportion of IBD | 0.07 | (0.01, 0.66) | 0.02 |
| (B) Caucasian-to-Caucasian D-R pairs (n = 224; 17 (7.6%) graft loss events) | |||
| Induction (ref: No) | |||
| Non-depletional | 1.73 | (0.46, 6.56) | 0.42 |
| Depletional | 2.36 | (0.57, 9.74) | 0.24 |
| HLA mismatch score | 0.71 | (0.42, 1.21) | 0.21 |
| Proportion of IBD | 0.03 | (0.001, 0.79) | 0.04 |
Sensitivity analyses:
Since the study cohort was dominated by C-to-C transplants (Table S2; Figure S6), we utilized pIBD to examine the association of D-R genome-wide differences with DCAL among C-to-C transplants. The pIBD was observed to be the only risk factor, significantly associated with DCAL in multivariable Cox regression (Table 2B). We then dichotomized C-to-C D-R pairs into two groups – one group with at least third degree relatedness (pIBD > 0.1) and another with latent relatedness (pIBD < 0.1) (Figure 2A). Here, D-R pairs with pIBD>0.1 had significantly better long-term allograft survival than those with pIBD<0.1 (log-rank test p = 0.04) (Figure 2B). In comparison, although HLA mismatch score was highly correlated with pIBD (Figure 2C; ANOVA p-value = 1.97×10⁻¹⁰), it had no significant independent effects on DCAL in C-to-C transplants (Table 2B; Figure 2D). Notably, pIBD could be distinct for C-to-C D-R pairs with similar HLA mismatch score (Figure 2C).
Figure 2. pIBD and HLA mismatch score in Caucasian-to-Caucasian D-R pairs and their association with allograft survival.

(A) Histogram of proportion of IBD (pIBD). D-R pairs with pIBD > 0.1 approximately have at least third-degree relatedness. (B) Kaplan-Meier plot of death censored allograft survival for two groups of D-R pairs with pIBD > 0.1 and pIBD < 0.1. The log-rank test p-value = 0.038. (C) Boxplot of pIBD grouped by HLA mismatch score. (D) Kaplan-Meier plot of death censored allograft survival for groups corresponding to different HLA mismatch scores. The log-rank test p-value = 0.51.
Stratified analyses:
Donor type was highly correlated with pIBD (Mann-Whitney p-value < 1×10⁻¹¹) in the study cohort and C-to-C D-Rs due to marked differences in the distribution of pIBD values in deceased and living donor subgroups (Figures S7A and S8A). Therefore, we assessed donor type as a confounder in the association between pIBD and DCAL by (a) adjusted analyses (Table S4) and (b) stratified analyses for deceased and living donor sub-cohorts (Tables S5 and S6; Figures S7 and S8). pIBD was evaluated as both continuous and categorical variables in these analyses. As expected, the confounding effect was more severe in all D-Rs than C-to-C D-Rs due to the heterogeneity of genetic ancestry in the study cohort (Tables S4-6), while in C-to-C D-Rs the association of pIBD reached marginal significance (Tables S4). Further, among C-to-C D-R pairs stratified by deceased (DD; n = 90) and living (LD; n = 134) donors, the LD stratum had distribution of pIBD values similar to the whole C-to-C transplant set, whereas only latent relatedness (pIBD < 0.1) was revealed for DD stratum i.e. there were no related D-R pairs among DD transplants (Figures S7 and S8; Table S6). D-R pairs with larger pIBD tended to have significantly better allograft survival among LD transplants (log-rank test p-value = 0.05), similar to the whole C-to-C transplant set. Hence non-HLA genetic relatedness between D-Rs measured by pIBD was associated with DCAL, especially among C-to-C D-Rs.
pIBD was not associated with clinical/subclinical TCMR
Since alloimmunity is recognized as a major mediator of long-term allograft loss, we examined the effects of pIBD on the outcome of acute rejection. The GoCAR cohort is uniquely positioned to examine both clinical and subclinical acute rejection owing to serially collected surveillance biopsies. In our study cohort, T-cell mediated rejection (TCMR; Suspicious/Banff 1A or greater) at any time, or recurrent TCMR (i.e. ≥ 2 biopsies showing TCMR) were both associated with decreased long-term allograft survival in Cox regression (Table S7). To define “no rejection” (NTCMR), we used genotyped patients with no TCMR (or borderline TCMR) on obtained biopsies at anytime, and/or no reported biopsies during follow up.
To identify whether TCMR phenotypes were a mediator of the effect of pIBD on DCAL, we examined the association of quantitative ancestry variables and pIBD with DCAL in Cox models conditional on TCMR, respectively, for all and C-to-C D-R pairs (Tables S8). Among all D-R pairs, clinical covariates, as well as pIBD and recipient pAFR remained significant, independent of TCMR variables, with similar trend among C-to-C D-Rs (Table S8). Further, pIBD and recipient pAFR, which were predictive of DCAL, were not associated with TCMR (Table S9). Thus, clinical or subclinical TCMR phenotypes were not associated with D-R differences reflected by pIBD.
pIBD and anti-donor antibodies
We examined the development of post-transplant humoral immunity, i.e. anti-HLA de novo donor specific antibodies (dnDSA) at any time post transplant in the study cohort. A total of 24/385 (6.2%) developed dnDSA during follow up. While HLA mismatch score was associated with detectable dnDSA (Chi-square trend P<0.001), pIBD was not associated with dnDSA (4 (3.81%) vs. 20 (7.12%) in pIBD<0.1 vs. pIBD>0.1 groups; Fisher’s P=0.38). Since global D-R mismatches could give rise to non-HLA DSA, many of whose targets are yet unknown, we specifically examined anti-AT1R antibodies15 in D-Rs with extreme pIBDs among Caucasian-to-Caucasian (C-to-C) D-R pairs to minimize heterogeneity. Since among deceased donor (DD) D-R pairs no high pIBD was identified, we examined living donor (LD) D-R pairs only. We assayed 10 recipient serum samples respectively from C-to-C LD D-Rs with low pIBD (<0.1) vs 10 serum samples from high pIBD (>0.5) for AT1R antibodies at 24 months after transplantation. AT1R assay categorized results (<10, 10-40, >40 U/ml) grouped by high pIBD vs low pIBD are shown in Figure 3A and Table S10. As shown 70% of low pIBD samples had positive AT1R assay vs. 30% of high pIBD samples (Chi-square p-value = 0.06). We also quantified the total number of SNP-wise mismatches (see Methods) at the AGTR1 gene locus between each D-R pair where we had assayed AT1R antibodies. D-R mismatches at AT1R gene locus were significantly higher in low pIBD group vs high pIBD group (Mann-Whitney P<0.01; Figure 3B, Table S10). These data suggest pIBD correlate with individual gene locus mismatches. Such gene locus mismatches may be associated with development of specific non-HLA DSA.
Figure 3. Non-HLA antibodies and SNP-wise mismatches at AT1R gene locus.

(A) Anti-AT1R non-HLA antibodies among low pIBD (< 0.1) and high pIBD (> 0.5) transplants. At a dilution of 1:100, “positive” assay is a value of >10 U/ml, and the upper limit of detection is 40 U/ml. The titers were categorized into 3 groups <10 U/ml, 10-40 U/ml, and >40 U/ml. (B) The total number of SNP-wise mismatches at AT1R gene locus compared between low and high pIBD D-R pairs.
pIBD was associated with vascular intimal fibrosis (Cv) lesions and not allograft inflammation
To examine the association of pIBD with allograft histology, we examined correlations of pIBD with serially obtained allograft biopsies. GoCAR enrollees had surveillance biopsies performed at 3-month, 12-month, and 24-month visits, as well as biopsies performed for clinical indications during follow up. Among the study cohort, 203 had at least 1 biopsy before the 12-month visit (145 three-month surveillance biopsies and 58 indication biopsies) reported for Banff scores by a central core lab.10 We examined the association of pIBD with inflammatory component (i+t score), fibrosis/tubular atrophy (Ci+Ct score), and vascular damage (Cv score) on sequential allograft biopsies. As reflected by the lack of association of pIBD with TCMR phenotypes, i+t scores showed no significant association with pIBD at any time point (3-month univariate associations with Banff scores are depicted in Figure S9A-C).
Most interestingly, pIBD was inversely correlated with vascular intimal fibrosis lesions (Cv score) at 3 months (Figure 4A). Similar trends were observed in all, LD, C-to-C, and C-to-C LD transplants (Figure 4B). Since vascular intimal fibrosis lesions are presumed irreversible, we summarized Cv score in all early biopsies (clinical or surveillance) taken before the 12-month visit (highest year-1 Cv score; n=203). pIBD was also inversely correlated with highest year-1 Cv score (Figure 4C).
Figure 4. Correlation of pIBD with Banff component scores.

Line graphs show correlation of pIBD with Cv-score at 3 months in all D-R pairs (A) and pIBD with highest year-1 Cv score (C). The correlation between highest year-1 Ci+Ct score and highest year-1 Cv score is shown in (D). Dot plots in (B) compare Cv scores at 3 months of D-R pairs with pIBD<0.1 vs. >0.1, and further stratified into LD, C-to-C, and C-to-C LD transplants. Error bars show Mean ± SEM. LD: living donor; C-to-C: Caucasian-to-Caucasian.
In multivariable ordinal logistic regression models including pre-implantation Cv scores (to adjust for donor-derived vascular fibrosis), which reduced the sample size for highest year-1 Cv score to 160 (Table 3), pIBD remained associated with highest year-1 Cv score (Table 3A). These results were consistent when LD and C-to-C transplants were analyzed alone. Low pIBD scores (<0.1) remained significantly associated with higher year-1 Cv scores in the multivariable models vs. high pIBD scores (>0.1) (Table S11). When biopsies after the first year were tallied, progressively diminished correlation between Cv score and pIBD was seen (Figure S9D), which suggests an association of pIBD with early allograft histology.
Table 3.
pIBD independently predicts highest year-1 Cv score in multivariable ordinal logistical regression.
| Variable | All allografts (n = 160) |
LD allografts (n = 72) |
C-to-C allografts (n = 93) |
||||||
|---|---|---|---|---|---|---|---|---|---|
| OR | 95% CI | P-value | OR | 95% CI | P-value | OR | 95% CI | P-value | |
| (A) Outcome: Highest year-1 Cv score | |||||||||
| pIBD | 0.01 | (0.00, 0.16) | 0.005 | 0.01 | (0.00, 0.59) | 0.04 | 0.02 | (0.00, 0.52) | 0.03 |
| Recipient pAFR | 0.34 | (0.07, 1.41) | 0.16 | 0.03 | (0.00, 1.55) | 0.17 | - | - | - |
| Donor pAFR | 5.51 | (0.93, 30.5) | 0.05 | 13.7 | (0.15, 1.23×10³) | 0.23 | - | - | - |
| HLA mismatch score | 0.75 | (0.47, 1.19) | 0.21 | 1.15 | (0.49, 2.98) | 0.76 | 0.89 | (0.45, 1.81) | 0.74 |
| Recipient age | 0.98 | (0.94, 1.02) | 0.37 | 0.99 | (0.91, 1.06) | 0.73 | 1.00 | (0.94, 1.06) | 0.88 |
| Donor age | 1.04 | (1.00, 1.09) | 0.04 | 1.06 | (0.97, 1.16) | 0.20 | 1.05 | (0.99, 1.11) | 0.12 |
| Pre-implant Cv score | 0.45 | (0.16, 1.04) | 0.09 | 0.58 | (0.12, 2.09) | 0.44 | 0.19 | (0.02, 0.87) | 0.09 |
| Highest year-1 Ci+Ct score | 1.40 | (0.93, 2.12) | 0.10 | 1.20 | (0.52, 2.67) | 0.66 | 1.58 | (0.83, 3.06) | 0.17 |
| (B) Outcome: Highest year-1 Ci+Ct score | |||||||||
| pIBD | 0.31 | (0.05, 1.73) | 0.19 | 0.11 | (0.01, 1.13) | 0.07 | 0.36 | (0.04, 3.02) | 0.35 |
| Recipient pAFR | 2.57 | (0.89, 7.54) | 0.08 | 3.07 | (0.11, 179.6) | 0.52 | - | - | - |
| Donor pAFR | 0.19 | (0.03, 0.84) | 0.04 | 0.00 | (0.00, 0.47) | 0.07 | - | - | - |
| HLA mismatch score | 0.79 | (0.56, 1.12) | 0.18 | 0.59 | (0.32, 1.08) | 0.09 | 0.59 | (0.36, 0.94) | 0.03 |
| Recipient age | 1.01 | (0.98, 1.03) | 0.67 | 1.02 | (0.99, 1.06) | 0.19 | 1.01 | (0.97, 1.04) | 0.73 |
| Donor age | 1.03 | (1.00, 1.06) | 0.03 | 1.03 | (0.99, 1.08) | 0.19 | 1.03 | (1.00, 1.07) | 0.08 |
| Pre-implant Ci+Ct score | 1.40 | (1.00, 1.97) | 0.05 | 1.43 | (0.67, 3.07) | 0.35 | 1.24 | (0.73, 2.08) | 0.42 |
| Highest year-1 Cv score | 1.61 | (1.04, 2.53) | 0.03 | 0.83 | (0.32, 1.98) | 0.68 | 1.53 | (0.80, 3.03) | 0.20 |
Ci+Ct score (or IF/TA) and Cv score were correlated with each other in allografts at all time points (Figure 4D), and reflect cumulative allograft injury. However, pIBD was not significantly associated with highest year-1 Ci+Ct score in ordinal logistic models (Table 3B). Finally, highest year-1 Cv score was associated with DCAL independent of Ci+Ct score (Table S12), suggesting that Cv score added independent information relevant to allograft survival in the study cohort.
Together, these data suggest that the association of global non-HLA D-R differences reflected by pIBD with allograft survival may be mediated by early chronic allograft injury specifically vascular intimal fibrosis.
Discussion
Using genome-wide SNP array data on D-R pairs from our prospective, extensively phenotyped GoCAR cohort, we show here that non-HLA D-R differences significantly associate with long-term allograft survival in renal transplantation. While organ allocation focuses on the HLA region in the current era, our novel data suggests that non-HLA regions may have greater relevance to allograft survival than HLA-match levels in our cohort. The “quantitative genetic ancestry” estimated with ADMIXTURE, recipient pAFR/pEUR, had greater association strength than donor counterparts on DCAL. Most interestingly, we identified that pIBD was associated with allograft survival even in intra-race transplants. Finally, we showed for the first time that pIBD was associated with the early development of vascular intimal fibrosis (Cv) lesions and to a lesser extent IF/TA (Ci+Ct), which may then mediate its association with DCAL.
Improved long-term allograft survival has remained an elusive goal in renal transplantation, while acute cellular rejection episodes have been significantly reduced with modern immunosuppression.1 This discrepancy may highlight that distinct pathogenetic events and histologic lesions may be contributing to these two outcomes in the current era. Large biopsy studies suggest IF/TA of undetermined etiology is an important lesion seen in 30-40% of all allografts that fail.2, 16 Recent data using gene co-expression analyses suggest ~80% overlap between differentially expressed genes in IF/TA and TCMR, which could imply ongoing unchecked alloimmunity in cases of IF/TA without tubule-interstitial lymphocytic infiltrates.4 Our novel data suggest pIBD is preferentially relevant to the development of early allograft vasculopathy. As a corollary, self-reported related LD transplants tended to have smaller 3-month and 1-year Cv scores than unrelated LD transplants. While we observed a higher likelihood of development of anti-AT1R antibodies among recipients in the C-to-C low pIBD sera (likely via a classical anti-donor adaptive immune response), D-R differences quantified by pIBD were not associated with i+t score or clinical/subclinical TCMR. Experimental data has identified the initiation of nonself recognition by innate immune cells (monocytes), which was independent of MHC loci in mice, and hence should map to as yet undescribed non-HLA loci that contribute to D-R differences.7 In cardiac allograft vasculopathy, a lesion associated with long-term allograft failure, specific monocyte lineage cells were necessary for the development of vascular lesions while T-cells were dispensable.17 These and our data raise the role of other cell types and mechanisms in vasculopathy.
The predominant association of recipient genetic ancestry on allograft outcomes compared to donor ancestry in our cohort could have resulted from the racial homogeneity of the donor pool (75% and 8.5% donors were Caucasian and AA respectively). For instance, our cohort had very few AA donors imputed as risk genotypes (G1/G1, G2/G2 or G1/G2) for APOL1 gene,18 and limited inferences can be drawn on these well-known risk variants. In a more heterogeneous donor cohort, a greater relevance of donor ancestry cannot be discounted. pIBD was marginally predictive of year-1 Ci+Ct score in LD transplants (Table 3B), but lost significance in other strata. Due to the high correlation between Ci+Ct and Cv scores and the cumulative nature of allograft injury, we cannot exclude an association of pIBD with Ci+Ct score independent of Cv-score in our retrospective data. Only 1 DDs with pIBD>0.1 had any biopsy in the first year, hence data regarding the correlation of pIBD with histology in DD allografts is inconclusive in our dataset.
Our novel data raise several avenues for further study in line with recent published data. A recent study showed the aggregated effect of global genetic mismatch in non-HLA coded transmembrane proteins as an important predictor of graft survival.19 Other recent data suggest the increased risk of clinical rejection in the presence of global,20 or specific localized non-HLA loci mismatches.21 These data found association with clinical acute rejection in the respective cohorts, and reported the increased presence of non-HLA antibodies potentially resulting from non-HLA mismatches. However, neither study obtained serial allograft histology from surveillance biopsies to examine early allograft histology in the context of genome-wide mismatches, a distinct strength of our data. Our results also suggest genome-wide relatedness reflected by pIBD may be manifested as chronic allograft injury and allograft loss, rather than clinical rejection. Our data also suggests that accurate quantification of genetic ancestry (e.g., pAFR) may have advantage over self-report race – a potential clinical practice application. With admixture mapping in collaboration with large consortia,22, 23 specific genomic region(s) that predispose patients to higher risk of allograft loss could be identified, similar to APOL1 risk alleles in AAs.24-26
Identification of specific loci from human data could allow design of mechanistic experiments in animal models of Cv-lesions, with the aims of developing genetic/genomic biomarkers and therapeutic targets.
We acknowledge several limitations of our study. First, given the profound heterogeneity in genetic background of our study cohort, the sample size was limited to fully dissect the effect of different genetic risk factors in renal transplantation, warranting independent cohorts with larger sample sizes for future work. Second, the association of pIBD with allograft survival was confounded by donor type, mainly because the distribution of the pIBD values was limited in deceased donor transplants. Similarly, the attenuated association of pIBD with DCGL when adjusting induction therapy or ABMR in multivariable analysis likely relays the presence of unrecognized residual confounding in our retrospective cohort. Finally, the association of pIBD with Cv scores and with DCAL was more applicable to C-to-C and LD D-Rs in our data.
In conclusion, we report here that non-HLA-dependent, genome-wide donor-recipient differences were significantly associated with allograft survival. We show for the first time that D-R “quantitative relatedness” as measured by pIBD was associated with the early development of vascular intimal fibrosis lesions and allograft survival, without association with T-cell mediated rejection. These data could have profound impact on organ allocation and personalized immunosuppression decisions and have potential for development of new target therapies.
Materials and Methods
Study Cohort
Please refer to Supplementary Methods for details.
Quantification of HLA-matching
HLA genotypes in donors and recipients at the A-, B- and DR-loci were mapped by 2-digit low-resolution PCR-based genotyping at all centers. Matches and mismatches were defined per UNOS nomenclature. We defined HLA mismatch score in 4 categories: 0 (no mismatches), 1 (1-2 mismatches), 2 (3-4 mismatches), and 3 (5-6 mismatches).
Genotyping, Quality Control and ADMIXTURE Analysis
Please refer to Supplementary Methods for details.
Genetic-inferred Ancestry
As shown in Figure S2, the proportions of African (pAFR) and Caucasian (pEUR) ancestry accounted for the majority of genetic variability among the individuals and served as a quantitative measure of ancestral background, here defined as “quantitative ancestry”. We used the coordinates along the axes of the two ancestral proportions to define, in a conventional meaning, the genetic ancestry of donors and recipients (Figure 1A). With simple thresholds, the individuals were categorized as African American if pAFR >= 0.6, Caucasian if pEUR >= 0.9, Asian if pAFR + pEUR <= 0.1, and Hispanic otherwise (see Figure 1B).
Estimation of Identity-by-descent (IBD)
The proportion of genome-shared identity-by-descent (pIBD) (also referred as to “coefficient of relatedness”) is calculated as Pr(IBD=1)/2 + Pr(IBD=2).13, 14 It can be used as a quantitative measure of relatedness between individuals. We used PLINK27 to estimate pIBD between D-R pairs based on the same pruned genome-wide genotype data (excluding SNPs within MHC region) as described above.
Anti HLA and AT1R Antibodies
Please refer to Supplementary Methods for details.
Statistical Analysis
The association of time-to-event outcome (DCAL) with risk factors was evaluated with Cox regression. We used the method based on Schoenfeld residuals to check the proportional hazard (PH) assumption for the Cox models.28 This method was implemented as the function cox.zph in the R package survival. The association of dichotomous outcomes (different T-cell mediated rejection [TCMR] outcomes) with risk factors was evaluated with logistic regression. The association of ordered categorical outcomes (e.g. Cv score) with risk factors was evaluated with ordinal (ordered) logistic regression. In each regression analysis, the samples with missing data in relevant covariates were omitted. These statistical procedures were implemented in R29 and SPSS (IBM, New York).
Supplementary Material
Supplementary Methods: Study Cohort, Genotyping and Quality Control, ADMIXTURE Analysis, Anti HLA and AT1R Antibodies
Figure S1. Flowchart of genotyping and quality control.
Figure S2. Unsupervised learning of genetic ancestry based on 1000 Genomes Project (KGP) samples with ADMIXTURE.
Figure S3. pAFR and pEUR for each genetic ancestry group.
Figure S4. Euclidean distance in pAFR-pEUR space and pIBD between D-R pairs.
Figure S5. Distribution of HLA mismatch score.
Figure S6. Estimated genetic ancestry of donors and recipients.
Figure S7. pIBD and HLA mismatch score for C-to-C D-R pairs with DDs and their association with allograft survival.
Figure S8. pIBD and HLA mismatch score for C-to-C D-R pairs with LDs and their association with allograft survival.
Figure S9. Correlation of pIBD with Banff component scores.
Table S1. Ancestral populations in 1000 Genomes Project Phase I data.
Table S2. Genetic ancestry and self-reported race of donors and recipients.
Table S3. Univariate survival analysis on DCAL for D-R cohort.
Table S4. Association of pIBD with DCAL in multivariable Cox regression adjusted with donor type.
Table S5. Association of pIBD with DCAL in multivariable Cox regression for all D-R pairs stratified by donor type.
Table S6. Association of pIBD with DCAL in multivariable Cox regression for C-to-C D-R pairs stratified by donor type.
Table S7. The association of different TCMR variables with DCAL using univariate Cox regression.
Table S8. The association of different risk factors with DCAL conditional on TCMR.
Table S9. Univariate analysis of different risk factors on different TCMR indicators by logistic regression.
Table S10. Low pIBD was associated with higher AT1R mismatches and antibodies.
Table S11. pIBD was associated with highest year-1 Cv score in multivariable ordinal logistic regression.
Table S12. Highest year-1 Cv score was associated with DCAL Supplementary information is available on Kidney International's website.
Acknowledgements
We thank all the patients, donors and their families, the participating clinical sites and investigators in the GoCAR study. We thank Dr. Elaine Reed from UCLA Immunogenetics Center for her assistance in anti-AT1R antibody assay. The original work is a substudy of the GoCAR study sponsored by NIH 5U01AI070107-03. HK is partially supported by National Natural Science Foundation of China (Grant No. 21477087, 91643201), and by Ministry of Science and Technology of China (Grant No. 2016YFC0206507). MCM and ZZ acknowledge the Translational Collaborative Research Initiative Grant, “Non-HLA donor-recipient differences and allograft survival”, Department of Medicine, Icahn School of Medicine at Mount Sinai. MCM wishes to acknowledge funding from American Heart Association (AHA 15SDG25870018), NIH DK122164 and philanthropy from Nina and Homer Eaton. MCM also acknowledges CTOT-19 study (PI: Peter Heeger) for pilot funding (NIH U01AI063594) to study non-HLA donor-recipient differences.
Footnotes
Publisher's Disclaimer: This is a PDF file of an article that has undergone enhancements after acceptance, such as the addition of a cover page and metadata, and formatting for readability, but it is not yet the definitive version of record. This version will undergo additional copyediting, typesetting and review before it is published in its final form, but we are providing this version to give early visibility of the article. Please note that, during the production process, errors may be discovered which could affect the content, and all legal disclaimers that apply to the journal pertain.
Disclosure
Please refer to details in author disclosure forms.
References
- 1.Meier-Kriesche HU, Schold JD, Kaplan B. Long-term renal allograft survival: have we made significant progress or is it time to rethink our analytic and therapeutic strategies? Am J Transplant 2004; 4: 1289–1295. [DOI] [PubMed] [Google Scholar]
- 2.El-Zoghby ZM, Stegall MD, Lager DJ, et al. Identifying specific causes of kidney allograft loss. Am J Transplant 2009; 9: 527–535. [DOI] [PubMed] [Google Scholar]
- 3.De Vusser K, Lerut E, Kuypers D, et al. The predictive value of kidney allograft baseline biopsies for long-term graft survival. J Am Soc Nephrol 2013; 24: 1913–1923. [DOI] [PMC free article] [PubMed] [Google Scholar]
- 4.Modena BD, Kurian SM, Gaber LW, et al. Gene Expression in Biopsies of Acute Rejection and Interstitial Fibrosis/Tubular Atrophy Reveals Highly Shared Mechanisms That Correlate With Worse Long-Term Outcomes. Am J Transplant 2016. [DOI] [PMC free article] [PubMed] [Google Scholar]
- 5.Halloran PF. T cell-mediated rejection of kidney transplants: a personal viewpoint. Am J Transplant 2010; 10: 1126–1134. [DOI] [PubMed] [Google Scholar]
- 6.Lechler R, Lombardi G. The structural basis of alloreactivity. Immunol Res 1990; 9: 135–146. [DOI] [PubMed] [Google Scholar]
- 7.Oberbarnscheidt MH, Zeng Q, Li Q, et al. Non-self recognition by monocytes initiates allograft rejection. J Clin Invest 2014; 124: 3579–3589. [DOI] [PMC free article] [PubMed] [Google Scholar]
- 8.Zecher D, van Rooijen N, Rothstein DM, et al. An innate response to allogeneic nonself mediated by monocytes. J Immunol 2009; 183: 7810–7816. [DOI] [PubMed] [Google Scholar]
- 9.Menon MC, Chuang PY, Li Z, et al. Intronic locus determines SHROOM3 expression and potentiates renal allograft fibrosis. J Clin Invest 2015; 125: 208–221. [DOI] [PMC free article] [PubMed] [Google Scholar]
- 10.O'Connell PJ, Zhang W, Menon MC, et al. Biopsy transcriptome expression profiling to identify kidney transplants at risk of chronic injury: a multicentre, prospective study. Lancet 2016; 388: 983–993. [DOI] [PMC free article] [PubMed] [Google Scholar]
- 11.1000 Genomes Project C, Abecasis GR, Auton A, et al. An integrated map of genetic variation from 1,092 human genomes. Nature 2012; 491: 56–65. [DOI] [PMC free article] [PubMed] [Google Scholar]
- 12.Alexander DH, Novembre J, Lange K. Fast model-based estimation of ancestry in unrelated individuals. Genome Res 2009; 19: 1655–1664. [DOI] [PMC free article] [PubMed] [Google Scholar]
- 13.Guo SW. Proportion of genome shared identical by descent by relatives: concept, computation, and applications. Am J Hum Genet 1995; 56: 1468–1476. [PMC free article] [PubMed] [Google Scholar]
- 14.Browning SR, Browning BL. Identity by Descent Between Distant Relatives: Detection and Applications. Annu Rev Genet 2012; 46: 617–633. [DOI] [PubMed] [Google Scholar]
- 15.Dragun D, Muller DN, Brasen JH, et al. Angiotensin II type 1-receptor activating antibodies in renal-allograft rejection. N Engl J Med 2005; 352: 558–569. [DOI] [PubMed] [Google Scholar]
- 16.Naesens M, Kuypers DR, De Vusser K, et al. The histology of kidney transplant failure: a long-term follow-up study. Transplantation 2014; 98: 427–435. [DOI] [PubMed] [Google Scholar]
- 17.Schiopu A, Nadig SN, Cotoi OS, et al. Inflammatory Ly-6C(hi) monocytes play an important role in the development of severe transplant arteriosclerosis in hyperlipidemic recipients. Atherosclerosis 2012; 223: 291–298. [DOI] [PMC free article] [PubMed] [Google Scholar]
- 18.Zhang Z, Hao K, Ross MJ, et al. APOL1 G2 risk allele-clarifying nomenclature. Kidney Int 2017; 92: 518–519. [DOI] [PubMed] [Google Scholar]
- 19.Reindl-Schwaighofer R, Heinzel A, Kainz A, et al. Contribution of non-HLA incompatibility between donor and recipient to kidney allograft survival: genome-wide analysis in a prospective cohort. Lancet 2019; 393: 910–917. [DOI] [PubMed] [Google Scholar]
- 20.Pineda S, Sigdel TK, Chen J, et al. Novel Non-Histocompatibility Antigen Mismatched Variants Improve the Ability to Predict Antibody-Mediated Rejection Risk in Kidney Transplant. Front Immunol 2017; 8: 1687. [DOI] [PMC free article] [PubMed] [Google Scholar]
- 21.Steers NJ, Li Y, Drace Z, et al. Genomic Mismatch at LIMS1 Locus and Kidney Allograft Rejection. N Engl J Med 2019; 380: 1918–1928. [DOI] [PMC free article] [PubMed] [Google Scholar]
- 22.International G, Translational Research in Transplantation N. Design and Implementation of the International Genetics and Translational Research in Transplantation Network. Transplantation 2015; 99: 2401–2412. [DOI] [PMC free article] [PubMed] [Google Scholar]
- 23.Hricik DE, Nickerson P, Formica RN, et al. Multicenter validation of urinary CXCL9 as a risk-stratifying biomarker for kidney transplant injury. Am J Transplant 2013; 13: 2634–2644. [DOI] [PMC free article] [PubMed] [Google Scholar]
- 24.Genovese G, Friedman DJ, Ross MD, et al. Association of trypanolytic ApoL1 variants with kidney disease in African Americans. Science 2010; 329: 841–845. [DOI] [PMC free article] [PubMed] [Google Scholar]
- 25.Kao WH, Klag MJ, Meoni LA, et al. MYH9 is associated with nondiabetic end- stage renal disease in African Americans. Nat Genet 2008; 40: 1185–1192. [DOI] [PMC free article] [PubMed] [Google Scholar]
- 26.Kopp JB, Smith MW, Nelson GW, et al. MYH9 is a major-effect risk gene for focal segmental glomerulosclerosis. Nat Genet 2008; 40: 1175–1184. [DOI] [PMC free article] [PubMed] [Google Scholar]
- 27.Purcell S, Neale B, Todd-Brown K, et al. PLINK: a tool set for whole-genome association and population-based linkage analyses. Am J Hum Genet 2007; 81: 559–575. [DOI] [PMC free article] [PubMed] [Google Scholar]
- 28.Grambsch PM, Therneau TM. Proportional Hazards Tests and Diagnostics Based on Weighted Residuals. Biometrika 1994; 81: 515–526. [Google Scholar]
- 29.R Core Team: R: A Language and Environment for Statistical Computing. In, R Foundation for Statistical Computing, Vienna, Austria, 2016 [Google Scholar]
Associated Data
This section collects any data citations, data availability statements, or supplementary materials included in this article.
Supplementary Materials
Supplementary Methods: Study Cohort, Genotyping and Quality Control, ADMIXTURE Analysis, Anti HLA and AT1R Antibodies
Figure S1. Flowchart of genotyping and quality control.
Figure S2. Unsupervised learning of genetic ancestry based on 1000 Genomes Project (KGP) samples with ADMIXTURE.
Figure S3. pAFR and pEUR for each genetic ancestry group.
Figure S4. Euclidean distance in pAFR-pEUR space and pIBD between D-R pairs.
Figure S5. Distribution of HLA mismatch score.
Figure S6. Estimated genetic ancestry of donors and recipients.
Figure S7. pIBD and HLA mismatch score for C-to-C D-R pairs with DDs and their association with allograft survival.
Figure S8. pIBD and HLA mismatch score for C-to-C D-R pairs with LDs and their association with allograft survival.
Figure S9. Correlation of pIBD with Banff component scores.
Table S1. Ancestral populations in 1000 Genomes Project Phase I data.
Table S2. Genetic ancestry and self-reported race of donors and recipients.
Table S3. Univariate survival analysis on DCAL for D-R cohort.
Table S4. Association of pIBD with DCAL in multivariable Cox regression adjusted with donor type.
Table S5. Association of pIBD with DCAL in multivariable Cox regression for all D-R pairs stratified by donor type.
Table S6. Association of pIBD with DCAL in multivariable Cox regression for C-to-C D-R pairs stratified by donor type.
Table S7. The association of different TCMR variables with DCAL using univariate Cox regression.
Table S8. The association of different risk factors with DCAL conditional on TCMR.
Table S9. Univariate analysis of different risk factors on different TCMR indicators by logistic regression.
Table S10. Low pIBD was associated with higher AT1R mismatches and antibodies.
Table S11. pIBD was associated with highest year-1 Cv score in multivariable ordinal logistic regression.
Table S12. Highest year-1 Cv score was associated with DCAL Supplementary information is available on Kidney International's website.