Abstract
The Picornaviridae are a diverse family of positive-strand RNA viruses that includes numerous human and veterinary pathogens1. Among these, hepatitis A virus (HAV), a common cause of acute hepatitis in humans, is unique in that it is hepatotropic and released from hepatocytes without lysis in small vesicles resembling exosomes2,3. These quasi-enveloped virions (eHAV) are infectious and the only form of virus detected in blood during acute infection2. By contrast, non-enveloped, naked virions (nHAV) are shed in feces, stripped of membranes by bile salts during passage through bile ducts to the gut4. How these two distinct types of infectious hepatoviruses enter cells to initiate infection is enigmatic. Here we describe a genome-wide forward screen that identified glucosylceramide synthase (UGCG) and other components of the ganglioside synthetic pathway as crucial host factors required for cellular entry by hepatoviruses. We show that gangliosides, preferentially disialogangliosides, function as essential endolysosome receptors required for infection by both naked and quasi-enveloped virions. In the absence of gangliosides, both virion types are efficiently internalized through endocytosis, but capsids fail to uncoat and accumulate within LAMP1+ endolysosomes. Gangliosides relieve this block, binding the capsid at low pH and facilitating a late step in entry involving uncoating and delivery of the RNA genome to the cytoplasm. These results reveal an atypical cellular entry pathway for hepatoviruses that is unique among picornaviruses.
Naked hepatitis A virions are exceptionally stable5 and therefore highly efficient in transmission between hosts through the external environment, whereas the membranes cloaking quasi-enveloped virions protect the virus from neutralizing antibodies2 and facilitate stealthy spread of infection in newly infected hosts. Although distinct in their surface structures, both virion types undergo clathrin- and dynamin-dependent endocytosis to enter cells, followed by trafficking through Rab-5A+ early and Rab-7a+ late endosomes6. Quasi-enveloped virions continue to traffic to LAMP1+ lysosomes where the eHAV membrane is degraded by lysosomal enzymes and the lysosomal membrane is breached during the process of entry6. Despite abundant evidence for endocytosis and trafficking within endosomes, essential cellular receptors have not been identified for either type of virion. TIM1 (T cell immunoglobulin and mucin domain containing protein 1, a.k.a. HAVCR1) was reported previously to be an HAV receptor7, but it is not essential for infection and acts only as an attachment factor for quasi-enveloped virus by binding phosphatidylserine on the eHAV surface8,9. Also unknown is the trigger for capsid disassembly and whether this process is similar or different for the capsids of naked and quasi-enveloped virions once the eHAV membrane has been degraded. Importantly, recent studies show the capsid is structurally distinct from other picornaviral capsids, and that it is maximally stable at the acid pH of late endosomes and lysosomes to which it trafficks5,6.
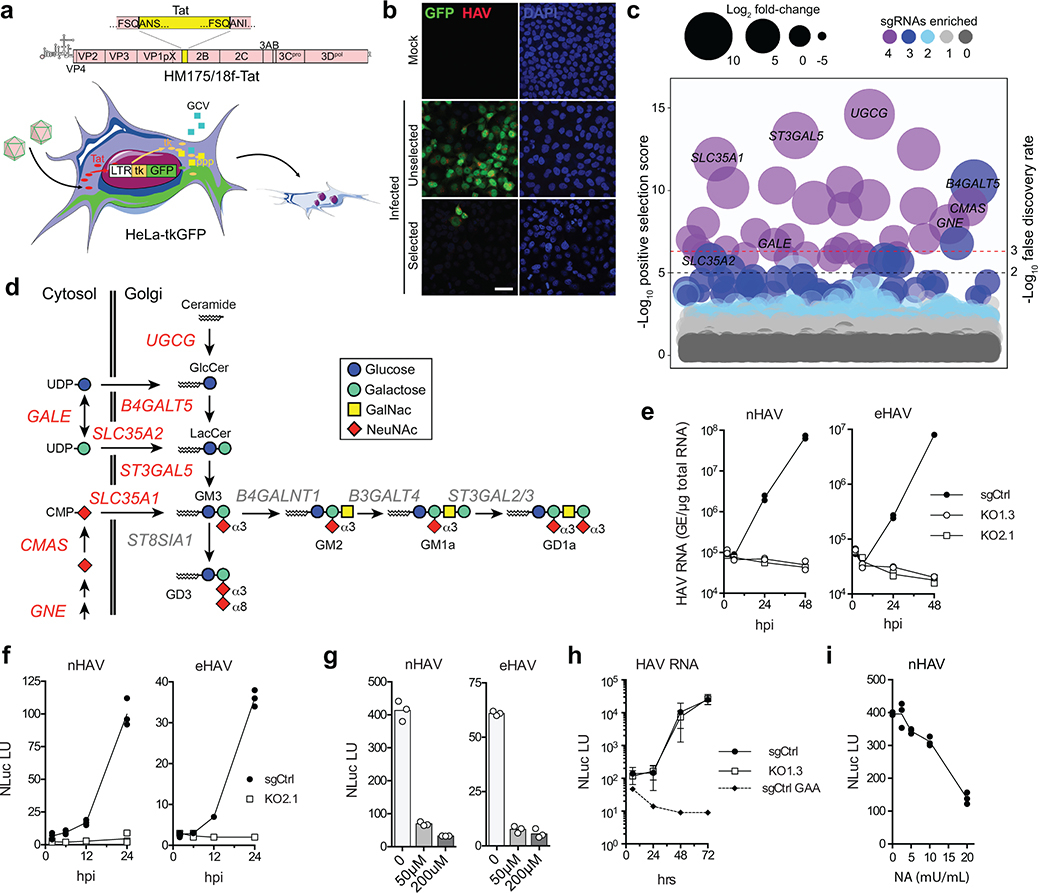
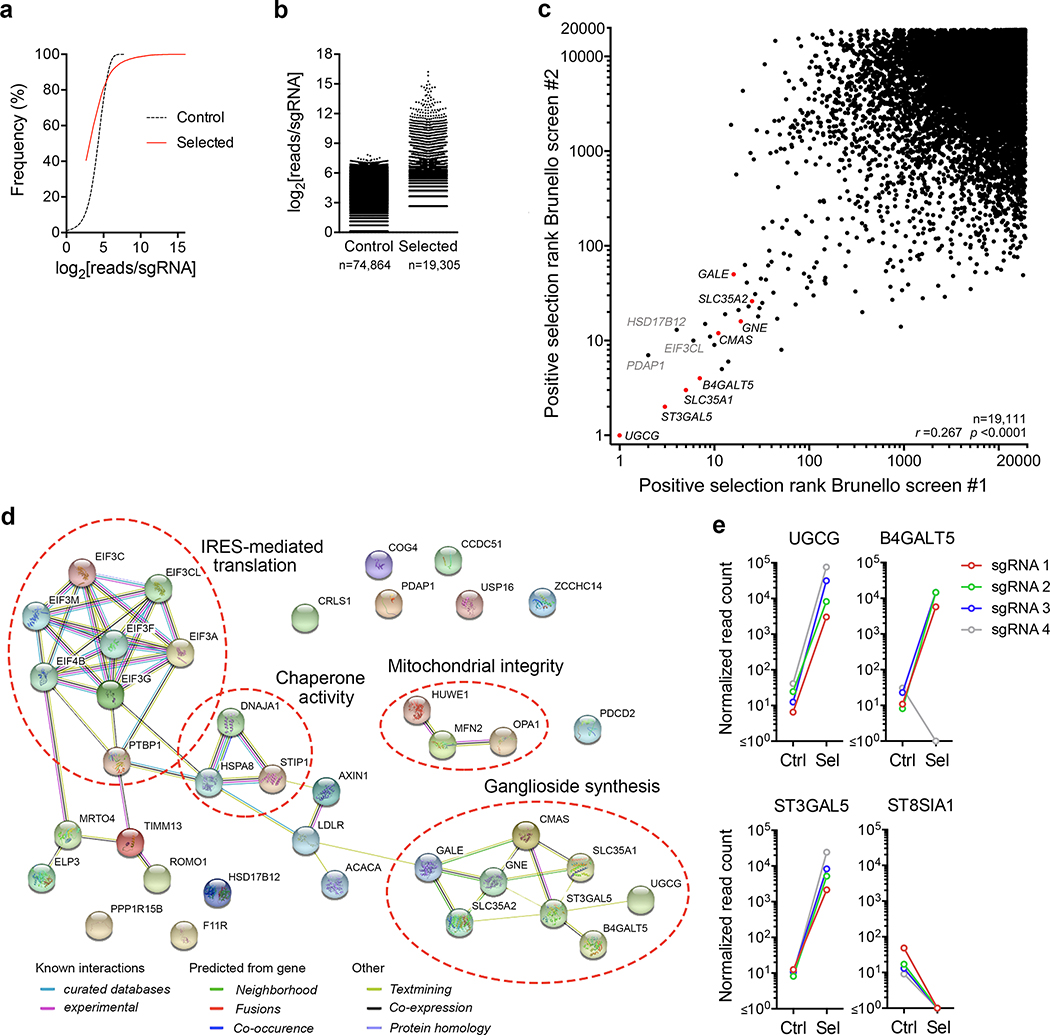
To better understand how these distinct infectious forms of HAV gain entry into cells, we devised a genome-wide, forward genetic CRISPR (clustered regularly interspaced short palindromic repeats) screen for essential host factors. Because cell culture-adapted HAV is only weakly cytopathic10, we constructed a recombinant Tat reporter virus (18f-Tat) capable of inducing expression of Herpes simplex thymidine kinase fused to green fluorescent protein (tkGFP) in a HeLa-derived cell line containing tkGFP sequence under transcriptional control of the Tat-responsive LTR promoter (HeLa-tkGFP cells) (Fig. 1a). 18f-Tat virus infection results in robust tkGFP expression in HeLa-tkGFP cells and, in the presence of ganciclovir (GCV), efficient cell death11. HeLa-tkGFP cells were transduced with a lentivirus library expressing guide RNAs (sgRNAs) targeting 19,114 human genes, each with 4 sgRNAs12, then subjected to two cycles of high multiplicity 18f-Tat virus infection. Surviving cells, selected after a total of 3 weeks growth in media containing GCV, demonstrated a reduced frequency of GFP expression (Fig. 1b), and were highly enriched in multiple sgRNA integrants targeting specific genes when compared with uninfected, GCV-treated HeLa-tkGFP cells (Extended Data Figs. 1a,b). Two independent screening experiments demonstrated high concordance in the rank order of top gene hits (Extended Data Fig. 1c), identifying 39 candidate hepatovirus host factors with high confidence (fdr ≤ 0.01 and p ≤ 1.58 ×10⁻⁵) (Fig. 1c). These hits included distinct clusters of genes encoding functionally-related proteins, most notably translation initiation factors involved in viral IRES-mediated translation, and key enzymes and sugar transporters involved in the synthesis of gangliosides within the Golgi (Fig. 1d, Extended Data Fig. 1d).
Figure 1.
Genome-wide CRISPR screen identifies gangliosides as essential host factors for naked (nHAV) and quasi-enveloped (eHAV) virus entry. a. (top) 18f-Tat virus genome with Tat sequence inserted at the VP1pX-2B junction flanked by 3Cpro cleavage sites. (bottom) Schematic depicting the CRISPR screen: HeLa-tkGFP cells infected with 18f-Tat virus express tkGFP, which phosphorylates ganciclovir (GCV) leading to apoptotic cell death. b. Confocal microscopy images showing tkGFP expression (green) and HAV antigen (red) in 18f-Tat-infected HeLa-tkGFP cells with or without GCV selection in the first CRISPR screen. Similar results were observed in the second screen. Scale bar = 10 μm. c. Bubble plot showing enrichment of sgRNAs targeting 19112 human genes in a combined analysis of the two independent screens. Bubble size and color reflect statistical significance and how many sgRNAs were enriched for each gene. p-values were calculated by the MAGeCK algorithm based on a negative binomial model and are one-sided. FDR was computed from empirical p-values using the Benjamini-Hochberg procedure. Genes with labels are involved in ganglioside synthesis. d. Metabolic pathways leading to ganglioside synthesis. Genes highlighted in red were identified in the screen. e. Mean viral RNA abundance in clonal UGCG-KO cell lines (KO1.3 and KO2.1) and control (sgCtrl) cells inoculated with (left) nHAV or (right) eHAV. hpi = hrs post-infection. n=2 technical replicates. f. Mean NLuc activity in lysates of UGCG-KO2.1 and sgCtrl cells infected with (left) nHAV or (right) eHAV reporter virus. n= 3 technical replicates. g. Mean NLuc activity expressed by (left) nHAV or (right) eHAV 6 hpi in Huh-7.5 cells pre-treated with miglustat for 72 hrs before infection. n=3 technical replicates. h. NLuc expressed by UGCG-KO or sgCtrl cells 6–72 hrs following electroporation with synthetic 18f-NLuc RNA. Data shown are means ± s.d. from 3 independent experiments. sgCtrl cells were electroporated in parallel with replication-defective HAV RNA containing a lethal mutation (GAA) in 3Dpol in one experiment. i. Mean NLuc activity expressed by Huh-7.5 cells treated with V. cholerae neuraminidase (NA) prior to infection with 18f/NLuc nHAV. n=3 technical replicates. The results of all experiments with data shown as technical replicates were confirmed in biologically independent experiments.
The lead hit in both screening experiments was UGCG, which encodes UDP-glucose ceramide glucosyltransferase (UGCG, a.k.a. glucosylceramide synthase) that catalyzes the first step in synthesis of gangliosides, complex glycosphingolipids with carbohydrate headgroups containing one or more sialic acid (N-acetylneuraminic acid, NeuNAc) moieties (Fig. 1d, Extended Data Fig. 1c)13. Survivor cells were 100- to 1000-fold enriched in sgRNA integrants targeting UGCG, as well as B4GALT5 and ST3GAL5 that encode enzymes catalyzing subsequent reactions leading to ganglioside GM3 synthesis (Extended Data Fig. 1e). Also significantly enriched were sgRNA integrants targeting GALE and SLC35A2, as well as GNE, CMAS, and SLC35A1, genes encoding proteins mediating synthesis and transport to the Golgi of UDP-galactose and NeuNAc, both critical substrates for ganglioside synthesis (Fig. 1d, Extended Data Fig. 1c)13. Collectively, these data provide strong evidence that ganglioside synthesis is critical for hepatovirus infection.
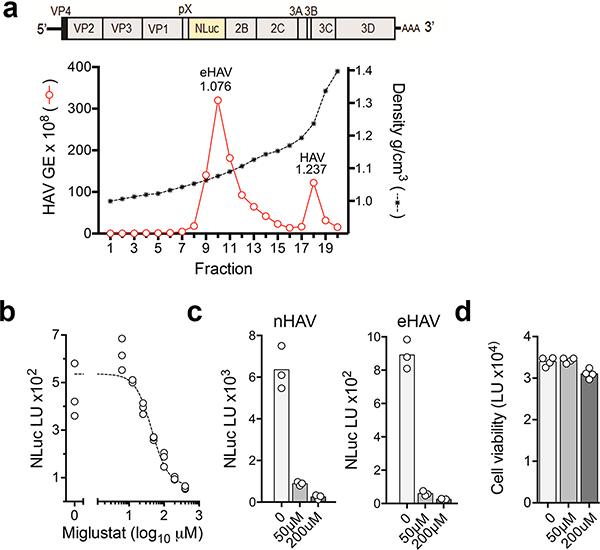
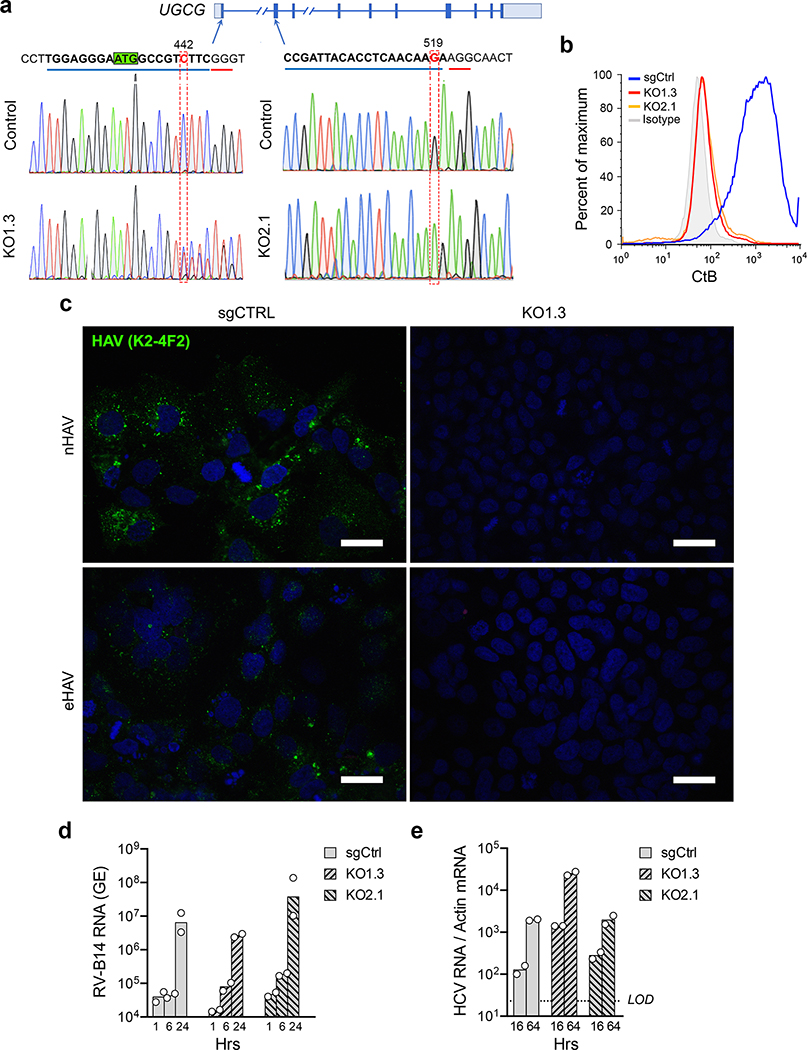
Validation experiments in liver-derived Huh-7.5 cells confirmed that gangliosides are essential for hepatovirus infection. Naked and quasi-enveloped hepatovirus virions, isolated from different fractions of an isopycnic iodixanol gradient (Extended Data Fig. 2a)2, each failed to infect two independent ganglioside-deficient Huh-7.5 cell lines with targeted knockout of UGCG (Fig. 1e, Extended Data Fig. 3a–c). This lack of permissiveness was specific for hepatoviruses, as UGCG-KO cells remained permissive for a distantly-related picornavirus, human rhinovirus B14, as well as hepatitis C virus, an hepatotropic member of the flavivirus family (Extended Data Fig 3d,e). A small molecule inhibitor of the glucosyltransferase activity of UGCG, N-butyldeoxynojirimycin (a.k.a. miglustat)14, also inhibited infection of Huh-7.5 cells by both naked and quasi-enveloped forms of a nanoluciferase (NLuc)-expressing reporter virus, 18f-NLuc6 (Extended Data Fig. 2b–d). Previous studies show that translation of 18f-NLuc RNA genomes released into the cytoplasm of Huh-7.5 cells by infecting nHAV or eHAV results in low levels of NLuc expression for 6–12 hrs6. This is followed by exponential increases in NLuc expression resulting from genome amplification. Importantly, both UGCG knockout and miglustat treatment blocked this early expression of NLuc by either virion type, suggesting a defect in cellular entry of the virus (Fig. 1f,g). By contrast, there was no defect in NLuc expression following electroporation of in vitro transcribed 18f-NLuc genomic RNA (Fig. 1h). Thus, gangliosides are required for the entry of both virion types into cells, but not for either viral translation or replication of the RNA genome. Consistent with this conclusion, pretreating cells with V. cholera neuraminidase resulted in a concentration-dependent reduction in NLuc expressed 6 hours after inoculation of Huh-7.5 cells with naked 18f-NLuc virus (Fig. 1i).
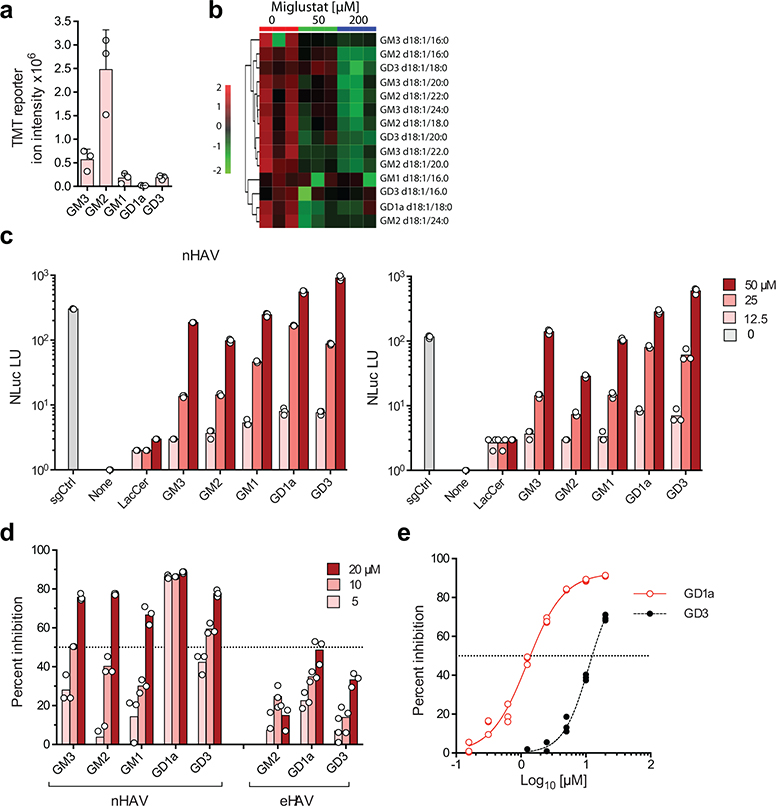
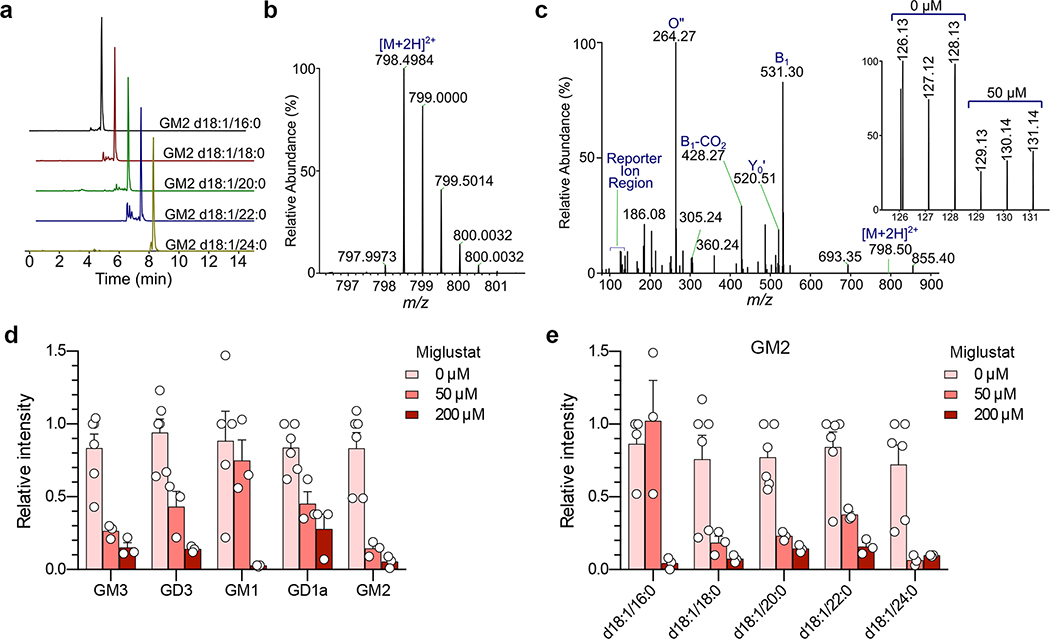
To understand which specific ganglioside(s) might function in HAV entry, we utilized a recently developed, multiplexed LC-MS/MS assay15 to characterize gangliosides present in miglustat-treated and untreated Huh-7.5 cells. Fourteen specific species representing 5 classes of gangliosides were identified: GM3 (16% of the total), GM2 (72%), GM1 (4.8%), GD3 (5.7%) and GD1a (0.6%) (Fig. 2a,b, Extended Data Fig. 4a–c). Each of these was substantially depleted by miglustat treatment (Fig. 2b, Extended Data Fig. 4d–e). Next, we reconstituted these gangliosides in UGCG-KO cells by adding commercially-procured ganglioside standards individually to cell culture medium 24 hrs prior to infectious challenge. Gangliosides in each class rescued infection by both naked and quasi-enveloped 18f-NLuc virus (Fig. 2c, Extended Data Fig. 5a,b). By contrast, the ganglioside precursor lactosylceramide (LacCer, Fig. 1d) rescued neither nHAV nor eHAV infection (Fig. 2c), supporting a critical role for NeuNAc moieties in viral entry.
Figure 2.
Gangliosides are essential for nHAV and eHAV entry in Huh-7.5 cells. a. Relative abundance of ganglioside classes in uninfected Huh-7.5 cells determined by ESI-MS. Data shown are mean TMT reporter intensities from 3 biologically independent samples ± s.d. b. Heat map showing the impact of miglustat treatment on abundance of ganglioside species in 3 independent Huh-7.5 cell cultures. c. Rescue of 18f-NLuc replication in UGCG-KO2.1 cells infected with gradient-purified (left) nHAV or (right) eHAV. Cells were cultured in media supplemented with 0–50 μM ganglioside for 24 hrs prior to virus challenge. NLuc activity was measured at 18 hpi. NLuc expressed by sgCtrl cells infected in parallel without ganglioside supplementation is shown for comparison. Data shown are means from n=3 technical replicates from representative experiments. d. Ganglioside inhibition of 18f-Nluc nHAV and eHAV infections. Virus was pre-incubated with gangliosides for 1 hr prior to inoculating Huh-7.5 cells; cells were harvested 6 (nHAV) or 16 hrs (eHAV) later for NLuc assay. Data shown are means from n=3 technical replicates from representative experiments. e. Dose-response analysis of ganglioside inhibition of 18f-Nluc nHAV infection. IC50 of GD1a (1.25 μM) and GD3 (11.1 μM) were estimated by fitting data to a 4-parameter, variable slope model (see Supplementary Table 1). n=3 technical replicates.
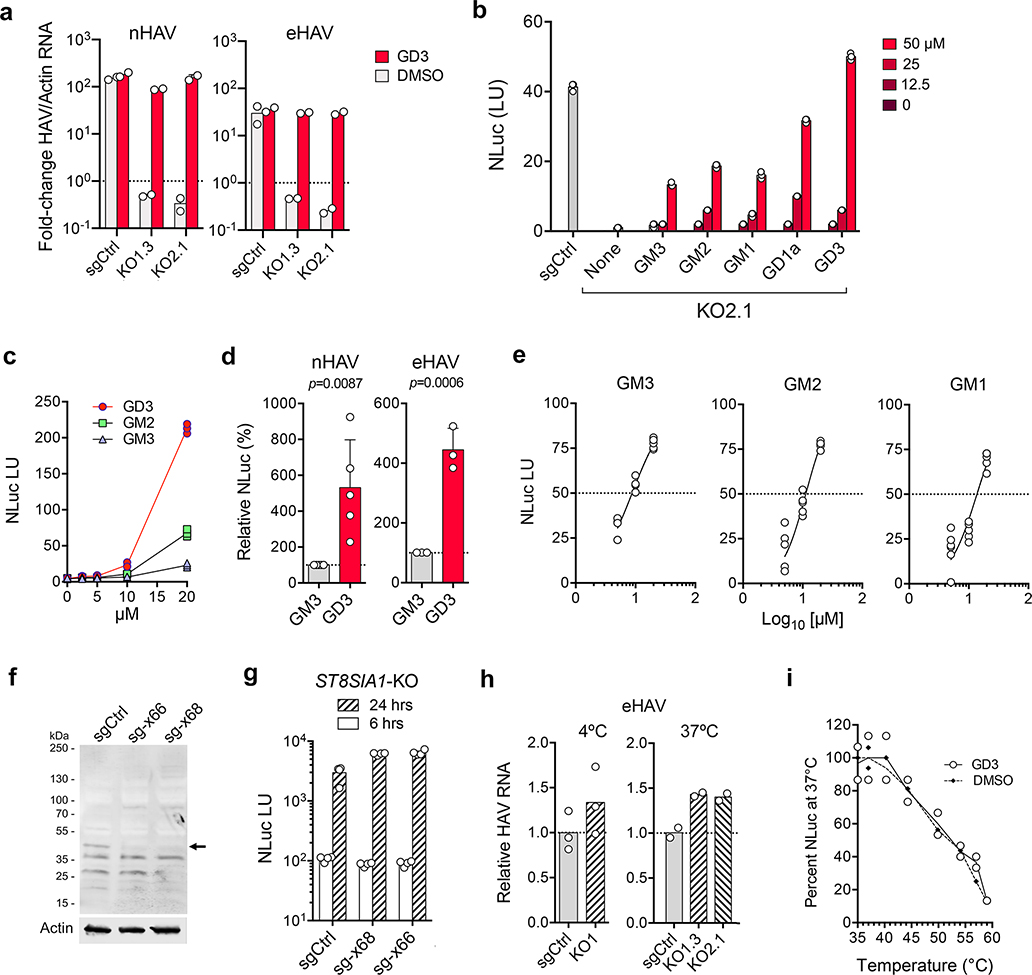
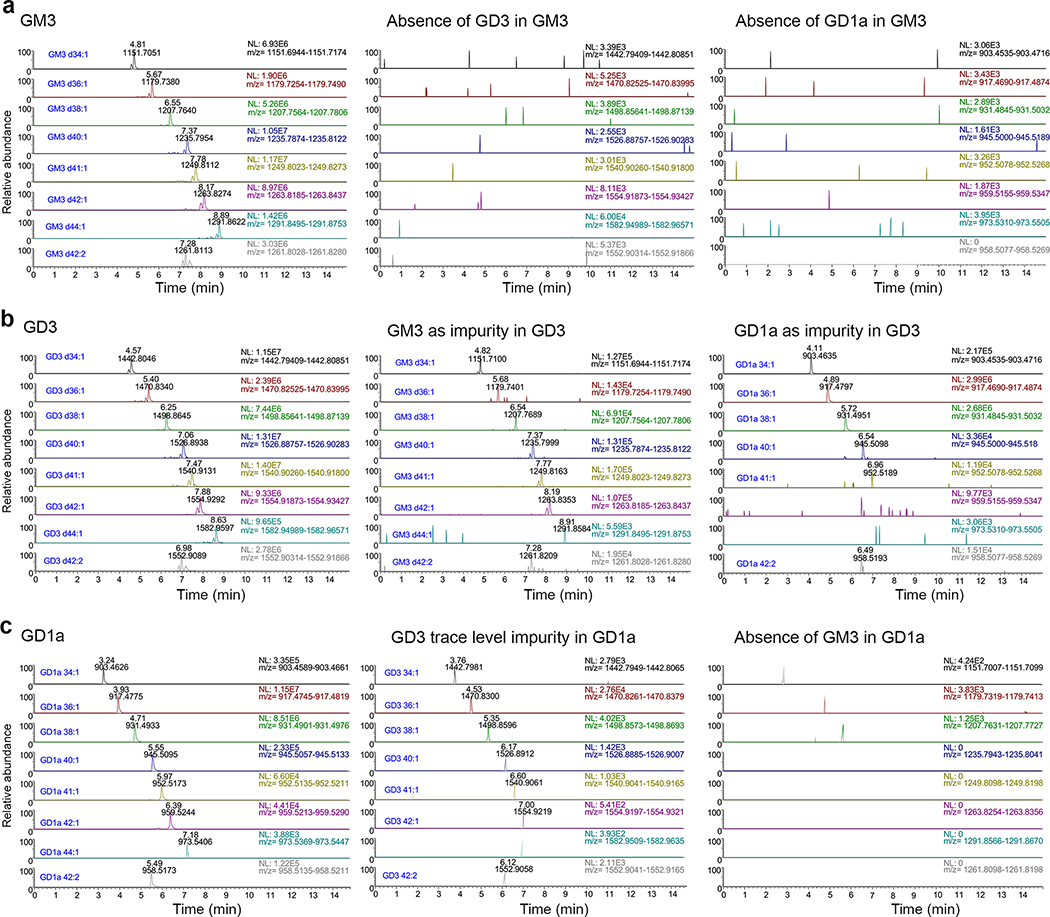
The disialoganglioside GD1a and GD3 standards were reproducibly more active than the monosialogangliosides GM3, GM2 or GM1 in restoring permissiveness to UGCG-KO cells (Fig. 2c, Extended Data Figs. 5b–d). Since previously published work shows that exogenous monosialogangliosides and disialogangliosides incorporate equally into cellular membranes16, these results suggest an HAV preference for disialogangliosides. When pre-incubated with naked virus, the disialoganglioside GD1a was significantly more active than all other gangliosides in blocking infection of Huh-7.5 cells (50% inhibitory concentration [IC50] 1.25 μM) (Fig. 2d,e, ). GD3 and GM3 were approximately 10-fold less inhibitory with overlapping IC50 95% confidence intervals (Supplementary Table 1, Extended Data Fig. 5e). Mass spectrometry indicated the GD3 standard contained ~7% GD1a which likely contributed to its activity, but confirmed the purity of the GD1a and GM3 standards (Extended Data Fig. 6). We observed no enrichment in the CRISPR screen of sgRNA integrants targeting ST8SIA1 that encodes GD3 synthase, the sialyltransferase responsible for GM3 to GD3 conversion, suggesting GD3 is not critical for HAV infection (Fig. 1d, Extended Data Fig. 1e). Moreover, targeted knockout of ST8SIA1, shunting ganglioside synthesis toward GD1a (Fig. 1d), made cells more, rather than less permissive for infection (Extended Data Fig. 5f,g). Thus, while a relatively broad range of gangliosides are capable of mediating HAV entry, GD1a is uniquely active in competing with the endogenous gangliosides engaged in this process.
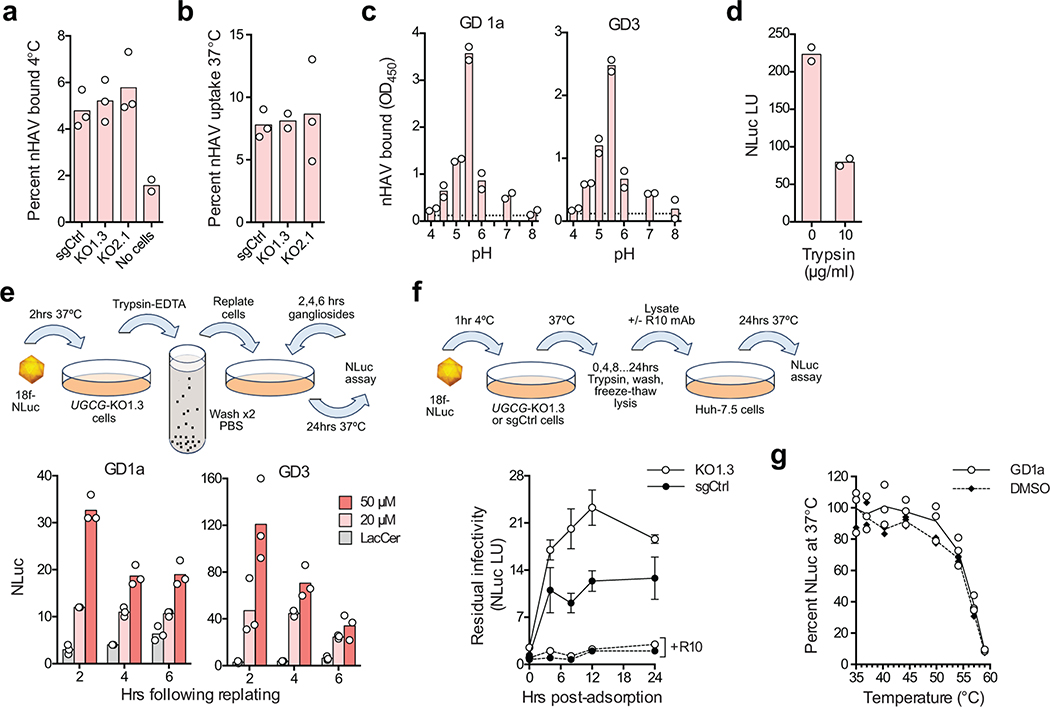
The ability of GD1a and other gangliosides to inhibit nHAV entry (Fig. 2d, left) shows gangliosides bind the HAV capsid. Gangliosides also block eHAV entry, although they are less active in doing so (Fig. 2d, right). This is likely because eHAV capsids become accessible to gangliosides only after degradation of the quasi-envelope in late endolysosomes6. Importantly, the absence of gangliosides in UGCG-KO cells did not reduce the binding of either virion type to cells at 4ºC, or internalization of virus at 37ºC (Fig. 3a,b, Extended Data Fig. 5h), showing that gangliosides are not required for initial attachment and endocytosis of virus. ELISA assays confirmed that capsids bind GD1a and GD3 gangliosides, and that the optimal pH for binding is 5.5, similar to the pH of late endolysosomes (Fig. 3c). Thus, gangliosides mediate a late step in viral entry, likely within late endolysosomes. Previous studies show endocytosis of eHAV is driven at least in part by interactions with phosphatidylserine receptors such as TIM18,9, whereas interactions of the capsid with cell surface sialoglycoproteins (possibly in addition to gangliosides) may mediate endocytosis of nHAV. nHAV is known to hemagglutinate type O erythrocytes in a neuraminidase- and pH-sensitive manner, and binds glycophorin A17,18. Consistent with this, pre-treating cells with either trypsin (Fig. 3d) or sialidase (Fig. 1i) partially inhibited nHAV infection.
Figure 3.
Gangliosides bind the HAV capsid and mediate a post-endocytosis step in viral entry. a. Mean percent nHAV bound to UGCG-KO1.3 and -KO2.1 cells versus sgCtrl cells following 1 hr incubation at 4ºC. n=3 technical replicates. b. Mean percent nHAV internalized by UGCG-KO versus sgCtrl cells at 37ºC. Cells were incubated with nHAV for 1 hr, washed with PBS, and reincubated for 5 hrs prior to lysis. n=3 technical replicates. c. nHAV binding to (left) GD1a and (right) GD3 gangliosides immobilized on plastic strips after overnight incubation at pH 4.0–8.0. Bound nHAV was detected with R10 antibody21. Bars show mean absorbance of n=2 technical replicates (GD1a) or in n=2 independent experiments, each with 2 technical replicates (GD3). Dotted lines indicate mean background absorbance without virus. d. Trypsin treatment inhibits nHAV entry. Cells were pretreated with trypsin for 30 min at 37ºC, and harvested 6 hpi for NLuc assay. Bars represent means from two independent experiments. e. Post-adsorption/endocytosis rescue of nHAV replication in UGCG-KO1.3 cells by (left) GD1a and (right) GD3. Cells were inoculated with 18f-NLuc nHAV at 37ºC, then placed in suspension by trypsin treatment, washed extensively, and re-plated prior to supplementation with 20–50 μM gangliosides or LacCer. Cells were assayed for NLuc activity 24 hrs later. Bars are means of n=3 technical replicates. f. HAV eclipse assay. UGCG-KO1.3 and sgCtrl cells inoculated with 18f-NLuc nHAV for 1 hr at 4ºC were shifted to 37ºC (time=0) and assayed subsequently at intervals for intracellular virus that had not uncoated by measuring NLuc activity in Huh-7.5 indicator cells 6 hpi. Neutralization with R10 antibody confirmed NLuc was generated by infectious virus. Data are means ± s.e.m. from 3 independent experiments (2 including R10 neutralization), each with 2–3 technical replicates. At 8 and 12 hrs, p=0.0192 and 0.0208 for UGCG-KO1.3 versus sgCtrl, respectively, by two-way ANOVA with Sidak’s test for multiple comparisons. g. Thermostability of 18f-NLuc nHAV incubated with 2 μM GD1a or DMSO for 1 hr at pH 5.5 at 37ºC, then re-incubated at 35–59ºC for 15 min prior to inoculation of Huh-7.5 cells. Results were normalized to virus incubated at 35ºC; n=3 technical replicates.
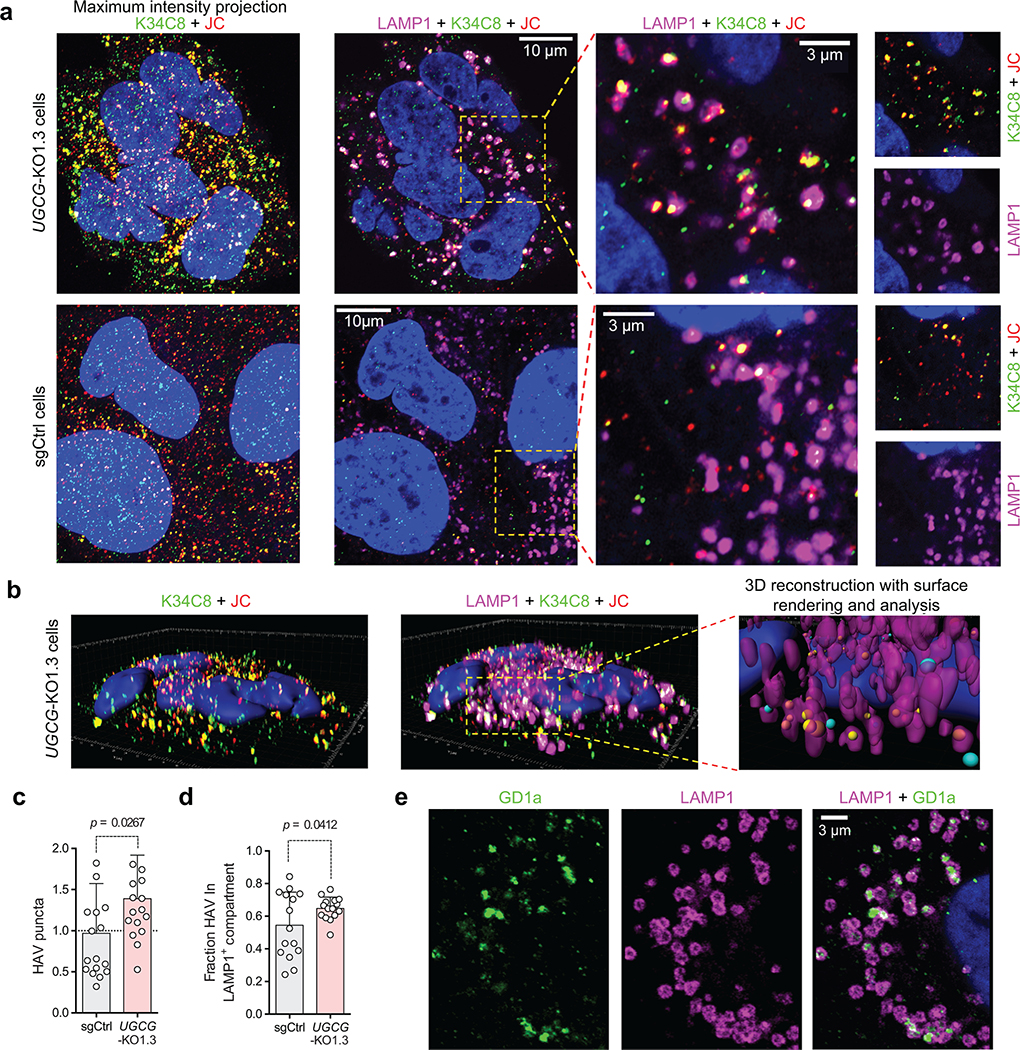
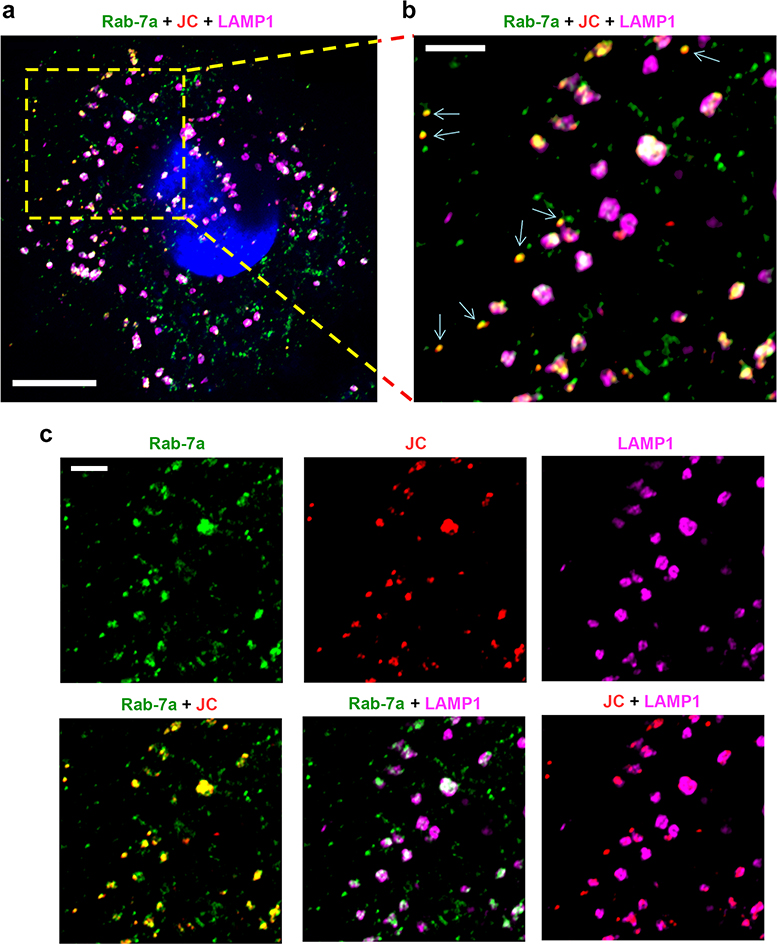
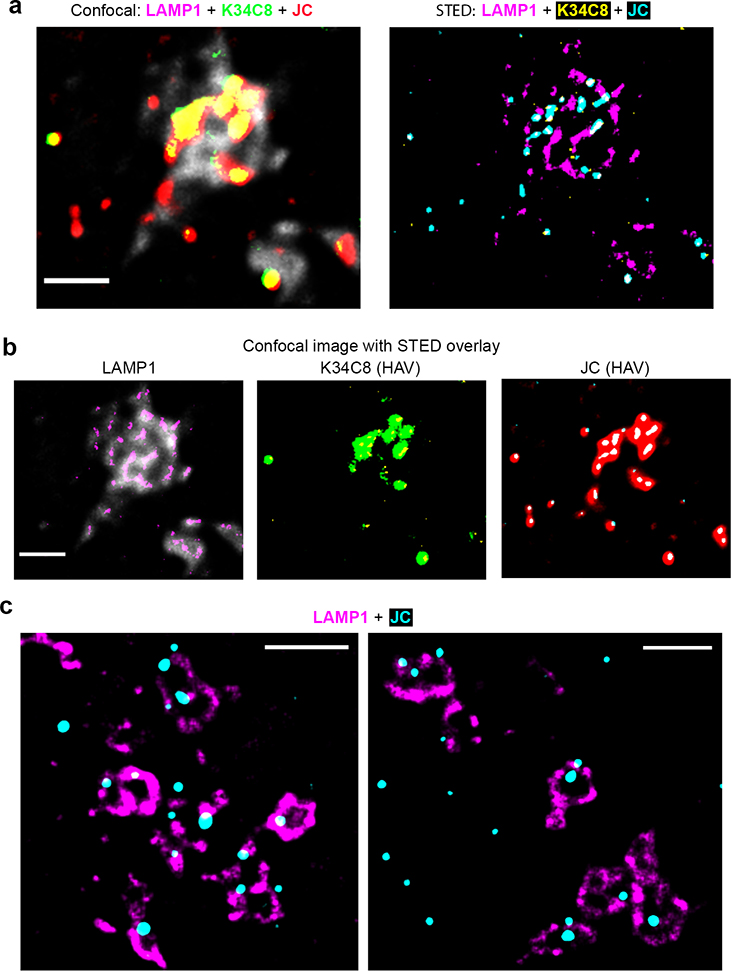
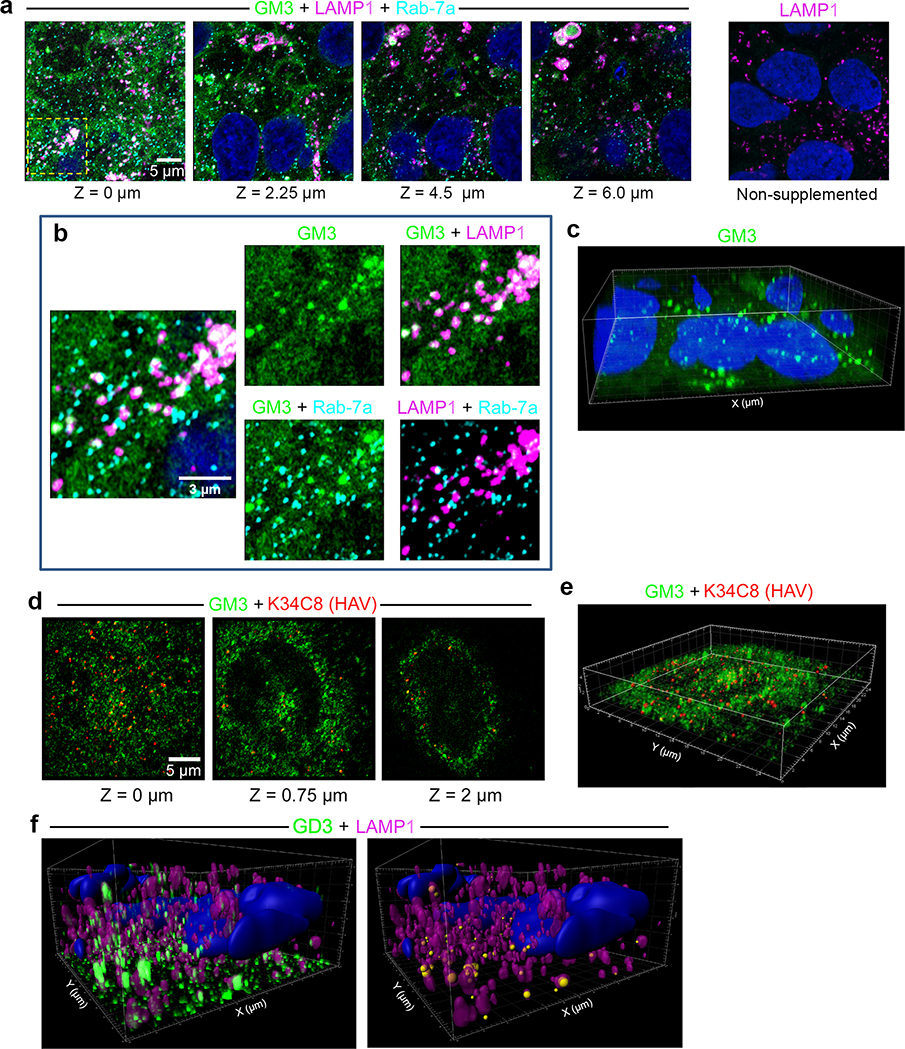
Airyscan fluorescence microscopy with 3D image reconstructions demonstrated that nHAV was internalized by 6 hpi in UGCG-KO cells, with most virus present in late endolysosomes positive for both LAMP1 and Rab-7A and a smaller proportion co-localizing only with Rab-7A (Fig. 4a–d, Extended Data Fig. 7, Supplementary Movie 1). Super-resolution stimulated emission depletion (STED) microscopy confirmed the presence of capsids within LAMP1+ endolysosomes (Extended Data Fig. 8a–c). Fewer viral particles were identified in control cells transduced with a scrambled sgRNA (sgCtrl cells), a smaller proportion of which were in LAMP1+ compartments (Fig. 4a,c,d). These data provide further evidence that gangliosides are not required for endocytosis and trafficking of naked virions to late endolysosomes, but rather act within these compartments to facilitate uncoating and/or transfer of the viral genome to the cytoplasm where it can be translated on ribosomes. Exogenously added gangliosides are known to insert into the plasma membrane via their acyl tails in a manner similar to endogenous gangliosides and are internalized by endocytosis16,19. Like endogenous gangliosides, they may then be sorted to recycling endosomes for trafficking back to the plasma membrane, or traffic to the Golgi where they undergo chemical modifications, or to lysosomes where they are degraded20. Consistent with this, both GM3 and GD3 gangliosides were detected within LAMP1+ endolysosomes following supplementation of UGCG-KO cells (Extended Data Fig. 9a–f, Supplementary Movies 2,3), explaining how gangliosides could rescue viral entry from these compartments. Importantly, confocal microscopy confirmed the presence of endogenous GD1a in LAMP1+ endolysosomes in non-supplemented Huh-7.5 cells (Fig. 4e, Supplementary Movie 4).
Figure 4.
Airyscan microscopy images of UGCG-KO1.3 and sgCtrl cells infected with gradient-purified 18f nHAV (~100 GE/cell). Virus was adsorbed to cells for 2 hrs at 37ºC, then washed off and the cells re-incubated for 4 hrs until fixed and stained with antibodies to the HAV capsid (K34C8, green, and JC, red) and the endo-lysosomal marker LAMP1 (magenta). a. (left) Maximum intensity projection of recorded Z-stack fluorescence images demonstrate fewer virus-specific puncta dually-labelled with both anti-HAV antibodies (yellow) in sgCtrl cells. (right) Related Airyscan optical sections, enlarged on the right to show the area delineated by the yellow rectangle, with smaller panels showing virus-specific (K34C8 and JC) and endolysosome-specific (LAMP1) signals. Dually-labelled virus particles are present within LAMP1+ endolysosomes. b. 3D reconstructions of virus- and endolysosome-specific signals in UGCG-KO1.3 cells. An example of post-imaging processing is shown in the far-right image with the endolysosome surface rendered from the LAMP1 signal (magenta). Viral particles dually labelled above threshold with both murine K34C8 and human JC anti-HAV antibodies are shown as spheres with diameters and centers corresponding to the magnitude and position of the fluorescent signal. Spheres with centers inside endolysosomes are colored yellow; those outside the endolysosomal surface are colored blue. Scale unit = 1 μm. c. Mean number of virus-specific puncta ±s.d. in UGCG-KO relative to sgCtrl cells. n=17 randomly selected fields from 3 independent experiments; results were normalized to puncta present in sgCtrl cells in each experiment. Statistical testing was by two-tailed Mann-Whitney test. d. Mean proportion of virus-specific puncta ±s.d. within LAMP1+ endolysosomes in UGCG-KO1.3 versus sgCtrl cells. n=15 randomly selected microscopic fields, 5 from each of 3 independent experiments. Statistical testing was by two-tailed, paired t-test. See Extended Data Fig. 10 for additional details concerning the modeling and analysis methods. e. Single Airyscan optical section of Huh-7.5 cells showing endogenous GD1a (green) and LAMP1 (magenta) detected by indirect immunofluorescence. The image is representative of 7 randomly selected fields from one experiment.
Additional evidence that gangliosides facilitate a late step in entry, following adsorption and endocytosis of virus, was provided by experiments showing that both GD1a and GD3 rescue replication when added to UGCG-KO cells as late as 6 hrs after they had been inoculated with nHAV, placed in suspension with trypsin-EDTA, washed with PBS, and replated (Fig. 3e). An eclipse assay also demonstrated that internalized virus fails to uncoat in the absence of gangliosides. Naked 18f-NLuc virus was adsorbed onto UGCG-KO or sgCtrl cells for 1 hr at 4ºC, then washed off prior to shifting cells to 37ºC (Fig. 3f, top). At periodic intervals thereafter, cells were trypsinized to remove virus adherent to the cell surface, and clarified lysates of the cells were inoculated onto naïve Huh-7.5 cells to quantify virus that had failed to uncoat. Lysates of cells that were not shifted to 37ºC contained little infectious virus, indicating that trypsinization removed most virus associated with either cell type at 4ºC (Fig. 3f, bottom). This result is consistent with naked nHAV attaching primarily to sialoglycoproteins on the cell surface, as discussed above. Crucially, between 4–12 hrs after the shift to 37ºC, more infectious (non-uncoated) virus accumulated in UGCG-KO than sgCtrl cells (Fig. 3f). These results are consistent with the greater numbers of intact capsids identified by confocal microscopy in UGCG-KO than sgCtrl cells 6 hpi (Fig. 4a–c), and support the conclusion that the virus identified by confocal microscopy within the endolysosomes of UGCG-KO cells is infectious, but unable to uncoat and initiate replication in the absence of gangliosides.
Collectively, these results show that gangliosides are essential for completion of a late step in HAV entry involving delivery of the encapsidated genome from the late endolysosome to the cytoplasm where it can be translated on ribosomes. Based on the presence of endogenous GD1a in LAMP1+ endolysosomes (Fig. 4e) and the low IC50 of GD1a in entry inhibition assays (Fig. 2d,e), GD1a appears likely to mediate this process. However, the overall contribution of GD1a to entry, versus that of other gangliosides, could be questioned because it represents only a tiny fraction of the total ganglioside complement of Huh-7.5 cells (0.6%, Fig. 2a). Ganglioside reconstitution experiments in UGCG-KO cells indicate that HAV entry is not dependent upon any one particular glycan headgroup (Fig. 2c, Extended Data Fig. 5b), and gangliosides that are less active in the inhibition experiments but more abundant in the cell may have equivalent or even greater contributions to viral entry. The lack of specificity for a specific glycan headgroup is consistent with electrostatic interactions between negatively-charged gangliosides and positively-charged regions of the capsid surface5 driving affinity for the virus.
How capsids uncoat and safely deliver their RNA contents to the cytosol is not well understood for any picornavirus, but this process is particularly enigmatic for HAV given the unusually high stability of its capsid5. We considered the possibility that the binding of gangliosides might destabilize the capsid in a fashion similar to the binding of Fab fragments of some neutralizing antibodies21, possibly triggering a conformational change leading to uncoating of the genome. However, the thermostability of infectious 18f-NLuc virus was unchanged by incubation with either GD1a or GD3 (Fig. 3g, Extended Data Fig. 5i).
Protein-linked sialylated glycans are receptors for multiple picornaviruses22,23 but, with the recent exception of porcine sapelovirus24, gangliosides have not been identified as receptors for this large virus family. Unlike sapelovirus, for which GD1a acts as a receptor on the plasma membrane, our data show that hepatovirus entry requires a ganglioside late in cell entry, within the endolysosome. Unique features of HAV, including the assembly of capsid protein pentamers driven by the C-terminal pX domain of VP1 rather than VP425,26, the exceptional stability of the capsid that is greatest at the low pH of endolysosomes5, and the lack of a requirement for the phospholipase PLA2G166, suggest that the mechanism by which HAV uncoats and transfers its genome to the cytoplasm differs from other well-studied picornaviruses that disassemble within endosomal compartments5,27. Binding to GD1a is a signal for sorting of murine polyomavirus from the endolysosome to the ER where it usurps components of the cytosolic extraction machinery to penetrate the membrane largely intact28–30. We sought evidence for the localization of HAV capsids within the ER using confocal microscopy, but observed no definitive evidence for this in sgCtrl cells. Prior studies showing that eHAV entry is associated with breaching of the lysosome membrane also make trafficking to the ER an unlikely scenario6. The pentamer structure of the HAV capsid5 likely provides a pentameric array of ganglioside binding sites similar to those found on polyomavirus capsids or in complexes of bacterial toxins that promote the penetration of these assemblies through membranes31,32. Such a model predicts that gangliosides would cluster within the endolysosomal membrane at the site of interaction with the HAV capsid, with multivalent binding enhancing the affinity of the interaction and leading to progressive deformation of the membrane31,32. Like polyomavirus, these events may initiate tunneling of the HAV capsid into and ultimately through the membrane31,33. Uncoating and genome release may then occur within the cytoplasm through interactions with cytoplasmic proteins yet to be elucidated. While radically different from other picornaviruses that disassemble in endosomes, this would be but one more example of how hepatoviruses differ from other pathogenic members of this large virus family2,5,34.
Data Availability
All data supporting the findings of this study are included in the published article or accompanying supplementary information files. MAGeCK output files with results from the two CRISPR screens are included in the Source Data Files for Fig. 1c and Extended Data Fig. 1c.
Methods
Viruses
The cytopathic, cell culture-adapted HAV variant HM175/18f10,35 (GenBank KP879216.1) and its nanoluciferase (NLuc) reporter virus derivative, HAV-NLuc6 have been described previously. HM175/18f-Tat reporter virus (hereafter 18f-Tat virus) was constructed by inserting in frame the human immunodeficiency virus (HIV-1) Tat sequence (aa 1–86, from pcDNA3.1-TAT-1–101-Flag, Addgene #35981) at the VP1pX-2B junction of pHM175/18f.2, flanked on both sides by 3Cpro cleavage sites. Infectious 18f-Tat virus was recovered from Huh-7.5 cells electroporated with in vitro synthesized RNA, and shown to induce secreted alkaline phosphatase (SEAP) expression in Huh7 LTR-SEAP reporter cells36. Naked nHAV and quasi-enveloped eHAV were isolated from supernatants and infected cell lysates, and purified by isopycnic gradient centrifugation, as described previously2,8. All nHAV and eHAV infections were carried out at a multiplicity of infection (MOI) of 1, unless specified otherwise. Human rhinovirus B14 (RV-B14) and the JFH1 strain of hepatitis C virus (HCV) were recovered from infectious molecular clones, pWR3.2637 and pJFH138, and used to infect cells at a multiplicity of 1.0 and 0.1, respectively.
Cells
H1-HeLa and human liver-derived Huh-7.5 cells39 were obtained from ATCC (Manassas, VA) and Charles Rice at Rockefeller University, respectively. HeLa-tkGFP cells were derived by transfection of H1-HeLa cells with a modified version of pLTR-SEAP36 (pLTR-tkGFP) in which the sequence of herpes simplex thymidine kinase fused to green fluorescent protein (tkGFP) was substituted for that of secreted alkaline phosphatase under transcriptional control of the HIV-1 LTR promoter. tkGFP-expressing cells were selected by growth in media containing G418 1000 μg/ml (Life Technologies) for 2 weeks with change of media every 3–4 days. Clonal cell populations were selected by limiting dilution, and assessed for GFP expression with and without 18f-Tat virus infection. A single clone (clone #7) was selected on the basis of high GFP expression in infected cells and very low background GFP fluorescence when uninfected. These cells were used for the CRISPR screen, and were maintained in G418 400 μg/ml throughout. Huh-7.5/UGCG knockout cells (UGCG-KO1.3 and UGCG-KO2.1) and Huh-7.5/ST8SIA1 knockout cells (ST8SIA1-sgx66 and ST8SIA1-sgx68) were constructed by CRISPR-Cas9 mediated gene editing, as described previously8. Following 2 weeks culture in puromycin 6 μg/ml, single cell clones were isolated by limiting dilution, expanded in puromycin, and frozen in aliquots at −80 ºC.
Reagents and antibodies
sgRNAs used to generate UGCG-KO1.3 and UGCG-KO2.1 cells were 5’ TGGAGGGAATGGCCGTCTTC 3’ and 5’ CCGGATTACACCTCAACAAGA 3’. These sgRNAs were obtained in pre-cloned lentivector constructs from Applied Biological Materials Inc., Canada (Cat# 490971110595). sgRNAs targeting human ST8SIA1-sgx66 and ST8SIA1-sgx68 cells, 5’ GAAGAGCATGTGGTATGACG 3’ and 5’ TTAGTGTATTCACTTGACAA 3’, respectively, were synthesized and cloned into lenticrisprV2 plasmid as described previously40. Ganciclovir was purchased from Invivogen (Cat# sud-gcv); miglustat (N-Butyldeoxynojirimycin-HCl) from Cayman Chemicals (Cat# 21065); and Vibrio cholera neuraminidase from Roche Diagnostics, Gmbh (Cat# 11080725001). Purified ganglioside standards were purchased from Matreya LLC: GM3 (Cat# 1503), GD3 (Cat# 1504), GM1 (Cat# 1061), GM2 (Cat# 1502), GD1a (Cat# 1062) and lactosylceramide (Cat# 1507). GM3 C11 TopFluor (Cat# 810258) was purchased from Avanti Polar Lipids Inc. NLuc GLOW Assay kit (Cat# 325) was purchased from Nanolight Technology, and the CellTiter-Glo cell viability assay kit (Cat# G7570) from Promega Corp. Alexa488-conjugated cholera toxin subunit B (Cat# C22841) was from Thermo Fisher Scientific.
Anti-HAV capsid antibodies included murine monoclonal antibodies K34C841 (CSL, Melbourne), R1021 (Absolute Antibody, Cat# Ab00933–1.1), and human polyclonal antibody JC2. Late endolysosome compartments were immunostained with rabbit anti-Rab7a (Cell Signaling, #9367), rabbit anti-LAMP1 (Cell Signaling, #9091) and mouse anti-LAMP1 (Cell Signaling, #15665). Sheep polyclonal antibody to human GD3 synthase (ST8SIA1) was obtained from R&D systems (Cat# AF6716). Mouse monoclonal anti-GD1a (clone anti-GD1a-1, #MAB5606Z) and mouse monoclonal anti-β-Actin (clone AC-74, catalog# A2228) were from Millipore Sigma, and anti-GD3 from Abcam (clone R24, #ab11779). Species-specific Alexa-fluor conjugated secondary antibodies were purchased from Thermo Fisher Scientific. Anti-mouse horseradish peroxidase (HRP)-labeled secondary antibodies were from Southern Biotech (Cat# 1010–05) and IRDye 800CW donkey anti-goat IgG from Li-Cor Biosciences (Cat# 926–32214).
Human Brunello CRISPR lentivirus knockout library
A lentivirus pool was produced by transfection of HEK293 cells with a mix of plasmid DNAs containing the Brunello plasmid library12,42 (a gift from David Root and John Doench, Addgene #73179), pVSVG (Addgene Cat#8454), and psPAX2 (Addgene Cat#12260) using the Trans-IT LT1 reagent (Mirusbio). The quantity of plasmid DNA was adjusted to obtain ~400x library coverage, as described12. Supernatant fluids were harvested 48 hrs later, passed through a 0.45 μM filter (Millipore) and stored at −80 ºC. The titer of the lentiviral pool was determined by assessing the viability of infected HeLa-tkGFP cells maintained in 3 μg/ml puromycin, with the quantity of virus resulting in ~30% cell survival 72 hpi used for subsequent large-scale screening.
Tat-tk genome-wide CRISPR screen
HeLa-tkGFP cells (clone #7) transduced with the lentivirus pool expressing the Brunello sgRNA library were selected by growth in 3 μg/ml puromycin for 1 week. Puromycin-resistant cells were infected with HM175/18f-Tat virus at an MOI of 10 in media containing 3 μg/ml puromycin and 400 μg/ml G418 for 3–4 days, until greater than 90% of the cells expressed GFP. To kill infected cells, ganciclovir (GCV) 3μM was added to the media for 1 week, with the medium changed every 3–4 days to remove dead cells. A second cycle of infection and GCV selection over another week resulted in elimination of >95% of GFP-positive cells. The surviving GFP-negative colonies were expanded in presence of the GCV, puromycin and G418 for an additional week and DNA isolated for next generation sequencing.
Next-generation DNA sequencing
Genomic DNA from GCV-selected and control (uninfected, unselected) HeLa-tkGFP library cells was isolated using the QiaAMP DNA Blood Maxi kit (Qiagen, Cat #51192). Amplicons containing sgRNA integrants were prepared for sequencing through two rounds of PCR, using the Illumina Truseq system and Q5 Hot Start High Fidelity DNA polymerase (New England Biolabs). Primers42 for the first-round PCR were specific for gRNA sequence with overhangs for the Illumina adapters (Supplementary Table 2). After 18 cycles of amplification, PCR products were gel-purified and used as template for a second-round PCR using the standard Illumina P5 and P7 primers with barcodes and sequencing adapters. Second-round PCR product were gel-purified and analyzed on a Qubit 4 fluorometer (Invitrogen), then diluted to 4 nM and pooled for sequencing. Sequencing was carried out on a MiSeq system using a 300-cycle v2 MiSeq Reagent Kit (Illumina). Libraries were denatured and diluted prior to running following the manufacturer’s protocol. At least 15 million reads were obtained from DNA isolated from unselected samples, and at least 1.5 million reads from GCV-selected samples. The resultant fastq files were analyzed using MAGeCK software43 to identify enriched sgRNA integrants, and a guide enrichment bubble plot (Fig. 1c) generated with R software version 3.5.
Protein-protein functional interaction networks
Proteins identified as candidate HAV host factors in the CRISPR screen were analyzed for potential functional interactions using STRING, version 1144.
Quantitative HAV RT-qPCR assay
Total RNA was extracted from infected cells using the RNeasy Kit (Qiagen) and used in cDNA synthesis reactions with the SuperScript III First-Strand Synthesis System (Invitrogen). Primers targeting the 5’ untranslated region of the HAV genome were used to quantify HAV RNA genome equivalents (GE) in a SYBR Green Real-Time qPCR assay (BioRad, Cat# 1725121) against a synthetic RNA standard8.
Nanoluciferase reporter assay
Cells infected with18f-NLuc virus were lysed in 1x Passive Lysis Buffer (Promega) for 5 mins at room temperature. Cell lysates were transferred to an opaque white 96 well plate (Corning Cat# 3912), mixed with 1x Oplophorus luciferase diluted in NLuc GLOW buffer (Nanolight Technologies, Cat# 325) and incubated for 3–5 mins at room temperature. NLuc luminescence was measured using a Biotek Synergy II multi-mode plate reader (BioTek Instruments, Inc.)
Ganglioside reconstitution and blocking assays
Tissue-culture treated 96-well plates were seeded with ~2 ×10⁴ UGCG-KO2.1 or sgCtrl cells one day prior to virus infection. For ganglioside supplementation experiments, the cells were fed with complete medium (10% fetal bovine serum) containing up to 50 μM gangliosides in 0.5% DMSO, or DMSO only (vehicle control), and incubated at 37 ºC for 18–24 hrs prior to infection with naked or quasi-enveloped 18f-NLuc virus at an MOI of 1. NLuc activity was measured 6 and 18 hpi. For ganglioside inhibition experiments, gradient-purified 18f-NLuc nHAV or eHAV was incubated for 1 hr at 37 ºC with various concentrations of gangliosides or DMSO vehicle control prior to being allowed to adsorb to cells for 2 hrs at 37 ºC. Following an additional 6 hrs (nHAV) or 16 hrs (eHAV) incubation, cells were harvested and assayed for NLuc activity.
Ganglioside rescue assay
UGCG-KO1.3 cells were inoculated with nHAV for 2 hrs at 37ºC, after which cells were washed with PBS, placed in suspension by treatment with trypsin-EDTA, washed twice more with PBS, and re-plated in a fresh culture vessel. Gangliosides (20 or 50 μM) or LacCer (20 μM) were added to the medium 2, 4, or 6 hrs later. Cells were lysed and assayed for NLuc activity 24 hrs after replating.
Ganglioside ELISA assay
HAV capsid binding to immobilized gangliosides was determined by modification of a previously published ELISA protocol2. Gradient-purified nHAV (108 to 1010 GE) diluted in PBS buffered to pH 5.5 or 7.4 was incubated in plastic ELISA strips pre-coated with selected gangliosides (Lipid Snoopers®, Avanti Polar Lipids, Inc.) overnight at 4 ºC. After multiple PBS washes, bound virus was detected by sequential incubations with monoclonal R10 anti-HAV antibody (1:4000) and HRP-labeled secondary antibody (1:4000). The Really Useful Buffer Kit (Molecular Dimensions, Cat# MD2–101) was used to establish different pH conditions for determining the optimal pH for capsid binding to gangliosides.
Enzymatic and chemical inhibition of viral entry
Huh-7.5 cells pre-treated with V. cholerae neuraminidase at 37ºC for 1 hr prior to infection with 18f-nLuc nHAV. Neuraminidase was maintained in the medium during adsorption of the virus (2 hrs) and for 4 hrs thereafter until cells were lysed for NLuc assay. To inhibit ganglioside synthesis, Huh-7.5 cells were pre-treated with miglustat (N-butyl-deoxynojirimycin), dissolved initially in DMSO at 10 mg/mL and used at final concentrations of 0.625 μM to 400 μM, for 72 hrs at 37ºC prior to infection. Cells were inoculated with 18f-NLuc nHAV or eHAV (~1000 GE/cell) for 2 hrs at 37ºC, lysed and assayed for NLuc activity after 4–6 hrs to measure viral entry or after 16 hrs to assess viral replication. For trypsin treatment, Huh-7.5 cells were pretreated with 10 μg/ml trypsin for 30 min at 37ºC prior to infection. Cells were washed with PBS to remove trypsin, and inoculated with18f-NLuc nHAV (~1000 GE/cell) for 1 hr at 37ºC followed by cell lysis after 5 hrs to measure NLuc activity.
Sample preparation for immunofluorescence microscopy
Control Huh-7.5 and UGCG-KO1.3 cells were plated in 35mm glass bottom dishes with 14mm bottom wells (Cellvis, Cat# D35–14-1.5-N) 24 hrs prior to inoculation with naked HM175/18f virus (~100 GE/cell). Virus was allowed to adsorb for 2 hrs at 37ºC, followed by multiple washes with PBS to remove unbound virus, then incubated for an additional 4 hrs at 37 ºC. At 6 hpi, cells were fixed with 4% paraformaldehyde for 15 mins, washed twice with PBS and incubated with blocking/permeabilization solution containing 5% goat serum and 0.1% saponin in PBS for 1 hr at room temperature. Cells were then dually stained with murine monoclonal K34C8 antibody (1:300), that recognizes only fully assembled HAV capsids, and human polyclonal JC anti-HAV antibody (1:600) that recognizes 14S pentamer subunits and possibly non-assembled capsid proteins as well as fully assembled capsids45,46. Where indicated, endolysosme compartments were labelled with rabbit anti-LAMP1 (1:400) (Cell Signaling, #9091) or with a combination of rabbit anti-Rab-7a (1:100) (Cell Signaling, #9367) and mouse anti-LAMP1 (1:400) (Cell signaling, #15665). To visualize endogenous GD1a, Huh-7.5 cells were fixed and incubated overnight (13–15hrs) with a combination of rabbit anti-LAMP1 (1:400) and mouse anti-GD1a (1:50) (Millipore #MAB5606Z). For visualization of supplemented GM3 and GD3, UGCG-KO1.3 cells were incubated overnight (13–15 hrs) with C11 GM3-TopFluor (100 ng/ml) conc or GD3 standard (50μM). GD3 was detected using 1:100 dilution of rabbit anti-GD3 (Abcam, clone R24, #ab11779). Naked virus capsids in GM3-TopFluor supplemented cells were visualized by immunostaining with human polyclonal JC antibody (1:600). All primary antibodies and their matching species-specific Alexa fluor conjugated secondary antibodies were diluted in PBS supplemented with 1% BSA and 0.1% saponin and incubated for 1 hr at room temperature. Excess antibodies were removed by three washes with PBS containing 0.05% saponin, and nuclei counterstained with DAPI or Hoechst 33342 (1:2000) (Invitrogen) for 5 mins at room temperature. After two additional washes with PBS containing 0.05% saponin, cells were covered in 1ml PBS and directly visualized under a confocal microscope as described below.
Airyscan immunofluorescence microscopy
Imaging data were recorded in super resolution mode on a laser-scanning confocal Zeiss 880 microscope (Carl Zeiss AG, Oberkochen, Germany) equipped with an Airyscan detector and controlled by Zen Blue 3.0 software. The microscope was mounted on a Zeiss Inverted Axioobserver Z1 base equipped with a Definite Focus unit to ensure focus plane stability. The Plan-Apochromat 63X/1.40 Oil DIC M27 objective (Zeiss) was used for all imaging. For each image plane, fluorescence signals were recorded sequentially at different wavelengths using appropriate laser excitation and filter sets: for DAPI/ Hoechst excitation, 405nm, emission filter BP 420–480 + BP 495–550; for Alexa488 excitation, 488nm, emission filter BP 420–480 + BP 495–550; for Alexa568/594 excitation, 561nm, emission filter BP 420–480 + BP 495–620; and for Alexa647 excitation − 633nm, emission filter BP 570–620 + LP 645. Fields of view were selected randomly maintaining identical imaging conditions for control and UGCG-KO cells in each experiment. The number of X-Y pixels on the frame was set to “optimal” in the Zeiss software controller, with XY pixel size between 0.043 – 0.05 μm. The distance between images in Z direction during Z-stack recording was 0.160 μm. Images were recorded with 16-bit depth.
Fields of view were selected randomly for recording maintaining identical imaging conditions for sgCtrl and UGCG-KO cells in each experiment. Immediately after recording, the raw data was processed by Zen Blue software (version 3.0) to produce a super-resolution image. The Airyscan super-resolution recording enables enhancement of resolution in all directions by a factor of 1.7.
Post-imaging analyses
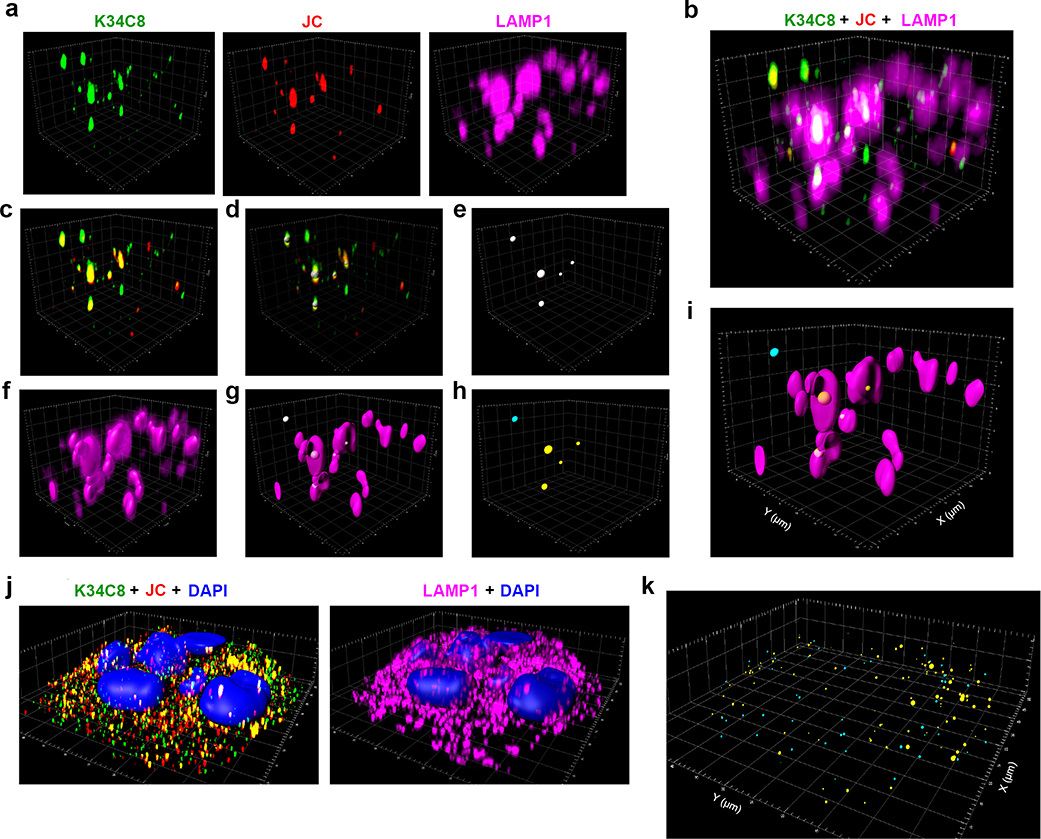
No enhancement or averaging of image resolution, or intensity enhancement of selected channels, or non-linear adjustments were used during image processing and analysis. Recorded Airyscan super-resolution images were analyzed using ImageJ (version 2.0.0-rc-69/1.52o) and 3D reconstructions produced using Imaris software (version 9.3, Bitplane, Zurich, Switzerland) (Extended Data Fig. 10). Threshold fluorescent signals specific for virus detection were determined by analyzing images of mock-infected cells labelled with antibodies in a manner identical to infected cells. To enhance the specificity of detection, only puncta with both K34C8 (Alexa488) and JC (Alexa568) fluorescence above threshold levels were considered to represent native HAV capsids. To identify the position of virus particles within 3D reconstructions, native HAV capsids (with both K34C8 and JC fluorescence) were displayed as spheres with their center positioned at the point of maximum signal intensity and their diameter proportional to signal volume and intensity. The positions and shapes of endolysosomes were identified by rendering the 3D surface from the fluorescence signal generated with LAMP1 antibody. The Matlab (MathWorks, Natick, MA) extension within the Imaris software package was used to classify viral puncta as completely or partially within versus outside endolysosomes.
Stimulated Emission Depletion (STED) Microscopy
STED microscopy images were acquired with a Leica super-resolution STED 3X/FALCON/FCS microscope equipped with a 100 × 1.4 NA HC PL APO CS2 oil immersion objective. The sample preparation was similar to that for confocal microscopy except for omitting the staining of nuclei. Before imaging, the samples were covered with a water-based mounting media Fluoromount-G (Southern Biotech). To visualize the fluorescence signals from Alexa-594 and Alexa-647, samples were sequentially excited with a tunable white light laser at the appropriate wavelength, with the STED laser set at 775 nm for depletion. A combination of white laser at 488nm and STED laser at 596 nm was employed for visualizing Alexa-488. Corresponding confocal images were taken in the standard confocal mode immediately prior to collecting STED images.
SDS-PAGE and immunoblotting
Approximately 106 Huh7.5 sgCtrl and ST8SIA1-KO cells were lysed in radioimmunoprecipitation assay (RIPA) buffer (Cat# 20–188, Millipore) for 20 min on ice and clarified by centrifugation at 14,000xg for 10 min at 4 ºC. Lysate was mixed with 4x Laemmli buffer, incubated at 95 ºC for 5 min, and resolved in a 4–15% gradient SDS-polyacrylamide pre-cast gel (Cat#4561086, BioRad). Proteins were transferred to a polyvinylidene fluoride (PVDF) membrane by semi-dry transfer using the Transblot Turbo apparatus (BioRad). Membranes were blocked in Odyssey Blocking Buffer (LI-COR Biosciences) and probed with a 1:350 dilution of anti-ST8SIA1 antibody (R&D systems) overnight. The membrane was washed with 0.05% Tween 20 and probed with a 1:10,000 dilution of donkey anti-goat secondary antibody conjugated with IR-Dye 800 (LI-COR Biosciences) for 1 hr at room temp. Excess secondary antibody was removed by washing with 0.05% Tween 20 and protein bands visualized using an Odyssey Infrared Imaging System (LI-COR Biosciences).
Flow cytometry
Approximately 106 dissociated sgCtrl and UGCG-KO cells (~106) were washed twice with fluorescence-activated cell sorting (FACS) buffer (1x PBS, 0.2% sodium azide, and 1% FBS) and transferred to the wells of a 96 well U-bottom plate, then incubated with 1:200 dilution of Alexa-488 conjugated Cholera toxin subunit B (diluted in FACS buffer) for 1 hr on ice in the dark. As an isotype control, sgCtrl cells were separately incubated with 1:200 dilution of Alexa 488 anti-rabbit antibody (Thermo Scientific) for 1 hr on ice. Following three washes with FACS buffer, cells were passed through a 35 μm cell strainer attached to a 5 ml polystyrene tube to prevent clumping (#352235, BD Biosciences). All samples were kept on ice until subjected to flow cytometry using a FACSCalibur cytometer (BD Biosciences). Data were analyzed with FlowJo 9.9.6 software (BD Biosciences).
Extraction of gangliosides from Huh-7.5 cells
Gangliosides were extracted from cultured cells as previously described47, with minor modifications. Briefly, 6–8 ×10⁶ cells were pelleted by low-speed centrifugation and resuspended in 750 μL LC-MS grade water (Fisher Scientific) and homogenized using a Precellys Evolution homogenizer (Bertin Technologies) at 6,800 rpm for 30 secs in 2 cycles. The homogenate was added to 2 mL LC-MS grade methanol (Fisher Scientific) and 1 mL HPLC grade chloroform (Fisher Scientific). The mixture was centrifuged at 2,500 rpm at room temperature for 15 mins. The supernatant was collected and mixed with 650 μL of LC-MS grade water. The mixture was centrifuged once again at 2,500 rpm at room temperature for 15 mins. The upper layer thus formed was collected and dried under a stream of nitrogen gas.
AminoxyTMT labeling of gangliosides
Gangliosides equivalent to 100 μg of protein from Huh-7.5 cell lysates were oxidized using mild periodate oxidation and labeled with aminoxyTMT 6-plex reagent (Thermo Scientific Pierce) as previously described15. Briefly, gangliosides were reconstituted in 250 μL of oxidation buffer (0.1 M sodium acetate/acetic acid, pH ~5.5) and added to 12.5 μL of 1 mM sodium metaperiodate (NaIO4) in oxidation buffer. The mixture was incubated on ice for 1 hr in the dark before quenching with 2.5 μL of 100 mM aqueous glycerol and further incubation for 1 hr on ice. The mixture was then subjected to C18 solid-phase extraction and the eluates collected, dried under a stream of nitrogen gas, and labelled with aminoxyTMT following the manufacturer’s instructions with minor modifications15. Briefly, the labeling reagent was dissolved in 200 μL of 95% methanol with 0.1% acetic acid, vortexed, and mixed with oxidized gangliosides for 10 min at room temperature. The solvent was removed under vacuum followed by redissolving the sample in 200 μL of 95% methanol and vortexing for 10 min to ensure complete labeling. Thereafter, the sample was dried under nitrogen. Excess labeling reagent was scavenged by adding 100 μL of 10% acetone in 95% methanol/water, pooled, dried under nitrogen, and finally reconstituted in LC-MS mobile phase.
RPLC-MS/MS analysis of aminoxyTMT-labeled gangliosides
A binary Vanquish UHPLC system (Thermo Scientific) coupled with Q Exactive HF (Thermo Scientific) was employed for RPLC-MS/MS analysis. For chromatographic separation, a Cortecs C18 column (2.6 mm i.d. × 100 mm, 1.6 μm) (Waters) and the following mobile phases were used: A (60/40 acetonitrile/water with 10 mM ammonium formate and 0.1% formic acid), and B (90/10 isopropanol/acetonitrile with 10 mM ammonium formate and 0.1% formic acid). The gradient was 30% B (0 min), 50% B (1 min), 70% B (7 min), 99% B (13 min), 30% B (13.1 min), and column equilibration for an additional 2 min at 30% B. The column was maintained at 40 °C and a flow rate of 350 μL/min. The injection volume was 5.0 μL. The QExactive HF was operated using a heated electrospray ionization (HESI) source in positive ion mode at the following settings: spray voltage 3.0 kV, vaporizer temperature 400 °C, sheath gas 20 au, auxiliary gas 5 au, sweep gas 1 au, ion transfer capillary temperature 350 °C, S-lens rf voltage 50 V, and resolution 120,000. Fragmentation of TMT-labeled gangliosides was performed using parallel reaction monitoring (PRM) from a predetermined inclusion list of different d18:1 ganglioside species. The following settings were used for HCD fragmentation: maximum injection time 100 ms, automatic gain control (AGC) 1 × 10⁵, and resolution 15,000. Raw data files were acquired and processed in XCalibur 2.2 (Thermo Scientific). For aminoxyTMT-labeled gangliosides, manual inspection of MS/MS fragmentation for each target species in the PRM list was performed to validate identity of the gangliosides and to extract reporter ion intensities. The reporter ion intensities served as the surrogate measure of ganglioside concentration in each channel. Confident identification of gangliosides was based on retention time compared to known ganglioside standards, accurate mass (<5.0 ppm error), and MS/MS fragmentation as described previously15.
Purity of commercially procured gangliosides
GM3, GD3 and GD1a ganglioside standards (Matreya LLC) were prepared as stock solutions in dimethyl sulfoxide (DMSO) and successively diluted in acetonitrile/2-propanol/water (65/35/5, v/v) containing 10 mM ammonium formate and 0.1% formic acid to a final concentration of 250 μM. For GM3 and GD3 standards, 2000 pmol of this mixture was injected on-column (Cortecs C18) and analyzed using an LTQ Orbitrap XL (Thermo Scientific) coupled with Ultimate 3000 RSLC (Thermo Scientific); for GD1a, 200 pmol was injected on column and analyzed using QExactive HF coupled with the Vanquish LC system. All analyses were carried out in negative ionization mode and used the same gradient as described above. All extracted ion chromatograms (EIC’s) were processed using 10.0 ppm mass accuracy filter in XCalibur 2.2 (Thermo Scientific).
Statistics and Reproducibility
Unless otherwise noted, statistical comparisons were done by t-test or two-way ANOVA. Statistical calculations were made using Prism 6.0 for Mac OS X (GraphPad Software). All data shown as technical replicates from a representative experiment were confirmed in at least one additional biologically independent experiment.
Extended Data
Extended Data Fig. 1.
Genome-wide CRISPR screen for essential hepatovirus host factors.
a. Frequency distribution of the number of reads mapping to individual sgRNA integrants in high-throughput sequencing of control (GCV-treated) versus selected (18f-Tat virus-infected and GCV treated) HeLa-tkGFP cells transduced with lentiviruses expressing the Brunello sgRNA library in the first of two independent screens (screen #1). b. Number of reads (log2) mapping to individual sgRNAs in control versus selected cells in screen #1. The total number of individual sgRNAs to which reads mapped is shown at the bottom. c. Scatterplot showing correlation of the positive selection scores accorded genes (n=19,111) on the basis of sgRNA enrichment in two independent screens. Red symbols indicate genes related to NeuNAc or ganglioside synthesis. Spearman’s rank correlation coefficient r=0.267, p < 0.0001. d. STRING analysis of functional associations of proteins encoded by genes comprising the top 39 hits identified in the combined analysis of the two independent screens. Common associations are annotated. Protein-protein interaction enrichment p-value = 3.11 ×10⁻¹⁵. e. Normalized counts of reads mapping to sgRNAs targeting selected genes involved in ganglioside synthesis (see main manuscript Fig. 1c) in control versus selected cell populations.
Extended Data Fig. 2.
Miglustat inhibition of gradient-purified naked and quasi-enveloped hepatovirus infection.
a. (top) Schematic showing the organization of the HM175/18f-NLuc virus genome, and (bottom) distribution of viral RNA associated with naked and quasi-enveloped eHAV 18f-NLuc virions from supernatant fluids of infected cells in fractions of an isopycnic iodixanol gradient. b. Miglustat inhibition of naked 18f-NLuc virus replication. Data shown are mean NLuc expression in Huh-7.5 cells pre-treated with miglustat for 72 hrs prior to infection, and lysed and assayed for NLuc activity 18 hrs after infection. n= 3 technical replicates. The estimated 50% inhibitory concentration (IC50) was 44.5 μM (95% CI = 29.8–66.0) using a four-parameter, variable slope nonlinear regression model (R=0.900). c. NLuc activity expressed by Huh-7.5 cells 18 hrs after infection with naked (nHAV) or quasi-enveloped (eHAV) virus. Cells were treated with the indicated concentration of miglustat beginning 72 hrs prior to infection. Data shown are means of 3 technical replicates. d. ATP assay for viability of Huh7.5 cells treated with indicated concentrations of miglustat for 72 hrs (CellTiter-Glo, Promega). Data shown are means of 4 technical replicates.
Extended Data Fig. 3.
Characterization of clonal UGCG-KO cell lines generated with two different sgRNAs.
a. Schematic showing exons (boxed segments, translated region deeply shaded) and introns (horizontal lines) in the UGCG gene. Chromatograms obtained by Sanger sequencing of the indicated regions of UGCG in the Huh-7.5 sgCtrl and two UGCG-knockout clones, KO1.3 (exon 1) and KO2.1 (exon 2). The locations of indels disrupting the open reading frame and resulting in truncated protein expression are highlighted in red. The AUG codon in the first exon at which translation originates is highlighted in green. b. Detection of GM1 ganglioside on the surface of sgCtrl, UGCG-KO1.3 and UGCG-KO2.1 cells by flow cytometry using Alexa-488 fluorophore conjugated cholera toxin (CtB). Isotype indicates parallel staining with an Alexa-488 conjugated anti-mouse secondary antibody. Absence of detectable GM1 ganglioside on the surface confirmed both clones are functional knockouts of ganglioside synthesis. Data representative of two independent experiments. c. Laser-scanning confocal images of HAV antigen (K24F2 mAb, green) in sgCtrl and UGCG-KO1.3 cells 5 days after inoculation with naked (nHAV) and quasi-enveloped (eHAV) HM175/18f virus confirm a lack of replication in the knockout cells. Images shown are representative of 3 random fields in one experiment. Scale bar = 10 μm. d. Mean human rhinovirus B14 (RV-B14) RNA abundance measured by real-time RT-PCR in sgCtrl and UGCG knockout cells at the indicated times post infection. n=2 technical replicates. e. Mean hepatitis C virus (HCV) RNA abundance measured by real-time RT-PCR (normalized to actin mRNA) in sgCtrl and UGCG knockout cells at 16 and 64 hrs after infection with JFH1 virus. n= 2 technical replicates.
Extended Data Fig. 4.
Mass spectrometry identification of gangliosides present in Huh-7.5 cells.
a. Extracted ion chromatograms (EIC) of GM2 ganglioside species showing their elution order.
b. Representative ESI-MS spectrum of gangliosides showing the accurate mass of [M+2H]2+ precursor ion of GM2 d18:1/16:0. c. Fragmentation of precursor ion (shown in b) at NCE=26 in QExactive HF. The inset shows TMT6 reporter ion region and the respective channel assignments. Identification of each ganglioside species is based on the presence of diagnostic B1, O”, and Y0’ ions. Only 14 gangliosides in Huh-7.5 cells passed these criteria (shown in d). d. Mean relative intensities ±s.e.m. of gangliosides detected by ESI-MS in 3 independent samples of Huh-7.5 cells treated with 50 or 200 μM miglustat, each with two technical replicate analyses (4 for control samples). e. Mean relative abundance ±s.e.m. of multiple GM2 ganglioside species with varying lengths of fatty acyl tail detected by ESI-MS in 3 independent samples of Huh-7.5 cells treated with miglustat at the indicated concentration. Each sample was subjected to 2 replicate ESI-MS analyses (4 for control samples). Note that the maximum concentration of miglustat used in these experiments was over 20-fold the clinical plasma Cmax of Zavesca® (miglustat) which is approximately 9 μM [European Medicines Evaluation Agency, Scientific Discussion, 2005, https://www.ema.europa.eu/en/documents/scientific-discussion/zavesca-epar-scientific-discussion_en.pdf, accessed 28 February, 2020].
Extended Data Fig. 5.
Ganglioside supplementation of UGCG-KO cells.
a. Mean fold-change in viral RNA between 6 and 24 hrs in sgCtrl cells or UGCG-KO cells supplemented with 50 μM GD3 or vehicle (DMSO) for 24 hrs prior to infection with nHAV (left) or eHAV (right). Results are normalized to DMSO-treated cells at 6 hrs. n=2 technical replicates. b. Mean NLuc activities in UGCG-KO2.1 cells supplemented with gangliosides (12.5–50μM) for 24 hrs prior to 18f/NLuc nHAV infection. sgCtrl cells were infected without supplementation. Cells were harvested for NLuc assay at 6 hpi. n=3 technical replicates. c. Mean NLuc activity 18 hrs after nHAV infection of UGCG-KO1.3 cells supplemented with GM3, GD3 or GM2. n=3 technical replicates. d. Mean relative NLuc activities ±s.d. in UGCG-KO2.1 cells supplemented with GM3 or GD3 (20–50 μM) 18 hrs after infection with nHAV (n=5 independent experiments) or eHAV (n=3 independent experiments). NLuc activities were normalized to GM3 supplementation (100 light units) in each experiment. Statistical comparison was by one-way ANOVA with Holm-Sidak’s multiple comparison test. e. Mean NLuc activity in Huh-7 cells 6 hrs after infection with nHAV pre-incubated with GM3, GM2 or GM1. n=6 technical replicates. f. Immunoblot of ST8SIA1 (GD3 synthase, arrow) in lysates of polyclonal ST8SIA1-KO cells generated with different sgRNAs and sgCtrl cells. Actin included as a loading control. Data are from a single experiment. g. Mean NLuc activities in ST8SIA1-KO cells 6 and 24 hrs after 18f/NLuc nHAV infection. n=4 technical replicates from one of 2 experiments with similar results. h. (left) Binding of eHAV to UGCG-KO1 vs. sgCtrl cells at 4ºC for 1 hr. Bars are means of n=3 technical replicates. (right) Uptake of eHAV by UGCG-KO1 vs. sgCtrl cells following 2 hrs adsorption, removal of the inoculum, and 4 hrs additional incubation at 37ºC. Bars are means of n=2 technical replicates i. Thermostability of 18f-NLuc nHAV following overnight incubation with 50 μM GD3 or DMSO at pH 5.5 and 4ºC, followed by additional incubation at the temperature indicated for 15 min prior to inoculation onto Huh-7.5 cells. NLuc normalized to virus incubated for 15 min at 37ºC; lines reflect means of n=2 technical replicates. All results shown as technical replicates were confirmed in independent experiments.
Extended Data Fig. 6.
Purity of commercial ganglioside standards.
a. Compositional analysis of the GM3 standard using RPLC-ESI-HRMS. Extracted ion chromatograms (plotted with 10 ppm tolerance within the expected m/z value) of individual ganglioside molecular species are shown for the GM3 standard on the left, with the results of monitoring for potential ganglioside impurities to the right.The absence of GD3 and GD1a species in the GM3 standard was confirmed by monitoring for each species with no corresponding peaks observed. b. Similar analysis of the GD3 standard. A trace amount of GM3 (<1.2%) was detected in the GD3 standard, along with a greater quantity of GD1a as an impurity (~7%). c. GD1a standard. A trace amount of GD3 was detected as an impurity in GD1a (~0.2%), whereas the absence of GM3 species in the GD1a standard was confirmed by monitoring for the species with no corresponding peaks observed. NL: normalized level, i.e. peak intensity. Impurities were calculated from the ratio of summed intensity, assuming similar ionization efficiency between different ganglioside molecular species. Data from one of 2 replicate runs generating similar results for each commercial standard.
Extended Data Fig. 7.
Endolysosomal location of HAV capsids in UGCG-KO1.3 cells.
a. Airyscan microscopic image of 18f-infected UGCG-KO1.3 cells labelled with antibodies to Rab-7a (green), HAV (JC, red) and LAMP1 (magenta). Virus was adsorbed to cells for 2 hrs at 37 ºC, which were then washed with PBS and reincubated at 37 ºC for 4 hrs prior to fixation. Scale bar = 10 μm. b. Expanded view of the area bordered by the yellow rectangle in panel (a) demonstrating that most HAV capsids are localized within endolysosomes staining for Rab-7a+ and/or LAMP1+. The arrows indicate capsids present in late endosomes staining only for Rab-7a. Scale bar = 3 μm. c. Single and dual fluorescence signals present in the image shown in panel (b). Scale bar = 3 μm. Images are representative of findings in two independent experiments with similar results.
Extended Data Fig. 8.
Super-resolution stimulated emission depletion (STED) microscopy imaging of HAV-infected UGCG-KO1.3 cells.
a. Comparative (left) conventional confocal microscopic image versus (right) STED image of the same field of cells. 18f virus was allowed to adsorb to cells for 2 hrs at 37º then washed off and the cells incubated for an additional 4 hrs before being fixed and labelled with antibodies to LAMP1 (confocal: grey; STED: magenta) and HAV: K34C8 mAb (confocal: green; STED: yellow) and JC polyclonal human convalescent antibody (confocal, red; STED, cyan). Large confocal puncta with high intensity fluorescence are resolved into multiple individual particles by STED. b. Overlays of confocal and STED signals for (left) LAMP1, (center) K34C8, and (right) JC from the images shown in panel (a). c. STED microscopy demonstrates that most virus particles inside endolysosomes are in close proximity to the luminal membrane surface. STED images shown are representative of 7 randomly selected cells in one experiment and confirm findings made by conventional confocal microscopy. All scale bars = 1 μm.
Extended Data Fig. 9.
Intracellular distribution of GM3 following supplementation of UGCG-KO1.3 cells.
a. Cells were incubated with GM3 conjugated at C11 to dipyrrometheneboron difluoride undecanoic acid (GM3-TopFluor, green) for 15 hr at 37 ºC, then fixed and labelled with anti-LAMP1 (magenta) and anti-Rab-7a (red). Airyscan images from left to right show four optical sections along the Z-axis and demonstrate GM3-TopFluor within cells. At the far right, non-supplemented cells stained with anti-LAMP1 show no green fluorescence. b. Enlarged images of the area bounded by the yellow rectangle in panel (a) showing TopFluor within Rab-7a+ late endosomes and LAMP1+ endolysosomes. Some endolysosomes are labelled with antibodies to both LAMP1 and Rab-7a. c. 3D reconstruction of GM3-TopFluor and DAPI (nucleus) fluorescence signals in the images shown in panel (a). d. UGCG-KO1.3 cells were incubated with GM3-TopFluor (green) for 13 hr, then infected with nHAV virus for 2 hr, washed and re-incubated for 4 hrs before being fixed and labelled with anti-HAV antibody (K34C8, red). Optical sections recorded along the Z-axis demonstrate relative positions of HAV and GM3-TopFluor. e. 3D reconstruction of the image shown in panel (d) (see also Supplementary Movie 2). f. (left) Imaris 3D reconstruction of GD3 fluorescence signals in uninfected UGCG-KO1.3 cells supplemented with exogenous GD3 and stained with anti-GD3 antibody. The surface of endolysosomes is reconstructed from the LAMP1 signal. (right) GD3 fluorescent signal is rendered as spheres with diameter proportionate to intensity, centered at the point of maximum intensity, colored according to whether it is inside (orange) or outside (yellow) LAMP1+ endolysosomes. Images shown are representative of two independent experiments with similar results.
Extended Data Fig. 10.
Imaris analysis and 3D reconstruction of Airyscan microscopy images.
a. A small area within the fluorescence image of infected UGCG-KO1.3 cells recorded on the Zeiss-880 microscope with the Airyscan detector, showing the signals in individual channels for HAV capsid antibodies, K34C8 (green) and JC (red), and antibody to LAMP1 (magenta). b. Merged signals from panel (a). c. Merged signals from the two capsid antibodies, K34C8-Alexa488 and JC-Alexa594. To enhance the specificity of virus detection, only particles labelled simultaneously with both antibodies above threshold were included in the analysis. d. The positions of viral particles identified by labeling with both antibodies were modeled as spheres, with their center positioned at the point of maximum signal intensity, and their diameter proportional to the intensity and size of the fluorescence signal. e. Spherical representation of dually-labelled virus particles as in panel (d). f. Surface of LAMP1+ endolysosomes reconstructed from the LAMP1 antibody signal. g. Merged image of viral particles modeled as spheres and LAMP1+ endolysosomes. h. The Matlab extension in the IMARIS software package was used to analyze the coordinates of the virus particles and to segregate them into two groups: one in which the center was inside or on the surface of endolysosomes (yellow spheres), and another in which the center was outside of endolysosomes (blue spheres). i. Merged image after reconstruction and analysis. j. Full-field fluorescence images of (left) HAV capsids and (right) LAMP1+ endolysosomes with DAPI staining of nuclei in infected UGCG-KO cells. k. Results of the viral particle localization analysis showing segregation of particles into groups by color within the full-field image shown in panel (j). See also Extended Data Movie 1. Airyscan images and 3D reconstructions are representative of three independent experiments showing similar results.
Supplementary Material
Acknowledgements
The authors thanks Ken Jacobson for helpful discussions. This work was supported in part by grants from the U.S. National Institutes of Health: R01-AI103083, R01-AI131685 and R01-AI150095 (SML), R01-DK123499 (QZ), R01-GM134531 (MK), and T32-GM007092 (RM).
Footnotes
Competing Interest Declaration. The authors declare no competing interests.
Supplementary Information. Additional information available online include MAGeCK output files (see Source Data Files for Fig. 1c and Extended Data Fig. 1c), Supplementary Tables 1–2 and Supplementary Movies 1–4.
References
- 1.Zell R Picornaviridae-the ever-growing virus family. Arch Virol 163, 299–317 (2018). [DOI] [PubMed] [Google Scholar]
- 2.Feng Z, Hensley L, McKnight KL, Hu F, Madden V, Ping L, Jeong S-H, Walker C, Lanford RE & Lemon SM A pathogenic picornavirus acquires an envelope by hijacking cellular membranes. Nature 496, 367–371 (2013). [DOI] [PMC free article] [PubMed] [Google Scholar]
- 3.Hirai-Yuki A, Hensley L, McGivern DR, Gonzalez-Lopez O, Das A, Feng H, Sun L, Wilson JE, Hu F, Feng Z, Lovell W, Misumi I, Ting JP, Montgomery S, Cullen J, Whitmire JK & Lemon SM MAVS-dependent host species range and pathogenicity of human hepatitis A virus. Science 353, 1541–1545 (2016). [DOI] [PMC free article] [PubMed] [Google Scholar]
- 4.Hirai-Yuki A, Hensley L, Whitmire JK & Lemon SM Biliary secretion of quasi-enveloped human hepatitis A virus. mBio 7, e01998–01916 (2016). [DOI] [PMC free article] [PubMed] [Google Scholar]
- 5.Wang X, Ren J, Gao Q, Hu Z, Sun Y, Li X, Rowlands DJ, Yin W, Wang J, Stuart DI, Rao Z & Fry EE Hepatitis A virus and the origins of picornaviruses. Nature 517, 85–88 (2015). [DOI] [PMC free article] [PubMed] [Google Scholar]
- 6.Rivera-Serrano EE, Gonzalez-Lopez O, Das A & Lemon SM Cellular entry and uncoating of naked and quasi-enveloped human hepatoviruses. eLife 8, e43983 (2019). [DOI] [PMC free article] [PubMed] [Google Scholar]
- 7.Kaplan G, Totsuka A, Thompson P, Akatsuka T, Moritsugu Y & Feinstone SM Identification of a surface glycoprotein on African green monkey kidney cells as a receptor for hepatitis A virus. EMBO Journal 15, 4282–4296 (1996). [PMC free article] [PubMed] [Google Scholar]
- 8.Das A, Hirai-Yuki A, Gonzalez-Lopez O, Rhein B, Moller-Tank S, Brouillette R, Hensley L, Misumi I, Lovell W, Cullen JM, Whitmire JK, Maury W & Lemon SM TIM1 (HAVCR1) Is not essential for cellular entry of either quasi-enveloped or naked hepatitis A virions. MBio 8 (2017). [DOI] [PMC free article] [PubMed] [Google Scholar]
- 9.Das A, Maury W & Lemon SM TIM1 (HAVCR1): an essential “receptor” or an “accessory attachment factor” for hepatitis A virus? J Virol 93 (2019). [DOI] [PMC free article] [PubMed] [Google Scholar]
- 10.Lemon SM, Murphy PC, Shields PA, Ping LH, Feinstone SM, Cromeans T & Jansen RW Antigenic and genetic variation in cytopathic hepatitis A virus variants arising during persistent infection: evidence for genetic recombination. J Virol 65, 2056–2065 (1991). [DOI] [PMC free article] [PubMed] [Google Scholar]
- 11.Tomicic MT, Thust R & Kaina B Ganciclovir-induced apoptosis in HSV-1 thymidine kinase expressing cells: critical role of DNA breaks, Bcl-2 decline and caspase-9 activation. Oncogene 21, 2141–2153 (2002). [DOI] [PubMed] [Google Scholar]
- 12.Doench JG, Fusi N, Sullender M, Hegde M, Vaimberg EW, Donovan KF, Smith I, Tothova Z, Wilen C, Orchard R, Virgin HW, Listgarten J & Root DE Optimized sgRNA design to maximize activity and minimize off-target effects of CRISPR-Cas9. Nat Biotech 34, 184–191 (2016). [DOI] [PMC free article] [PubMed] [Google Scholar]
- 13.Groux-Degroote S, Guerardel Y & Delannoy P Gangliosides: Structures, Biosynthesis, Analysis, and Roles in Cancer. Chembiochem 18, 1146–1154 (2017). [DOI] [PubMed] [Google Scholar]
- 14.van der Spoel AC, Mott R & Platt FM Differential sensitivity of mouse strains to an N-alkylated imino sugar: glycosphingolipid metabolism and acrosome formation. Pharmacogenomics 9, 717–731 (2008). [DOI] [PMC free article] [PubMed] [Google Scholar]
- 15.Barrientos RC & Zhang Q Isobaric labeling of intact gangliosides toward multiplexed LC-MS/MS-based quantitative analysis. Anal Chem 90, 2578–2586 (2018). [DOI] [PMC free article] [PubMed] [Google Scholar]
- 16.Schwarzmann G, Hoffmann-Bleihauer P, Schubert J, Sandhoff K & Marsh D Incorporation of ganglioside analogues into fibroblast cell membranes. A spin-label study. Biochemistry 22, 5041–5048 (1983). [DOI] [PubMed] [Google Scholar]
- 17.Eckels KH, Summers PL & Dubois DR Hepatitis A virus hemagglutination and a test for hemagglutination inhibition antibodies. J Clin Microbiol 27, 1375–1376 (1989). [DOI] [PMC free article] [PubMed] [Google Scholar]
- 18.Sanchez G, Aragones L, Costafreda MI, Ribes E, Bosch A & Pinto RM Capsid region involved in hepatitis A virus binding to glycophorin A of the erythrocyte membrane. J Virol 78, 9807–9813 (2004). [DOI] [PMC free article] [PubMed] [Google Scholar]
- 19.Mobius W, Herzog V, Sandhoff K & Schwarzmann G Intracellular distribution of a biotin-labeled ganglioside, GM1, by immunoelectron microscopy after endocytosis in fibroblasts. J Histochem Cytochem 47, 1005–1014 (1999). [DOI] [PubMed] [Google Scholar]
- 20.Daniotti JL & Iglesias-Bartolome R Metabolic pathways and intracellular trafficking of gangliosides. IUBMB life 63, 513–520 (2011). [DOI] [PubMed] [Google Scholar]
- 21.Wang X, Zhu L, Dang M, Hu Z, Gao Q, Yuan S, Sun Y, Zhang B, Ren J, Kotecha A, Walter TS, Wang J, Fry EE, Stuart DI & Rao Z Potent neutralization of hepatitis A virus reveals a receptor mimic mechanism and the receptor recognition site. Proc Natl Acad Sci U S A 114, 770–775 (2017). [DOI] [PMC free article] [PubMed] [Google Scholar]
- 22.Baggen J, Thibaut HJ, Staring J, Jae LT, Liu Y, Guo H, Slager JJ, de Bruin JW, van Vliet AL, Blomen VA, Overduin P, Sheng J, de Haan CA, de Vries E, Meijer A, Rossmann MG, Brummelkamp TR & van Kuppeveld FJ Enterovirus D68 receptor requirements unveiled by haploid genetics. Proc Natl Acad Sci U S A 113, 1399–1404 (2016). [DOI] [PMC free article] [PubMed] [Google Scholar]
- 23.Zocher G, Mistry N, Frank M, Hahnlein-Schick I, Ekstrom JO, Arnberg N & Stehle T A sialic acid binding site in a human picornavirus. PLoS Pathog 10, e1004401 (2014). [DOI] [PMC free article] [PubMed] [Google Scholar]
- 24.Kim DS, Son KY, Koo KM, Kim JY, Alfajaro MM, Park JG, Hosmillo M, Soliman M, Baek YB, Cho EH, Lee JH, Kang MI, Goodfellow I & Cho KO Porcine sapelovirus uses alpha2,3-Linked sialic acid on GD1a ganglioside as a receptor. J Virol 90, 4067–4077 (2016). [DOI] [PMC free article] [PubMed] [Google Scholar]
- 25.Cohen L, Benichou D & Martin A Analysis of deletion mutants indicates that the 2A polypeptide of hepatitis A virus participates in virion morphogenesis. J Virol 76, 7495–7505 (2002). [DOI] [PMC free article] [PubMed] [Google Scholar]
- 26.Probst C, Jecht M & Gauss-Muller V Intrinsic signals for the assembly of hepatitis A virus particles. Role of structural proteins VP4 and 2A. J Biol Chem 274, 4527–4531 (1999). [DOI] [PubMed] [Google Scholar]
- 27.Zhou D, Zhao Y, Kotecha A, Fry EE, Kelly JT, Wang X, Rao Z, Rowlands DJ, Ren J & Stuart DI Unexpected mode of engagement between enterovirus 71 and its receptor SCARB2. Nat Microbiol 4, 414–419 (2019). [DOI] [PubMed] [Google Scholar]
- 28.Qian M, Cai D, Verhey KJ & Tsai B A lipid receptor sorts polyomavirus from the endolysosome to the endoplasmic reticulum to cause infection. PLoS Pathog 5, e1000465 (2009). [DOI] [PMC free article] [PubMed] [Google Scholar]
- 29.Ravindran MS, Bagchi P, Cunningham CN & Tsai B Opportunistic intruders: how viruses orchestrate ER functions to infect cells. Nat Rev Microbiol 14, 407–420 (2016). [DOI] [PMC free article] [PubMed] [Google Scholar]
- 30.Dupzyk A & Tsai B Bag2 Is a component of a cytosolic extraction machinery that promotes membrane penetration of a nonenveloped virus. J Virol 92 (2018). [DOI] [PMC free article] [PubMed] [Google Scholar]
- 31.Ewers H, Romer W, Smith AE, Bacia K, Dmitrieff S, Chai W, Mancini R, Kartenbeck J, Chambon V, Berland L, Oppenheim A, Schwarzmann G, Feizi T, Schwille P, Sens P, Helenius A & Johannes L GM1 structure determines SV40-induced membrane invagination and infection. Nat Cell Biol 12, 11–18; sup pp 11–12 (2010). [DOI] [PubMed] [Google Scholar]
- 32.Ewers H & Helenius A Lipid-mediated endocytosis. Cold Spring Harb Persp Biol 3, a004721 (2011). [DOI] [PMC free article] [PubMed] [Google Scholar]
- 33.Spriggs CC, Harwood MC & Tsai B How non-enveloped viruses hijack host machineries to cause infection. Adv Virus Res 104, 97–122 (2019). [DOI] [PMC free article] [PubMed] [Google Scholar]
- 34.Pinto RM, Perez-Rodriguez FJ, D’Andrea L, de Castellarnau M, Guix S & Bosch A Hepatitis A virus codon usage: implications for translation kinetics and capsid folding. Cold Spring Harb Persp Biol 8 (2018). [DOI] [PMC free article] [PubMed] [Google Scholar]
- 35.Zhang HC, Chao SF, Ping LH, Grace K, Clarke B & Lemon SM An infectious cDNA clone of a cytopathic hepatitis A virus: Genomic regions associated with rapid replication and cytopathic effect. Virology 212, 686–697 (1995). [DOI] [PubMed] [Google Scholar]
- 36.Yi M, Bodola F & Lemon SM Subgenomic hepatitis C virus replicons inducing expression of a secreted enzymatic reporter protein. Virology 304, 197–210 (2002). [DOI] [PubMed] [Google Scholar]
- 37.Lee WM, Monroe SS & Rueckert RR Role of maturation cleavage in infectivity of picornaviruses: Activation of an infectosome. J Virol 67, 2110–2122 (1993). [DOI] [PMC free article] [PubMed] [Google Scholar]
- 38.Wakita T, Pietschmann T, Kato T, Date T, Miyamoto M, Zhao Z, Murthy K, Habermann A, Krauslich HG, Mizokami M, Bartenschlager R & Liang TJ Production of infectious hepatitis C virus in tissue culture from a cloned viral genome. Nat Med 11, 791–796 (2005). [DOI] [PMC free article] [PubMed] [Google Scholar]
- 39.Blight KJ, McKeating JA, Marcotrigiano J & Rice CM Efficient replication of hepatitis C virus genotype 1a RNAs in cell culture. J Virol. 77, 3181–3190 (2003). [DOI] [PMC free article] [PubMed] [Google Scholar]
- 40.Sanjana NE, Shalem O & Zhang F Improved vectors and genome-wide libraries for CRISPR screening. Nat Methods 11, 783–784 (2014). [DOI] [PMC free article] [PubMed] [Google Scholar]
- 41.MacGregor A, Kornitschuk M, Hurrell JGR, Lehmann NI, Coulepis AG, Locarnini SA & Gust ID Monoclonal antibodies against hepatitis A virus. J Clin Microbiol 18, 1237–1243 (1983). [DOI] [PMC free article] [PubMed] [Google Scholar]
- 42.Doench JG, Hartenian E, Graham DB, Tothova Z, Hegde M, Smith I, Sullender M, Ebert BL, Xavier RJ & Root DE Rational design of highly active sgRNAs for CRISPR-Cas9-mediated gene inactivation. Nat Biotech 32, 1262–1267 (2014). [DOI] [PMC free article] [PubMed] [Google Scholar]
- 43.Li W, Xu H, Xiao T, Cong L, Love MI, Zhang F, Irizarry RA, Liu JS, Brown M & Liu XS MAGeCK enables robust identification of essential genes from genome-scale CRISPR/Cas9 knockout screens. Genome Biol 15, 554 (2014). [DOI] [PMC free article] [PubMed] [Google Scholar]
- 44.Szklarczyk D, Gable AL, Lyon D, Junge A, Wyder S, Huerta-Cepas J, Simonovic M, Doncheva NT, Morris JH, Bork P, Jensen LJ & Mering CV STRING v11: protein-protein association networks with increased coverage, supporting functional discovery in genome-wide experimental datasets. Nucleic Acids Res 47, D607–d613 (2019). [DOI] [PMC free article] [PubMed] [Google Scholar]
- 45.Stapleton JT, Raina V, Winokur PL, Walters K, Klinzman D, Rosen E & McLinden JH Antigenic and immunogenic properties of recombinant hepatitis A virus 14S and 70S subviral particles. J Virol 67, 1080–1085 (1993). [DOI] [PMC free article] [PubMed] [Google Scholar]
- 46.Gonzalez-Lopez O, Rivera-Serrano EE, Hu F, Hensley L, McKnight KL, Ren J, Stuart DI, Fry EE & Lemon SM Redundant late domain functions of tandem VP2 YPX3L motifs in nonlytic cellular egress of quasi-enveloped hepatitis A virus. J Virol 92, 1308–1318 (2018). [DOI] [PMC free article] [PubMed] [Google Scholar]
- 47.Svennerholm L & Fredman P A Procedure for Quantitative Isolation of Brain Gangliosides. Biochim. Biophys. Acta 617, 97–109 (1980). [DOI] [PubMed] [Google Scholar]
Associated Data
This section collects any data citations, data availability statements, or supplementary materials included in this article.
Supplementary Materials
Data Availability Statement
All data supporting the findings of this study are included in the published article or accompanying supplementary information files. MAGeCK output files with results from the two CRISPR screens are included in the Source Data Files for Fig. 1c and Extended Data Fig. 1c.


