

Abstract
Objective:
Research suggests that higher childhood self-regulation (CSR) predicts lower adiposity in adolescence. However, it is unclear whether this relationship differs by sex or by baseline weight status. Thus, we investigated these questions in a longitudinal, community-based cohort.
Methods:
The cohort included 221 girls and 214 boys. At age 9, CSR was assessed via parent/teacher reports of effortful control, and childhood body mass index z-scores (BMIz) were calculated from staff measurements. Late adolescent waist-to-height ratio (WHtR) was based on staff measurements at age 18.
Results:
CSR has a small inverse correlation with concurrent childhood BMIz in girls, but not in boys. Prospectively, however, CSR has a small inverse association with late adolescent WHtR in both sexes, after adjusting for childhood BMIz and other childhood predictors. This prospective association is marginally weaker for girls with lower (vs. higher) childhood BMIz.
Conclusions:
CSR inversely predicts changes in adiposity across adolescence in both sexes, with some evidence that this is association is not as strong for girls with lower (vs. higher) childhood adiposity. However, this inverse association between CSR and adiposity may emerge earlier in girls. Future research should examine the causal status of CSR and its relationship to behaviors (e.g., diet).
Keywords: Psychosocial Variables, Adiposity, Gender, Children, Adolescents
Introduction
The risk of developing excess adiposity is heightened during the adolescent period, especially during early and late adolescence.1 This heightened risk occurs in the context of myriad physiological developments, especially during early adolescence,1 as well as numerous psychosocial developments, such as increased autonomy, which accelerates in late adolescence.2 As a result, individual characteristics may increasingly influence adiposity throughout the adolescent period, thereby representing a potential target for intervention in combination with interventions targeted at other levels (e.g., family, school and neighborhood, nation).
Accumulating evidence suggests that childhood self-regulation (CSR), a potentially modifiable individual characteristic, may be a risk factor for the development of excess adiposity in adolescence. CSR broadly refers to adaptive modulation of one’s own state, including behavior, cognition, and emotion.3 Higher CSR has been linked to better outcomes across a variety of domains,4 including the health domain.5 Most relevant here, several longitudinal studies have found that CSR inversely predicts adolescent adiposity.6–11 In a large, national study of child development, higher self-regulation in early childhood predicted smaller changes in body mass index z-scores (BMIz) from early childhood through early7,9 and middle7 adolescence. Further, CSR’s inverse association with BMIz changes appeared to strengthen with longer BMIz follow-up.7 In the same national study and also in a smaller study, higher self-regulation in middle childhood predicted smaller residual changes in BMIz from middle childhood to early adolescence8 and in overweight status from middle childhood to middle adolescence.10 In a study conducted only in girls, higher CSR in middle childhood predicted lower levels of BMI, waist circumference, and percent body fat across middle childhood, late childhood, and early and middle adolescence; however, CSR predicted changes in adiposity from middle childhood to middle adolescence only for BMI.6,11 Based on these generally positive findings from observational research, recent interventional research has examined whether interventions targeting CSR have downstream effects on adiposity.12,13 However, the efficacy of these interventions cannot be fully assessed without understanding for whom they are most likely to work, a question not adequately addressed by existing observational research.
In particular, CSR may have a stronger association with subsequent adiposity in girls, for both biological and psychosocial reasons. Due to a complex set of hormonal changes, girls’ percent body fat increases during puberty,1 whereas boys’ percent body fat tends to decrease throughout the adolescent period.14 These biological differences may lead to a more influential role for self-regulation in determining adiposity trajectories for girls. Psychosocially, adolescent girls tend to place greater importance on thinness than boys. Especially by late adolescence, concern about fatness and desire for weight loss are more prevalent in girls than boys,15,16 with a relatively small percentage of adolescent boys in the middle or lower end of the BMI range expressing these concerns.15 In contrast, concern about smallness and desire for weight gain are more prevalent in adolescent males,16 especially in the lower BMI percentiles,16 with a relatively small percentage of adolescent girls expressing these concerns.17 Further, although both male and female adolescents express desire for toned muscles,17 muscle-increasing behaviors18 are higher in adolescent boys compared to girls. As a result of these psychosocial differences, more self-regulation may be deployed toward maintaining lower weight in girls, whether consciously or not, because doing so tends to be a greater motivational priority for girls.19 However, despite these biological and psychosocial rationales for sex differences, most observational studies examining the relationship between CSR and subsequent adiposity have not conducted sex-stratified analyses,7,8,10 with one exception.9 A few studies have tested moderation by sex and reported insignificant results,8,10 but their power to detect interactions has been limited (e.g., due to small samples or correction for testing multiple interactions). Further complicating matters, existing studies of both sexes have used BMI as a measure of adiposity.7–10 However, BMI has differential measurement error with respect to adiposity in males and females, with BMI more likely to overestimate percentage body fat in young men.20
Further, CSR may have a stronger association with subsequent adiposity in girls who have greater adiposity at baseline. Greater baseline adiposity may reflect a propensity to gain weight, whether due to genetic and/or environmental factors, leaving these girls especially likely to experience large increases in adiposity during adolescence1 and allowing a bigger potential role for CSR in influencing weight trajectory. A few studies of the relationship between CSR and BMI have examined moderation by baseline BMI, and the interaction did not achieve significance; however, power to detect interactions was again limited.8,10
Thus, the present study sought to clarify whether CSR has a stronger relationship with subsequent adiposity in girls, especially girls with greater baseline adiposity, using a longitudinal, community-based sample and a measure of adiposity (i.e., waist circumference) that is highly correlated with total percentage adiposity in men as well as women.21,22
Methods
Participants & Procedures
Participants are the offspring of women initially recruited during the second trimester of pregnancy through obstetrics/gynecology and low-income clinics around Milwaukee (80%) and Madison (20%) as part of the Wisconsin Maternity Leave and Health Project, now referred to as the Wisconsin Study of Families and Work.23 A total of 560 live offspring were born to these women. Of these, 78% were followed longitudinally after infancy; these 435 offspring (221 girls; 214 boys) constitute our study cohort, which will be referred to as the “Full Cohort” sample. At the last assessment included in the present study (“Age 18”), 365 offspring (henceforth “participants” or “children”) remained in the study. Based in part on proximity to the laboratory, 232 of these were selected to participate in a laboratory visit that included anthropometric measurements. Of the 232, 197 participants (108 girls; 89 boys) had no missing data for the variables of interest and will be referred to as the Complete Case sample.
Participants’ parent or guardian (and, at older ages, the participants themselves) gave written informed consent, in accordance with University of Wisconsin Health Sciences Institutional Review Board requirements.
Procedures and Measures
Figure 1 illustrates data collection relevant to the present study, including the (approximate) age at which each variable was measured.
Figure 1. Depiction of Data Collection.
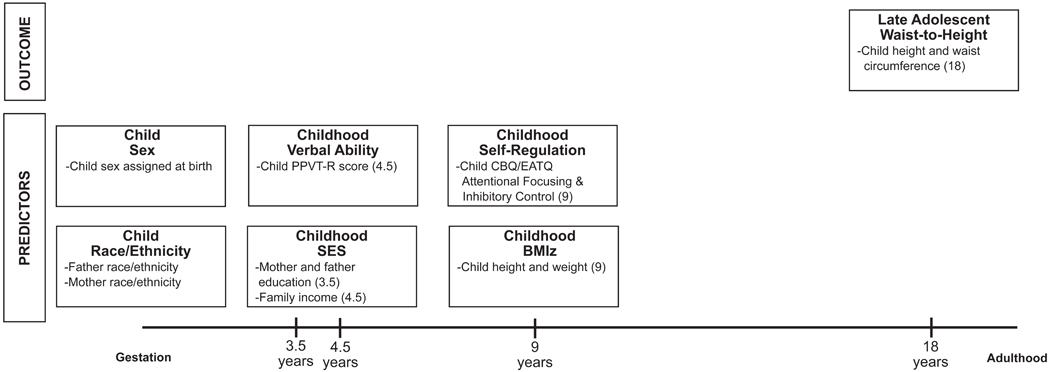
Study participants are referred to as the “child.” (Abbreviations: BMIz = Body Mass Index z-Score; CBQ = Children’s Behavior Questionnaire; EATQ = Early Adolescent Temperament Questionnaire; PPVT-R = Peabody Picture Vocabulary Test – Revised; SES = Socioeconomic Status)
Late Adolescent Adiposity.
Waist circumference and height were measured by study staff during a laboratory visit at “Age 18” (Mean age = 18.5 years; SD = 0.27 years). All measurements were obtained on a hard, flat surface by trained study staff, with the participant wearing clothes but not shoes. Height was measured to the nearest ¼ in using a retractable, steel measuring tape and a level, with the participant standing against a wall. Waist circumference was measured to the nearest ½ cm at the superior border of the iliac crest, after normal expiration, with study staff standing on the participant’s right side and using a flexible, non-stretch, retractable measuring tape. These measurement procedures were repeated until two readings within ¼ in (height) or ½ cm (waist circumference) were obtained, and those two readings were then averaged. Since the ratio of waist circumference to height is a better measure of adiposity than waist circumference alone,22 the resulting height and waist circumference measurements were used to create a Late Adolescent Waist-to-Height variable to use as the adiposity outcome. Although waist-to-height ratio is highly correlated with BMI (e.g., 0.92 in girls and 0.90 in boys in the Complete Case sample), total adiposity is better predicted by waist-to-height ratio than by BMI. For example, in a large, nationally-representative sample of children and adolescents, waist-to-height ratio, sex, and age explained 80% of the variance in percent body fat (measured via dual x-ray absorptiometry).22
Childhood Predictors.
Childhood self-regulation (CSR) was measured at “Age 9” (Mean age = 9.5 years; SD = 0.25 years) by questionnaires assessing effortful control, which refers to top-down cognitive processes involved in suppressing dominant responses in favor of subdominant responses24 in service of self-regulation.3 The questionnaires assess two component processes of effortful control: effortful attention (focusing and shifting attention, including from punishment and reward) and inhibitory control (suppression of behaviors that are typically considered inappropriate).25 Mothers, fathers, and teachers completed a shortened Attention scale from the revised Early Adolescent Temperament Questionnaire (EATQ-R)25 and a shortened Inhibitory Control scale from the Children’s Behavior Questionnaire (CBQ),26 using the EATQ-R’s five-point response scale (1 = Almost Always Untrue, 5 = Almost Always True), with an option of selecting “Not Applicable.” Both scales had good internal consistency for all informants (α > 0.70), and cross-informant correlations ranged from 0.47–0.54 for the Attention scale and 0.44–0.53 for the Inhibitory Control scale. For each scale, we calculated total scores for each informant by averaging their (non-missing) responses to all items in the scale, and we then averaged the resulting total scores for that scale across all available informants.27 Finally, we averaged the Attention and Inhibitory Control scales together28 and standardized the result to create the CSR predictor. Standardization was done separately by sex so that the CSR predictor would have the same variance for boys and girls, to facilitate comparison of the sex-specific regression coefficients for CSR.
Analyses also controlled for other childhood factors that may be related to CSR and also predict subsequent overweight/obesity.5,29 Because obesity is more prevalent in black and Hispanic adolescents in the U.S.,30 we included information on the participant’s race/ethnicity, as reported by their mother. Due to sparsity in certain race/ethnicity categories, we combined the original response categories to create a two-category Race/Ethnicity predictor (see Table 1).30
Table 1.
Summary Statistics for Variables of Interest in the Complete Case Samplea
| Girls (n = 101) | Boys (n = 80) | Girls vs. Boysb | ||||||
|---|---|---|---|---|---|---|---|---|
| Mean (or Percent.) | Standard Deviation | Observed Range | Mean (or Percent.) | Standard Deviation | Observed Range | Difference in Means (or Odds) | 95% CI for Difference (or Odds) | |
|
Late Adolescent
Outcome: Age 18 Waist Circumference (in) |
30.5 | 4.4 | [24.9, 46.7] | 32.3 | 3.9 | [25.8, 42.1] | −1.8 | [−3.0, −0.6] |
| Age 18 Height (in) | 65.3 | 2.4 | [58.1, 72.1] | 70.1 | 2.5 | [64.0, 76.5] | −4.8 | [−5.5, −4.1] |
| Age 18 Waist-to-Height | 0.47 | 0.06 | [0.39, 0.69] | 0.46 | 0.05 | [0.35, 0.62] | 0.01 | [−0.01, 0.02] |
| Childhood Predictors: | ||||||||
| Age 9 Self-Regulationc | 3.7 | 0.5 | [2.1, 4.6] | 3.4 | 0.5 | [2.2, 4.7] | 0.25 | [0.09, 0.41] |
| Race/Ethnicityd | 0.20 | [0.00, 1.72] | ||||||
| Black and/or Hispanic | 5.9% | 1.2% | ||||||
| White or Asian and non-Hispanic | 94.1% | 98.8% | ||||||
| Age 3.5 Maternal Education (years) | 15.1 | 2.2 | [10, 20] | 15.3 | 1.8 | [12, 19] | −0.2 | [−0.8, 0.4] |
| Age 3.5 Paternal Education (years) | 14.7 | 2.2 | [10, 20] | 15.2 | 2.5 | [9, 20] | −0.5 | [−1.2, 0.2] |
| Age 4.5 Family Income ($) | $66,968 | $37,512 | [$20,000, $300,000] | $67,560 | $42,065 | [$21,000, $280,000] | −$592 | [−$12,450, $11,266] |
| Age 4.5 Verbal Ability (standard scores)e | 106.8 | 15.0 | [62.0, 144.0] | 106.5 | 14.6 | [76.0, 153.0] | 0.4 | [−4.0, 4.7] |
| Age 9 BMI z-Scores | 0.4 | 1.0 | [−2.4, 2.7] | 0.4 | 1.1 | [−2.0, 2.4] | −0.1 | [−0.4, 0.2] |
Abbreviations: CI = Confidence Interval
The Complete Case sample consists of 197 participants (108 girls; 89 boys). Prior to analysis, 8 participants (3 girls; 5 boys) were removed because they were taking stimulant medication at Age 18, and an additional 8 participants (4 girls; 4 boys) were removed because they had other disqualifying medications or disease at Age 18, resulting in an analytic sample of 181 participants (101 girls; 80 boys). Summary statistics are provided for these 181 participants.
For continuous variables, (Welch’s) two-sample t-test with unequal variance was used to calculate the 95% confidence interval for the difference in means for girls vs. boys. For categorical variables, Fisher’s exact test was used to calculate the 95% confidence interval for the odds ratio characterizing the odds of the variable’s categories (e.g., Black and/or Hispanic vs. White or Asian) by Sex (girls vs. boys).
Summary statistics calculated on the original scale for Age 9 Self-Regulation (1 = Strongly Disagree; 5 = Strongly Agree).
The Black and/or Hispanic category includes individuals who selected the following response categories: Black non-Hispanic, White Hispanic, Other Hispanic, and Other Race. The White or Asian category includes individuals who selected the following response categories: White non-Hispanic, Asian or Pacific Islander, and Native American or Alaskan.
Age-normed standard scores from the Peabody Picture Vocabulary Test – Revised.
Because childhood socioeconomic status (SES) is an inverse predictor of subsequent obesity,29 we included information provided by the participant’s mother about maternal and paternal education at Age 3.5 and family income at Age 4.5. Since these variables were highly correlated, we performed a principal component analysis on their correlations, which is a data reduction technique used in previous studies examining SES in this sample.31 We then used the first principal component, which accounted for 56% of the variance in (standardized) maternal education, paternal education, and family income, as the Childhood SES predictor.
Childhood cognitive ability, an inverse predictor of subsequent obesity,32 was assessed using the Peabody Picture Vocabulary Test – Revised at Age 4.5. The age-normed standard scores were used as the Childhood Verbal Ability predictor.
Information on childhood BMI, a strong positive predictor of subsequent obesity,33 was collected during a home visit at Age 9. All measurements were performed on a hard, flat surface by trained study staff, with the child wearing clothes but not shoes. Height was measured using procedures identical to those at Age 18. Weight was measured to the nearest ½ lb using a Health o meter EVERWeigh Lithium Electronic Scale (Sunbeam Health Division, Bridgeview, Illinois). The procedure was repeated until two readings within ½ lb were obtained, and those two readings were then averaged. Age- and sex-specific BMI z-scores were calculated from the height and weight measurements based on the revised (2000) growth charts of the Centers for Disease Control and Prevention,34 and the resulting z-scores were used as the Childhood BMIz predictor.
Analyses
Following recommendations for analyzing datasets with missing data,35 we performed analyses in the Complete Case sample (results reported below) and also used principled missing data methods to perform analyses in the Full Cohort sample (details and results reported in Supplemental Appendix A). Analyses used R version 3.4.4.
All analyses excluded participants who, at Age 18, were taking certain medications (e.g., prednisone, stimulants) or had certain recently diagnosed or medically unstable diseases (e.g., hyperthyroidism, Grave’s disease) known to effect weight. (Of note, the relatively low prevalence of these medications and conditions precluded statistical adjustment.) Prior research suggests that failing to exclude or adjust for individuals on prescription stimulants obscures the relationship between ADHD (which is strongly related to CSR) and higher BMI,36 not surprisingly given the effects of stimulant use on weight trajectory.37
We first calculated sex-specific summary statistics for the outcome and predictors (see Table 1 for details). We also used Fisher’s z-test to test for sex differences in the (first-order) cross-sectional correlation between CSR and Childhood BMIz and in the (first-order) longitudinal correlation between CSR and Late Adolescent Waist-to-Height.
Next, we used multiple regression models to examine how the relationship between CSR and Late Adolescent Waist-to-Height differs for girls and boys, in both baseline and adjusted models. In all models, the outcome (i.e., Waist-to-Height) was transformed using the Box-Cox transformation with λ= −2.5 to address violations of normality. The baseline model (Model 1) included Race/Ethnicity, and other models successively introduced additional predictors (i.e., Childhood SES and Verbal Ability in Model 2, Childhood BMIz in Model 3) to test how adjustment affected the relationship between CSR and Late Adolescent Waist-to-Height in each sex. All models included an interaction term between Sex and CSR, as well as interactions between sex and all other predictors given the potential for sex differences in their association with Late Adolescent Waist-to-Height (e.g., 38).
Finally, we used multiple regression (Model 4) to examine whether Childhood BMIz moderates the effects of CSR on Late Adolescent Waist-to-Height, by adding interactions between Childhood BMIz, CSR, and Sex into the fully adjusted model (i.e., Model 3).
Results
Summary Statistics
Table 1 presents sex-specific summary statistics for the 181 participants included in the Complete Case analyses. In summary, approximately 6% of girls and 1% of boys are Black and/or Hispanic. At (participant) Age 3.5, both mothers and fathers have about 15 years of education on average, and at (participant) Age 4.5, the mean family income is over $65,000. Also at Age 4.5, mean scores on the Peabody Picture Vocabulary Test – Revised are slightly above, but still within one standard deviation of, the norm for that age. The means of Childhood BMIz and Late Adolescent Waist-to-Height are below the risk cutoff for both boys and girls. However, both measures vary considerably across individuals, with 13.9% of girls and 12.5% of boys at or above the 95th percentile for Childhood BMIz, and with 18.8% of girls and 22.5% of boys at or above a ratio of 0.50 for Late Adolescent Waist-to-Height. Regarding sex differences, boys have greater mean height and waist circumference at Age 18, as would be expected, but the mean of Late Adolescent Waist-to-Height ratio does not differ significantly by sex. Likewise, there are no sex differences for predictors, except that the mean of CSR is slightly lower for boys than for girls prior to standardization.
Table 2 presents sex-specific first-order correlations for (transformed) Late Adolescent Waist-to-Height and all continuous predictors. Of note, the cross-sectional correlation between CSR and Childhood BMIz is weakly negative in girls (r = −0.16, 95% CI = [−0.34, 0.04]), but weakly positive in boys (r = 0.15, 95% CI = [−0.07, 0.36]), with the difference in the two correlations being statistically significant (Fisher’s z = 2.01, p = 0.04). In contrast, the longitudinal correlation between CSR and (transformed) Late Adolescent Waist-to-Height is negative in both sexes; although this correlation is larger in magnitude for girls (r = −0.28, 95% CI = [−0.45, −0.09]) than boys (r = −0.04, 95% CI = [−0.26, 0.18]), the difference only approaches statistical significance (Fisher’s z = 1.63, p = 0.10).
Table 2.
| Late Adolescent Waist-to-Height (transformed) | Childhood Self-Regulation (CSR) | Childhood SES | Childhood Verbal Ability | Childhood BMIz | |
|---|---|---|---|---|---|
| Late Adolescent Waist-to-Height (transformed) | -- | −0.28 | −0.24 | 0.04 | 0.62 |
| Childhood Self-Regulation (CSR) | −0.04 | -- | 0.28 | 0.26 | −0.16 |
| Childhood SES | 0.00 | 0.37 | -- | 0.24 | −0.07 |
| Childhood Verbal Ability | −0.17 | 0.07 | 0.18 | -- | 0.14 |
| Childhood BMIz | 0.64 | 0.15 | −0.07 | −0.14 | -- |
Abbreviations: BMIz = Body Mass Index z-Scores; SES = Socioeconomic Status
Correlations are provided for the 181 participants (101 girls; 80 boys) from the Complete Case Sample who were included in the regression analyses.
Correlations for boys appear below the diagonal, and correlations for girls appear above the diagonal.
Regression Analyses
Table 3 presents results from models for Late Adolescent Waist-to-Height, including coefficients for girls, boys, and the difference between girls and boys. In the model adjusted only for Race/Ethnicity (Model 1), CSR is a significant inverse predictor of Late Adolescent Waist-to-Height in girls (β = −0.212, p < 0.01), but not in boys (β = −0.060, p = 0.55), explaining 8.1% of the variation in girls, but only 0.4% in boys. Additional adjustment for Childhood SES and Childhood Verbal Ability (Model 2) has little effect in either sex, decreasing the magnitude of the CSR coefficient by about 3% in girls and increasing it by about 10% in boys. However, after additional adjustment for Childhood BMIz (Model 3), the inverse relationship between CSR and Late Adolescent Waist-to-Height becomes considerably weaker in girls (β = −0.122, p = 0.06), but stronger in boys (β = −0.173, p = 0.05), explaining 2.3% of the variation in girls and 3.0% in boys. The fact that adjustment for Childhood BMIz has different effects in girls and boys is not surprising given that CSR is already negatively correlated with Childhood BMIz in girls, but not in boys, for whom the correlation is positive. As a result, in models for Late Adolescent Waist-to-Height, additional adjustment for Childhood BMIz decreases the magnitude of the (negative) coefficient for CSR by about 40% in girls, but increases it by 150% in boys. In accordance with the above findings, the difference between the CSR coefficient for girls and boys is negative in Model 1 (β = −0.152, p = 0.22) and Model 2 (β = −0.140, p = 0.29), but slightly positive in Model 3 (β = 0.051, p = 0.63), although it is not statistically significant in any of the models. Finally, in Model 4, the interaction between CSR and Childhood BMIz approached significance in girls (Interaction Term = −0.088, p = 0.12), but not in boys (Interaction Term = −0.015, p = 0.85). As depicted in Figure 2, the adjusted association between CSR and Late Adolescent Waist-to-Height is negative for girls with Childhood BMIz one standard deviation above the mean (β = −0.177, p = 0.02), but effectively zero for girls with Childhood BMIz one standard deviation below the mean (β = −0.002, p = 0.99). In contrast, the adjusted association between CSR and Late Adolescent Waist-to-Height is relatively comparable for boys with Childhood BMIz one standard deviation above (β = −0.182, p = 0.06) versus below (β = −0.153, p = 0.27) the mean.
Table 3.
Regression Results for Late Adolescent Waist-to-Heighta in the Complete Case Sample
| Predictorsb | Girlsc | Boysd | Difference for Girls vs. Boyse | |||||||||
|---|---|---|---|---|---|---|---|---|---|---|---|---|
| Est. | 95% CI | p-value | Est. | 95% CI | p-value | Est. | 95% CI | p-value | ||||
|
Model 1: Adjusted for
Race/Ethnicity | ||||||||||||
| Intercept | −1.914 | [−2.542, −1.286] | <0.001 | −1.276 | [−2.832, 0.281] | 0.11 | −0.638 | [−2.316, 1.040] | 0.46 | |||
| Childhood Self-Regulation (CSR) | −0.212 | [−0.358, −0.066] | <0.01 | −0.060 | [−0.253, 0.133] | 0.55 | −0.152 | [−0.394, 0.090] | 0.22 | |||
| Race/Ethnicity | −0.602 | [−1.249 0.046] | 0.07 | −1.264 | [−2.827, 0.299] | 0.12 | 0.663 | [−1.029, 2.355] | 0.45 | |||
| Childhood SES | -- | -- | -- | -- | -- | -- | -- | -- | -- | -- | -- | -- |
| Childhood Verbal Ability | -- | -- | -- | -- | -- | -- | -- | -- | -- | -- | -- | -- |
| Childhood BMIz | -- | -- | -- | -- | -- | -- | -- | -- | -- | -- | -- | -- |
| Δ R2 for CSR | -- | -- | -- | 8.1%f | -- | -- | -- | 0.4%g | -- | -- | -- | 0.8%h |
| Model 2: Adjusted for Race/Ethnicity, Childhood SES, and Childhood Verbal Ability | ||||||||||||
| Intercept | −2.894 | [−4.188, −1.600] | <0.001 | −0.467 | [−2.369, 1.434] | 0.63 | −2.426 | [−4.726, −0.126] | 0.04 | |||
| Childhood Self-Regulation (CSR) | −0.206 | [−0.360, −0.052] | <0.01 | −0.066 | [−0.273, 0.140] | 0.53 | −0.140 | [−0.397, 0.118] | 0.29 | |||
| Race/Ethnicity | −0.575 | [−1.220, 0.070] | 0.09 | −1.145 | [−2.706, 0.416] | 0.15 | 0.571 | [−1.118, 2.260] | 0.51 | |||
| Childhood SES | −0.154 | [−0.324, 0.017] | 0.08 | 0.051 | [−0.161, 0.263] | 0.64 | −0.204 | [−0.476, 0.068] | 0.15 | |||
| Childhood Verbal Ability | 0.009 | [−0.002, 0.020] | 0.11 | −0.009 | [−0.021, 0.003] | 0.16 | 0.017 | [0.001, 0.034] | 0.04 | |||
| Childhood BMIz | -- | -- | -- | -- | -- | -- | -- | -- | -- | -- | -- | -- |
| Δ R2 for CSR | -- | -- | -- | 6.8%f | -- | -- | -- | 0.4%g | -- | -- | -- | 0.6%h |
| Model 3: Adjusted for Race/Ethnicity, Childhood SES, Childhood Verbal Ability, and Childhood BMIz | ||||||||||||
| Intercept | −2.767 | [−3.796, −1.738] | <0.001 | −1.736 | [−3.284, −0.188] | 0.03 | −1.031 | [−2.890, 0.828] | 0.28 | |||
| Childhood Self-Regulation (CSR) | −0.122 | [−0.247, 0.003] | 0.06 | −0.173 | [−0.340, −0.007] | 0.05 | 0.051 | [−0.157, 0.259] | 0.63 | |||
| Race/Ethnicity | −0.165 | [−0.691, 0.361] | 0.54 | −0.551 | [−1.801, 0.700] | 0.39 | 0.386 | [−0.970, 1.743] | 0.58 | |||
| Childhood SES | −0.131 | [−0.266, 0.005] | 0.06 | 0.119 | [−0.051, 0.288] | 0.17 | −0.249 | [−0.466, −0.032] | 0.03 | |||
| Childhood Verbal Ability | 0.003 | [−0.006, 0.011] | 0.56 | −0.004 | [−0.014, 0.005] | 0.38 | 0.007 | [−0.006, 0.020] | 0.30 | |||
| Childhood BMIz | 0.430 | [0.305, 0.554] | <0.001 | 0.507 | [0.373, 0.641] | <0.001 | −0.077 | [−0.260, 0.106] | 0.41 | |||
| Δ R2 for CSR | -- | -- | -- | 2.3% f | -- | -- | -- | 3.0% g | -- | -- | -- | 0.1%h |
| Model 4: Adjusted for Race/Ethnicity, Childhood SES, Childhood Verbal Ability, Childhood BMIz, and CSR x Childhood BMIz | ||||||||||||
| Intercept | −2.716 | [−3.745, −1.687] | <0.001 | −1.695 | [−3.296, −0.095] | 0.04 | −1.021 | [−2.923 0.882] | 0.30 | |||
| Childhood Self-Regulation (CSR) | −0.090 | [−0.221, 0.041] | 0.18 | −0.167 | [−0.345, 0.010] | 0.07 | 0.078 | [−0.143 0.298] | 0.49 | |||
| Race/Ethnicity | −0.115 | [−0.644, 0.414] | 0.67 | −0.573 | [−1.842, 0.696] | 0.38 | 0.458 | [−0.916 1.833] | 0.52 | |||
| Childhood SES | −0.130 | [−0.266, 0.005] | 0.07 | 0.121 | [−0.050, 0.293] | 0.17 | −0.252 | [−0.470 −0.033] | 0.03 | |||
| Childhood Verbal Ability | 0.002 | [−0.007, 0.010] | 0.72 | −0.005 | [−0.014, 0.005] | 0.37 | 0.006 | [−0.007 0.019] | 0.36 | |||
| Childhood BMIz | 0.412 | [0.286, 0.539] | <0.001 | 0.507 | [0.373, 0.642] | <0.001 | −0.095 | [−0.279 0.089] | 0.32 | |||
| CSR x Childhood BMIz | −0.088 | [−0.195, 0.020] | 0.12 | −0.015 | [−0.166, 0.136] | 0.85 | −0.073 | [−0.258 0.113] | 0.44 | |||
Abbreviations: BMIz = BMI z-Scores; CI = Confidence Interval; CSR = Childhood Self-Regulation; Est. = Estimate; SES = Socioeconomic Status
Late Adolescent Waist-to-Height was transformed using the Box-Cox transformation with λ = −2.5, i.e., (Waist-to-Height(−2.5) − 1)/(−2.5).
All models include Sex as a predictor, as well as interactions between Sex and all other predictors.
Coefficients for girls (e.g., the coefficient for CSR in girls) correspond to the main effect of the predictor (e.g., CSR) when the Sex variable is coded as 0 for Girls and 1 for Boys.
Coefficients for boys (e.g., the coefficient for CSR in boys) correspond to the main effect of the predictor (e.g., CSR) when the Sex variable is coded as 1 for Girls and 0 for Boys.
Coefficients for differences in girls vs. boys (e.g., the coefficient for the difference in CSR for girls minus boys) correspond to the interaction between the predictor (e.g., CSR) and Sex when the Sex variable is coded as 1 for Girls and 0 for Boys.
Δ R2 for CSR = R2 for girls only from model including CSR (with all coefficients sex-specific) – R2 for girls only from model excluding CSR (with all coefficients sex-specific)
Δ R2 for CSR = R2 for boys only from model including CSR (with all coefficients sex-specific) – R2 for boys only from model excluding CSR (with all coefficients sex-specific)
Δ R2 for CSR = R2 for girls and boys from model including CSR (with all coefficients sex-specific) – R2 for girls and boys from model including CSR (with all coefficients except CSR sex-specific)
Figure 2. Relationship Between Childhood Self-Regulation and Late Adolescent Waist-to-Height, by Childhood BMI z-Score, in the Complete Case Sample.
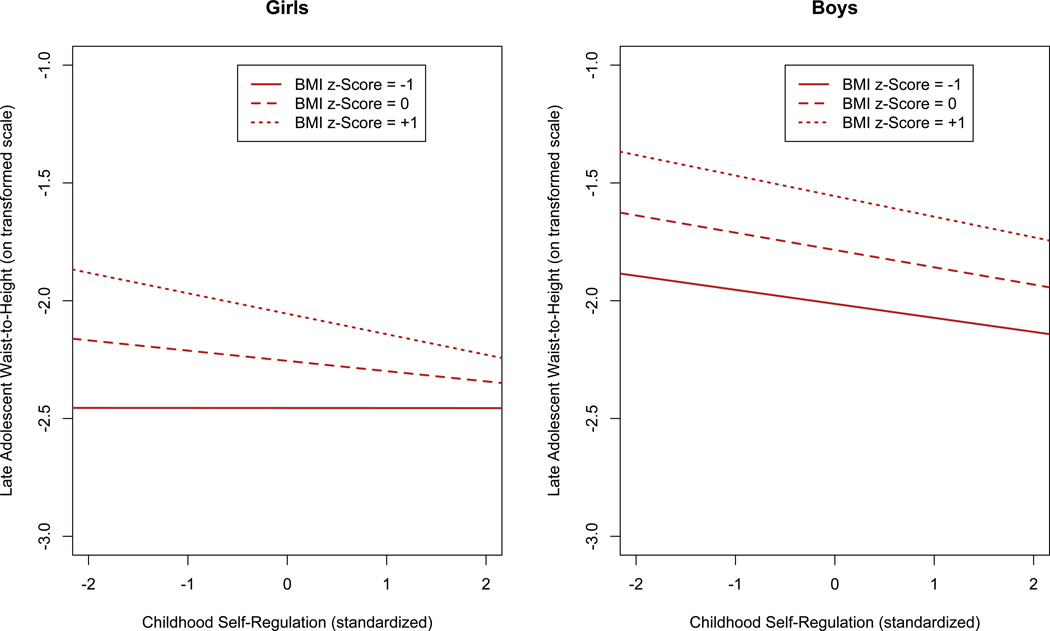
All models are adjusted for Race/Ethnicity, Childhood SES, Childhood Verbal Ability, and Childhood BMIz. (Abbreviations: BMIz = Body Mass Index z-Score; SES = Socioeconomic Status)
The pattern of results described here for the Complete Case sample is generally replicated in the Full Cohort sample (see Supplemental Appendix A for details). However, for girls, the magnitude of the inverse relationship between CSR and Late Adolescent Waist-to-Height is smaller in the Full Cohort than the Complete Case sample, whereas for boys, the magnitude of this relationship is larger in the Full Cohort than the Complete Case sample.
Discussion
Our first aim was to examine whether the relationship between childhood self-regulation and subsequent adiposity differs by sex, using a longitudinal, community-based sample and a measure of adiposity that is similarly accurate in both girls and boys. We found that, cross-sectionally, childhood self-regulation had a small inverse correlation with childhood BMI z-scores in girls, but not boys. However, childhood self-regulation inversely predicted a small portion of the variation in late adolescent waist-to-height ratio in both girls and boys, after adjustment for childhood BMI z-scores as well as other childhood predictors.
These results suggest that CSR may have a stronger inverse association with concurrent childhood adiposity in girls than in boys. However, our results do not support the hypothesis that childhood self-regulation is a stronger inverse predictor of changes in adiposity across adolescence in girls. Our findings in this regard are consistent with prior research, since studies that adjust for childhood BMI have not found significant sex differences in the association between middle childhood CSR (or related constructs such as ADHD or conscientiousness) and subsequent BMI.8,10 In contrast, in prior studies that do not adjust for childhood adiposity,39,40 middle childhood CSR predicts endpoint BMI more strongly or more consistently in girls, consistent with the results seen when our analyses were not adjusted for childhood BMI z-scores. One possible interpretation of the above patterns of results is that self-regulation has an effect on subsequent adiposity that emerges earlier in girls, whether for biological or sociocultural reasons. Alternatively, it is possible that CSR has (theoretically) comparable effects on subsequent adiposity throughout childhood and adolescence in both girls and boys, but, in practice, the higher prevalence of prescription stimulant use in boys with low CSR41 masks CSR’s effects on adiposity until late adolescence in boys.36 Another possibility is that CSR (actually) has comparable effects on subsequent adiposity throughout childhood and adolescence in both girls and boys, but this is not reflected in the cross-sectional association between CSR and adiposity in boys because CSR has less interindividual consistency across time in boys.42 Finally, CSR may not have a causal effect on adiposity in either girls or boys, but it might be less strongly associated with the factors affecting subsequent adiposity in younger boys.
Our second aim was to examine whether the relationship between childhood self-regulation and subsequent adiposity differs depending on childhood adiposity levels. Our results provide some support for the hypothesis that CSR is a stronger predictor of (residual) changes in adiposity across adolescence for girls with higher (vs. lower) childhood BMI z-scores, although the interaction did not achieve statistical significance. Prior studies have not found a significant interaction between CSR and childhood adiposity,8,10 although these studies did not examine this interaction separately by sex and also had limited power (e.g., due to small samples or correction for testing multiple interactions). However, an intervention targeting CSR had greater effects on body size changes over time in children with larger body sizes at baseline.13
Our study has several limitations. First, although waist-to-height ratio is more highly correlated with total adiposity than are more commonly used measures such as BMI,22 our outcome measure is still not a perfect measure of total adiposity. Also, it is possible that a higher proportion of the boys had not reached their peak height by the time of outcome measurement (i.e., Age 18), making the outcome measure potentially less stable across time in boys. Second, despite being community-based, the sample was not fully representative of the population, and it consisted primarily of White non-Hispanic participants, who tend to have lower prevalence of overweight/obesity than black and/or Hispanic adolescents.30 Third, we examined differences based on the sex assigned to participants at birth. As a result, our study does not shed light on whether the relationship between CSR and subsequent adiposity differs based on gender identity. Fourth, although our study cohort was not small and any missingness in adiposity outcomes was at least partly by design, the presence of missing data nonetheless limited our power to detect certain effects (e.g., two-way and especially three-way interactions). Further, the presence of missing data can bias results, although principled missing data methods can reduce bias considerably. Fifth, regarding potential confounders, childhood SES and verbal ability were measured at least 4 years prior to CSR, which could have contributed to the negligible effect that adjusting for these variables had on the association between CSR and late adolescent waist-to-height ratio. Sixth, we were not able to adjust for stimulant medication use in childhood or earlier adolescence, which may have impacted results given the relationship between CSR and ADHD and the effects of stimulant medications on weight trajectory.36 Seventh, we did not examine behavioral mediators (e.g., fruit/vegetable consumption, binge and emotional eating, physical activity, sleep),7,43 an important next step for research,8 especially since marked changes in diet and physical activity occur during adolescence.1 In addition, our analyses did not examine whether environment, in particular caregiver characteristics and behaviors, moderated (or mediated) the effects of CSR.44 Finally, although analyses were prospective and adjusted for potential confounders (e.g., SES), we cannot definitively state that higher CSR causes smaller changes in adiposity during adolescence. Interventional research is needed to demonstrate causality. To date, findings for interventions targeting CSR have been mixed. Some,13 but not all,12 studies have found effects on adiposity, with discrepancies possibly due in part to longer follow-up periods in studies with positive results.7
Limitations aside, our findings do have important implications for assessing the efficacy of interventions targeting CSR. Specifically, if the association between CSR and subsequent adiposity is indeed causal, interventions occurring early in childhood may have effects on adiposity only in girls. However, interventions with longer follow-up periods or beginning later in childhood may affect adiposity in both sexes, although outcome measures other than BMI (e.g., waist circumference)21 may be needed to detect effects in boys from mid-to-late adolescence onward. In addition, effects on adiposity may be detectable only in girls with higher, but not lower, baseline adiposity.
Supplementary Material
WHAT’S KNOWN ON THIS SUBJECT:
Higher childhood self-regulation predicts lower adiposity in adolescence.
However, existing research has not fully clarified whether the relationship between childhood self-regulation and adolescent adiposity differs by sex.
WHAT THIS STUDY ADDS:
Findings from a longitudinal, community-based sample suggest that childhood self-regulation has a small inverse correlation with concurrent childhood BMI z-scores in girls only.
However, after controlling for childhood BMI z-scores, childhood self-regulation inversely predicts a small and similar proportion of the variance in late adolescent waist-to-height ratio in both boys and girls.
HOW THESE RESULTS MIGHT CHANGE RESEARCH OR CLINICAL PRACTICE:
Results suggest that interventions targeting self-regulation early in childhood may have effects on adiposity only in girls.
However, interventions with longer follow-up periods or beginning later in childhood may affect adiposity in both sexes.
Acknowledgments
The authors thank Corinne Boldt for her role in data collection, Drs. Lyn Abramson and Andrew Alexander for feedback on earlier drafts of this manuscript, and Lauren Porter, Meghan Reilly, and Salman Safir for their editorial assistance.
FUNDING: This work was supported by a population health dissertation grant awarded to Dr. Javaras by the Robert Wood Johnson Foundation Health & Society Scholars Program at the University of Wisconsin - Madison; by the National Institutes of Health [grants R01 MH059785, R01 MH044340, P50 MH052354, P50 MH084051, R21 MH082705, and K23 DK120517]; and by grants awarded to Dr. Essex by the John D. and Catherine T. MacArthur Foundation Research Network on Psychopathology and Development. Infrastructure support was provided by the Waisman Center via P30 HD003352.
ABBREVIATIONS:
- BMI
Body Mass Index
- BMIz
Body Mass Index z-Score
- CI
Confidence Interval
- CSR
Childhood Self-Regulation
- SD
Standard Deviation
- SES
Socioeconomic Status
- WHtR
Waist-to-Height Ratio
Footnotes
CONFLICTS OF INTEREST: The authors declare no conflicts of interest relevant to this article.
References
- 1.Jasik CB, Lustig RH. Adolescent obesity and puberty: “The perfect storm.” Ann N Y Acad Sci. 2008;1135(1):265–279. [DOI] [PubMed] [Google Scholar]
- 2.Nelson MC, Story M, Larson NI, Neumark-Sztainer D, Lytle LA. Emerging adulthood and college-aged youth: An overlooked age for weight-related behavior change. Obesity. 2008;16(10):2205–2211. [DOI] [PubMed] [Google Scholar]
- 3.Nigg JT. Annual Research Review: On the relations among self-regulation, self-control, executive functioning, effortful control, cognitive control, impulsivity, risk-taking, and inhibition for developmental psychopathology. J Child Psychol Psychiatry. 2017;58(4):361–383. [DOI] [PMC free article] [PubMed] [Google Scholar]
- 4.Moffitt TE, Arseneault L, Belsky D, et al. A gradient of childhood self-control predicts health, wealth, and public safety. Proc Natl Acad Sci. 2011;108(7):2693–2698. [DOI] [PMC free article] [PubMed] [Google Scholar]
- 5.Moffitt TE, Arseneault L, Belsky D, et al. A gradient of childhood self-control predicts health, wealth, and public safety. Proc Natl Acad Sci. 2011;108(7):2693–2698. [DOI] [PMC free article] [PubMed] [Google Scholar]
- 6.Anzman S, Birch L. Low inhibitory control and restrictive feeding practices predict weight outcomes. J Pediatr. 2009;155(5):651. [DOI] [PMC free article] [PubMed] [Google Scholar]
- 7.Bub KL, Robinson LE, Curtis DS. Longitudinal associations between self-regulation and health across childhood and adolescence. Health Psychol. 2016;35(11):1235–1245. [DOI] [PMC free article] [PubMed] [Google Scholar]
- 8.Duckworth AL, Tsukayama E, Geier AB. Self-controlled children stay leaner in the transition to adolescence. Appetite. 2010;54(2):304–308. [DOI] [PMC free article] [PubMed] [Google Scholar]
- 9.Francis L, Susman E. Self-regulation and rapid weight gain in children from age 3 to 12 years. Arch Pediatr Adolesc Med. 2009;163(4):297–302. [DOI] [PMC free article] [PubMed] [Google Scholar]
- 10.Tsukayama E, Toomey S, Faith M, Duckworth AL. Self-control as a protective factor against overweight status in the transition from childhood to adolescence. Arch Pediatr Adolesc Med. 2010;164(7):631–635. [DOI] [PMC free article] [PubMed] [Google Scholar]
- 11.Anzman-Frasca S, Francis LA, Birch LL. Inhibitory control is associated with psychosocial, cognitive, and weight outcomes in a longitudinal sample of girls. Transl Issues Psychol Sci. 2015;1(3):203–216. [DOI] [PMC free article] [PubMed] [Google Scholar]
- 12.Lumeng JC, Miller AL, Horodynski MA, et al. Improving self-regulation for obesity prevention in Head Start: A randomized controlled trial. Pediatrics. 2017;139(5):e20162047. [DOI] [PubMed] [Google Scholar]
- 13.Brotman LM, Dawson-McClure S, Huang K-Y, et al. Early childhood family intervention and long-term obesity prevention among high-risk minority youth. Pediatrics. 2012;129(3):e621–e628. [DOI] [PMC free article] [PubMed] [Google Scholar]
- 14.Sarría A, Moreno LA, Garcí-LIop LA, Fleta J, Morellón MP, Bueno M. Body mass index, triceps skinfold and waist circumference in screening for adiposity in male children and adolescents. Acta Paediatr. 2001;90(4):387–392. [DOI] [PubMed] [Google Scholar]
- 15.Calzo JP, Sonneville KR, Haines J, Blood EA, Field AE, Austin SB. The development of associations among body mass index, body dissatisfaction, and weight and shape concern in adolescent boys and girls. J Adolesc Health. 2012;51(5):517–523. [DOI] [PMC free article] [PubMed] [Google Scholar]
- 16.Cohane GH, Pope HG. Body image in boys: A review of the literature. Int J Eat Disord. 2001;29(4):373–379. [DOI] [PubMed] [Google Scholar]
- 17.Field AE. Exposure to the mass media, body shape concerns, and use of supplements to improve weight and shape among male and female adolescents. Pediatrics. 2005;116(2):e214–e220. [DOI] [PubMed] [Google Scholar]
- 18.Eisenberg ME, Wall M, Neumark-Sztainer D. Muscle-enhancing behaviors among adolescent boys and girls. Pediatrics. 2012;130(6):1019–1026. [DOI] [PMC free article] [PubMed] [Google Scholar]
- 19.Kurzban R, Duckworth AL, Kable JW, Myers J. An opportunity cost model of subjective effort and task performance. Behav Brain Sci. 2013;36(06):661–679. [DOI] [PMC free article] [PubMed] [Google Scholar]
- 20.Shah NR, Braverman ER. Measuring adiposity in patients: The utility of body mass index (BMI), percent body fat, and leptin. PLoS ONE. 2012;7(4):e33308. [DOI] [PMC free article] [PubMed] [Google Scholar]
- 21.Lee W-S. Body fatness charts based on BMI and waist circumference. Obesity. 2016;24(1):245–249. [DOI] [PubMed] [Google Scholar]
- 22.Brambilla P, Bedogni G, Heo M, Pietrobelli A. Waist circumference-to-height ratio predicts adiposity better than body mass index in children and adolescents. Int J Obes. 2013;37(7):943–946. [DOI] [PubMed] [Google Scholar]
- 23.Hyde JS, Klein MH, Essex MJ, Clark R. Maternity leave and women’s mental health. Psychol Women Q. 1995;19(2):257–285. [Google Scholar]
- 24.Kochanska G, Knaack A. Effortful control as a personality characteristic of young children: Antecedents, correlates, and consequences. J Pers. 2003;71(6):1087–1112. [DOI] [PubMed] [Google Scholar]
- 25.Ellis LK, Rothbart MK. Revision of the Early Adolescent Temperament Questionnaire In: Poster Presented at the 2001 Biennial Meeting of the Society for Research in Child Development, Minneapolis, MN.; 2001. [Google Scholar]
- 26.Rothbart MK, Ahadi SA, Hershey KL, Fisher P. Investigations of temperament at three to seven years: The Children’s Behavior Questionnaire. Child Dev. 2001;72(5):1394–1408. [DOI] [PubMed] [Google Scholar]
- 27.Achenbach TM. As others see us: Clinical and research implications of cross-informant correlations for psychopathology. Curr Dir Psychol Sci. 2006;15(2):94–98. [Google Scholar]
- 28.Lemery-Chalfant K, Doelger L, Goldsmith HH. Genetic relations between effortful and attentional control and symptoms of psychopathology in middle childhood. Infant Child Dev. 2008;17(4):365–385. [DOI] [PMC free article] [PubMed] [Google Scholar]
- 29.Parsons TJ, Power C, Logan S, Summerbell CD. Childhood predictors of adult obesity: A systematic review. Int J Obes Relat Metab Disord. 1999;23:S1–S107. [PubMed] [Google Scholar]
- 30.Ogden CL, Carroll MD, Lawman HG, et al. Trends in obesity prevalence among children and adolescents in the United States, 1988–1994 through 2013–2014. JAMA. 2016;315(21):2292–2299. [DOI] [PMC free article] [PubMed] [Google Scholar]
- 31.Burk LR, Armstrong JM, Goldsmith HH, et al. Sex, temperament, and family context: How the interaction of early factors differentially predict adolescent alcohol use and are mediated by proximal adolescent factors. Psychol Addict Behav. 2011;25(1):1–15. [DOI] [PMC free article] [PubMed] [Google Scholar]
- 32.Lawlor DA, Clark H, Smith GD, Leon DA. Childhood intelligence, educational attainment and adult body mass index: Findings from a prospective cohort and within sibling-pairs analysis. Int J Obes. 2006;30(12):1758–1765. [DOI] [PubMed] [Google Scholar]
- 33.Singh AS, Mulder C, Twisk JWR, Van Mechelen W, Chinapaw MJM. Tracking of childhood overweight into adulthood: A systematic review of the literature. Obes Rev. 2008;9(5):474–488. [DOI] [PubMed] [Google Scholar]
- 34.Kuczmarski RJ, Ogden CL, Grummer-Strawn LM, et al. CDC growth charts: United States. Adv Data. 2000;314:1–27. [PubMed] [Google Scholar]
- 35.Sterne JAC, White IR, Carlin JB, et al. Multiple imputation for missing data in epidemiological and clinical research: Potential and pitfalls. Br Med J. 2009;338:b2393. [DOI] [PMC free article] [PubMed] [Google Scholar]
- 36.Schwartz BS, Bailey-Davis L, Bandeen-Roche K, et al. Attention deficit disorder, stimulant use, and childhood body mass index trajectory. Pediatrics. 2014;133(4):668–676. [DOI] [PMC free article] [PubMed] [Google Scholar]
- 37.Poulton A, Cowell CT. Slowing of growth in height and weight on stimulants: A characteristic pattern. J Paediatr Child Health. 2003;39(3):180–185. [DOI] [PubMed] [Google Scholar]
- 38.Sobal J, Stunkard AJ. Socioeconomic status and obesity: A review of the literature. Psychol Bull. 105(2):260–275. [DOI] [PubMed] [Google Scholar]
- 39.Nigg JT, Johnstone JM, Musser ED, Long HG, Willoughby MT, Shannon J. Attention-deficit/hyperactivity disorder (ADHD) and being overweight/obesity: New data and meta-analysis. Clin Psychol Rev. 2016;43:67–79. [DOI] [PMC free article] [PubMed] [Google Scholar]
- 40.Hampson SE, Goldberg LR, Vogt TM, Dubanoski JP. Forty years on: Teachers’ assessments of children’s personality traits predict self-reported health behaviors and outcomes at midlife. Health Psychol. 2006;25(1):57–64. [DOI] [PMC free article] [PubMed] [Google Scholar]
- 41.Zuvekas SH, Vitiello B. Stimulant medication use in children: A 12-year perspective. Am J Psychiatry. 2012;169(2):160–166. [DOI] [PMC free article] [PubMed] [Google Scholar]
- 42.Murphy BC, Eisenberg N, Fabes RA, Shepard S, Guthrie IK. Consistency and change in children’s emotionality and regulation: A longitudinal study. Merrill-Palmer Q. 1999;45(3):413–444. [Google Scholar]
- 43.Godefroy V, Trinchera L, Romo L, Rigal N. Modelling the effect of temperament on BMI through appetite reactivity and self-regulation in eating: A Structural Equation Modelling approach in young adolescents. Int J Obes. 2016;40(4):573–580. [DOI] [PubMed] [Google Scholar]
- 44.Zeller MH, Boles RE, Reiter-Purtill J. The additive and interactive effects of parenting style and temperament in obese youth seeking treatment. Int J Obes. 2008;32(10):1474–1480. [DOI] [PMC free article] [PubMed] [Google Scholar]
Associated Data
This section collects any data citations, data availability statements, or supplementary materials included in this article.