Abstract
The TRPA1 ion channel is expressed by primary afferent nerve fibers, where it functions as a low threshold sensor for structurally diverse electrophilic irritants ranging from small volatile environmental toxicants to endogenous algogenic lipids1. TRPA1 is also a ‘receptor-operated’ channel whose activation downstream of metabotropic receptors elicits inflammatory pain or itch, making it an attractive target for novel analgesic therapies2. However, we lack mechanistic insight into how TRPA1 recognizes and responds to electrophiles or cytoplasmic second messengers. Here, we show that electrophiles act through a two-step process in which modification of a highly reactive cysteine (C621) promotes reorientation of a cytoplasmic loop to enhance nucleophilicity and modification of a nearby cysteine (C665), thereby stabilizing the loop in an activating configuration. These actions modulate two restrictions controlling ion permeation, including widening of the selectivity filter to enhance calcium permeability and opening of a canonical gate at the cytoplasmic end of the pore. We propose a model to explain functional coupling between electrophile action and these control points. We also characterize a calcium binding pocket that is remarkably conserved across TRP channel subtypes and accounts for all aspects of calcium-dependent TRPA1 regulation, including potentiation, desensitization, and activation by metabotropic receptors. These findings provide a structural framework for understanding how a broad-spectrum irritant receptor is controlled by endogenous and exogenous agents that elicit or exacerbate pain and itch.
Electrophiles activate TRPA1 through covalent modification of cysteine residues within the channel’s cytoplasmic amino terminus3-5. We have previously shown that three critical cysteines (C621, C641 and C665 in human TRPA1) reside within an intricately folded region situated just below the transmembrane core of the channel6. This and a more recent structural study7 suggest that the local chemical environment within this ‘allosteric nexus’ endows C621 with extraordinary nucleophilic character that likely accounts for the channel’s low threshold sensitivity5. But how this clamshell-shaped region accommodates small and large electrophiles and translates local conformational changes into gating movements remains vague7. TRPA1 is also activated by G protein-coupled or growth factor receptors that stimulate phospholipase C (PLC) signaling pathways8-11, but the contribution of relevant second messengers, such as cytoplasmic calcium or phosphoinositide lipids, and their sites of action remain controversial12. Moreover, TRPA1 exhibits bimodal modulation by calcium, which first potentiates then desensitizes electrophile-evoked responses8,13, and for which several mechanisms have been proposed13-17. Here we clarify these important questions from a structural perspective.
Dynamic equilibrium between two states
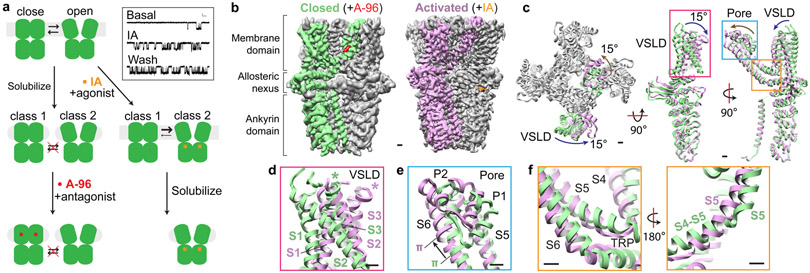
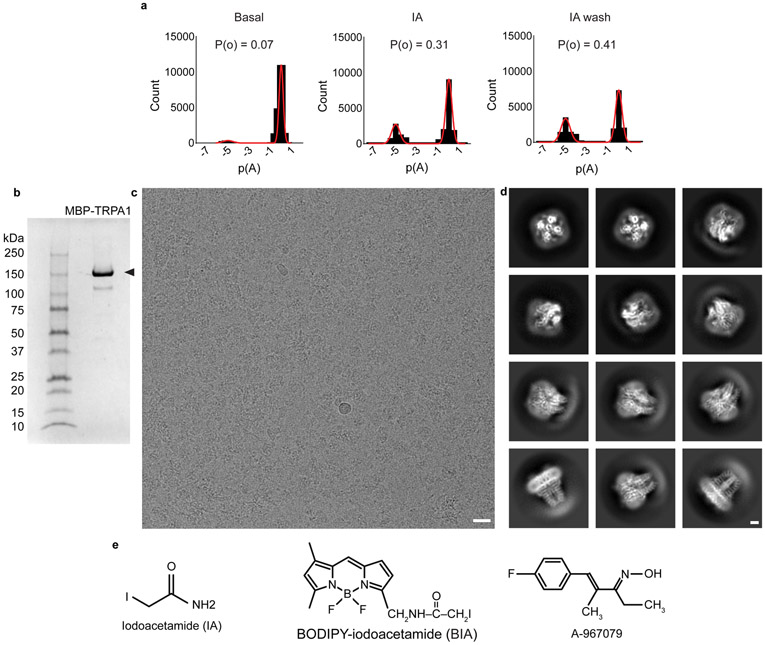
TRPA1 exhibits ‘flickery’ behavior characterized by rapid transitions between open and closed states (Fig. 1a, Extended Data Fig. 1a), but a pharmacologically validated open state has not yet been visualized6,7. Two technical insights enabled us to overcome this limitation. First, extraction with CYMAL-5 NG detergent yielded a stable distribution of two main conformations (Fig. 1 a,b, Extended Data Figs. 2, Extended Data Table 1). We then used pharmacological agents to validate these as open and closed states. One conformation bound the antagonist A-96, showed a narrow pore profile (see below), and resembles previously published structures; we designate this conformation as closed. Second, we found that treating TRPA1-expressing cells with an irreversible electrophilic agonist (iodoacetamide, IA) prior to detergent extraction biased the equilibrium towards the other main conformation, which showed IA modification of C621 and a wider pore profile (see below), pharmacologically validating it as an activated, open state.
Fig. 1. Dynamic equilibrium between closed and activated conformations.
a, Closed and open states of TRPA1 were captured by incubation with an irreversible electrophilic agonist (Iodoacetamide, IA) or an antagonist (A-967079, A-96) before or after membrane solubilization, respectively. Representative inside-out patch recordings show spontaneous (basal) and IA (100 μM)-evoked (persistent) TRPA1 channel openings (Vhold = −40 mV; scale bars: x = 10 msec., y = 2 pA, n = 9 independent experiments. b, Cryo-EM density maps of TRPA1 bound to A-96 or IA in closed or activated state, respectively. A-96 binds to the membrane domain while iodoacetamide binds to the allosteric nexus. c, Comparison between subunits in closed and activated conformations showing ~15° rotation of voltage sensor-like domain (VSLD) and twisting and translation of pore domain. Ankyrin repeat domain remains stationary. d, VSLD rotates around the cytoplasmic base of transmembrane α-helices S1 and S2 in a near-rigid-body movement. e, Pore domain twists and translates upward towards the extracellular milieu, concomitant with a shift in the S6 π-helix by one helical turn. f, Conformational changes in the upper pore region are coupled to widening of the lower gate through straightening of the S5 α-helix, enabling movement of S6 to facilitate gating. Scale bars: 10Å.
Comparison of these two states revealed significant conformational differences within the transmembrane core and membrane-proximal allosteric nexus (Fig. 1c-f, Supplemental Video 1). In the activated state, the entire transmembrane region rotates by ~15° relative to the stationary cytoplasmic ankyrin repeat domain (Fig. 1c). Moreover, the voltage sensor-like domain undergoes a near rigid body rotation (Fig. 1d), which is accompanied by rotation and upward translation of the pore loop and pore helices (Fig. 1e). These transitions are linked by movements in the S5 and S6 helices: the π-helix in S6 shifts up by one helical turn and, in concert with S5, causes an upward shift of pore helices P1 and P2 (Fig. 1e); the S4-S5 linker and S5 transmembrane α-helix straighten into a single α-helix (Fig. 1f), which coordinates movement of the pore helices and S6 to couple the upper and lower gates. Taken together, these transitions are reminiscent of those seen between closed and desensitised states for the cool/menthol receptor TRPM8, but dissimilar to the more local conformational changes that accompany gating of the heat/capsaicin receptor TRPV118,19.
Coupling between upper and lower gates
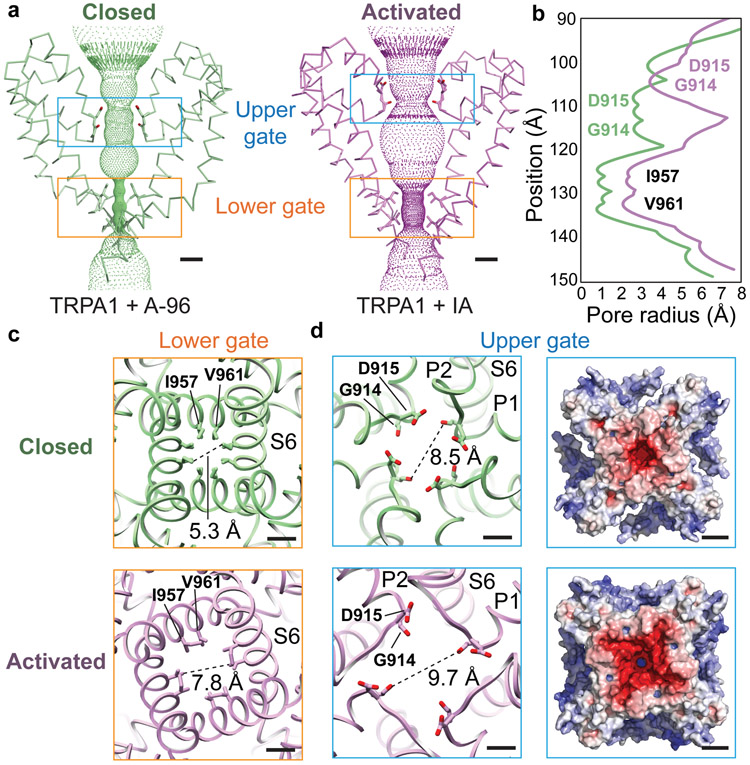
Profiles of the ion permeation pathway revealed substantial changes at both upper and lower restrictions (Fig. 2a,b). We see marked widening of the lower gate formed by residues I957 and V961, dilating the pore diameter from 5.3 to 7.8Å (Fig. 2c) and increasing its hydrated radius from 0.9 to 2.1Å (Fig. 2b). These changes are nearly identical to those seen in TRPV1 when comparing apo and capsaicin-activated states, indicative of transition from closed to open, as expected for a true gate that controls ion flux19. Local resolution analysis of the activated TRPA1 map shows that the lower gate has slightly diminished resolution compared to surrounding regions (Extended Data Fig. 2e), suggesting a dynamic profile that is consistent with the channel’s ability to pass cations of different sizes20,21.
Fig. 2. Coupled dilation of upper pore region and lower gate.
a, Activation of TRPA1 involves concerted dilation of both upper and lower gates with upward shift of the selectivity filter. b, Lower gate is formed by residues I957 and V961, while upper gate is formed by D915 and backbone carbonyl of G914. c, Pore widening is associated with counter-clockwise rotation of transmembrane α-helices (viewed from extracellular face to cytoplasmic side). d, Acidic residues lining the upper pore create a highly negatively charged surface, especially in the activated conformation, likely facilitating calcium selectivity. Scale bars: 5Å. Electrostatic surface charge distribution of TRPA1’s cytoplasmic face in apo- and activated states were calculated in APBS33 and displayed at ±10 kT/e−. Scale bars: 25Å.
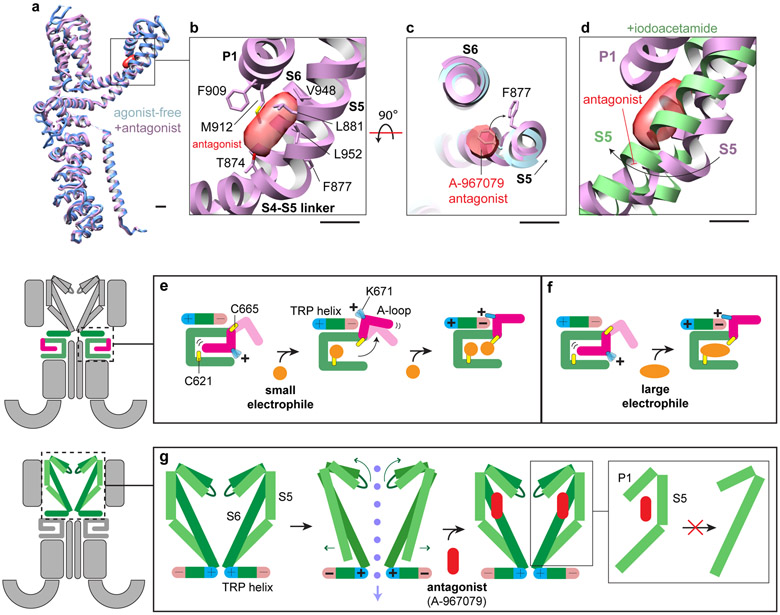
At the upper restriction, movement of pore helices P1 and P2 results in an upward shift and dilation of the selectivity filter formed by residues G914 and D915 (Fig. 2a,b). This alters the overall profile of the outer pore wall from a V- to U-shaped funnel, which increases the restriction diameter from 8.5 to 9.7Å (Fig. 2d). Remarkably, widening of both upper and lower restrictions is elicited by electrophile attachment to the allosteric nexus, below the transmembrane core, arguing for allosteric coupling between this nexus and both gates. Regarding communication between the gates, we notice that S5 contains a small bend that straightens upon transition to the open state (Fig. 1f), consequently lifting and rotating the pore helices backward to alter configuration of the selectivity filter (Fig. 2a). Consistent with these proposed coupling movements, the A-96 antagonist wedges into a pocket near the S5 bend and just beneath the pore helices (Extended Data Figs. 1e and 9a-c), as previously described6. Thus, A-96 likely prevents opening of the lower gate by locking S5 in its closed (bent) conformation and inhibiting movement of the S5-S6 pore module (Extended Data Fig. 9d,g).
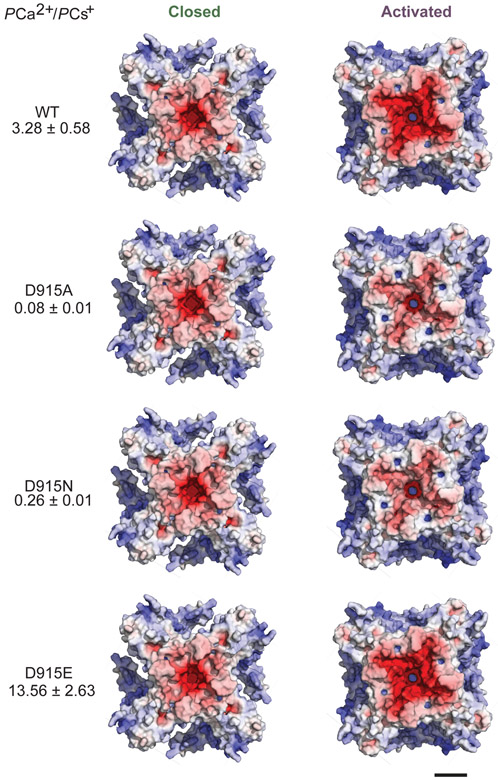
What might be the physiologic relevance of such movements in the outer pore region, which alter diameter less dramatically compared to TRPV1? Interestingly, this transition involves upward and outward rotation of D915 (Fig. 2b,d), a residue that influences calcium selectivity of activated TRPA1 channels13,22. Increased negative electrostatic surface potential in the outer pore region (Fig. 2d) is consistent with enhanced calcium preference of the activated state13,20,21,23. Indeed, neither D915A nor D915N mutants have preference for calcium13 and models of these mutants show reduced negative electrostatic surface potential in the activated state (Extended Data Fig. 3). Taken together, these observations support the notion that conformational transitions at the level of the selectivity filter account for dynamic ion selectivity of TRPA113,20,21,23.
Two-step mechanism of electrophile action
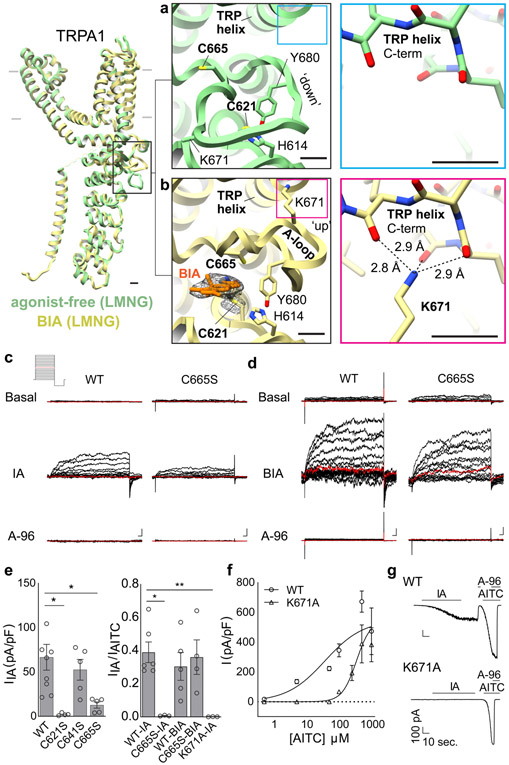
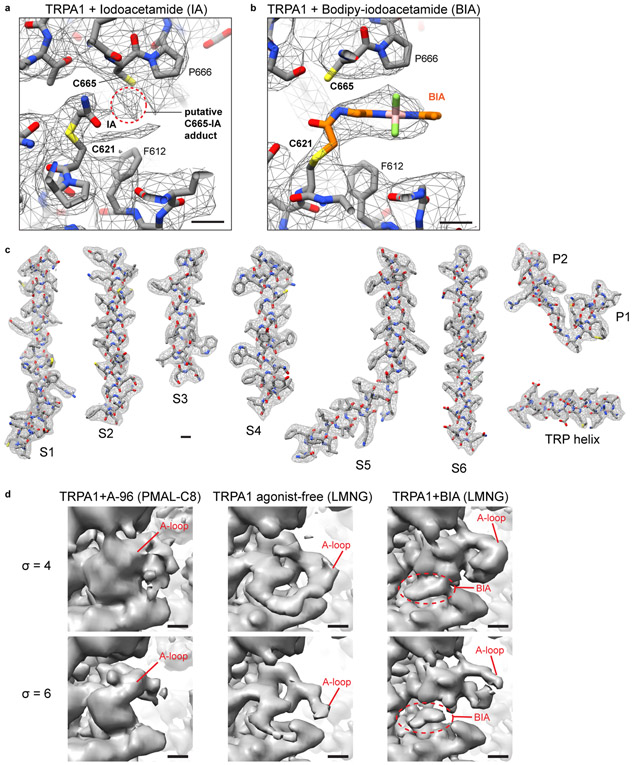
Our activated TRPA1 structure was obtained using IA, which functions as an irreversible agonist by forming stable covalent adducts with cysteines (Fig. 1a, Extended Data Fig. 1a)3,4. We observed clear attachment of IA at just one position, C621 (Extended Data Fig. 4a), consistent with the exceptional nucleophilic character of this residue5,6. Strikingly, this modification also stabilized an ‘activation loop’ (A-loop) in an upward configuration, exposing a pocket containing the modified residue (Fig. 3a, b, Extended Data Fig. 4a, d), consistent with recently reported structures of the electrophile-modified channel7.
Fig. 3. Activation by electrophiles occurs through two-step mechanism.
a, A dynamic activation loop (A-loop) adopts a 'down' conformation in the agonist-free channel, partially occluding a reactive pocket containing C621. b, Following attachment of BODIPY-iodoacetamide (BIA) to C621, the A-loop transitions to an 'up' conformation, bringing C665 into the reactive pocket and repositioning K671 to coordinate backbone carbonyl oxygens at the TRP domain C-terminus. Scale bars: 5Å. c, IA (100 μM)-evoked currents for WT and C665S mutant TRPA1 channels (n = 9 and 5 independent experiments, respectively), followed by inhibition with A-96 (10 μM). d, Same for BIA (100 μM)-evoked currents (n = 5 for WT and C665S mutant). 500 msec. voltage steps from −80 to 80 mV, 0 mV colored red. Scale bars: x = 25 msec., y = 100 pA.
e, (left) Quantification of IA-evoked currents for WT or mutant TRPA1 channels at 80 mV (n = 9 and 5 independent experiments/construct, respectively). (right) Normalized IA-evoked currents (TRPA1 WT, n = 6; C665S, n = 3; K671A, n = 3) and BIA-evoked currents (TRPA1 WT n = 5; C665S, n =4). *, p = 0.05; ** p = 0.007, Kruskal-Wallis test with post-hoc Dunn’s correction for multiple comparisons. Data displayed as ± S.E.M. f, AITC dose-response curves for WT (EC50 = 37; 95% CI: 30 – 46 nM) and K671A (EC50 = 344; 95% CI: 313 – 381 nM) TRPA1 channels. EC50 values determined by nonlinear Poisson regression and statistically significant difference confirmed with extra sum-of-squares F test (p < 0.0001). n = 3 cells/dose/construct except K671A 50 mM (n = 6) and 100 mM (n = 4). Data are displayed as mean ± S.E.M. g, IA (100 μM) and AITC (1 mM)-evoked whole cell currents for WT and K671A channels (Vhold = −80 mV) blocked by A-96 (10 μM). n = 3 independent experiments/construct.
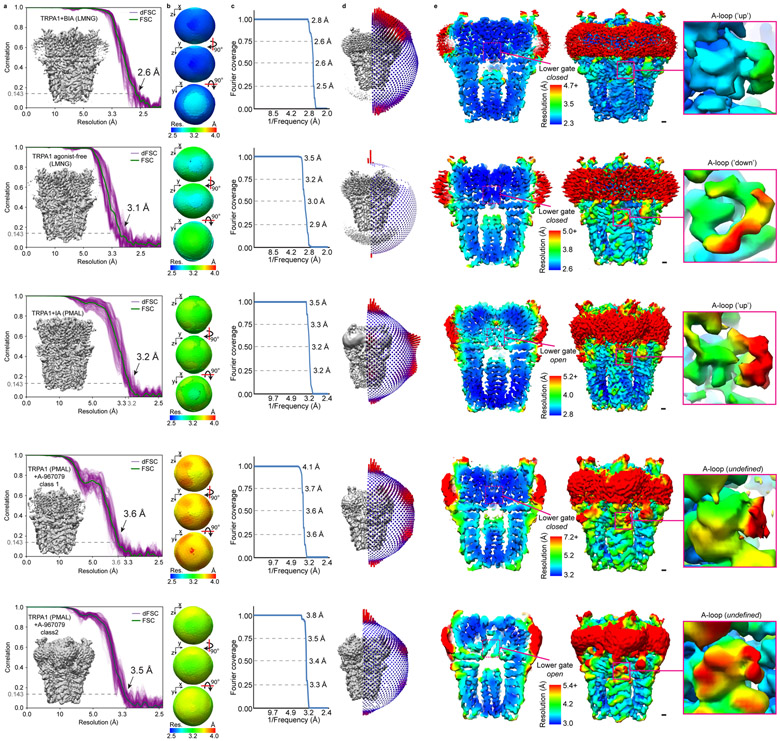
To better visualize agonist attachment, we used a bulky version of IA (BODIPY-IA, BIA) (Extended Data Fig. 1e) and solubilized ligand-free and BIA-modified channels with the detergent LMNG, which resulted in higher overall resolutions of 3.1 and 2.6Å, respectively (Extended Data Figs. 2 and 4c, Extended Data Table 1). While these channels were both trapped in a closed pore state, covalent modification and distinct A-loop conformations could be more clearly observed (Fig. 3a,b). The downward (ligand-free) A-loop, which was not previously visualized7, occludes the reactive pocket containing C621 and C665 (Fig. 3a, Extended Data Fig. 4d), whereas the upward (electrophile-modified) conformation exposes this pocket. Furthermore, the larger density of BIA confirmed C621 as the primary modification site (Fig. 3b, Extended Data Fig. 4b). Other cysteines within this region (most notably C665) are also modified, but at substantially reduced rates compared to C6215. Indeed, in the presence of IA we observed a weaker density associated with C665, which may reflect partial modification at this site (Extended Data Fig. 4a), as also observed with benzyl isothiocyanate (BITC)7.
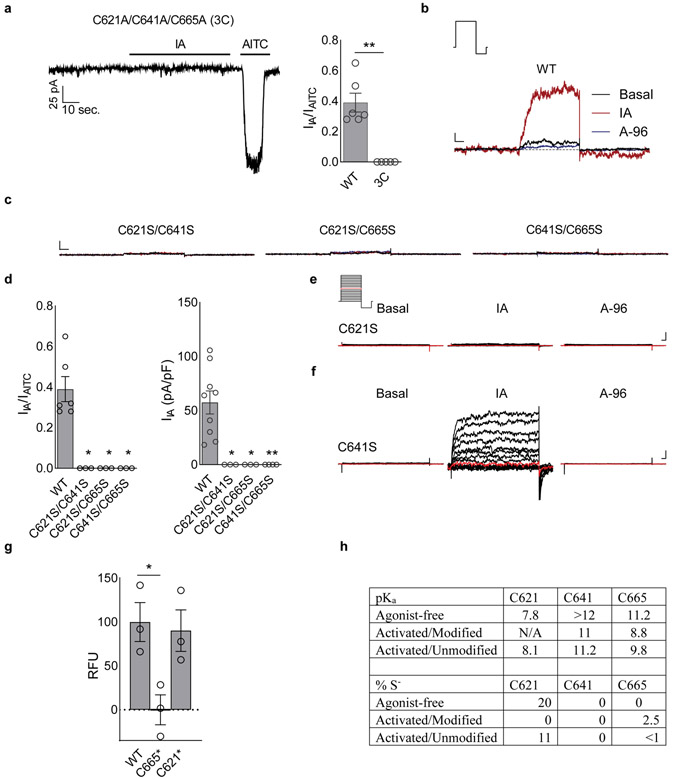
A role for C665 in TRPA1 activation has been unclear5,7. Interestingly, we see that C665 rotates into the pocket containing modified C621 when the A-loop is stabilized in the upward configuration (Fig. 3a,b). This reorientation of C665 is predicted to lower its pKa (from 11.2 to 8.8) and enhance nucleophilicity (Extended Data Fig. 5h), suggesting that modification at this site also occurs during channel activation. The necessity for modification at one or both cysteines may depend on the size or charge of electrophile modification and whether it sufficiently alters configuration of the reactive pocket. To test this idea, we mutated cysteines (C621, C641, and/or C665) within the vicinity of the reactive pocket and used patch clamp recording to assess their sensitivity to IA and its bulkier cousin, BODIPY-IA. All double mutant combinations were IA insensitive (Extended Data Fig. 5b-d), demonstrating that C621 is alone insufficient to support channel activation by this small electrophile (even though C621 was fully labeled by BODIPY-IA in C641S/C665S double mutants (Extended Data Fig. 5g). We next examined single cysteine substitutions and found that C641S behaved similarly to wild type channels (Fig. 3e, Extended Data Fig. 5f), whereas C621S was IA insensitive (Fig. 3e, Extended Data Fig. 5e) and C665S retained ~30% sensitivity (Fig. 3c,e). This is consistent with a two-step model whereby C621 is the primary site of electrophile modification, priming A-loop reorientation and modification of C665 to elicit full channel activation. Suo et. al. concluded that C665 modification is not required for channel activation7, perhaps because they used relatively bulky electrophiles (BITC and JT010) that stabilize the open pocket by modifying C621 alone.
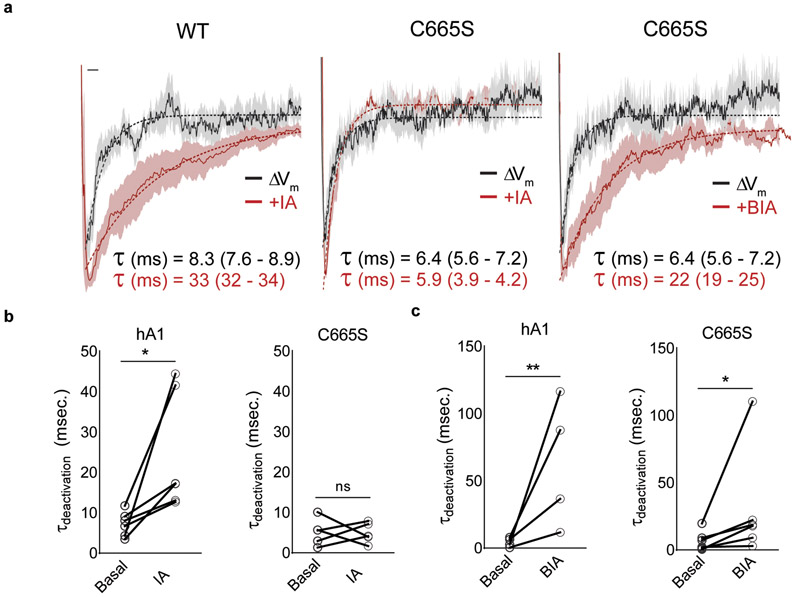
Further evidence for this model comes from measurement of channel closure times, which reflect coupling efficiency between agonist binding and channel gating. To assess this parameter, we examined tail currents following activation of channels by membrane depolarization in the absence or presence of irreversible agonists. For wild type TRPA1 channels, the rate of channel closure was slowed ~3-fold by IA (Extended Data Fig. 6), as expected if electrophile modification enhances coupling efficiency of A-loop reorientation to channel gating. For C665S mutant, which retains appreciable sensitivity to IA, the rate of channel closure was similar to that determined without agonist (Extended Data Fig. 6a,b), suggesting that modification at C665 is important for stabilizing and coupling A-loop reorientation to gating. BODIPY-IA attaches to only one site, suggesting that bulky electrophiles stabilize active A-loop conformation by modifying C621 alone. Remarkably, the single C665S mutant showed full sensitivity to BIA with regard to response magnitude and tail current decay time (Extended Data Fig. 6a,c), confirming this notion.
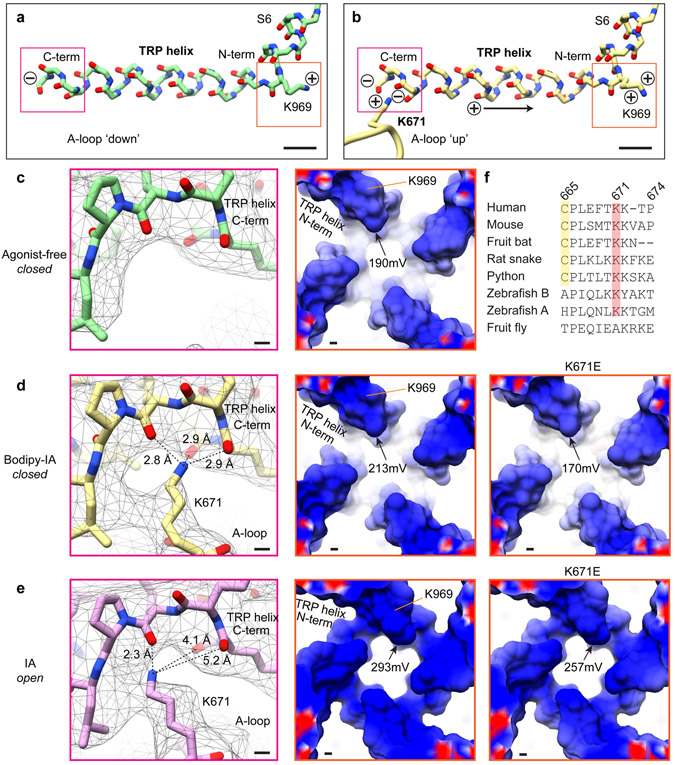
How might upward A-loop stabilization couple to channel gating? In this loop configuration, K671 is stabilized and becomes resolved through its interaction with backbone carbonyls at the C-terminus of the TRP domain (Fig. 3a,b, Extended Data Fig. 7), a conserved α-helical motif that lies parallel to the inner membrane leaflet and is implicated in gating of numerous TRP channel subtypes24. The positively charged side chain of K671 enhances the dipole moment of the TRP helix (Extended Data Fig. 7a,b), strengthening the positive electrostatic surface potential at its N-terminus (Extended Data Fig. 7c,d). We speculate that this promotes repulsion between TRP domains from neighboring subunits, thereby biasing conformational equilibrium of the channel towards the open state by driving expansion of overlying S6 domains that constitute the lower gate (Extended Data Fig. 7e).
K671 is conserved across vertebrate TRPA1 channels (Extended Data Fig. 7f). Mutation to the cognate residue in the fly orthologue (K671A) rendered hTRPA1 insensitive to IA or to concentrations of AITC around its EC50 (~30 μM), as expected if K671 is critical for propagating local conformational changes in the modified A-loop to the channel gate. We have previously shown that TRPA1 lacking critical cysteines retains sensitivity to high concentrations of AITC (~10X EC50) and that this is mediated through modification of another lysine residue (K710) proceeding the S1 helix3. Indeed, we found that K671A channels are activated by 1 mM AITC, demonstrating that this mutant is functional, and that modification of K710 activates the channel through a mechanism distinct from what we propose for cysteine modification. Interestingly, K710 is also in proximity to the TRP domain and modification at this site may induce movement in this critical helix independent of A-loop engagement.
Structurally conserved calcium control site
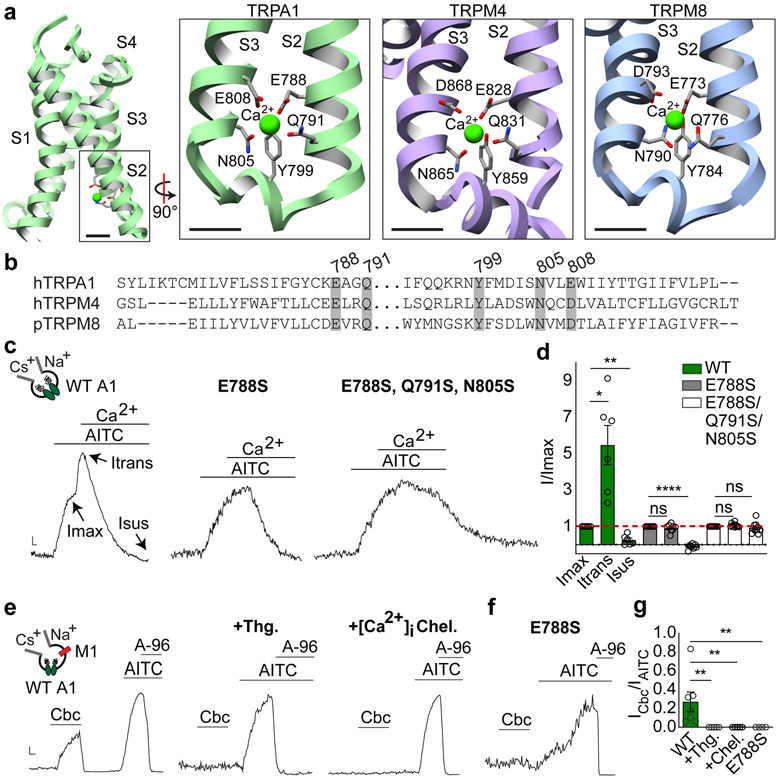
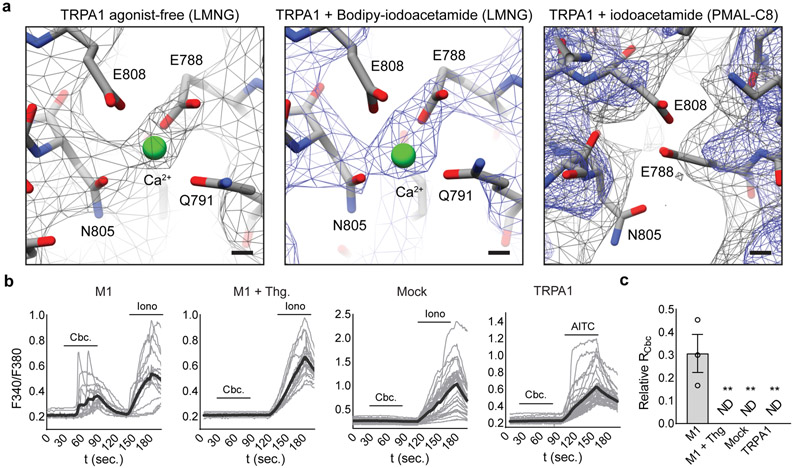
When TRPA1 was solubilized in LMNG, a robust density was seen at the bottom of each S2-S3 α-helices facing the cytoplasm (Fig. 4a, Extended Data Fig. 8a), where it is surrounded by residues E788, Q791, Y799, N805, and E808, typical of calcium coordination sites25. Indeed, this configuration is strikingly similar to a calcium binding site seen in TRPM2, 4 and 8, with all relevant residues conserved (Fig. 4a,b)18,26-28. Because channel purification was carried out in nominally calcium-free buffers, this density likely represents cellular calcium bound to a high affinity site. Interestingly, the proximal S2-S3 loop is better resolved compared with PMAL-C8 structures, where calcium is likely lost during prolonged detergent-amphipol exchange.
Fig. 4. One site subserves three distinct modes of calcium.
a, A calcium ion binds at the cytoplasmic end of S2-S3 helices in the VSD, as seen in TRPM4 and TRPM8. Scale bars = 5Å. b, Sequence alignment reveals conservation of calcium-coordinating residues in TRPA1, TRPM4 and TRPM8. c, Normalized whole-cell currents from TRPA1 WT (n = 6 independent experiments), E788S (n = 8), and E788S, Q791S, N80S triple mutant (n = 10) following bath application of AITC (50 μM) and Ca2+ (2 mM). Data were extracted from 500 msec. voltage ramps (−80 to 80 mV). Scale bars: x = 1 sec, y = arbitrary units. d, Quantification of Ca2+ potentiation (I-transient, Itrans, measured 5 secs post-Ca2+ application) and desensitization (I-sustained, Isus, measured 60 sec post-Ca2+ application). WT, n = 6 independent experiments; E788S, n = 8; E788S, Q791S, N805S triple mutant, n = 10. *, p = 0.04; **, p = 0.005; ****, p < 0.0001 one-way mixed-effects analysis ANOVA with post-hoc Holm-Sidak correction for multiple comparisons; Data displayed as mean ± S.E.M. e-f, Normalized whole cell recordings for TRPA1 channels co-expressed with M1 muscarinic acetylcholine receptor in response to bath applied carbachol (Cbc, 100 μM; data represent n = 7 independent experiments for WT and n = 4 for E788S mutant), with or without Thapsigargin (Thg, 1 μM; n = 5) pre-treatment or inclusion of rapid intracellular Ca2+ chelators EGTA and BAPTA (1 mM each; n = 5). AITC, 50 μM and A-96,10 μM. Scale bars: x = 1 sec, y = arbitrary units. g, Quantification of responses in e-f. ** p = 0.002 for WT vs. +Thg and +Chel; p = 0.004 for WT vs E788S; Kruskal-Wallis test with post-hoc Dunn’s correction for multiple comparisons. Data displayed as mean ± S.E.M.
Permeating calcium has two sequential effects on TRPA1, first enhancing currents and then promoting desensitization8,13. A TRPA1 E788S mutant lacked calcium-mediated potentiation but retained desensitization (Fig. 4c,d), consistent with previous observations15, whereas a triple mutant (E788S, Q791S, and N805S) lacked both. The ability of TRPA1 to function as a receptor-operated channel is likely mediated through consequent release of calcium from intracellular stores (although metabolism of phosphoinositide lipids has also been implicated)12. To ask if this action converges on the same calcium site identified here, we co-expressed the M1 muscarinic receptor and TRPA1 in transfected cells and recorded carbachol (an M1 agonist)-evoked TRPA1 responses in the absence of extracellular calcium. As previously shown8, carbachol elicited robust currents that were blocked by A-96 and absent when intracellular calcium was depleted by thapsigargin pre-treatment or rapidly chelated by EGTA and BAPTA (Fig. 4e,g, Extended Data Fig. 8b,c), reaffirming calcium as the critical second messenger. Most interestingly, the E788S mutant showed no response to carbachol (Fig. 4f,g), demonstrating that major regulatory actions of calcium converge on this single site.
Discussion
Detectors of noxious stimuli function as early warning systems that recognize potentially injurious events before they elicit wholesale tissue damage. To accomplish this, they must balance low threshold sensitivity with high fidelity. The two-step mechanism we propose for electrophile-mediated TRPA1 activation satisfies this requirement and may be especially important for detecting small volatile environmental toxicants (Extended Data Fig. 9e). For larger endogenous algogens that drive inflammatory pain, signal-to-noise considerations are perhaps less relevant since rapid recognition and escape are not germane, and thus single modification by these bulkier electrophiles may suffice (Extended Data Fig. 9f).
TRP channels contain two highly dynamic constrictions along their ion permeation pathway (one corresponding to a canonical lower gate and another at the level of the selectivity filter) that must functionally couple to control activation by diverse stimuli. Our findings suggest that the upper restriction has evolved to serve a range of physiologic functions in this ion channel superfamily: in voltage-gated potassium channels and some TRP channels (i.e., TRPM2) this region is devoted largely to ion selection27,29, whereas in TRPV1 it serves as a regulated gate19. In the case of TRPA1, our results suggest an intermediate function controlling dynamic ion selectivity, which likely underlies the differential ability of activators to elicit pain with or without neurogenic inflammation23.
The calcium binding site we identify in TRPA1 supports an emerging picture of a conserved structural motif for detecting elevated intracellular calcium over a range of concentrations resulting from channel activation and/or store release. In TRPM8 this conserved calcium binding pocket is adjacent to a ligand binding site, and calcium is required for channel activation by the synthetic super-cooling agent, icilin18,30,31. Whether calcium similarly regulates TRPA1 in concert with as-yet undiscovered ligands or post-translational modification32, or how calcium binding effects gating movements, remain intriguing questions for future studies.
Methods
Protein expression and purification
Human TRPA1 was expressed and purified as described previously with slight modifications 6. Briefly, N-terminal-tagged MBP-TRPA1 under the control of a CMV promoter was expressed in HEK293F cells using the BacMam system (Thermo Fisher). Cells were purchased from ATCC, where they were validated and certified free of mycoplasma contamination. Protein expression was induced at cell density 1.5-2.5 × 10⁶ cells ml−1 with media supplemented with 5 mM sodium butyrate and 5 μM ruthenium red. After 16 hr. at 37 °C, cells were harvested by centrifugation at 1,000 × g for 10 mins. Cells were resuspended in lysis buffer (50 mM HEPES, pH 8.0, 150 mM NaCl, 1 mM IP6, 1 mM DTT, 1 mM EDTA, protease inhibitors) and lysed by sonication. Cell membranes were isolated by ultracentrifugation at ~180,000 × g for 45 mins and the pellet was resuspended in lysis buffer before multiple passes through a glass homogenizer. Cell membranes were solubilized by addition of LMNG or CYMAL-5 NG (Anatrace) to a final concentration of 0.5 % (w/v) and rocking at 4°C for 1 hr. Insoluble debris was removed by centrifugation at ~35,000 × g for 20 mins. and the supernatant passed over amylose beads by gravity flow at 4°C. The beads were washed with wash buffer (50 mM HEPES, pH 8.0, 150 mM NaCl, 1 mM IP6, 1 mM DTT, 0.005% LMNG/CYMAL-5 NG) and eluted with wash buffer supplemented with 10 mM maltose.
For exchange into amphipol, PMAL-C8 was added to the detergent-solubilized sample in a 3:1 PMAL:protein ratio. The solution was mixed by rocking at 4°C for 1 hr. before addition of 100 μl bio-beads (Biorad) ml−1 of protein sample. The sample with bio-beads was mixed by rocking at 4°C overnight. The bio-beads were spun down in a tabletop centrifuge at 100 × g and the supernatant analyzed by size exclusion chromatography in detergent-free buffer (50 mM HEPES, pH 8.0, 150 mM NaCl, 1 mM IP6, 1 mM DTT). Peak fractions corresponding to TRPA1 were pooled and concentrated 0.5 - 2 mg ml−1 in a 100K MWCO centrifuge concentrator.
Agonists and antagonists
To acquire samples of activated TRPA1 for structural studies, cell membranes containing TRPA1 was incubated with 100 μM iodoacetamide (IA) or BODIPY-IA (Millipore Sigma) for 10 min. prior to protein purification. Samples of antagonist-bound TRPA1 were acquired by incubating the purified channel with 10 μM A-967079 (A-96) (Tocris) for 10 mins. prior to cryo-EM grid preparation.
Rationale and interpretation of solubilization conditions
TRPA1 protein was imaged in PMAL-C8 amphipol or LMNG detergent. When apo TRPA1 was solubilized CYMAL-5 NG and exchanged into PMAL-C8, we observed two conformational states (closed and open) within the same sample (Fig. 1a), both of which lacked ions in the calcium binding site. However, the A-loop could not be modelled, consistent with the dynamic nature of the loop and the ability of the channel to adopt different states (Extended Data Fig. 2e). Treatment with IA stabilized the A-loop in the ‘up’ conformation in conjunction with an open pore, which we therefore designated an activated state of the channel. Addition of agonist before detergent extraction from membranes was crucial for isolating the channel in the activated state, presumably because solubilization in detergent or amphipol prevents dynamic exchange between different channel conformations. Consistent with this notion, when A-96 was added after channel solubilization in PMAL-C8, the antagonist recognized, but did not shift the equilibrium towards the closed conformation. In LMNG, which produced structures of higher resolutions, the transmembrane core of the channel adopted a closed conformation under both apo and BIA conditions, possibly due to locking of the transmembrane domain by LMNG and/or desensitization of the channel by bound ions in the calcium binding site. This configuration resembles that previously described by us or Suo et. al.7. Consistent with a strongly biased closed state, the A-loop was clearly observed in the ‘down’ (closed) conformation of the apo channel. However, modification of TRPA1 by BIA stabilized the A-loop in the ‘up’ (activated) conformation in conjunction with a closed pore, which likely represents an intermediate state of the channel following electrophile modification.
Cryo-EM data collection and processing
Samples for cryo-EM were prepared by applying 4 μl of purified TRPA1 to 1.2/1.3 holey carbon grids (Quantifoil) and blotting for 8-12 sec. in a Vitrobot Mark IV (Thermo Fisher) prior to plunge freezing in liquid ethane. For multi-shot imaging, samples were prepared on 2/2 holey carbon grids (Quantifoil) and blotted for 6-8 s. Cryo-EM samples were imaged on Polara and Titan Krios microscopes (Thermo Fisher, see Extended Data Table 1 for details) equipped with the K2 Summit camera (Gatan). Movies were drift-corrected using MotionCor234 and CTF parameters estimated with gctf35. Particle images were selected from micrographs using gautomatch (MRC-LMB, https://www.mrc-lmb.cam.ac.uk/kzhang/) and extracted in Relion36. 2- and 3-D classification of particle images was performed in cryoSPARC37 and 3D maps refined in cryoSPARC and cisTEM38. Conversion of data from cryoSPARC to Relion and generation of orientation distribution plots were performed using pyem39. Directional Fourier shell correlations of cryo-EM maps were performed as previously described40.
Model building and analysis
Cryo-EM maps were visualized with UCSF Chimera41. Atomic models were built into the cryo-EM maps with Coot42 using the previously published structure of TRPA1 as a starting model (PDB-ID: 3J9P). The models were refined over multiple rounds using PHENIX Real Space Refinement43. Ligands were built using Coot and their geometric restraints calculated with Phenix eLBOW44. Cysteine pKas were calculated in H++45 and the resultant values used to solve the Henderson-Hasselbalch equation46,47 to determine the percentage free sulfhydryl (Extended Data Fig. 5h). Electrostatic surface potentials for the Apo-LMNG and BODIPY-IA-LMNG structures were calculated in APBS33 using an AMBER forcefield and are displayed at ± 10 kT/e− (Fig. 2d; and Extended Data Fig 3 and 7).
Agonist-binding assay
800 mL cultures of HEK293F cells (1.0 million cells/ml) were transfected with wild-type or mutant TRPA1 DNA using FectoPro (Polyplus Transfection) reagent. Cultures were supplemented with sodium butyrate immediately after transfection and grown for 2 days at 37°C, 8 % CO2, and with shaking at 135 RPM. Cells were harvested by centrifugation at 1000 × g for 10 mins and then resuspended in 20 ml of lysis buffer (see above in “Protein expression and purification”). The cells were incubated with 100 μM BODIPY-IA (Millipore Sigma) for 10 mins prior to TRPA1 purification (described above in “Protein expression and purification”). The fluorescence of the purified/modified protein was quantified using a plate reader (excitation/emission: 455/520 nm), normalized for protein concentration measured by TRP fluorescence (excitation/emission: 280/337 nm).
Molecular Biology and Cell Culture
Full-length wild-type human TRPA1 in the mammalian/oocyte expression vector pMO and full-length wild-type human M1 muscarinic acetylcholine receptor in the mammalian expression vector pcDNA3.1 served as templates for all physiology experiments6,48,49. Constructs generated from these templates were produced by Gibson assembly (New England Biolabs) and verified by sequencing. HEK293T (ATCC) cells were cultured at 37 °C, 5% CO2 in DMEM Complete (DMEM-C; Dulbecco’s modified Eagle’s medium containing 10% (v/v) heat-inactivated calf serum, 100 U ml−1 Penicillin G and 0.1 mg ml−1 Streptomycin). These cells were purchased from ATCC, where they were validated and certified free of mycoplasma contamination. For heterologous expression, HEK293T cells were transfected with 1 μg of TRPA1 and/or M1 with 100 ng of eGFP in pcDNA3.1, which were combined with 3x (w/w) Lipofectamine 2000 (Thermo-Fisher) for 8 hrs. in Opti-MEM (Thermo Fisher). Cells were then plated onto coverslips coated with 0.01% poly-L-Lysine (MW 70-150,000, MilliporeSigma) and adhered to these coverslips for at least 12 hr. before use in calcium-imaging or electrophysiology experiments.
Calcium imaging
Ratiometric Ca2+-imaging was carried out on transfected HEK293T cells prepared as above. Adherent cells were loaded for 30 min. in the dark at room temperature (RT) in Ringer’s solution containing 0.1 mg ml−1 Fura-2 AM dye and 0.02% (w/v) Pluronic F-127. Data were generated by exciting the cells with 340 then 380 nm light using a Lambda DG-4 Illuminator (Sutter), imaged with a Grasshopper3 camera (FLIR), then analyzed in MetaFluor (Molecular Devices). Data were quantified as the ratio of 340 to 380 nm fluorescence after background subtraction.
Electrophysiology
Capillary pipettes from borosilicate glass with filament (O.D × I.D, 1.10 × 0.86 mm, Sutter Instruments) were fashioned and fire-polished to a resistance of 0 – 5 mΩ for whole-cell recordings and 5 – 10 mΩ for excised patch recordings. Electrophysiological data were collected at RT using an Axopatch 200B amplifier (Axon Instruments) and digitized with a Digidata 1550B (Axon Instruments). Voltage protocols were delivered and resulting currents monitored on-line with pClamp10 (Molecular Devices), then analyzed off-line in pClamp or Prism (GraphPad). All electrophysiological recordings and pharmacological manipulations were carried out under laminar flow using a pressure-driven micro-perfusion system (SmartSquirt, Automate Scientific).
For whole-cell recordings, the bath solution consisted of Ca2+-free Ringer’s solution (140 mM NaCl, 10 mM HEPES, 5 mM KCl, 2 mM MgCl2, and 10 mM Glucose; pH 7.4 with NaOH; 290-300 mOsm kg−1data), data were digitized at 10 kHz and filtered at 1 kHz. The internal solution contained 140 mM CsMeSO4; 10 mM HEPES; 1 mM MgCl2; and, as indicated, 0 or 1 mM EGTA. The pH was set to 7.2 with CsOH and osmolarity to 300-310 mOsm kg−1 with sucrose. Unless otherwise stated in the figure legends, analysis of IA- and BIA-evoked TRPA1 currents in whole-cell patch clamp mode was carried out at Vhold = −80 mV. Current-voltage relationships were then measured at steady state in response to voltage steps (500 msec.) from −80 to 80 mV in 10 mV increments using on-line leak subtraction (P/4). Tail-currents were then evoked by a brief (250 msec.) test pulse of −120 mV. The decay-time constant τ for each tail-current was determined by fitting a one-phase exponential decay function in pClamp to the tail-current obtained following the 80 mV step50. For analysis of Ca2+-modulation, TRPA1 currents were continuously monitored over a 500 msec voltage ramp from −80 to 80 mV. Inside-out excised-patch recordings were carried out in symmetrical solutions of 150 mM NaCl, 10 mM HEPES, 2 mM EGTA, 1 mM MgCl2, and 1 mM IP6; pH 7.3 with NaOH; 300-310 mOsm kg−1 at a constant holding voltage of −40 mV; sampled at 20 kHz; and filtered at 2 kHz.
Statistics and Experimental Design
Electrophysiological data are presented as mean ± S.E.M. unless otherwise noted. We carried out statistical testing in Prism (GraphPad). Where appropriate, we used parametric significance tests assuming equal variance and a normal distribution of data. Where either of these assumptions were violated, we used non-parametric tests, as indicated in the figure legends. Choice of tests were justified given the experimental design; they are standard tests for similar experiments. For all tests, a priori, we set α = 0.05 and represent statistical significance with the p value, as indicated in the figure legends. We selected sample sizes for all experiments based on our laboratory and others’ experience with similar assays, and in consideration of reagent availability and technical feasibility. We made no predetermination of sample size and thus carried out the minimum number of biological replicates required for strong inference and reproducibility, as indicated in the figure legends.
Extended Data
Extended Data Fig. 1. Pharmacology and cryo-EM data collection and processing for TRPA1.
a, All points histograms depicting the change in open probability (P(o)) in a single TRPA1 channel in response to IA-application. Data represent n = 9 independent excised inside-out patches. Vhold = −40 mV. b, SDS-PAGE showing MBP-TRPA1 (arrowhead) after pull-down and elution from amylose beads. c, Cryo-EM image of MBP-TRPA1. Scale bar: 20 nm. d, 2D classification of cryo-EM particle images showing TRPA1 in different orientations. Scale bar: 25 Å. e, Pharmacological agents used in this study.
Extended Data Fig. 2. Fourier shell correlation of cryo-EM maps, orientation distribution of particle image views, and local resolution of TRPA1 cryo-EM maps.
a, Fourier shell correlation and 1D directional Fourier shell correlation plots. TRPA1 (PMAL) + A-967079 class 2 denotes the structure derived from 3D classification of antagonist-treated samples in PMAL and represents the open state channel without antagonist bound. b, 3D representations of the directional Fourier shell correlation. c, Fourier space covered, based on dFSC at 0.143. d, Orientation distribution of particle image refinement angles. e, The A-loop is lower resolution compared to surrounding map regions, indicating its dynamic nature. In the activated (TRPA1+iodoacetamide) and open state (TRPA1 + A967079 PMAL-C8 class 2) conformations, the bottom of S6 is lower resolution compared to surrounding regions, indicating structural flexibility at the level of the lower gate. Scale bars: 5Å.
Extended Data Fig. 3. Surface charge distribution of TRPA1's extracellular face.
Electrostatic potential maps were calculated in APBS and are displayed at ± 10 kT/e−. In silico mutations of D915 were modeled and experimentally determined relative permeability ratios for these mutations sourced from Wang et al. (ref. 13). Scale bar: 30Å.
Extended Data Fig. 4. Map densities of agonists and transmembrane α-helices.
a, Strong density is observed for iodoacetamide bound to C621. Weaker density is observed next to C665, which indicate that some of the channels may be modified by agonist at this site. Map threshold: σ = 4. b, Clear density for BODIPY-iodoacetamide (BIA) is observed bound to C621. No additional density is observed next to C665 in this case. Map threshold: σ = 6. c, Segmented map densities and atomic models for TRPA1 + BIA (LMNG). Scale bars: 3Å. d, Map density of the A-loop in different states: undefined (TRPA1+A-96, PMAL-C8), 'down' (TRPA1 agonist-free, LMNG), and 'up' (TRPA1+BIA, LMNG). Densities are shown at two different thresholds (σ = 4 and 6). Scale bars: 5Å.
Extended Data Fig. 5. Characterization of TRPA1 activation by IA and BIA.
a, IA (100 μM) activates TRPA1 through covalent modification of cysteines; AITC (250 or 1000 μM). Data represent n = 6 (WT) or 5 (3C) independent experiments. Statistical significance is reported as the result of an unpaired two-tailed Mann-Whitney test; **, p = 0.002; Vhold = −80 mV. b,c, No single cysteine is sufficient for TRPA1 activation by IA. WT, data represent n = 9 independent experiments ; C621S/C641S n = 3; C621S/C665S, n = 3; and C641S/C665S, n = 4. Data were acquired in whole-cell patch clamp mode and reflect the results of 500 msec. test pulse (80 mV). Vhold = −80 mV. Doses: IA, 100 μM; A-96,10 μM; AITC, 250 or 1000 μM. Scale bars: x, 50 msec.; y, 100 pA. I = 0, dashed line. d, Quantification of double cysteine mutant data. (left) WT, n = 6 independent experiments; C621S/C641S n = 3; C621S/C665S, n = 3; and C641S/C665S, n = 3. Vhold = −80 mV. (right) WT, data represent n = 9 independent experiments; C621S/C641S n = 3; C621S/C665S, n = 3; and C641S/C665S, n = 4. Doses: IA, 100 μM; A-96,10 μM; AITC, 250 or 1000 μM. Statistical significance is reported as the result of a Kruskal-Wallis test with post-hoc Dunn’s test to correct for multiple comparisons; *, p = 0.02; **, p = 0.007. e,f C621S display complete loss of IA sensitivity while C641S retains full sensitivity. Data represent n = 5 independent experiments/construct. Data were acquired in whole-cell patch clamp mode and reflect the results of 500 msec. test pulses from −80 to 80 mV. Vhold = −80 mV. Doses: IA, 100 μM; A-96, 10 μM. Scale bars: x, 25 msec.; y, 100 pA. g, Binding of BIA to TRPA1 C641S/C665S double mutant (C621*) is similar to wildtype. Statistical significance is represented as the results of one-way ANOVA with post-hoc Holm-Sidak correction for multiple comparisons; *, p = 0.03; n = 3 independent experiments/construct. h, TRPA1 cysteine pKa values and deduced proportion of thiolate in the agonist-free state (PDB-ID: 6V9W), and IA-bound (‘Activated,’ PDB-ID: 6V9V) state in the presence or absence of covalent modification at C621. All summary data are displayed as the mean ± S.E.M..
Extended Data Fig. 6. Analysis of TRPA1 tail currents.
a, Scaled averaged basal (WT, n = 10 independent experiments; C665S, n = 6), IA (100 μM; WT, n = 5; C665S, n = 5), or BIA (100 μM; C665S, n = 6)-evoked tail currents for TRPA1 WT and C665S mutant channels. Mean deactivation time constants (τ) are shown with 95% CI in parentheses. Scale bar: x = 5 msec., y = arbitrary units. Data were acquired in whole-cell patch clamp mode after a 500 msec. pre-pulses (−80 to 80 mV in 10 mV increments) followed by a 250 msec test pulse (−120 mV). Vhold = −80 mV. b, Quantification of changes in IA- and c, BIA-evoked TRPA1 tail-current decay time constants in WT and C665S TRPA1. Statistical significance is represented as the results of a ratio paired two-tailed student’s t-test; (panel b) *, p = 0.01; (panel c) *, p = 0.02, **, p = 0.009.
Extended Data Fig. 7. Positive electrostatic potential below the lower gate.
a, The TRP helix forms an electric dipole with electro-positive K969 at the N terminus and electro-negative carbonyl oxygens at the C terminus. b, When the A-loop is oriented in the 'up' position, K671 is coordinated by the carbonyl oxygens at the C terminus of the TRP helix and increases its dipole moment to enhance the positive electrostatic potential at the N terminus. c, The C-terminal carbonyl oxygens of the TRP helix form a pocket that is unoccupied in the agonist-free channel. d, Coordination of K671 with the carbonyl oxygens at the TRP helix C terminus increases the positive electrostatic potential at the TRP helix N terminus. In silico substitution of K671 with glutamate decreases the electrostatic potential of the TRP helix. e, Conformational changes associated with pore dilation further increase the positive electrostatic potential of the TRP domain. f, Multiple sequence alignment of TRPA1 orthologs.
Extended Data Fig. 8. Calcium map densities and calcium-imaging of Ca2+ modulation.
a, Calcium is bound in both agonist-free (σ = 4) and agonist-treated (σ = 8) samples in LMNG detergent, with E788 and N805 displaying the most robust densities coordinating calcium. No density for calcium is observed for the channel in amphipol (gray, σ = 4; blue, σ = 8). b, Carbachol (Cbc., 100 μM) evokes intracellular Ca2+-release through activation of the M1 muscarinic acetylcholine receptor. Cbc. was applied in Ca2+-free Ringer’s solution with 1 mM EGTA to isolate intracellular responses. n = 16 (M1), 18 (M1 + Thg.), 33 (Mock), or 44 (TRPA1) cells. Each graph represent n = 3 (M1, M1 + Thg.), 4 (Mock), or 5 (TRPA1) independent experiments. Iono., Ionomycin, 1 μM; Thg., Thapsigargin, 1 μM; AITC, 50 μM. Gray traces represent individual cells and black traces the average of all cells in a given experiment. c, Quantification of Ca2+-imaging experiments. The ratio evoked by Cbc. was normalized to the Iono.- or, in TRPA1-transfected cells, AITC-evoked response. *, p < 0.01, Kruskal-Wallis test with post-hoc Dunn’s test to correct for multiple comparisons; n = 3 (M1, M1 + Thg.), 4 (Mock), or 5 (TRPA1) independent experiments. ND = response not detected. Data represent the mean ± S.E.M..
Extended Data Fig. 9. Binding of A-967079 to TRPA1 and 2-step model of electrophile action.
a, The overall architecture of agonist-free and antagonist-bound TRPA1 is similar, representing a closed state. b, A-967079 binds at the elbow of S5, sandwiched between S6 and P1. c, Binding of A-967079 results in a slight shift in S5 and repositioning of F877. d, The antagonist is in an ideal position to block the straightening of the S5 elbow and inhibit channel gating. e, 2-step model of electrophile action on TRPA1. Attachment of a small electrophile to C621 results in A-loop rearrangement to the 'up' position, bringing C665 into the reactive pocket. Modification of C665 by a second small electrophile stabilizes the A-loop in the 'up' conformation and positions K671 at the C-terminus of the TRP helix, enhancing the electric dipole of this region. f, Attachment of a large electrophile to C621 is sufficient to stabilize the A-loop in the 'up' conformation and activate the channel. g, Increased positive electrostatic potential and charge repulsion at N-termini of adjacent TRP helices initiates conformational changes associated with dilation of the lower gate. These movements are coupled to widening of the upper gate and selectivity filter through straightening of the S5 helix. The antagonist A-967079 binds to the bent elbow region of S5, inhibiting straightening of the α-helix required for channel gating.
Extended Data Table 1.
Cryo-EM data collection, refinement and validation statistics.
| TRPA1+BIA (LMNG) (EMD-21127) (PDB 6V9V) |
TRPA1 agonist- free (LMNG) (EMD-21128) (PDB 6V9W) |
TRPA1+IA (PMAL-C8) (EMD-21129) (PDB 6V9X) |
TRPA1+A-96 (PMAL-C8) Class 1 (EMD-21130) (PDB 6V9Y) |
TRPA1+A-96 (PMAL-C8) Class 2 (EMD-21131) |
|
|---|---|---|---|---|---|
| Data collection and processing | |||||
| Magnification | 22,500 | 75,000 | 31,000 | 31,000 | 31,000 |
| Voltage (kV) | 300 | 300 | 300 | 300 | 300 |
| Electron exposure (e−/Å2) | 25 | 30 | 40 | 40 | 40 |
| Defocus range (μm) | 0.8-2.0 | 0.8-2.0 | 1.3-2.5 | 1.3-2.5 | 1.3-2.5 |
| Pixel size (Å) | 1.05 | 1.06 | 1.22 | 1.22 | 1.22 |
| Symmetry imposed | C4 | C4 | C4 | C4 | C4 |
| Initial particle images (no.) | 374,863 | 242,399 | 456,208 | 296,991 | 296,991 |
| Final particle images (no.) | 212,751 | 130,595 | 190,112 | 30,321 | 78,959 |
| Map resolution (Å) | 2.6 | 3.1 | 3.3 | 3.6 | 3.5 |
| FSC threshold | 0.143 | 0.143 | 0.143 | 0.143 | 0.143 |
| Map resolution range (Å) | 2.3-4.1 | 2.6-5.2 | 2.8-5.6 | 3.2-8.5 | 3.1-6.5 |
| Refinement | |||||
| Initial model used (PDB code) | 3J9P | 3J9P | 3J9P | 3J9P | |
| Model resolution (Å) | 2.8 | 3.4 | 3.4 | 3.8 | |
| FSC threshold | 0.5 | 0.5 | 0.5 | 0.5 | |
| Model resolution range (Å) | 357-2.8 | 360-3.4 | 311-3.4 | 311-3.8 | |
| Map sharpening B factor (Å2) | −25 | −25 | −100 | −100 | |
| Model composition | |||||
| Non-hydrogen atoms | 18,976 | 18,812 | 18,084 | 17,716 | |
| Protein residues | 2,384 | 2,388 | 2,280 | 2,248 | |
| Ligands | 8 | 4 | 4 | 0 | |
| B factors (Å2) | |||||
| Protein | 89 | 165 | 55 | 112 | |
| Ligand | 112 | 216 | 57 | 0 | |
| R.m.s. deviations | |||||
| Bond lengths (Å) | 0.008 | 0.008 | 0.004 | 0.009 | |
| Bond angles (°) | 0.904 | 0.965 | 0.880 | 1.179 | |
| Validation | |||||
| MolProbity score | 1.57 | 1.62 | 1.48 | 1.99 | |
| Clashscore | 3.47 | 4.53 | 3.52 | 6.53 | |
| Poor rotamers (%) | 1.2 | 1.21 | 1.24 | 2.13 | |
| Ramachandran plot | |||||
| Favored (%) | 94.6 | 95.26 | 96.07 | 94.38 | |
| Allowed (%) | 5.4 | 4.74 | 3.93 | 5.62 | |
| Disallowed (%) | 0.0 | 0.0 | 0.0 | 0.0 |
| TRPA1 class 1 (PMAL-C8) (EMD-21537) |
TRPA1 class 2 (PMAL-C8) (EMD-21538) |
|
|---|---|---|
| Data collection and processing | ||
| Magnification | 31,000 | 31,000 |
| Voltage (kV) | 300 | 300 |
| Electron exposure (e−/Å2) | 40 | 40 |
| Defocus range (μm) | 0.5-4.5 | 0.5-4.5 |
| Pixel size (Å) | 1.22 | 1.22 |
| Symmetry imposed | C4 | C4 |
| Initial particle images (no.) | 53,301 | 53,301 |
| Final particle images (no.) | 15,557 | 28,558 |
| Map resolution (Å) | 5.9 | 4.3 |
| FSC threshold | 0.143 | 0.143 |
| Map resolution range (Å) | 4.8-8.7 | 3.8-6.7 |
Supplementary Material
Supplemental Video 1. Channel modification by BODIPY-iodoacetamide and activation of TRPA1.
Acknowledgments
Some data for this study were collected at the Toronto High-Resolution High-Throughput cryo-EM facility, supported by the Canada Foundation for Innovation and Ontario Research Fund. This work was supported by an American Heart Association Postdoctoral Fellowship (J.Z.), a Banting Postdoctoral Fellowship from the Canadian Institutes of Health Research (J.Z.), an NSF Graduate Research Fellowship (No. 1650113 to J.V.L.K), a UCSF Chuan-Lyu Discovery Fellowship (J.V.L.K), a Helen Hay Whitney Foundation Postdoctoral Fellowship (C.E.P.) and grants from the NIH (R35 NS105038 to D.J; R01 GM098672, S10 OD021741, and S10 OD020054 to Y.C.; T32 HL007731 to C.E.P.; and T32 GM007449 to J.V.L.K). Y.C. is an Investigator of the Howard Hughes Medical Institute.
Footnotes
Competing Interests The authors declare no competing interests.
Data Availability and Code Availability Cryo-EM maps have been deposited in the Electron Microscopy Data Bank under EMD-21127, EMD-21128, EMD-21129, EMD-21130, EMD-21131, EMD-21537, and EMD-21538. Atomic models have been deposited in the Protein Data Bank under 6V9V, 6V9W, 6V9X, and 6V9Y.
Supplemental Information is available.
References
- 1.Bautista DM, Pellegrino M & Tsunozaki M TRPA1: A gatekeeper for inflammation. Annu Rev Physiol 75, 181–200 (2013). [DOI] [PMC free article] [PubMed] [Google Scholar]
- 2.Chen J & Hackos DH TRPA1 as a drug target--promise and challenges. Naunyn Schmiedebergs Arch Pharmacol 388, 451–463, doi: 10.1007/s00210-015-1088-3 (2015). [DOI] [PMC free article] [PubMed] [Google Scholar]
- 3.Hinman A, Chuang HH, Bautista DM & Julius D TRP channel activation by reversible covalent modification. Proc Natl Acad Sci U S A 103, 19564–19568 (2006). [DOI] [PMC free article] [PubMed] [Google Scholar]
- 4.Macpherson LJ et al. Noxious compounds activate TRPA1 ion channels through covalent modification of cysteines. Nature 445, 541–545 (2007). [DOI] [PubMed] [Google Scholar]
- 5.Bahia PK et al. The exceptionally high reactivity of Cys 621 is critical for electrophilic activation of the sensory nerve ion channel TRPA1. J Gen Physiol 147, 451–465 (2016). [DOI] [PMC free article] [PubMed] [Google Scholar]
- 6.Paulsen CE, Armache JP, Gao Y, Cheng Y & Julius D Structure of the TRPA1 ion channel suggests regulatory mechanisms. Nature 520, 511–517 (2015). [DOI] [PMC free article] [PubMed] [Google Scholar]
- 7.Suo Y et al. Structural Insights into Electrophile Irritant Sensing by the Human TRPA1 Channel. Neuron 105, 882–894.e885 (2020). [DOI] [PMC free article] [PubMed] [Google Scholar]
- 8.Jordt SE et al. Mustard oils and cannabinoids excite sensory nerve fibres through the TRP channel ANKTM1. Nature 427, 260–265 (2004). [DOI] [PubMed] [Google Scholar]
- 9.Bandell M et al. Noxious cold ion channel TRPA1 is activated by pungent compounds and bradykinin. Neuron 41, 849–857 (2004). [DOI] [PubMed] [Google Scholar]
- 10.Dai Y et al. Sensitization of TRPA1 by PAR2 contributes to the sensation of inflammatory pain. J Clin Invest 117, 1979–1987 (2007). [DOI] [PMC free article] [PubMed] [Google Scholar]
- 11.Wilson SR et al. The epithelial cell-derived atopic dermatitis cytokine TSLP activates neurons to induce itch. Cell 155, 285–295 (2013). [DOI] [PMC free article] [PubMed] [Google Scholar]
- 12.Talavera K et al. Mammalian Transient Receptor Potential TRPA1 Channels: From Structure to Disease. Physiol Rev 100, 725–803 (2020). [DOI] [PubMed] [Google Scholar]
- 13.Wang YY, Chang RB, Waters HN, McKemy DD & Liman ER The nociceptor ion channel TRPA1 is potentiated and inactivated by permeating calcium ions. J Biol Chem 283, 32691–32703 (2008). [DOI] [PMC free article] [PubMed] [Google Scholar]
- 14.Zurborg S, Yurgionas B, Jira JA, Caspani O & Heppenstall PA Direct activation of the ion channel TRPA1 by Ca2+. Nat Neurosci 10, 277–279 (2007). [DOI] [PubMed] [Google Scholar]
- 15.Zimova L et al. Intracellular cavity of sensor domain controls allosteric gating of TRPA1 channel. Sci Signal 11 (2018). [DOI] [PubMed] [Google Scholar]
- 16.Sura L et al. C-terminal acidic cluster is involved in Ca2+-induced regulation of human transient receptor potential ankyrin 1 channel. J Biol Chem 287, 18067–18077 (2012). [DOI] [PMC free article] [PubMed] [Google Scholar]
- 17.Hasan R, Leeson-Payne ATS, Jaggar JH & Zhang X Calmodulin is responsible for Ca2+-dependent regulation of TRPA1 Channels. Scientific Reports 7, 45098 (2017). [DOI] [PMC free article] [PubMed] [Google Scholar]
- 18.Diver MM, Cheng Y & Julius D Structural insights into TRPM8 inhibition and desensitization. Science 365, 1434–1440 (2019). [DOI] [PMC free article] [PubMed] [Google Scholar]
- 19.Cao E, Liao M, Cheng Y & Julius D TRPV1 structures in distinct conformations reveal activation mechanisms. Nature 504, 113–118 (2013). [DOI] [PMC free article] [PubMed] [Google Scholar]
- 20.Karashima Y et al. Agonist-induced changes in Ca(2+) permeation through the nociceptor cation channel TRPA1. Biophys J 98, 773–783 (2010). [DOI] [PMC free article] [PubMed] [Google Scholar]
- 21.Bobkov YV, Corey EA & Ache BW The pore properties of human nociceptor channel TRPA1 evaluated in single channel recordings. Biochim Biophys Acta 1808, 1120–1128 (2011). [DOI] [PMC free article] [PubMed] [Google Scholar]
- 22.Christensen AP, Akyuz N & Corey DP The Outer Pore and Selectivity Filter of TRPA1. PLoS One 11, e0166167 (2016). [DOI] [PMC free article] [PubMed] [Google Scholar]
- 23.Lin King JV et al. A Cell-Penetrating Scorpion Toxin Enables Mode-Specific Modulation of TRPA1 and Pain. Cell 178, 1362–1374.e1316 (2019). [DOI] [PMC free article] [PubMed] [Google Scholar]
- 24.Hilton JK, Kim M & Van Horn WD Structural and Evolutionary Insights Point to Allosteric Regulation of TRP Ion Channels. Acc Chem Res 52, 1643–1652, doi: 10.1021/acs.accounts.9b00075 (2019). [DOI] [PMC free article] [PubMed] [Google Scholar]
- 25.Wang X, Kirberger M, Qiu F, Chen G & Yang JJ Towards predicting Ca2+-binding sites with different coordination numbers in proteins with atomic resolution. Proteins 75, 787–798 (2009). [DOI] [PMC free article] [PubMed] [Google Scholar]
- 26.Autzen HE et al. Structure of the human TRPM4 ion channel in a lipid nanodisc. Science 359, 228–232 (2018). [DOI] [PMC free article] [PubMed] [Google Scholar]
- 27.Huang Y, Winkler PA, Sun W, Lü W & Du J Architecture of the TRPM2 channel and its activation mechanism by ADP-ribose and calcium. Nature 562, 145–149 (2018). [DOI] [PubMed] [Google Scholar]
- 28.Zhang Z, Tóth B, Szollosi A, Chen J & Csanády L Structure of a TRPM2 channel in complex with Ca2+ explains unique gating regulation. eLife 7, e36409 (2018). [DOI] [PMC free article] [PubMed] [Google Scholar]
- 29.Doyle DA et al. The structure of the potassium channel: molecular basis of K+ conduction and selectivity. Science 280, 69–77 (1998). [DOI] [PubMed] [Google Scholar]
- 30.Chuang H. h., Neuhausser WM & Julius D The Super-Cooling Agent Icilin Reveals a Mechanism of Coincidence Detection by a Temperature-Sensitive TRP Channel. Neuron 43, 859–869 (2004). [DOI] [PubMed] [Google Scholar]
- 31.Yin Y et al. Structural basis of cooling agent and lipid sensing by the cold-activated TRPM8 channel. Science 363, doi: 10.1126/science.aav9334 (2019). [DOI] [PMC free article] [PubMed] [Google Scholar]
- 32.Meents JE, Fischer MJM & McNaughton PA Sensitization of TRPA1 by Protein Kinase A. PLOS ONE 12, e0170097 (2017). [DOI] [PMC free article] [PubMed] [Google Scholar]
- 33.Baker NA, Sept D, Joseph S, Holst MJ & McCammon JA Electrostatics of nanosystems: application to microtubules and the ribosome. Proc Natl Acad Sci U S A 98, 10037–10041 (2001). [DOI] [PMC free article] [PubMed] [Google Scholar]
- 34.Zheng SQ et al. MotionCor2: anisotropic correction of beam-induced motion for improved cryo-electron microscopy. Nature Methods 14, 331–332 (2017). [DOI] [PMC free article] [PubMed] [Google Scholar]
- 35.Zhang K Gctf: Real-time CTF determination and correction. Journal of Structural Biology 193, 1–12 (2016). [DOI] [PMC free article] [PubMed] [Google Scholar]
- 36.Zivanov J et al. New tools for automated high-resolution cryo-EM structure determination in RELION-3. eLife 7, e42166 (2018). [DOI] [PMC free article] [PubMed] [Google Scholar]
- 37.Punjani A, Rubinstein JL, Fleet DJ & Brubaker MA cryoSPARC: algorithms for rapid unsupervised cryo-EM structure determination. Nature Methods 14, 290–296 (2017). [DOI] [PubMed] [Google Scholar]
- 38.Grant T, Rohou A & Grigorieff N cisTEM, user-friendly software for single-particle image processing. eLife 7, e35383 (2018). [DOI] [PMC free article] [PubMed] [Google Scholar]
- 39.Asarnow D, Palovcak E, and Cheng Y UCSF pyem v0.5. doi: 10.5281/zenodo.3576630 (2019). [DOI] [Google Scholar]
- 40.Dang S et al. Cryo-EM structures of the TMEM16A calcium-activated chloride channel. Nature 552, 426–429 (2017). [DOI] [PMC free article] [PubMed] [Google Scholar]
- 41.Pettersen EF et al. UCSF Chimera—A visualization system for exploratory research and analysis. Journal of Computational Chemistry 25, 1605–1612 (2004). [DOI] [PubMed] [Google Scholar]
- 42.Emsley P, Lohkamp B, Scott WG & Cowtan K Features and development of Coot. Acta Crystallographica Section D 66, 486–501 (2010). [DOI] [PMC free article] [PubMed] [Google Scholar]
- 43.Afonine PV et al. Real-space refinement in PHENIX for cryo-EM and crystallography. Acta Crystallographica Section D 74, 531–544 (2018). [DOI] [PMC free article] [PubMed] [Google Scholar]
- 44.Moriarty NW, Grosse-Kunstleve RW & Adams PD electronic Ligand Builder and Optimization Workbench (eLBOW): a tool for ligand coordinate and restraint generation. Acta Crystallographica Section D 65, 1074–1080 (2009). [DOI] [PMC free article] [PubMed] [Google Scholar]
- 45.Anandakrishnan R, Aguilar B & Onufriev AV H++ 3.0: automating pK prediction and the preparation of biomolecular structures for atomistic molecular modeling and simulations. Nucleic acids research 40, W537–W541 (2012). [DOI] [PMC free article] [PubMed] [Google Scholar]
- 46.Henderson LJ Concerning the relationship between the strength of acids and their capacity to preserve neutrality. Am. J. Physiol. 21, 173–179 (1908). [Google Scholar]
- 47.Hasselbalch KA Die Berechnung der Wasserstoffzahl des Blutes aus der freien und gebundenen Kohlensäure desselben, und die Sauerstoffbindung des Blutes als Funktion der Wasserstoffzahl. Biochemische Zeitschrift 78, 112–114 (1917). [Google Scholar]
- 48.Cordero-Morales JF, Gracheva EO & Julius D Cytoplasmic ankyrin repeats of transient receptor potential A1 (TRPA1) dictate sensitivity to thermal and chemical stimuli. Proceedings of the National Academy of Sciences of the United States of America 108, E1184–E1191 (2011). [DOI] [PMC free article] [PubMed] [Google Scholar]
- 49.Gracheva EO et al. Molecular basis of infrared detection by snakes. Nature 464, 1006–1011 (2010). [DOI] [PMC free article] [PubMed] [Google Scholar]
- 50.Sakmann B & Neher E Single-channel recording. (Springer, 2009). [Google Scholar]
Associated Data
This section collects any data citations, data availability statements, or supplementary materials included in this article.
Supplementary Materials
Supplemental Video 1. Channel modification by BODIPY-iodoacetamide and activation of TRPA1.


