Abstract
Extrachromosomal DNA (ecDNA) amplification promotes intratumoral genetic heterogeneity and accelerated tumor evolution1–3, but its frequency and clinical impact are unclear. Here we show, using computational analysis of whole-genome sequencing data from 3,212 cancer patients, that ecDNA amplification frequently occurs in most cancer types, but not in blood or normal tissue. Oncogenes were highly enriched on amplified ecDNA and the most common recurrent oncogene amplifications arise on ecDNA. EcDNA amplifications resulted in higher levels of oncogene transcription compared to copy number matched linear DNA, coupled with enhanced chromatin accessibility and more frequently resulted in transcript fusions. Patients whose cancers carry ecDNAs have significantly shorter survival, even when controlled for tissue type, than do patients whose cancers are not driven by ecDNA-based oncogene amplification. The results presented here demonstrate that ecDNA-based oncogene amplification is common in cancer, is different from chromosomal amplification and drives poor outcome for patients across many cancer types.
Somatic gain of function alterations in driver oncogenes play a central role in cancer development4–6. Oncogene amplification is the most common gain of function alteration in cancer5,6, enabling tumor cells to circumvent the checks and balances that are in place during homeostasis to drive tumor growth. EcDNA-based amplification has long been recognized as a way for cells to increase the copy number of specific genes7,8, but their frequency is unclear. EcDNA amplification may enable tumors to reach high copy of growth promoting genes, while maintaining intratumoral genetic heterogeneity through its non-chromosomal mechanism of inheritance1–3,9,10. To date, low throughput cytogenetic methods have been used to infer extrachromosomal status of DNA amplifications11. Consequently, the frequency, distribution, and clinical impact of ecDNA-based amplification has not been comprehensively assessed. More recently, computational analyses of whole-genome sequencing (WGS) data and new circular DNA library enrichment approaches have suggested a relatively high frequency of ecDNA, particularly in tumors of the central nervous system12–14. Here we set out to perform a global survey of the frequency of ecDNA-based oncogene amplifications, while investigating their contents and determining its clinical context.
We leveraged three characteristic properties of ecDNA to enable our computational analysis: 1) ecDNA are circular, 2) they are highly amplified, and 3) they lack a centromere. These properties provide a basis for the AmpliconArchitect tool, that enables detection and characterization of ecDNA from WGS data12. We applied AmpliconArchitect12 to WGS data from tumor tissue, matched normal tissue and blood, from The Cancer Genome Atlas (TCGA) (n = 3,731) and tumors from The Pan-Cancer Analysis of Whole Genomes (PCAWG) (n = 1,291)15, to quantify and characterize the architecture of regions that are larger than 10kb and have more than 4 copies (CN>4) above median sample ploidy (Supplementary Table 1). Amplicons were classified as 1. ‘Circular’ (Fig. 1A) representing amplicons residing extrachromosomally, 2. ‘BFB’ if they bore a signature16 of having been created by a Breakage-Fusion-Bridge (BFB) mechanism, 3. as ‘Heavily-rearranged’, for non-circular amplicons containing pieces of DNA (DNA segments) from different chromosomes, or regions that were very far apart on chromosomes (>1Mb) regions, or 4. ‘Linear’ for linear amplifications. Amplicon status provided the basis for classification of tumor samples. Samples lacking amplifications were labeled ‘No-fSCNA’, for ‘no focal somatic copy number amplification detected’.
Fig. 1 |. Frequency of circular amplification across tumor and non-tumor tissues.
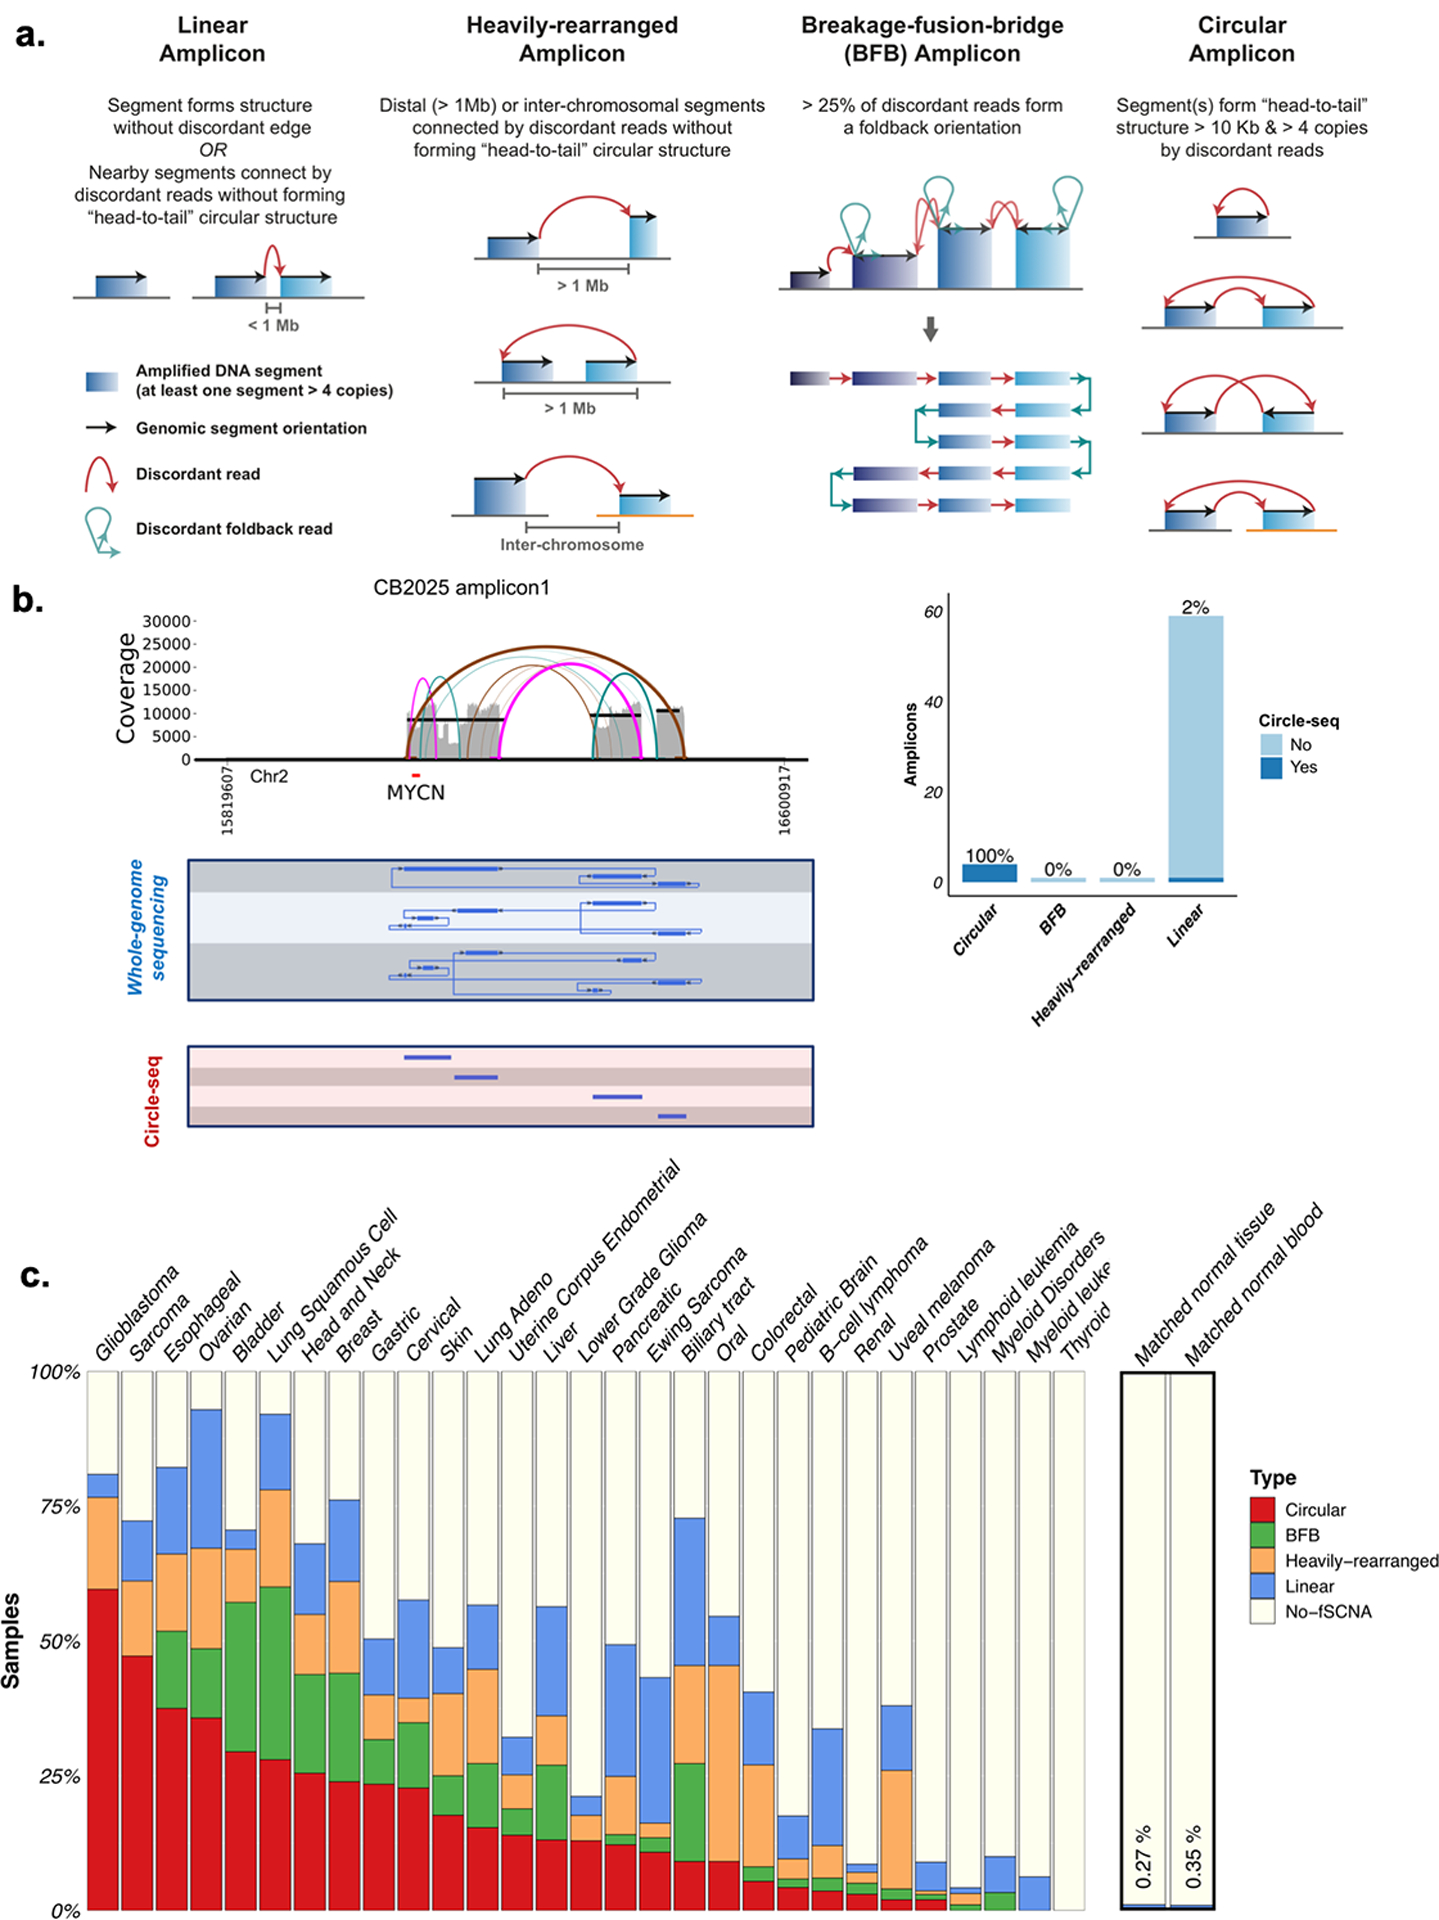
A. Schematic representation of the four classification categories. All DNA regions with a copy number of 4 or greater than ploidy and comprising at least 10 kb were classified using a hierarchical scheme based on the AmpliconArchitect amplicon reconstruction as well as the types of discordant breakpoint edges in the region. The four categories are defined as follows - 1) Linear amplicon: an amplicon that contains amplified segments with either no discordant edges or with edges suggesting deletions smaller than 1 Mb. 2) Heavily-rearranged amplicon: an amplicon which contains amplified segments connected by discordant breakpoint edges suggesting higher-order rearrangements beyond small deletions - such as inversions, interchromosomal edges or deletions > 1Mbp. 3) Breakage-fusion-bridge (BFB) amplicon: an amplicon having a proportion of foldback reads in excess of 25%, and which may have signatures of heavily rearranged or circular amplification. 4) Circular amplicon: an amplicon which contains one or more genomic segments forming a cyclic path of at least 10 kbp and 4+ copies. B. Left panel: Comparison of whole-genome sequencing derived circular DNA amplicon and Circle-seq derived segments. Right panel: Circular amplicons detected from whole-genome sequencing with AmpliconArchitect were validated with Circle-seq. N: not validated by Circle-Seq. C. Distribution of circular, BFB, Heavily-rearranged, Linear, and no focal somatic copy number amplification detected (No-fSCNA) amplicon categories by tumor and normal tissue, across 3,731 tumor and non-neoplastic sample derived whole-genomes from TCGA and 1,291 whole-genomes from PCAWG.
To evaluate the accuracy of the AmpliconArchitect predictions, we analyzed whole-genome sequencing data from a panel of 44 cancer cell lines1,2, and examined tumor cells in metaphase. We used 35 unique fluorescence in-situ hybridization (FISH) probes in combination with matched centromeric probes (81 distinct “cell-line, probe” combinations) to determine the intranuclear location of amplicons (Supplementary Table 2). Following automated analysis >1,600 images17, we observed that 85% of amplicons characterized as ‘Circular’ by whole genome sequencing profile demonstrated an extrachromosomal fluorescent signal, representing the positive predictive value. Of the amplicons corresponding to extrachromosomally located FISH probes, 83% were classified as Circular, representing the sensitivity (Extended Data Fig. 1A). Circular amplicons had a median count of 16.6 ecDNA per cell, compared to 0.1 ecDNA/cell for other amplicon classes combined (collectively referred to as ‘non-circular’). in subset of amplicons classified as Circular (6 of 34) contained co-occurring extrachromosomal and chromosomal signals, suggesting that ecDNA may co-exist with ecDNA that have reintegrated into the genome14,18.
To additionally validate our amplicon classification in patient tumors, we classified amplicons detected in the WGS data from 15 neuroblastomas and compared these to Circle-seq results, a sequencing library enrichment approach optimized for circular DNA detection14,19. We observed a very high concordance between WGS and Circle-seq approaches in distinguishing circular from linear DNA amplicons (Fig. 1B, Extended Data Fig. 1B–D). AmpliconArchitect classified four of 65 amplicons as Circular, and all four were validated by Circle-seq. No Circle-seq reads were detected in 60 of the 61 remaining non-circular amplicons. One of the amplicons detected by Circle-seq was classified as non-circular by AmpliconArchitect. Together with the cell line based validation, these results suggest that our classification of WGS derived amplifications is sensitive and has a high positive predictive value.
Having observed that we can specifically detect extrachromosomal amplifications, we applied AmpliconArchitect classification on the WGS datasets from 3,212 tumor and 1,810 non-neoplastic samples, comprising 3,212 patients (Supplementary Table 3). We found that 460 (14.3%) tumor samples carried one or more Circular amplicons, demonstrating that ecDNA-based amplification is a common event in cancer (Fig. 1C). In contrast, Circular amplifications were nearly undetectable in matched whole blood or normal tissue samples (Fig. 1C). Of note, our analysis does not reflect the presence of cell-free DNA in blood, or of small (<1 kb), circular, non-amplified DNAs, that have been shown to be common both in non-neoplastic and tumor tissues20–22. EcDNA-based Circular amplicons were found in 25 of 29 cancer types analyzed, including at high frequency in aggressive histological cancers such as glioblastoma, sarcoma and esophageal carcinoma. The distribution of Circular amplicon frequencies is consistent with earlier results on cancer models1,2, and showed that ecDNA amplifications are a defining feature of multiple cancer sub-types, but not normal cells2.
The chromosomal distribution of the 579 Circular amplicons was highly non-random (Fig. 2A), more so when compared to chromosomal regions from non-Circular classes. We found that 38% of the 24 most recurrent amplified oncogenes5 were most frequently present on Circular amplicons, with frequencies ranging from 11% of samples for PAX8 to 62% for CDK4 (Fig. 2B; Extended Data Fig. 2A). The result carried over to a larger list of 1804 oncogenes that were amplified in at least five samples, with 21.8% of those oncogenes having a plurality for being amplified on circular structures (Extended Data Fig. 2B). For highly amplified oncogenes (i.e., CN > 8), the proportion further increased to 53.5%. Oncogenes amplified on circular amplicons achieved higher copy numbers than the same oncogenes amplified on non-circular structures (Extended Data Fig. 2C). We further observed that the association between ecDNA structures and oncogene amplification did not extend to breakpoints. For 24 frequently amplified oncogenes, the frequency of observing a specific number of breakpoints in a unit interval decayed exponentially, consistent with mostly random occurrence around the oncogene (Fig. 2C; Extended Data Fig. 2D, Extended Data Fig. 2E). These results suggest that ecDNA are formed through a random process, where selection for higher copies of growth promoting oncogenes leads to rapid oncogene amplification during cancer development, retaining intratumoral genetic heterogeneity due to its uneven inheritance3,23.
Fig. 2 |. Oncogene content and structural component of circular amplification.
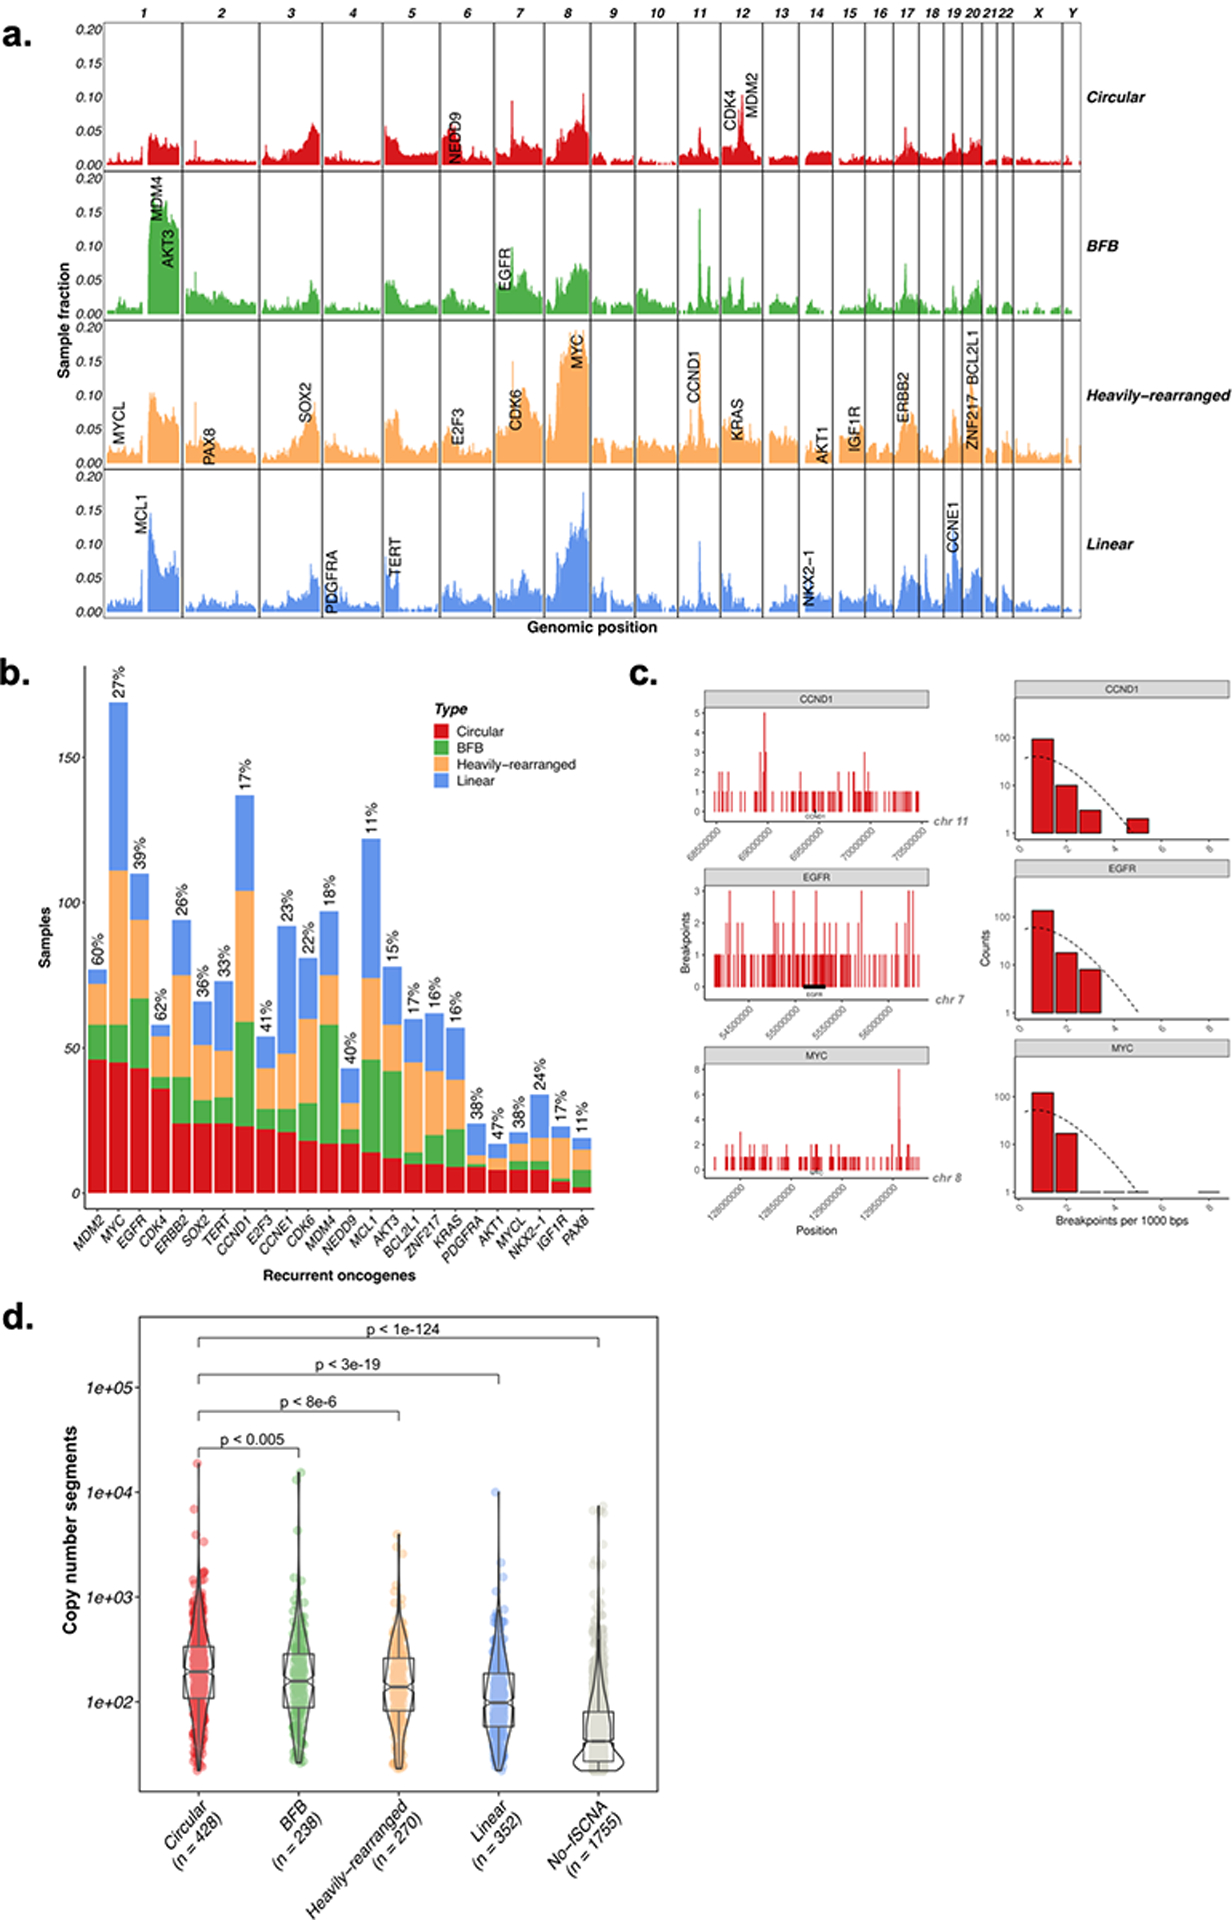
A. Genome-wide distribution of amplification peaks by amplicon class. Amplifications were counted per 1Mb bin and are shown as a fraction of the total number of samples per amplicon class. B. Classification of amplification status by gene. Shown are the 24 most frequently amplified oncogenes. C. Breakpoint locations (right) and distribution of breakpoints (left) across all circular samples with amplified CCND1 (top), EGFR (middle), and MYC (bottom). Breakpoints were identified in each sample containing the amplified oncogene region. Shown are the total number of breakpoints across this region in 1kb binned windows (right). The distribution of the number of breakpoints in each bin closely follows a Poisson distribution (left), suggesting that the breakpoints are mostly randomly distributed across the region. D. The number of genome-wide DNA segments within a sample was compared between Circular, BFB, Heavily-rearranged, Linear, and No-fSCNA detected classes. Circular samples contained statistically significantly more DNA segments than non-circular samples (p-value 0.0046, 7.2e-6, 2.4e-19 and 9.4e-125, respectively; Wilcox Rank Sum Test (two-sided)).
We compared amplicon classes for different types of genomic instability. Circular and non-circular amplifications showed similar likelihood of occurring in samples with chromosome-arm level aneuploidy (Extended Data Fig. 3A) and whole-genome duplication (Extended Data Fig. 3B), which might arise as a result of chromosome missegregation24 or other mitotic errors25. Smaller, focal genomic gains and losses result from different mutagenic processes than aneuploidy events. We observed an increase in the genome-wide number of DNA segments in samples marked by Circular amplicons, compared to other categories (Fig. 2D). The frequency of copy number losses was comparable between Circular and non-circular amplicon class samples (Extended Data Fig. 3C), but genomic segment gains were more frequently detected in samples with circular amplification compared to non-circular amplicon class samples (Wilcoxon rank sum test: p-value < 0.03 for BFB, p-value < 0.03 for Heavily-rearranged, p-value < 1e-20 for Linear, and p-value < 1e-111 for No-fSCNA) (Extended Data Fig. 3D). Most Circular amplicon breakpoints showed no or minimal sequence homology (<5 bp), implicating non-homologous end joining in ecDNA-associated breakpoint repair. In contrast, non-circular amplicon breakpoints showed significantly more micro-homologies (Extended Data Fig. 3E, p-value<1e-15; two-sided Fisher’s exact test). Non-homologous end joining has been associated with localized breakpoint clustering, or chromothripsis26. Somatic structural aberrations such as chromothripsis do not cause amplification but may create circular structures that can be subsequently amplified. We detected signatures of chromothripsis in 36% of Circular amplicons (Extended Data Fig. 3F), and half of Circular amplicon cases (Extended Data Fig. 3G). The prevalence of chromothripsis was higher among the Circular class than other classes (Chi-square p-value: 2.2e-16). This result confirms with recent observations that chromothripsis can result in BFB and ecDNA formation27–29, and nominates chromothripsis as an initiating event for some ecDNAs. In contrast, genome-wide tandem duplications30 were not associated with ecDNA (Chi-square p-value: 0.1; Extended Data Fig. 3H).
We sought to examine the transcriptional consequences of circular ecDNA amplification. As expected, we observed a highly significant correlation between DNA copy number and oncogene expression level in all amplicon categories. However, when normalized for DNA copy number, oncogenes on Circular amplicons showed significantly higher expression than non-circular amplicon oncogenes (1.2x higher compared to non-circular amplifications, p-value < 0.0007; Tukey’s range test; Fig. 3A; Extended Data Fig. 4). The copy-number independent increase in transcriptional activity may be in part the result of enhancer hijacking events and enhanced chromatin accessibility on ecDNA elements31,32. To compare the epigenetic mechanisms governing gene expression between Circular amplifications and non-circular regions, we analyzed the overlapping Assay for Transposase-Accessible Chromatin using sequencing (ATAC-seq) profiles available for 36 samples33. Following DNA copy number level correction, chromatin of Circular and BFB amplicons was significantly more accessible compared to Heavily-rearranged and Linear amplicons (1.2x higher median ATAC-seq signal fold-change; Wilcoxon rank sum test; p-value < 1e-16)(Fig. 3B), consistent with recent findings that increased accessibility plays a role in dysregulation of ecDNA oncogenes31,32,34. Finally, the frequency of amplicon-derived transcript fusions was increased by fivefold in Circular compared to non-circular amplifications (Fig. 3C; Binomial test: p-value <1e-14). We observed a convergence of DNA copy number, RNA expression and chromatin accessibility around Circular amplicon structures (Fig. 3D).
Fig. 3 |. Gene expression and chromatin accessibility of amplicon classes.
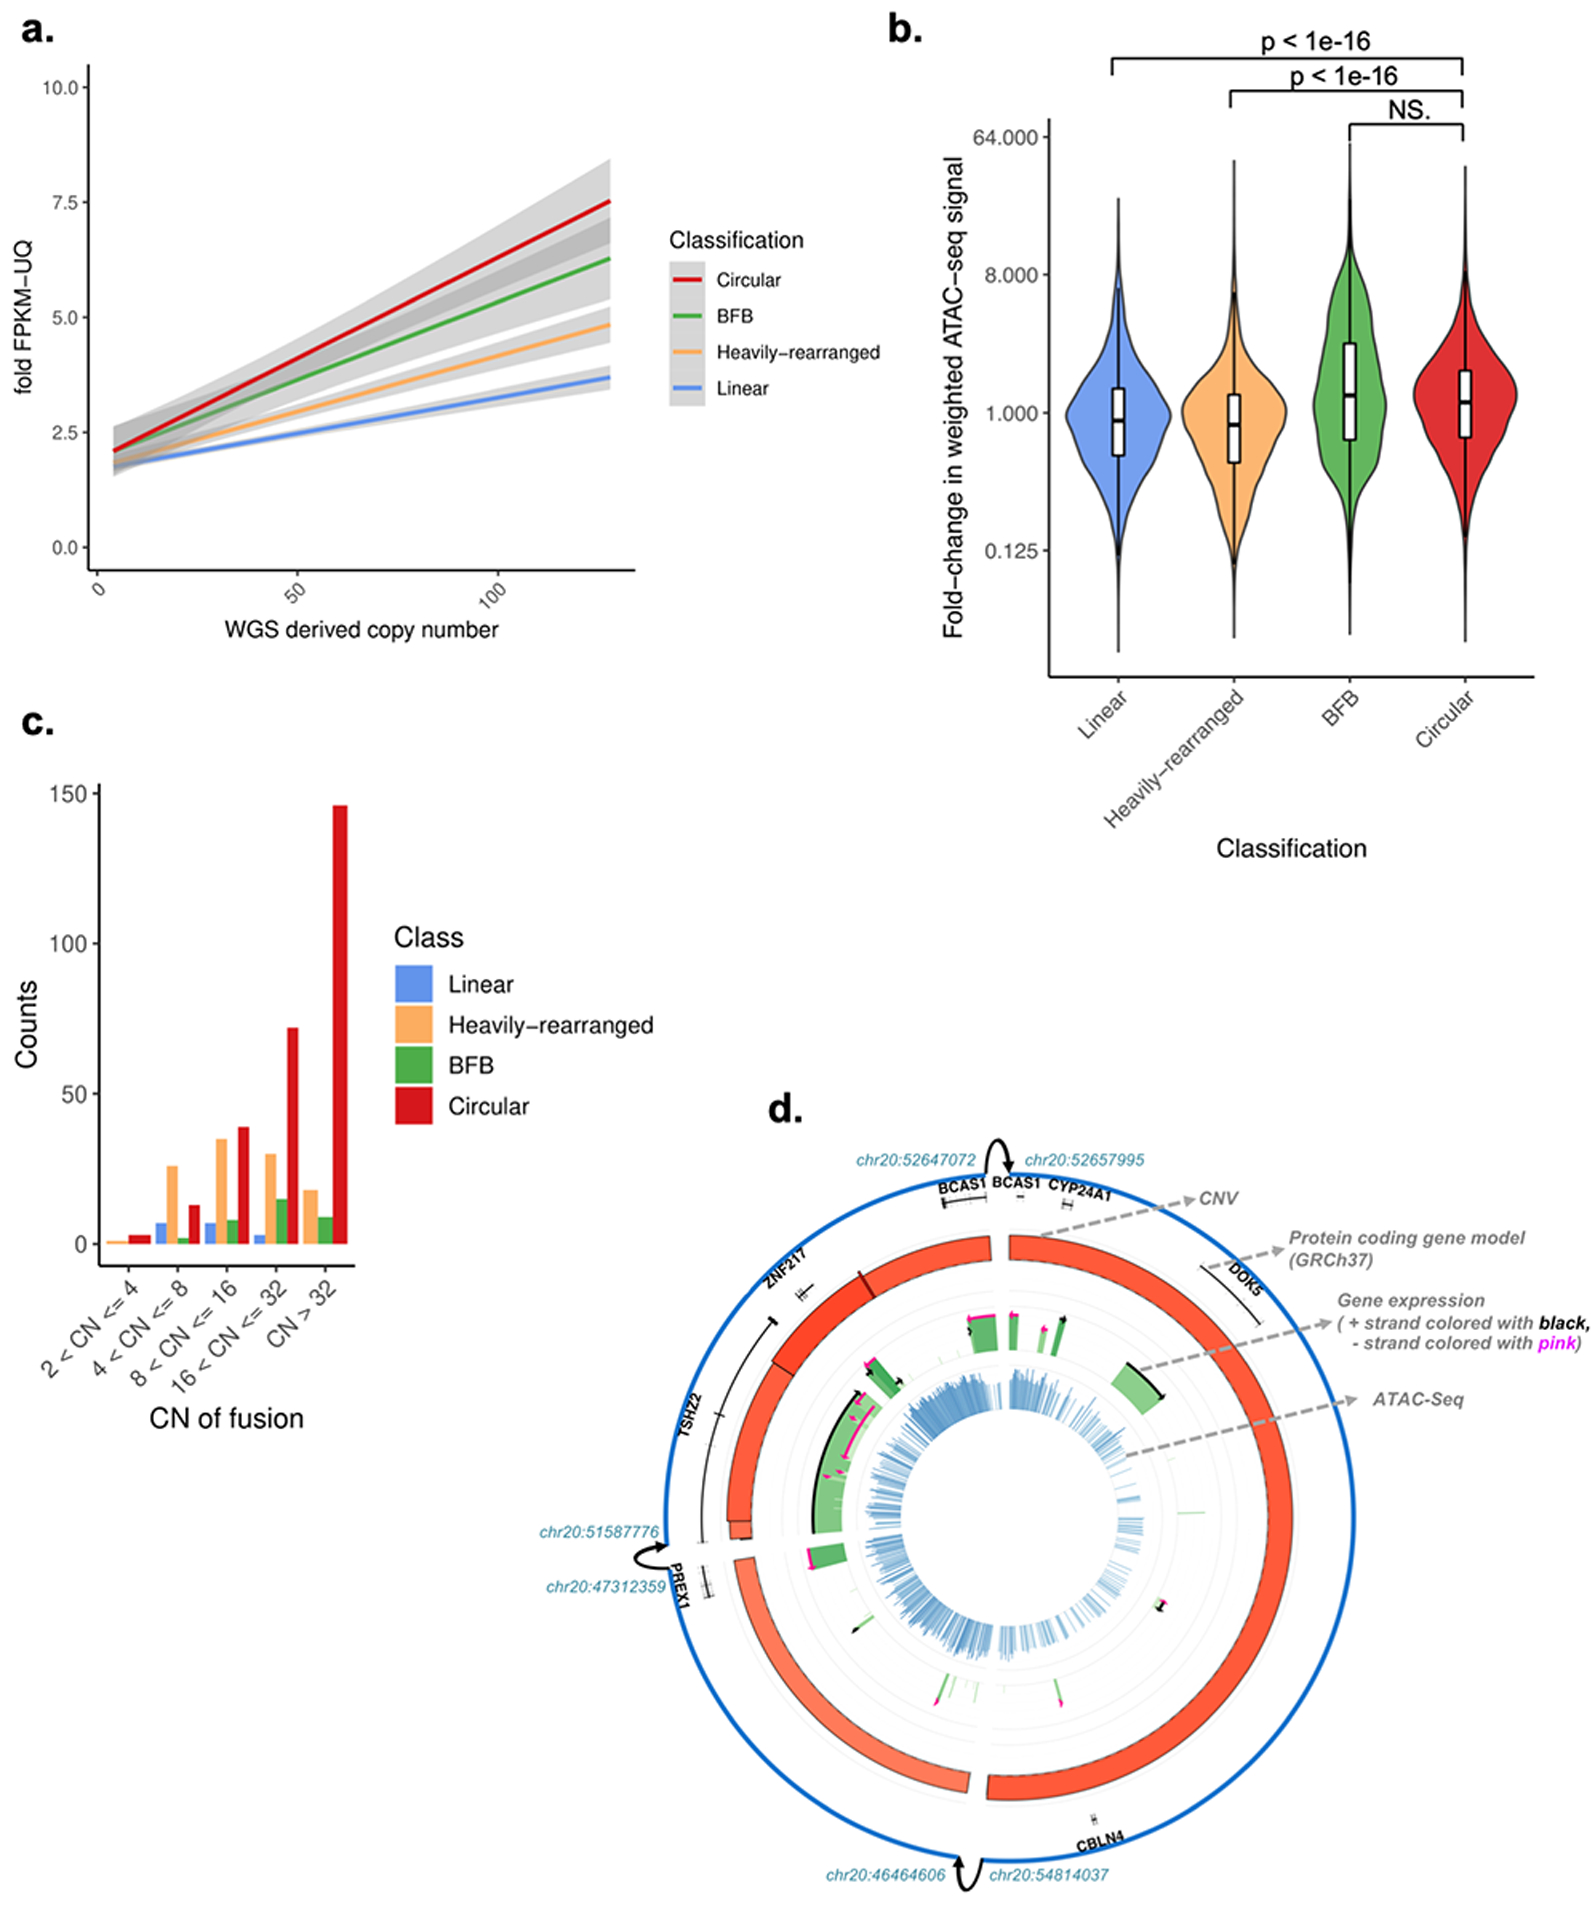
A. Copy number of oncogene versus its fold-change in Fragments Per Kilobase of transcript per Million mapped reads upper quartile (FPKM-UQ) for all oncogenes with a copy count greater than 4, for each oncogene on each amplicon. The fold-change in FPKM-UQ is computed as the oncogene’s (FPKM-UQ+1) divided by the average of (FPKM-UQ+1) for the same oncogene in all other tumor samples from the same cohort for which the oncogene is not on any amplicon (i.e., not amplified). Linear regression lines, using fold change = m*copy number+b, and their 95% confidence level intervals (in grey) are shown for each class. Tukey’s range test shows oncogenes on circular structures are significantly different to oncogenes on non-circular structures (p-value < 1e-7). WGS: whole-genome sequencing. B. For each of the 36 The Cancer Genome Atlas (TCGA) samples with Assay for Transposase-Accessible Chromatin using sequencing (ATAC-seq) profiles and AmpliconArchitect results, the copy-number normalized fold-change in ATAC-seq signal in each ATAC-seq peak that overlaps with the amplicon relative to tissue types without amplification within the same peak is shown. The distribution of fold-change for Circular amplicons is statistically significantly higher than Linear and Heavily-rearranged amplicons (Wilcoxon rank sum test (two-sided); p-value < 1e-16). Y-axis is on log(2) scale. Box plots are defined as 25th, 50th and 75th percentiles, respectively. Y-axis is on log(2) scale. NS: not significant. C. Circular structures expressed significantly more gene fusions compared to non-circular amplicons, after size normalization. CN: copy number. D. Representative Circos-plot showing (rings from outside to inside) 1) Amplicon regions identified by AmpliconArchitect, where interconnected breakpoints were indicated with arrows; 2) DNA copy-number, where height and color represent level (darker red means higher copy number amplification); 3) FPKM expression values in green, where height and color represent expression level (darker green means higher expression); 4) ATAC-seq chromatin accessibility in blue, where height and color represent expression level (darker blue means more accessible). CNV: Copy Number Variation.
To determine whether cancers that have ecDNA amplification were associated with aggressive biological features, we examined the impact of circular amplification on lymph node status. Gene amplification, whether by ecDNA-based, BFB formation, or Heavily-rearranged, was associated with significantly more lymph node spread at initial diagnosis (Chi-squared test p-value < 1e-5) (Extended Data Fig. 5). To further examine the association of ecDNA with biological features of aggressiveness, we used gene expression signatures of increased tumor cell proliferation and reduced immune cell infiltration35. The cellular proliferation scores of the Circular class and BFB class samples were significantly higher (p-value < 1e-15; Wilcoxon Rank Sum Test; Extended Data Fig. 6A) compared to the Heavily-rearranged, Linear and No-fSCNA categories. Accordingly, the Linear and No-fSCNA groups showed higher immune infiltration scores compared to Circular, BFB and Heavily-rearranged samples. (Extended Data Fig. 6B, p-value < 1e-4; Wilcoxon Rank Sum Test). Combined, these scores suggested that tumors carrying a Circular amplicon behave aggressively.
Most importantly, patients whose tumors contained ecDNA amplification had significantly worse five year survival outcomes compared to patients whose tumors harbored either non-circular or no amplifications (Fig. 4A; p-value < 0.03 versus BFB; p-value < 0.05 against Heavily-rearranged, p-value < 0.02 versus Linear; p-value < 1e-15 versus No-fSCNA; Log-rank test), demonstrating that the presence of ecDNA associates with tumor aggressiveness. Circular amplicons are much more prevalent in aggressive cancers such as glioblastoma. To account for survival assocations associated with disease subtype, we fitted a Cox-Hazard model that tested survival after controlling for disease subtype. The model showed that patients with tumors carrying Circular amplicons had significantly higher hazard ratios (Fig. 4B; 48% increase in hazard rate relative to no-fSCNA, p-value < 0.001) and therefore, the class of Circular amplicon cases shows a significantly decreased five year survival rate. These findings implicate that extrachromosomal DNA amplifications associate with aggressive cancer behavior, potentially through providing tumors with additional routes to circumvent treatments and other evolutionary bottlenecks.
Fig. 4 |. Presence of circular amplification associates with poor outcomes.
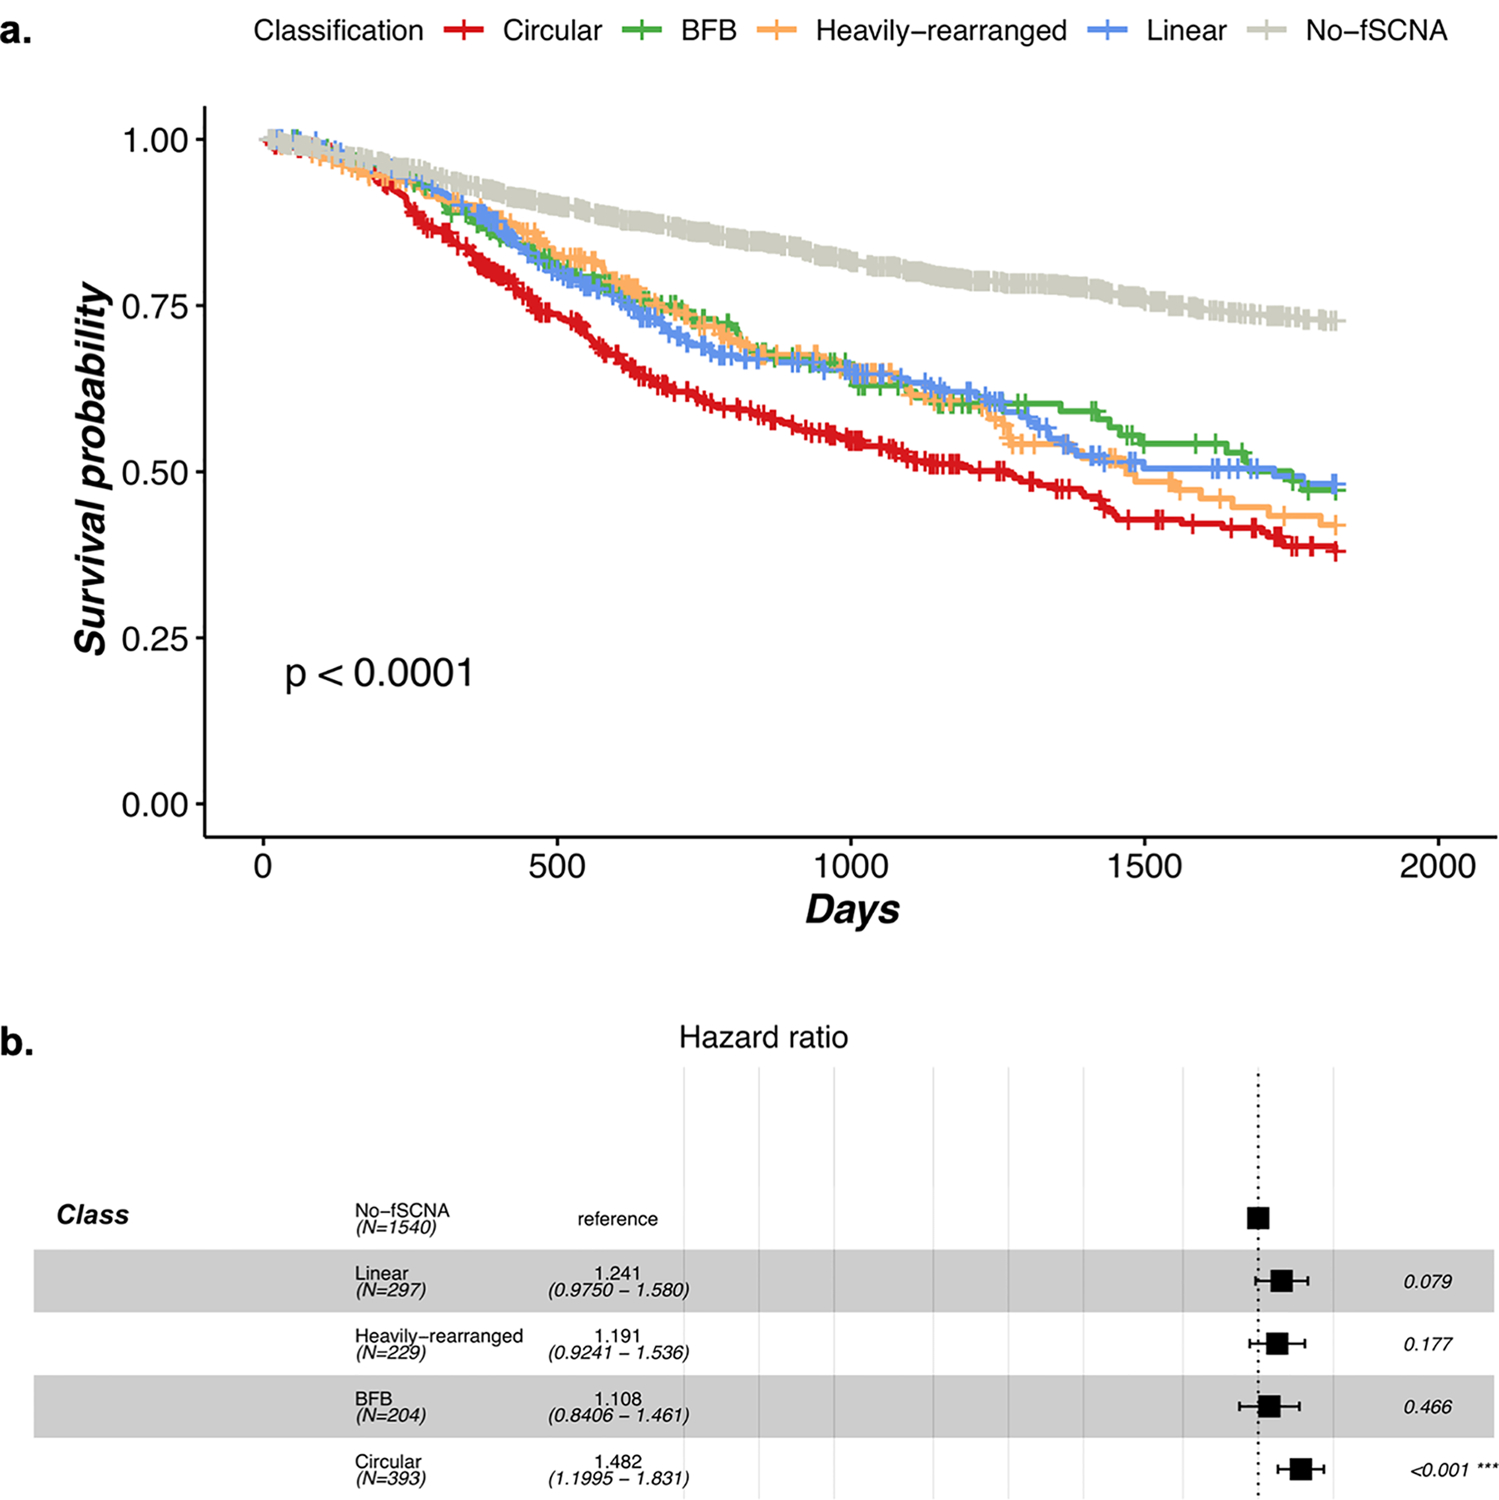
A. Kaplan-Meier five-year survival curves by amplification category. Patients whose tumors contain at least one Circular amplicon have significantly worse outcome compared to patients whose tumors were classified as non-circular. The p-value comparing survival curves was based on a log-rank test. B. Multivariate Cox-Hazard model, incorporating disease and patient cohorts as parameters showing circular amplification results in significantly higher hazard ratios. The error bars represent 95% confidence intervals of the hazard ratio.
A map of the cancer genome which respects only the direct changes to its “genetic code”, and not also genome topology and 3D organization, will be necessarily incomplete. The three-dimensional genome topology plays a critical role in determining how that genome functions, or malfunctions, as occurs in cancer. Detection and classification of circular extrachromosomal DNA creates a more accurate map of the cancer genome. The data presented here demonstrate that circular ecDNA play a critical role in cancer, providing a mechanism for achieving and maintaining high copy oncogene amplification and diversity while driving enhanced chromatin accessibility and elevating oncogene transcription. This mechanism of amplification is operant in a large fraction of human cancers, negatively affects patient outcomes, independent of cancer lineage. Our results represent the landscape of ecDNA across cancer. Given cancer’s heterogeneity, it is certain that diversity in ecDNA structure and behavior exists between different cancer types. Future studies, such as deep dives into patterns of complex structural variation across cancer36,37, will aid improved understanding of the mechanisms that create genomic rearrangements including extrachromosomal DNA. The potential to leverage the presence of ecDNAs in human cancers for diagnostics or therapeutics provides a link between cancer genomics and broad utility for patient populations.
METHODS
AmpliconArchitect
We used AmpliconArchitect12 to infer the architecture of amplicons, which are genomic segments greater than 10kb with copy numbers of more than four copies, often containing rearrangements that have co-amplified as a single structure. AmpliconArchitect takes as an input aligned WGS sequences and seed intervals for a candidate amplicon region. AmpliconArchitect then searches for other regions that belong to the amplicon by exploring the seed intervals, and extends beyond the intervals if it encounters copy number changes or discordant edges that support a breakpoint. The collection of intervals and breakpoints are combined to form a breakpoint graph with nodes representing segments and edges representing rearrangements. This breakpoint graph is can be further decomposed into simple and complex cycles to identify any circular paths within the amplicon structure, which is indicative of an ecDNA origin. AmpliconArchitect masks out regions that are highly repetitive, including the alpha-satellites seen in centromeric and peri-centromeric regions. Therefore, they are not part of the amplicon structure. While AmpliconArchitect does see amplicons that may reside on chromosomes, predicted circular structures will not include centromeres. The detected amplicons were annoted with the Ensembl Release 75 gene database (GRCh37).
Breakage-fusion-bridge
BFB status was determined by evaluating AmpliconArchitect output. We examined the AmpliconArchitect graph files to identify amplicons with a proportion of foldback breakpoint edges exceeding 0.25, and having at least 25 sequencing reads supporting all edges in the graph. Foldback breakpoint edges were defined as AmpliconArchitect breakpoint edges whose constituent sequencing reads had forward and reverse mates in the read pair with the same orientation (+/+ or −/− as opposed to the expected +/− or −/+), and for which the edge spanned less than 25 kbp in the reference genome. Amplicons meeting these criteria were classified as BFB. We note that our approach is likely only identifying linear BFB amplicons, not Circular BFB structures.
Amplicon and sample classification
As a perquisite, amplicons must contain ≥ 10kb of genomic segments amplified to at least four copies above median ploidy in order to be considered a valid amplicon. We then use the AmpliconArchitect derived breakpoint graph to classify amplicons into four categories: 1. Circular amplification; 2. Breakage-fusion bridge (BFB) amplification; 3. Heavily rearranged amplification; and, 4. Linear amplification (Fig. 1A). Amplicons were denoted as Circular amplification if the segments form a cycle in the graph of total size at least 10kb and has at least a copy count of four. Amplicons were denoted as BFB if they met the criteria for a BFB amplicon. As cyclic structures can arise in a linear BFB’s breakpoint graph due to repetitive self-inversion, BFB amplicons which also contained circular amplicon signatures were classified as BFB. Non-circular amplicons were denoted as Heavily-rearranged if they contain amplified segments connected by discordant breakpoint edges suggesting higher-order rearrangements beyond small deletions - such as inversions, interchromosomal edges or deletions > 1Mbp. (Fig. 1A). Non-circular amplicons were denoted as Linear if they contain amplified segments with either no discordant edges or with edges suggesting deletions smaller than 1 Mb. While an amplicon may fit the requirements for several categories (i.e., a circular amplicon may also comprise heavily rearranged amplifications), priority was given to the BFB amplification category, followed by Circular, Heavily-rearranged and then Linear. Samples were classified based upon what amplicons are present within the sample, giving precedence to the presence of amplicons with highest priority, with the exception that a non-BFB circular amplicon took precedence over BFB in the sample categorization. For example, a sample with both Circular and Heavily-rearranged amplification would be classified as Circular. Samples without any amplicons are classified as Ǹo focal somatic copy number amplification detected (No-fSCNA)’.
Cell line validation
We ran AmpliconArchitect on the whole-genome sequencing data from 44 cell line models and Fluorescence in-situ hybridization (FISH) in parallel, including those previously described1,2. For AmpliconArchitect, the seed interval for each cell line included the probe region. For each FISH probe, we reported whether it landed in an amplicon (inferred from AmpliconArchitect), and if so what was the amplicon classification. The distribution of the average ecDNA per cell was computed as the average number FISH probes that co-localized on ecDNA across all the images for that particular cell line+FISH probe combination (Extended Data Fig. 1A). Wilcoxon Rank Sum test was used to detect significant differences in average ecDNA counts per cell across the amplicon classes.
We used ecSeg17 to validate the ecDNA counts and oncogene amplification on ecDNA from the cell line image data. ecSeg takes as input DAPI+FISH stained metaphase images and uses the DAPI signal to classify the DNA signatures as nuclear, chromosomal, or extrachromosomal. It then localizes red and green FISH signals present in the image to identify whether they are present on chromosomal or ecDNA segments. An oncogene is considered to be located on an ecDNA only if the FISH signal for that oncogene is co-localized with an ecSeg-classified ecDNA segment. For each image, ecSeg reports the number of times an oncogene is found on an ecDNA. We report the average of these counts for each combination of cell line and FISH probe. A cell line is considered to be ecDNA positive by FISH if it contains an average of at least 0.5 ecDNA+FISH co-localized signal per cell. All images analyzed can be obtained from https://figshare.com/s/6c3e2edc1ab299bb2fa0 and https://figshare.com/s/ab6a214738aa43833391.
TCGA processing
We processed TCGA whole genome sequencing BAMs through the Institute for Systems Biology Cancer Genomics Cloud (https://isb-cgc.appspot.com/) that provides a cloud-based platform for TCGA data analysis. The processed data (hg19) and clinical data were found at the GDC (https://portal.gdc.cancer.gov/legacy-archive/search/f) and the PancanAtlas publication page (https://gdc.cancer.gov/about-data/publications/pancanatlas). We used genome-wide snp6 copy number segments with copy number log ratio equal to 1 as seed interval(s) of interest that are required for the input to AmpliconArchitect12. Default parameters and reference files were used for all other settings. Details on how to run AmpliconArchitect have been described in the corresponding manuscript12 and its source code depository. We ran AmpliconArchitect on tumor and normal WGS samples from 1921 patients (3,731 BAM files). Samples were classified based upon the amplicon with highest precedence present in the sample, or classified as Ǹo focal somatic copy number amplification detected’ if no amplicons are present in the sample.
PCAWG processing
PCAWG whole genome sequencing BAMs are available on Amazon Web Services (AWS). DNA copy number profile structural variant and FPKM data were obtained from https://dcc.icgc.org/releases/PCAWG. AmpliconArchitect used copy numbers equal to or higher than 4 as seed interval(s) of interest. We ran AmpliconArchitect on tumor WGS samples from 1291 patients, and their results were processed in the same way as the results from TCGA.
Oncogene analysis
We examined the enrichment of the 24 recurrent oncogenes known to be activated by amplification by counting the total number of times the amplicon classes overlap the 24 recurrent oncogenes. We then simulated 10,000 replicates by sampling random regions of the same size of the 24 recurrent oncogenes and computed an empirical expected distribution of times the these random regions overlap with the amplicon classes. We report the z-score between the empirical distribution and observed value for the amplicon classes. We also report the average copy count, estimated from AmpliconArchitect. For each of these oncogenes on an amplicon structure, we reported the position of breakpoint detected within a 1 MB region flanking the oncogene using the breakpoint graph to infer breakpoints. We partitioned the region into 1000 bp windows and counted the total number of breakpoints that landed in each window, and display a histogram of these counts. We modeled the histograms using an exponential distribution and show that under the assumption that the breakpoints are distributed randomly, the histograms closely follow the exponential distribution. We used allOnco (http://www.bushmanlab.org/links/genelists), a set of 2,579 cancer genes generated from curated collections cancer genes from many different publications. We identified all amplicons that overlapped with the oncogenes and report the proportion amplified oncogenes that are circular.
Breakpoint detection
For each of these oncogenes on an amplicon structure, we reported the position of breakpoint detected within a 1 MB region flanking the oncogene using the breakpoint graph to infer breakpoints. We partitioned the region into 1000 bp windows and counted the total number of breakpoints that landed in each window, and display a histogram of these counts. In order to filter out false positive breakpoints, any breakpoint that had at least 100 reads taken from unamplified samples that displayed the same breakpoint (within 100 bp window) was considered a mapping artifact and discarded. We modeled the histogram of the distribution of breakpoints per bin using an exponential distribution and show that under the assumption that the breakpoints are distributed randomly, the histograms closely follow the exponential distribution.
Genomic instability analyses
We computed total copy number gains/losses as the number of WGS-inferred copy number segments with copy number >2 or <2. Wilcoxon Rank Sum test was used to test for a significant difference between the two distributions. We used data from Taylor et al38 on genome doubling status and chromosomal arm duplication and loss for each sample. Wilcoxon Rank Sum test was used to test significance between the distribution of gains and losses and Chi-squared test was used to test significance between the distribution of whole genome doublings. Transcript fusions were downloaded from the TCGA fusion database (https://tumorfusions.org/)39,40, derived using PRADA41, to identify fusions events that occur on an amplicon. For each fusion in the database, we consider it valid if both ends of the fusion breakpoint junction occur on the same amplicon. In total, 710 amplified fusions were detected. We computed the average fusion events per 10 Mb as the total number of fusions that landed within an amplicon class divided by the sum of all the base pairs of the amplicon class multiplied by 1e7. To test whether Circular amplicons were enriched fusion events, we computed the p-value of observing at least the number of fusion events on Circular amplicon under a binomial distribution where the probability p was estimated using the total number of fusion events on the amplified-noncircular divided by the total base pairs of the amplified non-circular event and the number of trials n as the total base pairs of the Circular amplicons.
RNAseq and ATACseq analyses
Of the 3,212 tumor samples, 2,148 had RNA-seq data in the format of Fragments Per Kilobase of transcript per Million mapped reads upper quartile (FPKM-UQ) expression data. For each gene within each disease cohort, we computed a baseline FPKM-UQ as the average FPKM-UQ of all samples for which the gene was not found on an amplicon (i.e., average expression of the unamplified gene). Lowly expressing genes (i.e., average baseline FPKM-UQ < 5) were removed from the analysis. We then computed the fold-change in expression of each gene on each amplicon as the (FPKM-UQ+1) of the amplified gene divided by the average (FPKM-UQ+1) of the unamplified samples, removing any fold-changes that were five standard deviations from the mean fold-change and report the distribution of fold-changes versus the copy number. Tukey’s range test was used to test significance between slope of the FPKMs for circular and amplified-noncircular. Transcript fusions for TCGA samples were derived from the TumorFusions portal39,40. Fusion analysis was performed by taking the total number of fusions landing in an amplicon class divided by the total bps of all amplicons belonging to that amplicon class within the TCGA dataset to obtain an expected number of fusion events per bp for each amplicon class. To test for enrichment in Circular amplicons compared to non-circular amplicons, a binomial test was performed by computing probability of observing the total number of fusion events on Circular amplicons, using the expected number of fusion events per bp of the non-circular amplicon class. ATAC-seq profiles were available for 24 samples33. The TCGA ATAC-seq data is provided as a count matrix, where each row is an peak (represented as hg38 coordinates) and each column is a TCGA sample. We remap the peaks onto hg19 coordinates using Liftover. We then intersect each ATAC-seq peak with amplicons of the 36 samples. For each ATAC-seq peak that intersects with an amplicon, the copy-number normalized fold-change in ATAC-seq signal was computed as follows. For each sample, the normalized ATAC-seq signal was computed as the ATAC-seq signal of the sample for that peak divided by the estimate copy number of that genomic region using the TCGA SNP6 copy number profile data. We then compute the copy-number normalized fold-change as the normalized ATAC-seq signal of the sample with the intersecting amplicon divided by the mean normalized ATAC-seq signal of all samples without an amplicon intersecting with that peak. Wilcoxon Rank Sum test was used to test significance between the two distributions.
Inferring breakpoint homologies
For each breakpoint, sequencing reads around +/− 1000 bps of the breakpoint were locally reassembled with SvABA42 to produce a contiguous consensus sequence of each breakpoint, precise breakpoint positions, and the level of homology at breakpoints.
Chromothripsis analysis
Chromothripsis events were called with ShatterSeek software26 using somatic copy-number and structural variation (SV) calls as input data. SV clusters per patient were then defined as having chromothripsis or not using the published set of statistical criteria, including correction for false-discovery rate where applicable. We omitted the fragment joint test to relax test stringency and therefore, detect higher chromothripsis-like events to test positive association, if any between chromothripsis and ecDNA regions. We defined patient having chromothripsis if >=1 SV cluster had chromothripsis event. Chi-square test was used to evaluate positive enrichment of ecDNA and chromothripsis events at both, locus-level and patient level. For locus-level enrichment, breakpoint regions for SV clusters and ecDNA region were overlapped using bedtools intersect command43.
Tandem Duplicator Phenotype (TDP)
Tandem duplication calls from TCGA and PCAWG were used to call TDP status using published method30. Resulting sample-level TDP calls were then tallied with AmpliconArchitect-called ecDNA calls.
Statistical analysis
All data analyses were conducted in R 3.3.2, and Python 2.7.11 or 3.5.4. Survival curves were estimated with the Kaplan–Meier method, and comparison of survival curves between groups was performed with the log-rank test in R survival package. Hazard ratios were estimated with the Cox proportional hazards regression model in the survival R package. For further details, see the Nature Research Reporting Summary.
Data availability
Information on accessing the data from the International Cancer Genomics Consortium, including raw read files, can be found at https://docs.icgc.org/pcawg/data/. All open-access TCGA data are publicly available through NCI Genomic Data Commons (https://gdc.cancer.gov/). Datasets marked ‘Controlled’ contain potentially identifiable information and require authorization from the ICGC and TCGA Data Access Committees. In accordance with the data-access policies of the ICGC and TCGA projects, most molecular, clinical and specimen data are in an open tier that does not require access approval. To access sequencing data, researchers need to apply to the TCGA Data Access Committee (DAC) via dbGaP (https://dbgap.ncbi.nlm.nih.gov/aa/wga.cgi?page=login) for access to the TCGA portion of the dataset, and to the ICGC Data Access Compliance Office (DACO; http://icgc.org/daco) for the ICGC portion. All images analyzed can be obtained from https://figshare.com/s/6c3e2edc1ab299bb2fa0 and https://figshare.com/s/ab6a214738aa43833391.
Code availability
AmpliconArchitect is available at https://github.com/virajbdeshpande/AmpliconArchitect. EcSeg is available at https://github.com/UCRajkumar/ecSeg.
Extended Data
Extended Data Fig. 1. Amplicon classification.
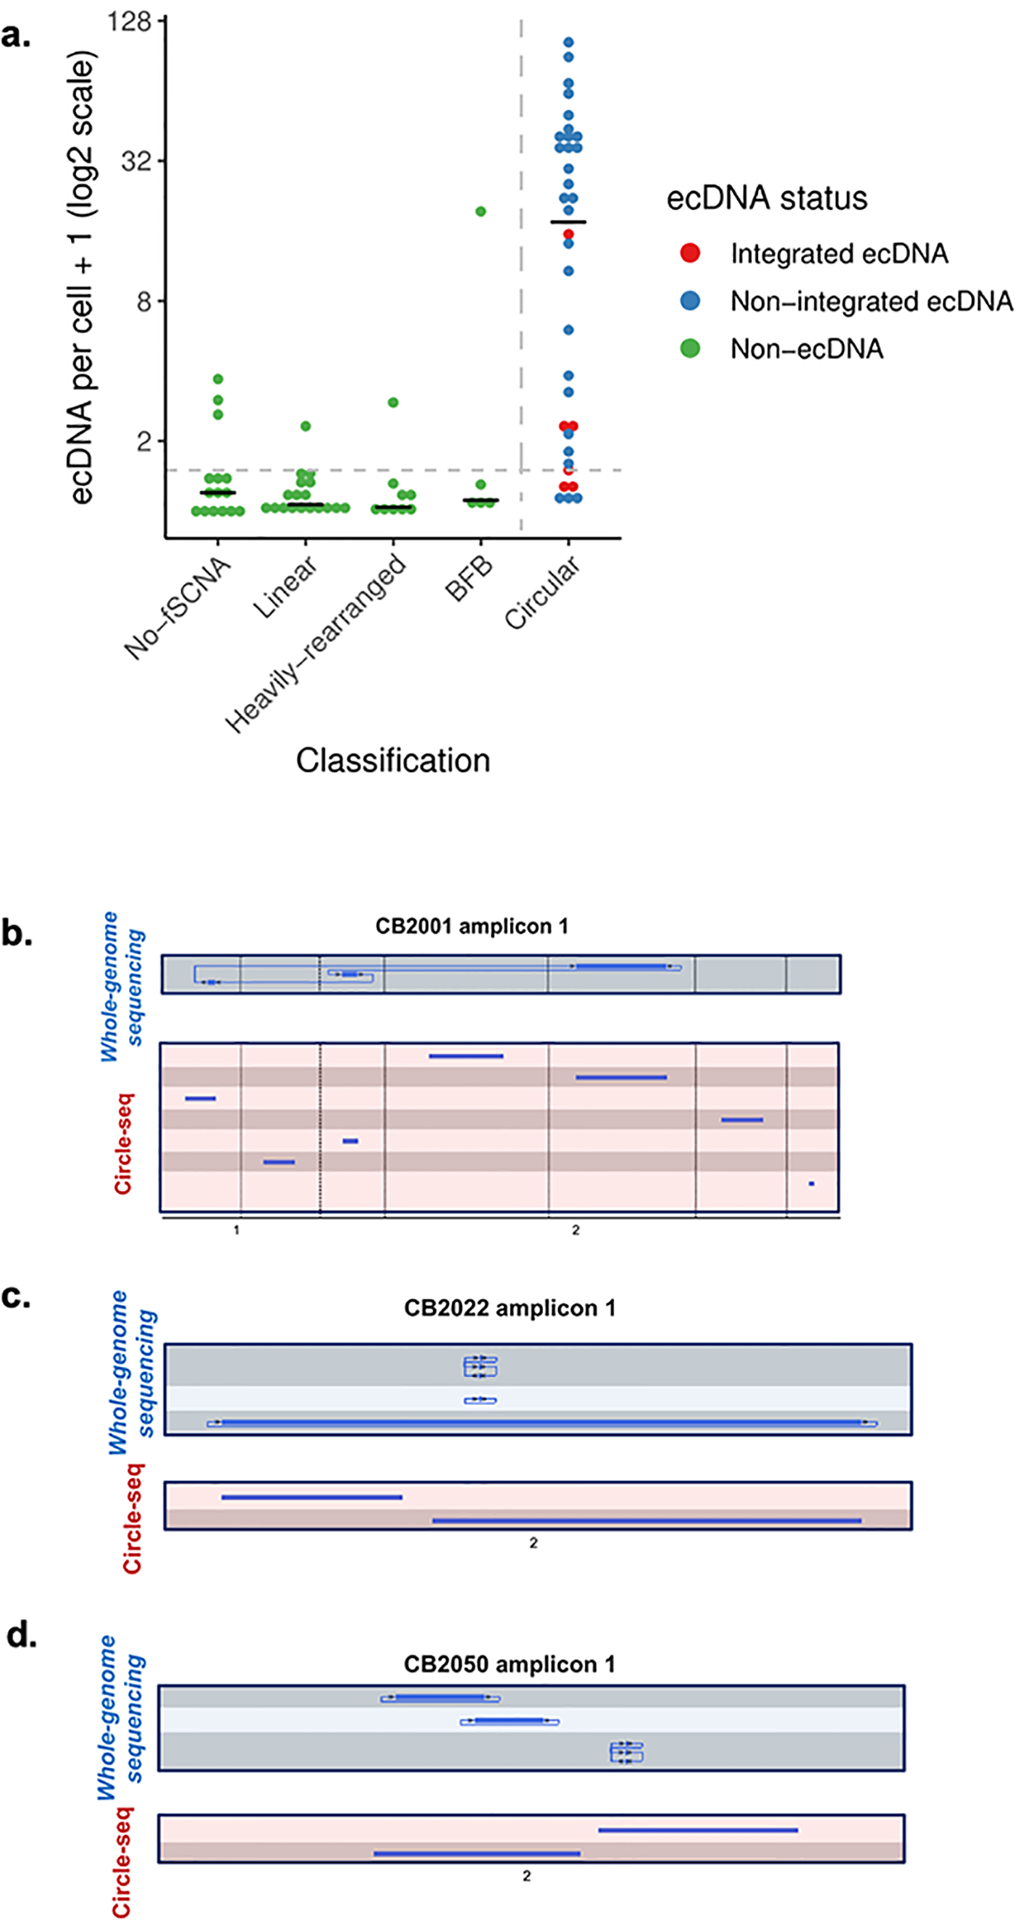
A. Validation on cell line data. Validation of the classification scheme on cell line data with FISH experiments for detecting ecDNA from the Turner et al. and deCarvalho et al. studies, in addition to newly generated data. FISH probes were designed for selected oncogenes and DAPI staining was performed to determine whether the FISH probe landed on chromosomal DNA or ecDNA. For each cell (represented as an image of the cell in metaphase), the number of positive ecDNA probes were counted, and for each cell line, the average positive ecDNA per cell was reported. For each probe, we report whether it landed in an amplicon (inferred from AmpliconArchitect), and if so, what was the amplicon’s classification. The distribution for the average ecDNA per cell between the Circular and non-circular classes was statistically significantly different (p-value < 1e-9; Wilcoxon rank sum test). B, C and D. Whole-genome sequencing derived based Circular amplicon regions (blue) were validated with Circle-seq (red) for three neuroblastoma samples (CB2001, CB2022, and CB2050, respectively) used in the Koche et al. study.
Extended Data Fig. 2. Circular vs amplified non-circular amplification comparisons.
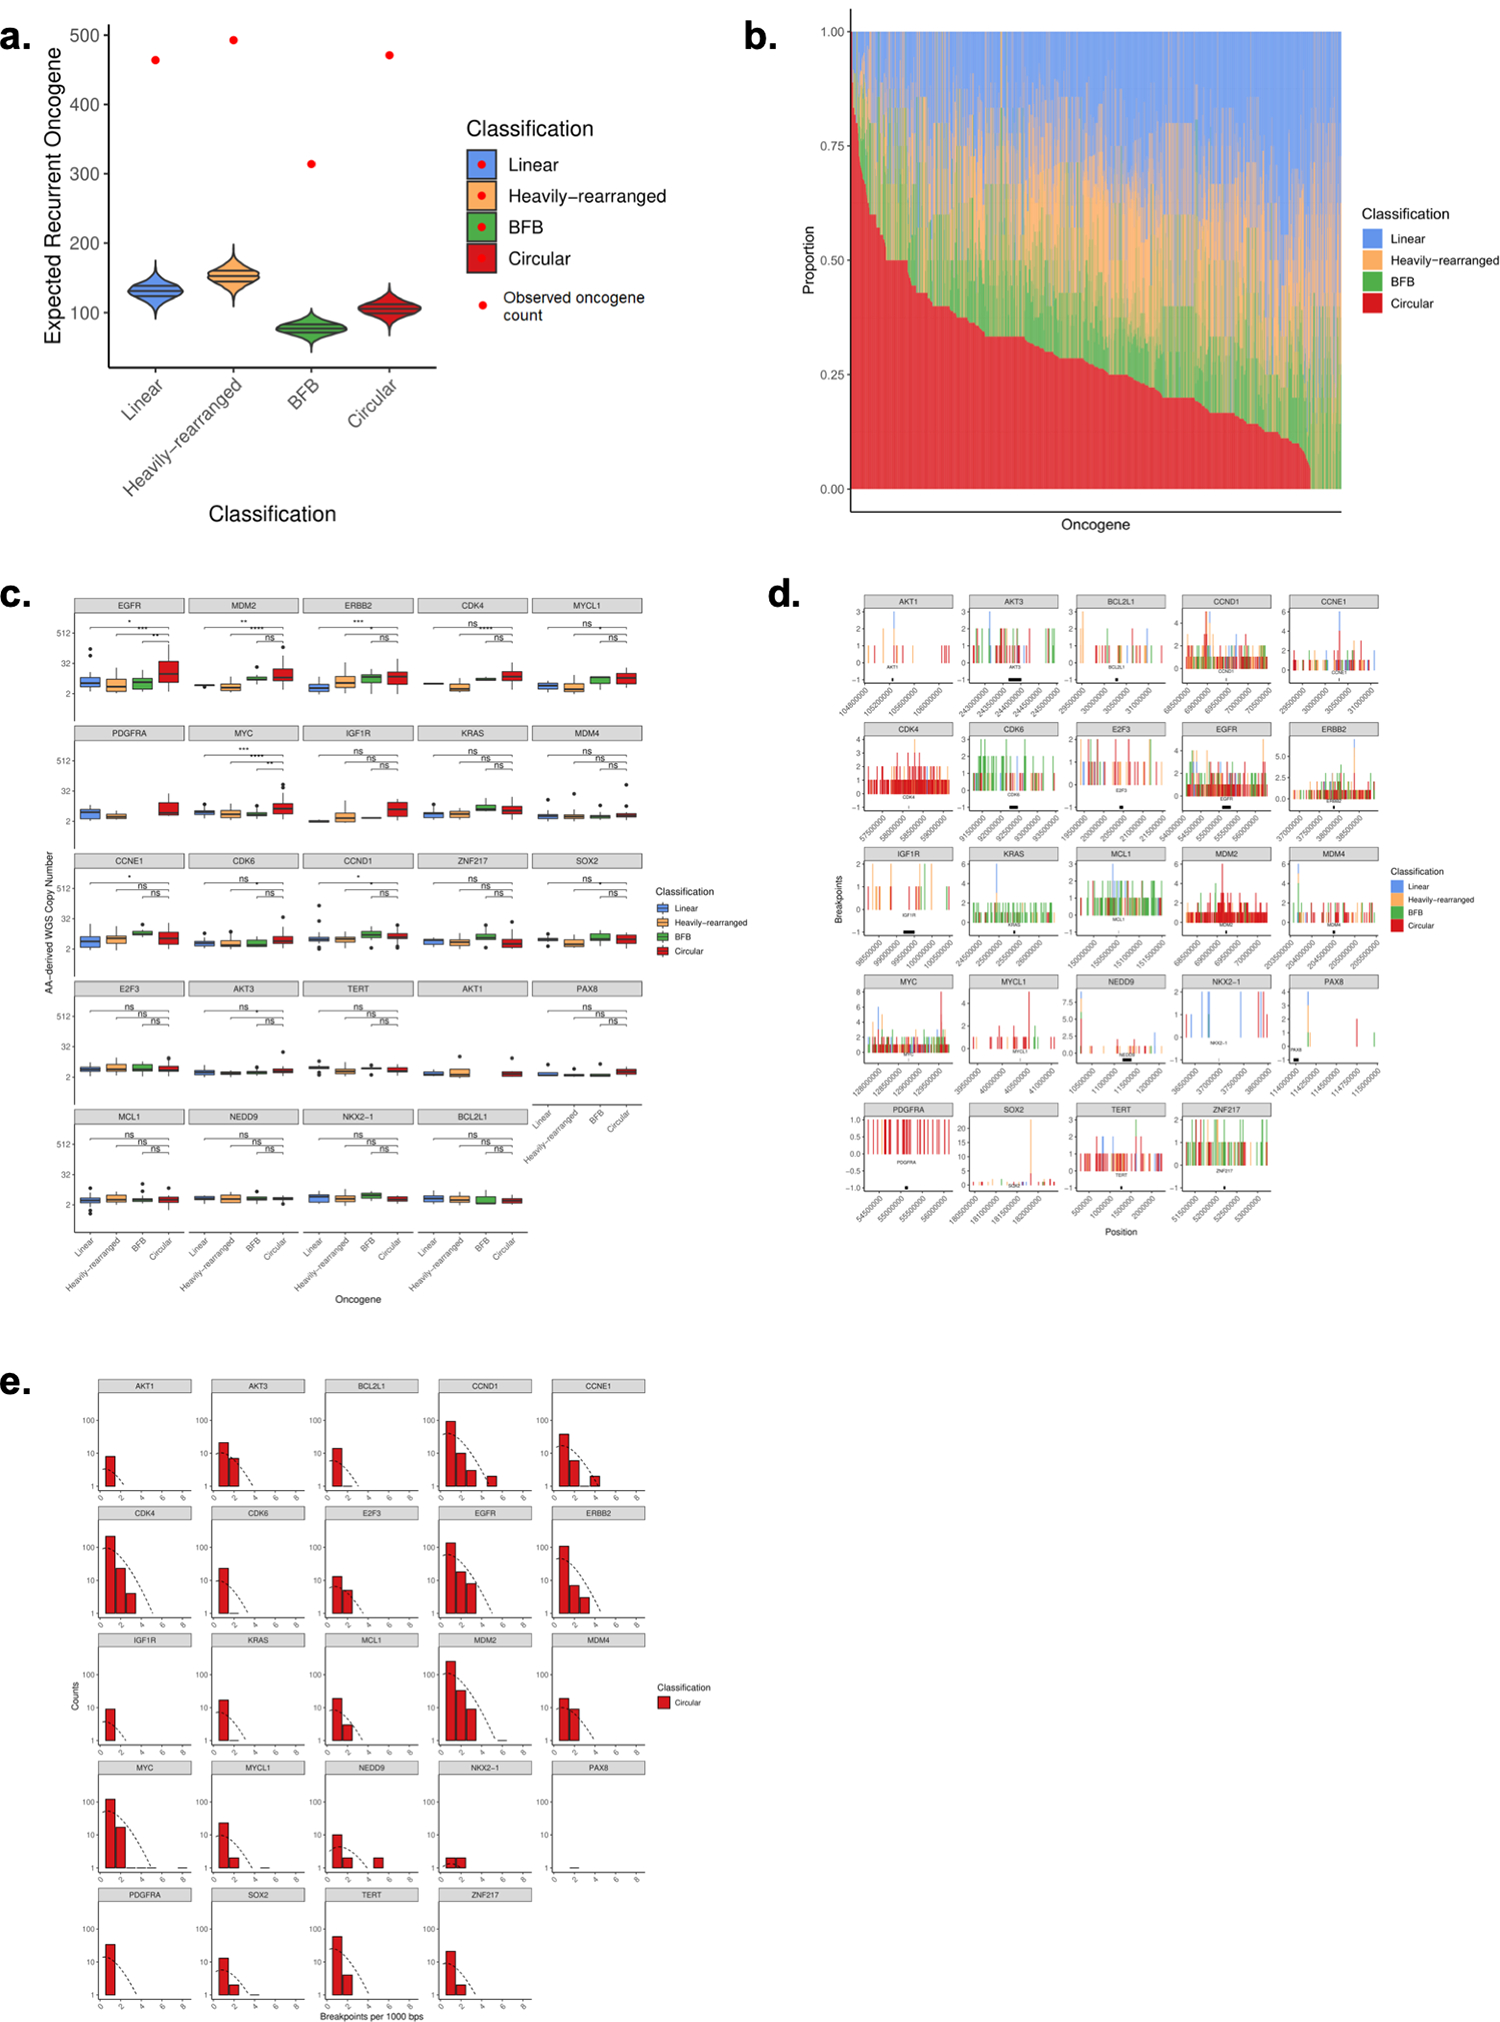
A. 24 recurrently amplified oncogenes significantly overlap circular regions (z-score 37.8), especially compared to amplified non-circular regions (z-scores of 30.4, 29.5, 28.0 for Linear, Heavily-rearranged, and BFB). B. For all oncogenes on amplicons with copy number >= 4 and present in at least 5 samples across the cohort, we show the class distribution of that oncogene. The oncogenes are ordered by proportion on circular amplification. C. For the 24 recurrent oncogenes known to be activated via amplification (Zack et al. Nat Gen. 2013), we report the average copy number for the oncogenes for circular amplification versus amplified-noncircular amplification. D. Breakpoint location across all samples for each recurrently amplified oncogene. We identified all breakpoints from each sample containing the recurrent oncogene on ecDNA and report the total number of breakpoints across this region in 1kb binned windows. E. Distribution of breakpoint locations across all circular samples for each recurrently amplified oncogene. We identified all breakpoints from each sample containing the recurrent oncogene on ecDNA. Shown is the distribution of the number of breakpoints in each bin, which closely follows a Poisson distribution, suggesting that the breakpoints are mostly randomly distributed across the region.
Extended Data Fig. 3. Genome instability vs amplicon classes.
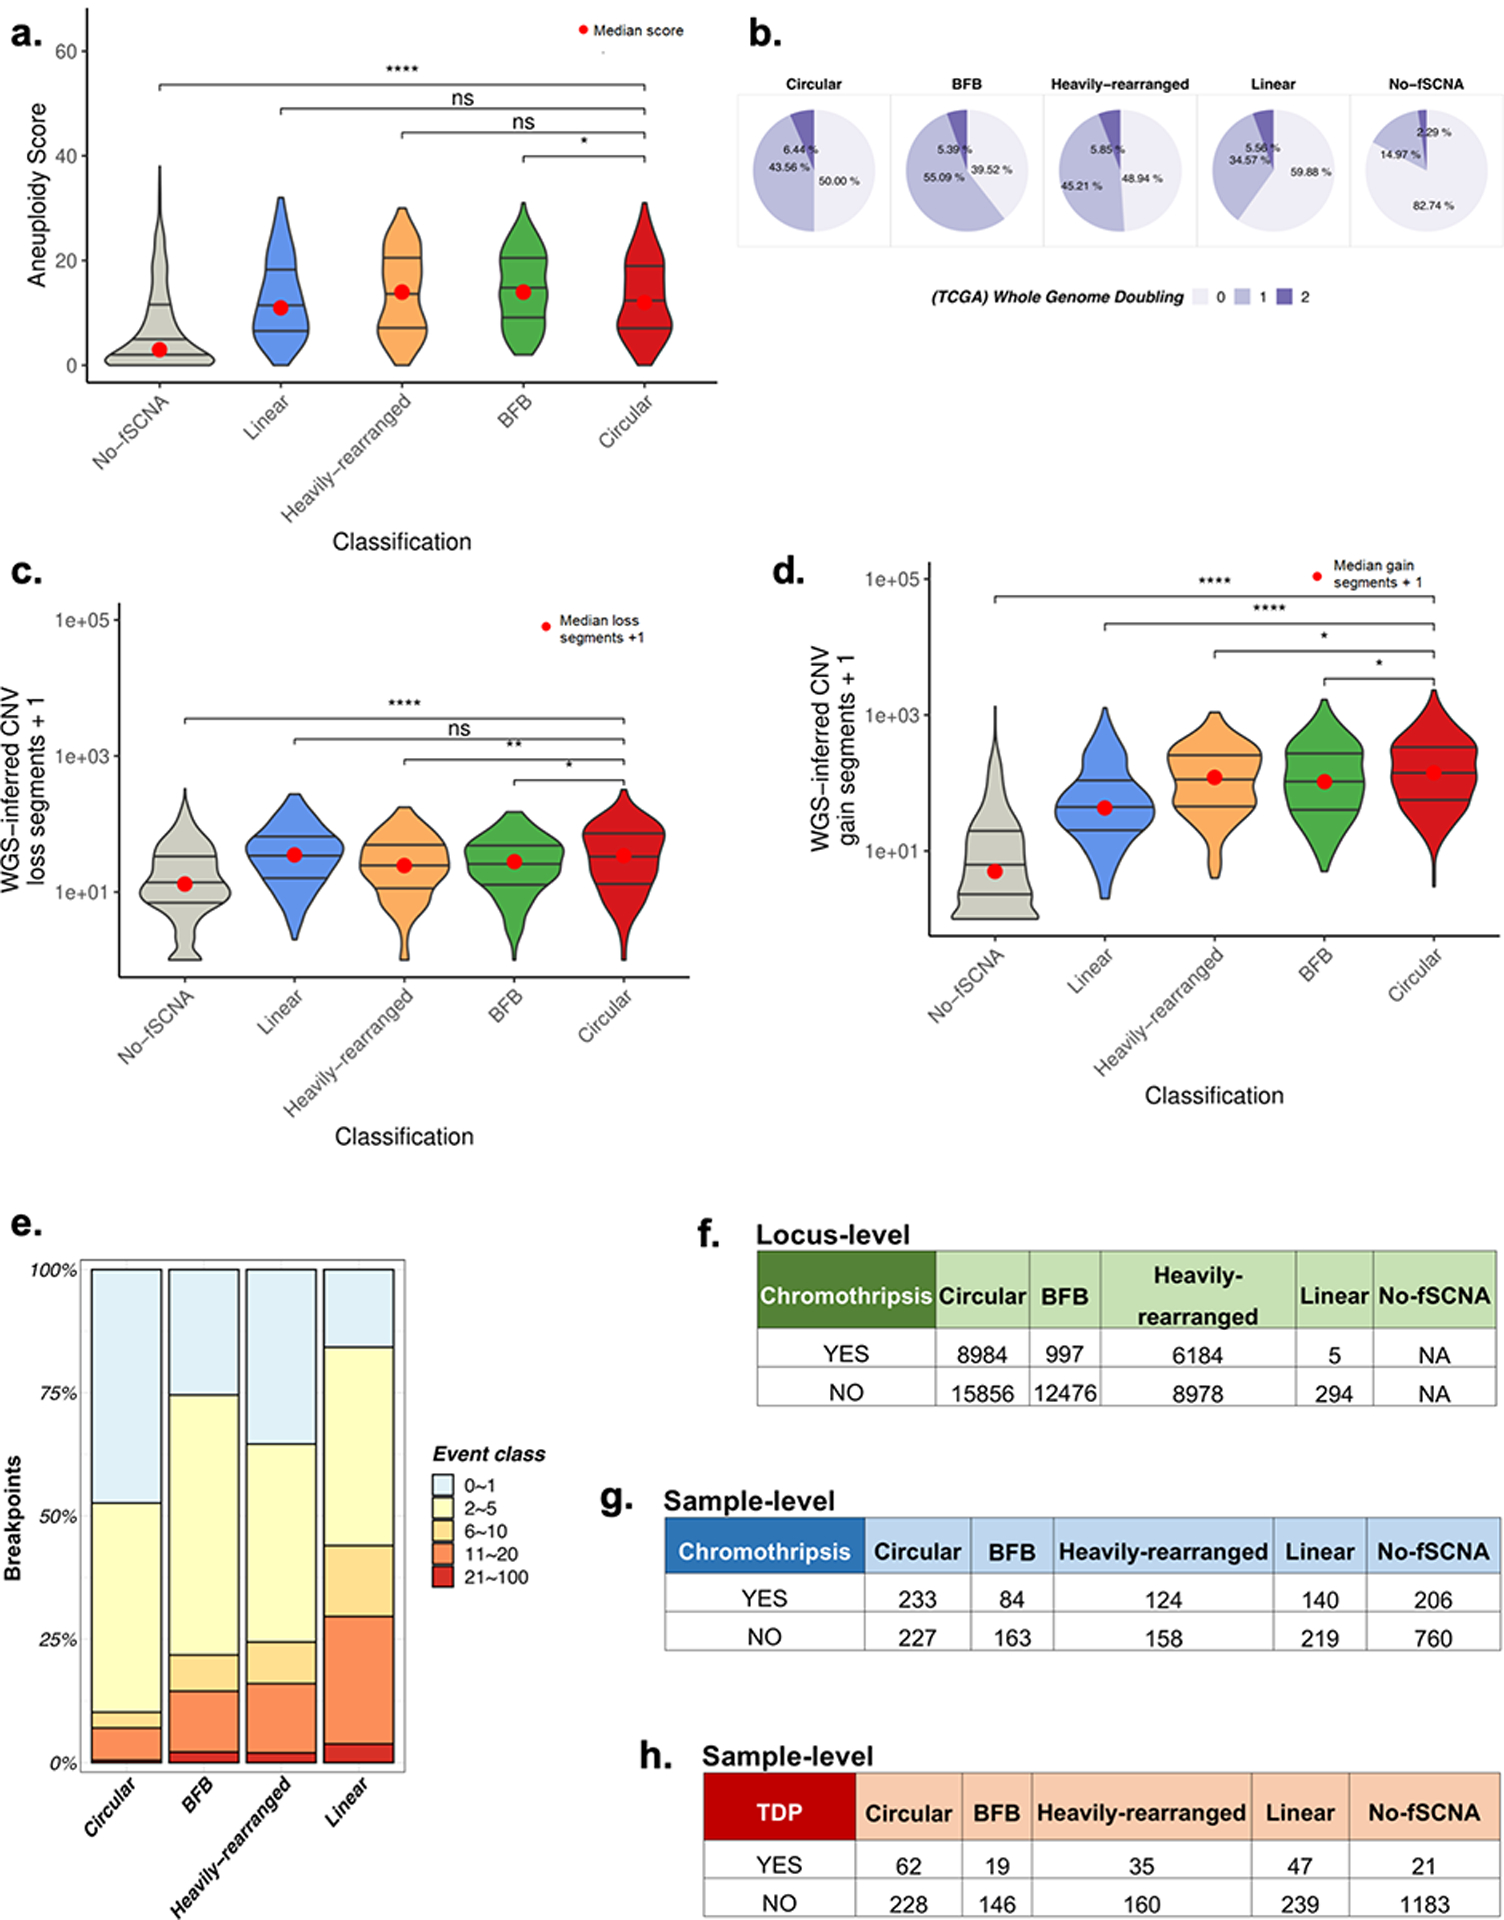
A. Chromosome arm aneuploidy scores showing no or marginal difference in chromosomal arm level events between circular and non-circular amplification classes. B. Genome doubling events by amplification class. C. Distribution for total DNA loss segments by amplification class. WGS-inferred CNV data was used to count the total number of DNA losses within a sample. A DNA loss was defined as a segment with CN < 2. D. Distribution for total DNA gain segments by amplification class. WGS-inferred CNV data was used to count the total number of DNA gains within a sample. A DNA gain was defined as a segment with CN > 2. Circular samples contain statistically significantly more DNA gains than BFB, Heavily-rearranged, Linear, and No-fSCNA (p-value <0.03, <0.03, <1e-20, and <1e-111, respectively; Wilcox Rank Sum Test). E. Breakpoint homology by amplification class. F. Comparison of amplicon versus locus-level chromothripsis (Pearson′s Chi-squared test data: X-squared = 4674.7, df = 3, p-value < 2.2e-16). G. Comparison of sample category versus sample-level chromothripsis (Pearson′s Chi-squared test data: X-squared = 21.58, df = 3, p-value 8e-05 (excludes ‘No fSCNA detected’ category)). H. Comparison of sample category versus sample-level tandem duplication (Pearson′s Chi-squared test data: X-squared = 7.39, df = 3, p-value 0.06 (excludes ‘No fSCNA detected’ category)).
Extended Data Fig. 4. Gene expression of amplicon classes.
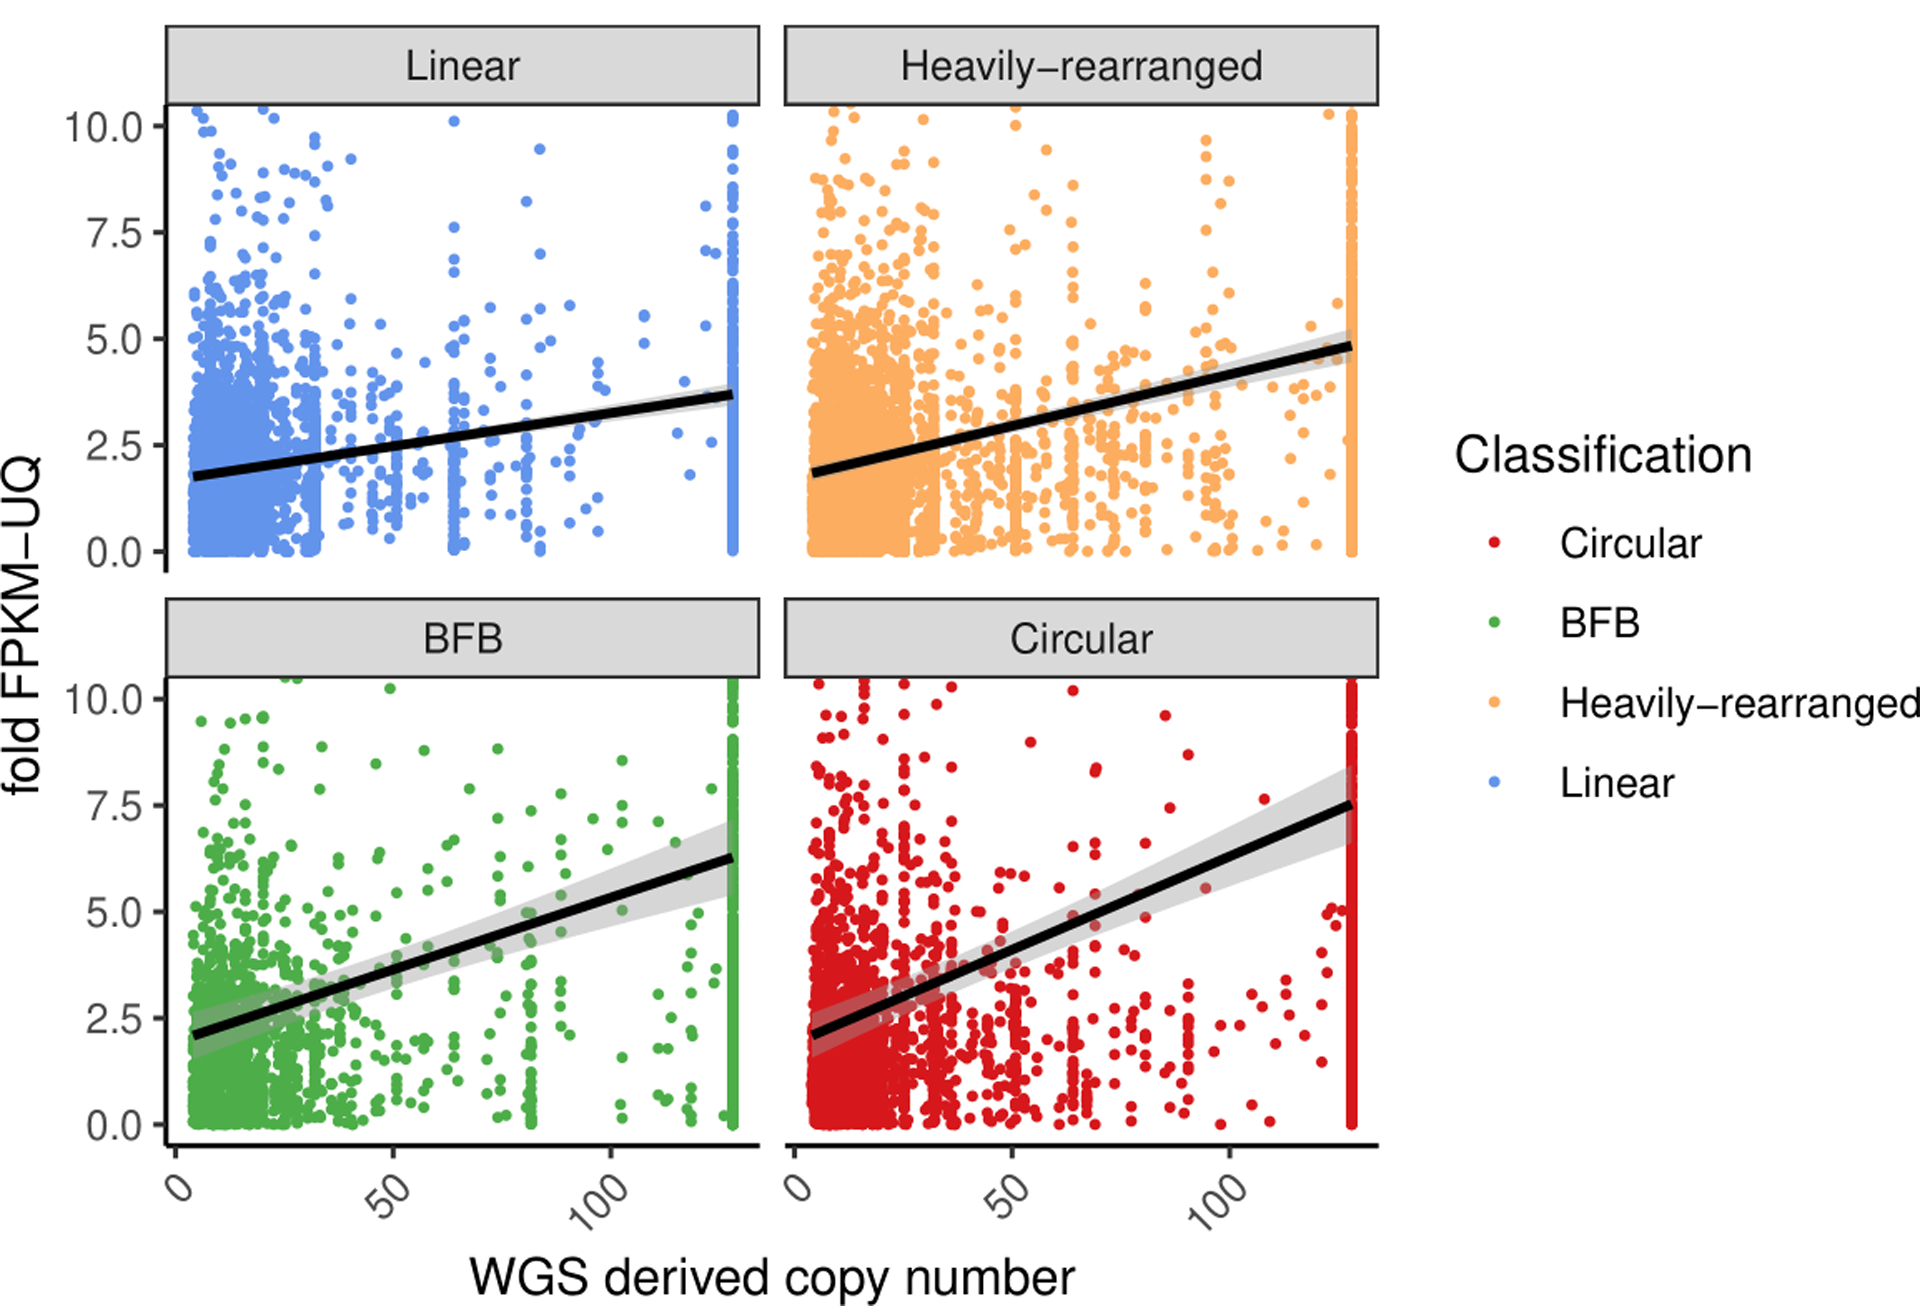
Copy number of the oncogene versus its fold-change in FPKM for all oncogenes with a copy count greater than 4, for each oncogene on each amplicon. The fold-change in FPKM is computed as the oncogene’s (FPKM-UQ+1) divided by the average of (FPKM-UQ+1) for the same oncogene in all other tumor samples from the same cohort for which the oncogene is not on any amplicon (i.e., not amplified). Linear regression lines, using fold change = m*CNV+b where m and b are selected to minimize error of the fit, are shown for each class. Tukey′s range test shows oncogenes on circular structures are significantly different to oncogenes on non-circular structures (p-value < 1e-7).
Extended Data Fig. 5. Lymph node stage vs amplicon classes.
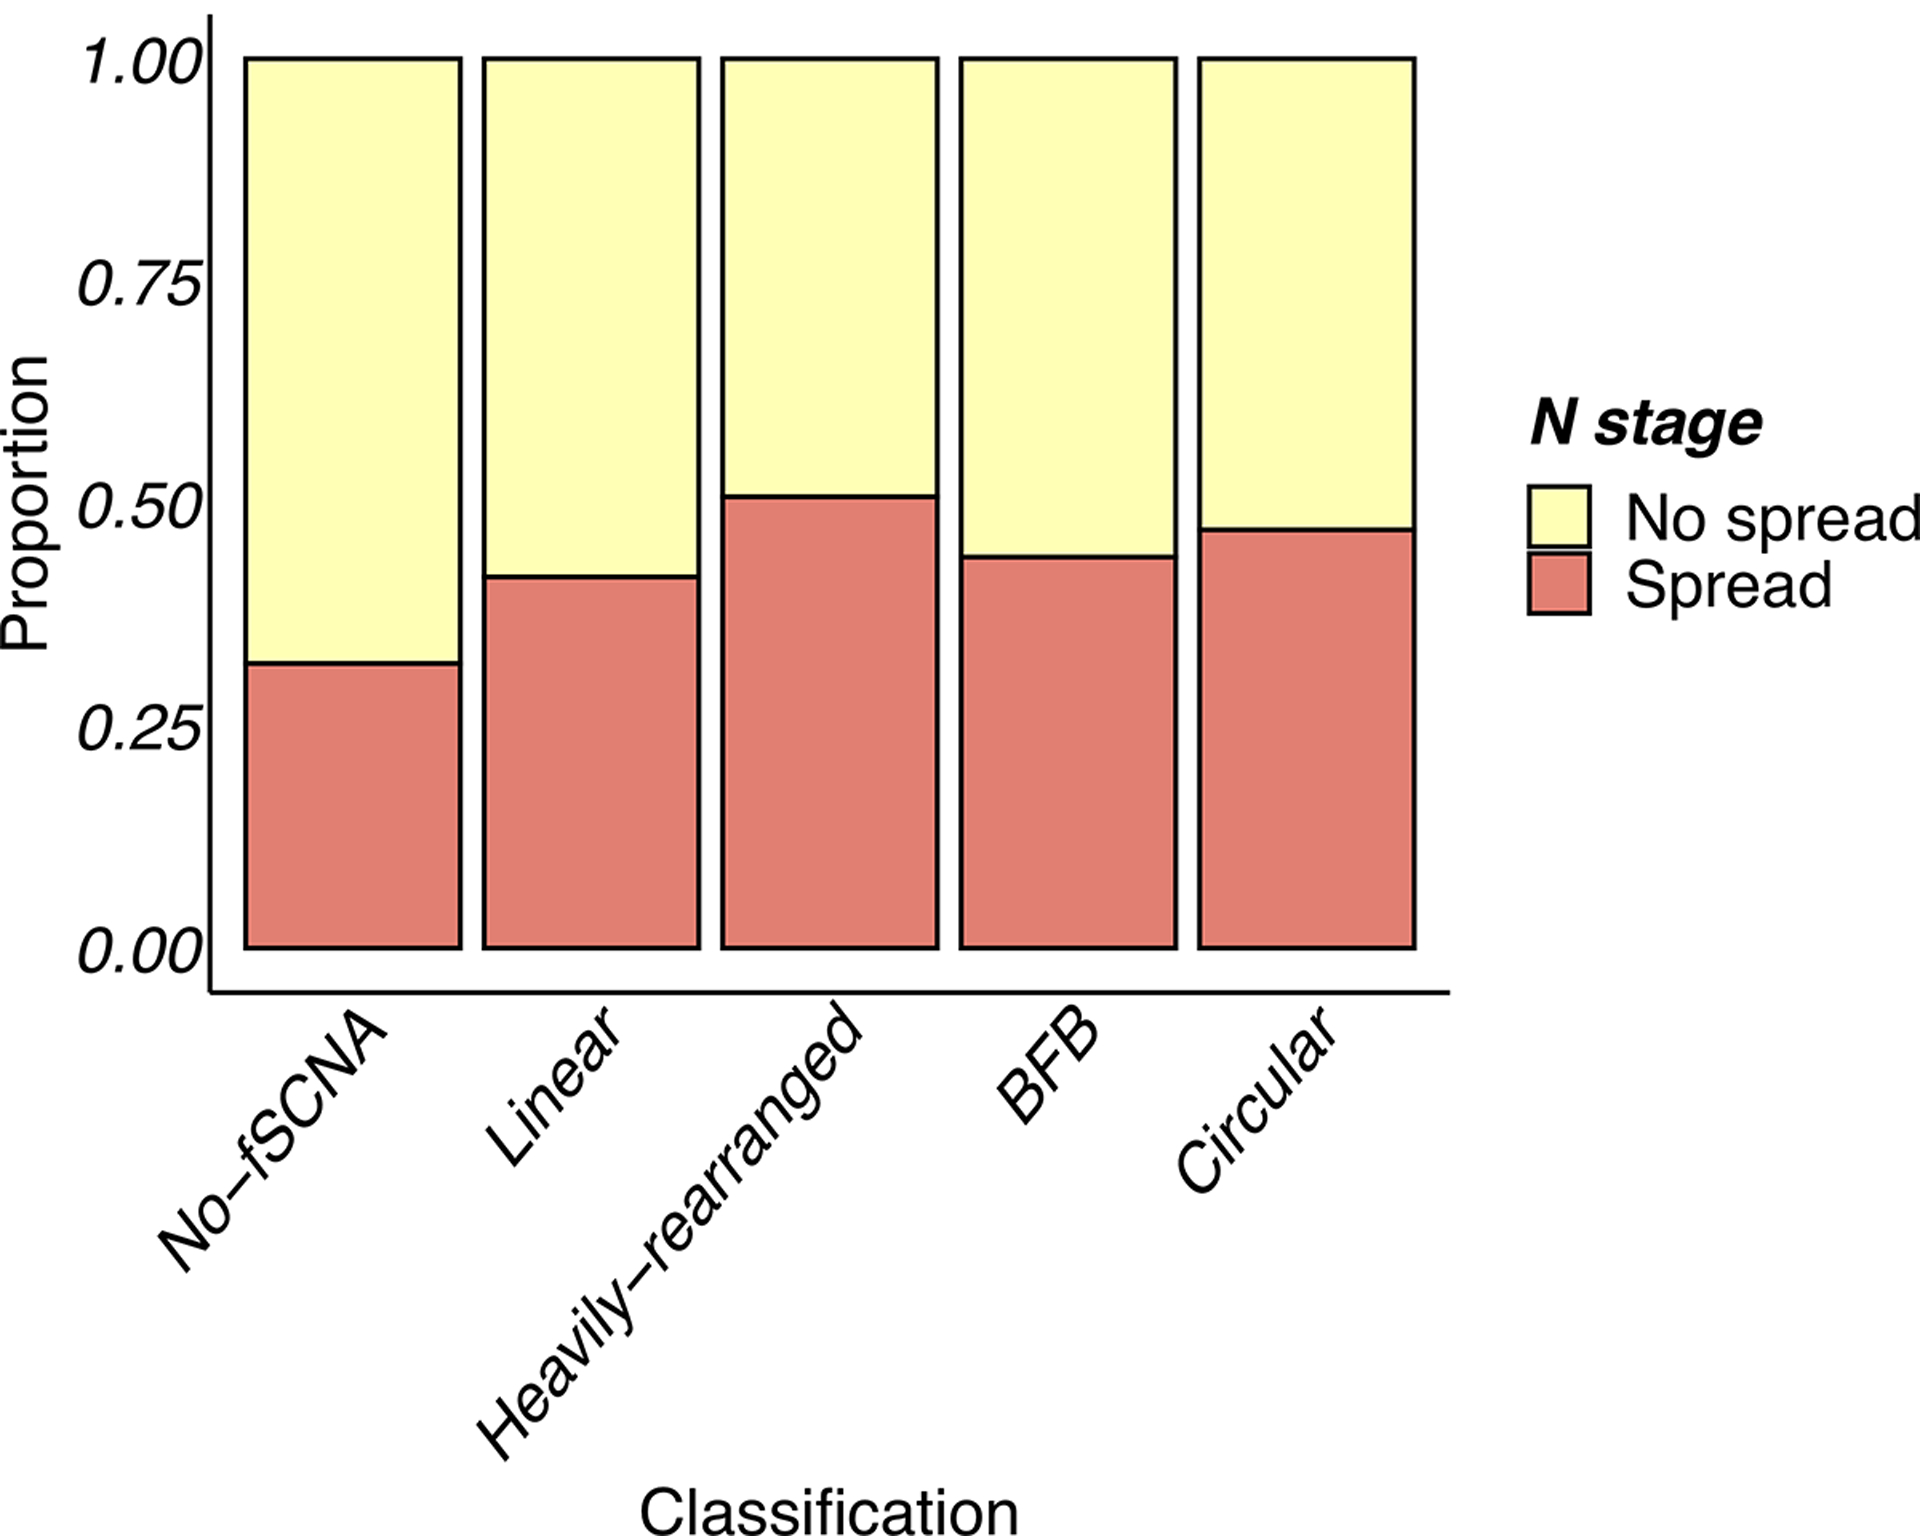
Lymph node stage for primary tumors showing samples with amplification are more likely to have spread to the lymph node at time of diagnosis (Chi-square test; df=4; p-value < 1e-05).
Extended Data Fig. 6. Cell cycle and immune infiltrate gene expression signatures vs amplicon classes.
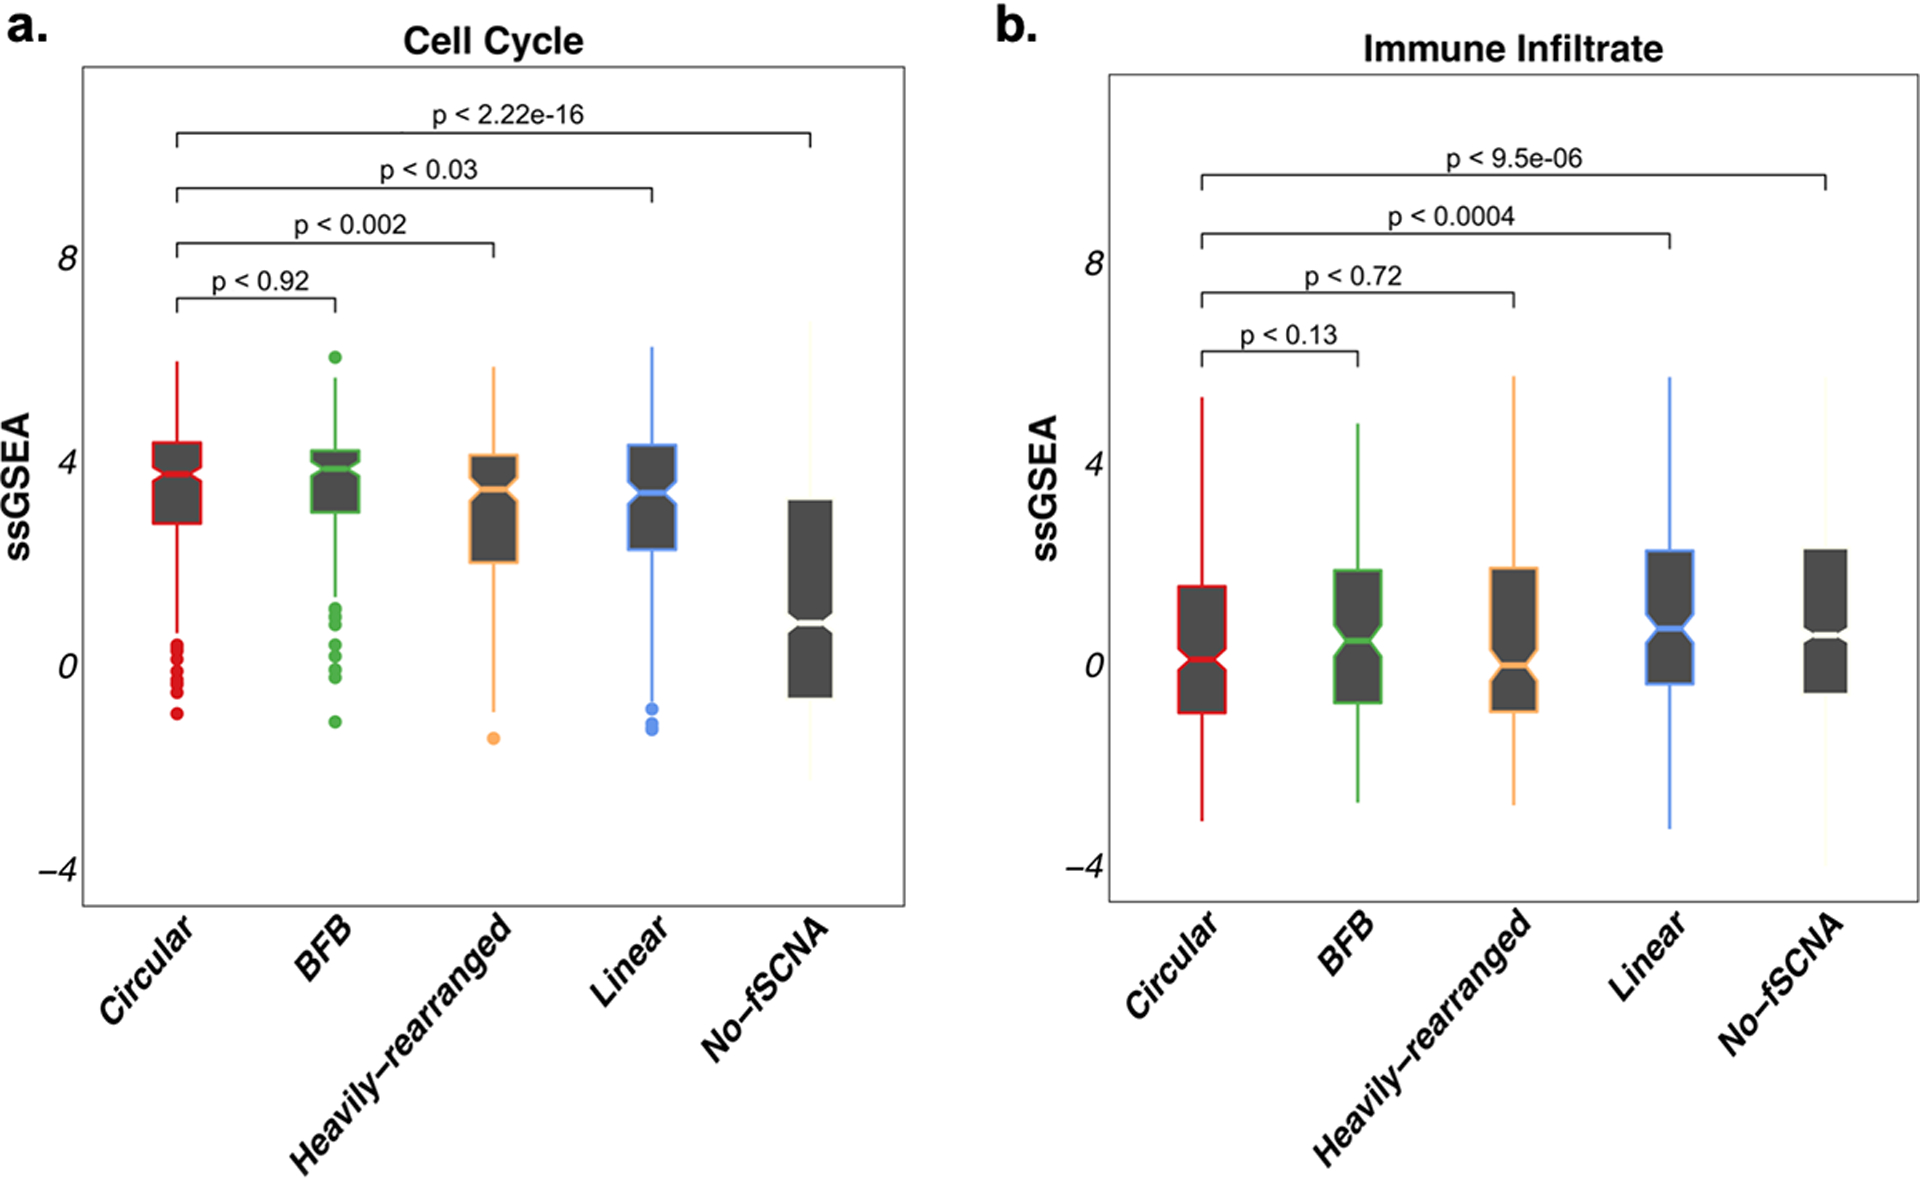
A. Cell Cycle gene expression signature single sample GSEA (ssGSEA) scores by amplification category. B. Immune infiltrate gene expression signature single sample GSEA (ssGSEA) scores by amplification category.
Supplementary Material
ACKNOWLEDGEMENTS
This work was supported by the Ludwig Institute for Cancer Research (P.S.M.), Defeat GBM Program of the National Brain Tumor Society (P.S.M.), NVIDIA Foundation, Compute for the Cure (P.S.M.), The Ben and Catherine Ivy Foundation (P.S.M.), generous donations from the Ziering Family Foundation in memory of Sigi Ziering (P.S.M.), and Ruth L. Kirschstein National Research Service Award. This work was also supported by the following NIH grants: NS73831 (P.S.M.), GM114362 (V.B.), R01 CA190121, R01 CA237208, R21 NS114873 and Cancer Center Support Grant P30 CA034196 (R.G.W.V), R35CA209919 (H.Y.C.), RM1-HG007735 (H.Y.C.), NSF grants: NSF-IIS-1318386 and NSF-DBI-1458557 (V.B.); and grants from the Musella Foundation, the B*CURED Foundation, the Brain Tumour Charity, and the Department of Defense W81XWH1910246 (R.G.W.V). H.Y.C. is an Investigator of the Howard Hughes Medical Institute. The results published here are in whole or part based upon data generated by the TCGA Research Network (https://www.cancer.gov/tcga) and the International Cancer Genome Consortium (https://icgc.org/). Analysis of TCGA and ICGC datasets was made possible through the Cancer Genomics Cloud of the Institute for Systems Biology (ISB-CGC) and the Amazon Web Services Cloud, respectively.
Footnotes
COMPETING INTERESTS
H.Y.C., P.S.M., V.B. and R.G.W.V. are scientific co-founders of Boundless Bio, Inc. (BBI), and serve as consultants. V.B. is a co-founder, and has equity interest in Digital Proteomics, LLC (DP), and receives income from DP. The terms of this arrangement have been reviewed and approved by the University of California, San Diego in accordance with its conflict of interest policies. N.P. N. and K.T. are employees of Boundless Bio, Inc.
REFERENCES
- 1.deCarvalho AC et al. Discordant inheritance of chromosomal and extrachromosomal DNA elements contributes to dynamic disease evolution in glioblastoma. Nat Genet 50, 708–717 (2018). [DOI] [PMC free article] [PubMed] [Google Scholar]
- 2.Turner KM et al. Extrachromosomal oncogene amplification drives tumour evolution and genetic heterogeneity. Nature 543, 122–125 (2017). [DOI] [PMC free article] [PubMed] [Google Scholar]
- 3.Verhaak RGW, Bafna V & Mischel PS Extrachromosomal oncogene amplification in tumour pathogenesis and evolution. Nat Rev Cancer (2019). [DOI] [PMC free article] [PubMed] [Google Scholar]
- 4.Weischenfeldt J et al. Pan-cancer analysis of somatic copy-number alterations implicates IRS4 and IGF2 in enhancer hijacking. Nat Genet 49, 65–74 (2017). [DOI] [PMC free article] [PubMed] [Google Scholar]
- 5.Zack TI et al. Pan-cancer patterns of somatic copy number alteration. Nat Genet 45, 1134–40 (2013). [DOI] [PMC free article] [PubMed] [Google Scholar]
- 6.Beroukhim R et al. The landscape of somatic copy-number alteration across human cancers. Nature 463, 899–905 (2010). [DOI] [PMC free article] [PubMed] [Google Scholar]
- 7.Alt FW, Kellems RE, Bertino JR & Schimke RT Selective multiplication of dihydrofolate reductase genes in methotrexate-resistant variants of cultured murine cells. J Biol Chem 253, 1357–70 (1978). [PubMed] [Google Scholar]
- 8.Kohl NE et al. Transposition and amplification of oncogene-related sequences in human neuroblastomas. Cell 35, 359–67 (1983). [DOI] [PubMed] [Google Scholar]
- 9.Nathanson DA et al. Targeted therapy resistance mediated by dynamic regulation of extrachromosomal mutant EGFR DNA. Science 343, 72–6 (2014). [DOI] [PMC free article] [PubMed] [Google Scholar]
- 10.Zheng S et al. A survey of intragenic breakpoints in glioblastoma identifies a distinct subset associated with poor survival. Genes Dev 27, 1462–72 (2013). [DOI] [PMC free article] [PubMed] [Google Scholar]
- 11.Trask BJ Fluorescence in situ hybridization: applications in cytogenetics and gene mapping. Trends Genet 7, 149–54 (1991). [DOI] [PubMed] [Google Scholar]
- 12.Deshpande V et al. Exploring the landscape of focal amplifications in cancer using AmpliconArchitect. Nat Commun 10, 392 (2019). [DOI] [PMC free article] [PubMed] [Google Scholar]
- 13.Xu K et al. Structure and evolution of double minutes in diagnosis and relapse brain tumors. Acta Neuropathol (2018). [DOI] [PMC free article] [PubMed] [Google Scholar]
- 14.Koche RP et al. Extrachromosomal circular DNA drives oncogenic genome remodeling in neuroblastoma. Nat Genet 52, 29–34 (2020). [DOI] [PMC free article] [PubMed] [Google Scholar]
- 15.Consortium ITP-CA o.W.G. Pan-cancer analysis of whole genomes. Nature 578, 82–93 (2020). [DOI] [PMC free article] [PubMed] [Google Scholar]
- 16.Zakov S, Kinsella M & Bafna V An algorithmic approach for breakage-fusion-bridge detection in tumor genomes. Proc Natl Acad Sci U S A 110, 5546–51 (2013). [DOI] [PMC free article] [PubMed] [Google Scholar]
- 17.Rajkumar U et al. EcSeg: Semantic Segmentation of Metaphase Images Containing Extrachromosomal DNA. iScience 21, 428–435 (2019). [DOI] [PMC free article] [PubMed] [Google Scholar]
- 18.Storlazzi CT et al. Gene amplification as double minutes or homogeneously staining regions in solid tumors: origin and structure. Genome Res 20, 1198–206 (2010). [DOI] [PMC free article] [PubMed] [Google Scholar]
- 19.Moller HD, Parsons L, Jorgensen TS, Botstein D & Regenberg B Extrachromosomal circular DNA is common in yeast. Proc Natl Acad Sci U S A 112, E3114–22 (2015). [DOI] [PMC free article] [PubMed] [Google Scholar]
- 20.Moller HD et al. Circular DNA elements of chromosomal origin are common in healthy human somatic tissue. Nat Commun 9, 1069 (2018). [DOI] [PMC free article] [PubMed] [Google Scholar]
- 21.Kumar P et al. Normal and Cancerous Tissues Release Extrachromosomal Circular DNA (eccDNA) into the Circulation. Mol Cancer Res 15, 1197–1205 (2017). [DOI] [PMC free article] [PubMed] [Google Scholar]
- 22.Shibata Y et al. Extrachromosomal microDNAs and chromosomal microdeletions in normal tissues. Science 336, 82–6 (2012). [DOI] [PMC free article] [PubMed] [Google Scholar]
- 23.Turner KM et al. Extrachromosomal oncogene amplification drives tumour evolution and genetic heterogeneity. Nature (2017). [DOI] [PMC free article] [PubMed] [Google Scholar]
- 24.Davoli T & de Lange T The causes and consequences of polyploidy in normal development and cancer. Annu Rev Cell Dev Biol 27, 585–610 (2011). [DOI] [PubMed] [Google Scholar]
- 25.Bielski CM et al. Genome doubling shapes the evolution and prognosis of advanced cancers. Nat Genet 50, 1189–1195 (2018). [DOI] [PMC free article] [PubMed] [Google Scholar]
- 26.Cortes-Ciriano I et al. Comprehensive analysis of chromothripsis in 2,658 human cancers using whole-genome sequencing. Nat Genet 52, 331–341 (2020). [DOI] [PMC free article] [PubMed] [Google Scholar]
- 27.Ly P et al. Chromosome segregation errors generate a diverse spectrum of simple and complex genomic rearrangements. Nat Genet 51, 705–715 (2019). [DOI] [PMC free article] [PubMed] [Google Scholar]
- 28.Zhang CZ et al. Chromothripsis from DNA damage in micronuclei. Nature 522, 179–84 (2015). [DOI] [PMC free article] [PubMed] [Google Scholar]
- 29.Umbreit NT et al. Mechanisms generating cancer genome complexity from a single cell division error. Science 368(2020). [DOI] [PMC free article] [PubMed] [Google Scholar]
- 30.Menghi F et al. The Tandem Duplicator Phenotype Is a Prevalent Genome-Wide Cancer Configuration Driven by Distinct Gene Mutations. Cancer Cell 34, 197–210 e5 (2018). [DOI] [PMC free article] [PubMed] [Google Scholar]
- 31.Morton AR et al. Functional Enhancers Shape Extrachromosomal Oncogene Amplifications. Cell 179, 1330–1341 e13 (2019). [DOI] [PMC free article] [PubMed] [Google Scholar]
- 32.Wu S et al. Circular ecDNA promotes accessible chromatin and high oncogene expression. Nature 575, 699–703 (2019). [DOI] [PMC free article] [PubMed] [Google Scholar]
- 33.Corces MR et al. The chromatin accessibility landscape of primary human cancers. Science 362(2018). [DOI] [PMC free article] [PubMed] [Google Scholar]
- 34.Helmsauer K et al. Enhancer hijacking determines intra- and extrachromosomal circular MYCN amplicon architecture in neuroblastoma. bioRxiv, 2019.12.20.875807 (2019). [DOI] [PMC free article] [PubMed] [Google Scholar]
- 35.Davoli T, Uno H, Wooten EC & Elledge SJ Tumor aneuploidy correlates with markers of immune evasion and with reduced response to immunotherapy. Science 355(2017). [DOI] [PMC free article] [PubMed] [Google Scholar]
- 36.Hadi K et al. Novel patterns of complex structural variation revealed across thousands of cancer genome graphs. bioRxiv, 836296 (2019). [Google Scholar]
- 37.Priestley P et al. Pan-cancer whole-genome analyses of metastatic solid tumours. Nature 575, 210–216 (2019). [DOI] [PMC free article] [PubMed] [Google Scholar]
- 38.Taylor AM et al. Genomic and Functional Approaches to Understanding Cancer Aneuploidy. Cancer Cell 33, 676–689 e3 (2018). [DOI] [PMC free article] [PubMed] [Google Scholar]
- 39.Hu X et al. TumorFusions: an integrative resource for cancer-associated transcript fusions. Nucleic Acids Res 46, D1144–D1149 (2018). [DOI] [PMC free article] [PubMed] [Google Scholar]
- 40.Yoshihara K et al. The landscape and therapeutic relevance of cancer-associated transcript fusions. Oncogene 34, 4845–54 (2015). [DOI] [PMC free article] [PubMed] [Google Scholar]
- 41.Torres-Garcia W et al. PRADA: pipeline for RNA sequencing data analysis. Bioinformatics 30, 2224–6 (2014). [DOI] [PMC free article] [PubMed] [Google Scholar]
- 42.Wala JA et al. SvABA: genome-wide detection of structural variants and indels by local assembly. Genome Res 28, 581–591 (2018). [DOI] [PMC free article] [PubMed] [Google Scholar]
- 43.Quinlan AR BEDTools: The Swiss-Army Tool for Genome Feature Analysis. Curr Protoc Bioinformatics 47, 11 12 1–34 (2014). [DOI] [PMC free article] [PubMed] [Google Scholar]
Associated Data
This section collects any data citations, data availability statements, or supplementary materials included in this article.
Supplementary Materials
Data Availability Statement
Information on accessing the data from the International Cancer Genomics Consortium, including raw read files, can be found at https://docs.icgc.org/pcawg/data/. All open-access TCGA data are publicly available through NCI Genomic Data Commons (https://gdc.cancer.gov/). Datasets marked ‘Controlled’ contain potentially identifiable information and require authorization from the ICGC and TCGA Data Access Committees. In accordance with the data-access policies of the ICGC and TCGA projects, most molecular, clinical and specimen data are in an open tier that does not require access approval. To access sequencing data, researchers need to apply to the TCGA Data Access Committee (DAC) via dbGaP (https://dbgap.ncbi.nlm.nih.gov/aa/wga.cgi?page=login) for access to the TCGA portion of the dataset, and to the ICGC Data Access Compliance Office (DACO; http://icgc.org/daco) for the ICGC portion. All images analyzed can be obtained from https://figshare.com/s/6c3e2edc1ab299bb2fa0 and https://figshare.com/s/ab6a214738aa43833391.


