

Abstract
Objective:
Even in high-risk trials pertaining to transcatheter aortic valve replacement (TAVR), patients with end-stage liver disease (ESLD) have been under-represented. We sought to study this population group from a large national United States population database.
Methods:
We used National Inpatient Sample (NIS) database from January 2005 to August 2015. Patients with ESLD were extracted using Goldberg’s algorithm. Propensity match analysis was done for comparative analysis between surgical aortic valve replacement (SAVR) and TAVR groups. Logistic regression analysis was used for predictors of in-hospital mortality.
Results:
Out of 309,959 ESLD patients, 1,375 underwent aortic valve replacement and 1,199 patients were included in our study. Mean age was 66.1 (SD, 9.1) years. In matched data, the in-hospital mortality was 5.5% in TAVR group when compared to 19.4% in SAVR group. Ventilator use (16.1 vs. 27.2%, p < .01), tracheostomy (<4 vs. 7.2%, p < .01), and vasopressin use (0 vs. 7.4%, p < .01) were utilized less in TAVR group as compared to SAVR group. The proportion of TAVR has increased from almost zero in 2011 to 51.3% in 2015. Mean cost for hospital stay has increased in SAVR group (from 254,427$ in 2005 to 321,791$ in 2015, p < .01). Similarly, a large decrease in length of stay has been observed for TAVR group (14.5 days in 2011 to 5.4 days in 2015, p < .01). TAVR (odds ratios [OR]: 0.42, 95% confidence interval [CI]: 0.20–0.87, p = .02) was associated with lower in-hospital mortality.
Conclusion:
TAVR was associated with lower in-hospital mortality, morbidity, and resource utilization in high-risk ESLD patients.
Keywords: end-stage liver disease, outcomes, surgical aortic valve replacement, transcatheter aortic valve replacement
1 |. INTRODUCTION
With the widespread availability and utilization of transcatheter valve replacement (TAVR), there has been a paradigm shift in treatment of aortic stenosis.1 While TAVR is now well established for high-risk aortic valve replacement (AVR), recent randomized trials2,3 even favor TAVR in low risk patients.4 Despite having a significant burden of patients with advanced liver disease and coexisting aortic valve stenosis, current risk prediction models such as Society of Thoracic Surgeons (STS) risk score (lack criteria to include this high-risk population. Previously reported studies have analyzed patients with cirrhosis;5–8 however, there is paucity of data on utilization and clinical outcome of TAVR and surgical aortic valve replacement (SAVR) in population with end-stage liver disease (ESLD).7 The objectives of our study are to evaluate contemporary trends in patients with ESLD undergoing TAVR or SAVR by incorporating a well-validated definition9 of patients with ESLD in our analysis.
2 |. METHODS
2.1 |. Study data
National Inpatient Sample (NIS) was used. NIS is part of Healthcare Cost and Utilization Project (HCUP) databases and is made possible by a Federal-State-Industry partnership sponsored by the Agency for Healthcare Research and Quality (AHRQ). The NIS is derived from all states for national estimates of healthcare utilization, costs, and outcomes.10 Since NIS is compiled annually, the data can be used for analysis of disease trends over time. Institutional Review Board approval and informed consents were not required for this study given the deidentified nature of the NIS database and public availability.
2.2 |. Study population and design
We analyzed NIS data from January 2005 to August 2015 using the International Classification of Diseases, Ninth Revision, Clinical Modification (ICD-9-CM) codes. For better comparable groups between TAVR and SAVR, young patients (patients <50 years) were excluded. ESLD is defined as patients with cirrhosis having an acute decompensating event like clinical ascites, variceal hemorrhage, hepatic encephalopathy, or renal impairment. Patients with ESLD were identified using ICD-9 codes of Goldberg’s third algorithm,9 a well-validated method for identifying ESLD from administrative datasets, generating a positive predictive value of cirrhosis, ESLD, and hepatic decompensation event at 93.9, 89.8, and 82.3% respectively. First, ICD-9-CM codes were used to select chronic liver disease (070.20–21, 070.23, 070.30–33, 070.40, 070.42, 070.49, 070.52, 070.59–60, 070.70–71, 070.90, 571.1, 571.40–41, 571.8, and 571.9), then a concurrent diagnosis code of cirrhosis was added (571.2, 571.5, or 571.6) and finally at least one concurrent diagnostic code of hepatic decompensating defining event was added (456.0, 456.20 for esophageal varices with bleeding; 456.1, 456.21 for esophageal varices without bleeding; 789.5, 789.59 for ascites; 572.2 for hepatic coma, 567.0, 567.2, 567.21, 567.21, 567.29, 567.8, 567.89, 567.9 for peritonitis; or 572.4 for hepatorenal syndrome). Hepatic decompensating event was defined as per American Association for the Study of Liver Diseases (AASLD).11 Given there are no validated data extraction designs for ICD-10 codes, the available NIS data for year 2016 was not used. Patients with ESLD were grouped into two cohorts of patients, who underwent TAVR (ICD-9-CM codes 35.05 and 35.06) or SAVR (ICD-9 CM codes 35.21 and 35.22) (Figure 1). Baseline characteristics of patients undergoing TAVR and SAVR with ESLD along with hospital outcomes were derived (Table 1).
FIGURE 1.
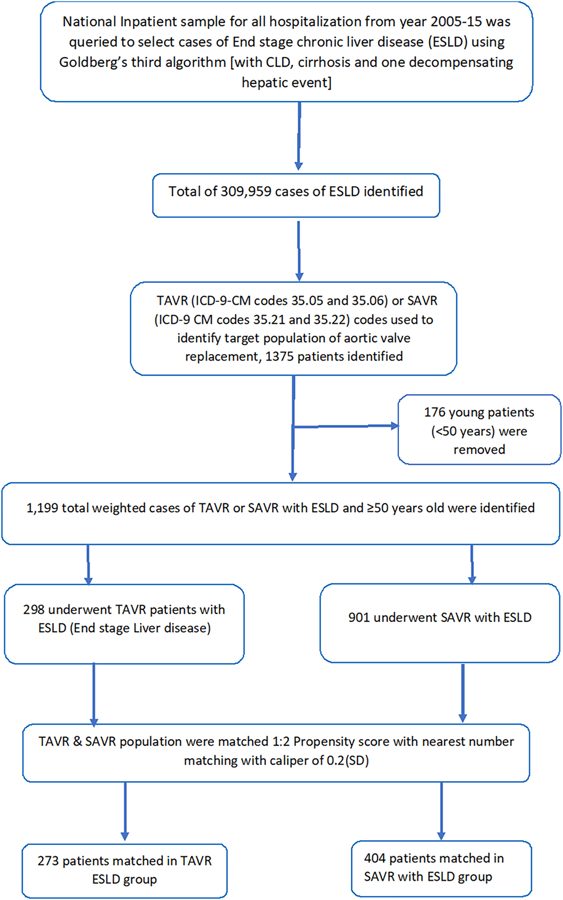
Flow sheet [Color figure can be viewed at wileyonlinelibrary.com]
TABLE 1.
Baseline characteristics of the study population
| Variable | TAVR (n = 298) | SAVR (n = 901) | All ESLD (n = 1,199) | p value |
|---|---|---|---|---|
| Age (mean [SD]) years | 67.4 (8.6) | 65.7 (9.3) | 66.1 (9.1) | <.01 |
| Female | 85 (28.4%) | 256 (28.4%) | 341 (28.4%) | .98 |
| Race | ||||
| Caucasian | 258 (92.8%) | 667 (80.1%) | 925 (83.3%) | <.01 |
| African American | <11 (3.5%) | <11 (<1.2%) | 20 (1.8%) | |
| Hispanics | <11 (3.5%) | 109 (13.1%) | 119 (10.7%) | |
| Asian or Pacific Islander | 0 | 15 (1.8%) | 15 (1.4%) | |
| AHRQ medical comorbidity | ||||
| Alcohol abuse | 40 (13.4%) | 246 (27.3%) | 286 (23.8%) | <.01 |
| Anemia | 15 (5.%) | 19 (2.1%) | 34 (2.8%) | <.01 |
| Collagen vascular diseases | <11 (<3.5%) | 12 (1.3%) | 22 (1.8%) | <.01 |
| Congestive heart failure | 25 (8.4%) | 34 (3.8%) | 59 (4.9%) | <.01 |
| Chronic pulmonary disease | 89 (29.8%) | 231 (25.6%) | 320 (26.6%) | .16 |
| Coagulopathy | 194 (64.9%) | 557 (61.8%) | 751 (62.5%) | .32 |
| Diabetes | 145 (48.5%) | 251 (27.9%) | 396 (33.0%) | <.01 |
| Hypertension | 145 (48.5%) | 251 (27.9%) | 396 (33.0%) | <.01 |
| Fluid and electrolyte disorders | 104 (34.9%) | 422 (46.80% | 526 (43.9%) | <.01 |
| Metastatic cancer | 0 | <11 (<1.2%) | <11 (<1.2%) | <.01 |
| Neurological disorders | <11 (3.5%) | 30 (3.3%) | 40 (3.3%) | <.01 |
| Peripheral vascular disorders | 55 (18.5%) | 113 (12.5%) | 168 (14.0%) | <.01 |
| Renal failure | 95 (31.8%) | 164 (18.2%) | 259 (21.6%) | <.01 |
| Solid tumor without metastasis | 25 (8.4%) | 35 (3.9%) | 60 (5.0%) | <.01 |
| Hospital location | ||||
| Rural | 0 | 25 (2.8%) | 25 (2.1%) | <.01 |
| Urban nonteaching | <11 (3.5%) | 203 (22.5%) | 213 (17.8%) | |
| Urban teaching | 288 (96.6%) | 673 (74.7%) | 961 (80.2%) | |
| Bed size of the hospital | ||||
| Small | 20 (6.7%) | 34 (3.8%) | 54 (4.5%) | <.01 |
| Medium | 60 (20.1%) | 131 (14.5%) | 191 (15.9%) | |
| Large | 218 (73.2%) | 737 (81.7%) | 955 (79.6%) | |
| Region (%) | ||||
| Northeast | 74 (24.7%) | 290 (32.2%) | 364 (30.3%) | <.01 |
| Midwest | 80 (26.8%) | 372 (41.2%) | 452 (37.6%) | |
| South | 90 (30.1%) | 155 (17.2%) | 245 (20.4%) | |
| West | 55 (18.4%) | 85 (9.4%) | 140 (11.7%) | |
| Median household income percentile | ||||
| 0–25th | 45 (15.1%) | 164 (19.0%) | 209 (18.0%) | .02 |
| 26–50th | 110 (36.8%) | 236 (27.3%) | 346 (29.8%) | |
| 51–75th | 70 (23.4%) | 233 (27.0%) | 303 (26.1%) | |
| 76–100th | 74 (24.7%) | 231 (26.7%) | 305 (26.2%) |
Abbreviations: AHRQ, Agency for Healthcare Research and Quality; ESLD, end-stage liver disease; SAVR, surgical aortic valve replacement; TAVR, transcatheter aortic valve replacement.
2.3 |. Study end points
The primary end point of the study was in-hospital mortality. Secondary end points were discharge disposition, length of stay, and cost of stay.
2.4 |. Statistical analysis
Descriptive statistics were presented as frequencies with percentages for categorical variables and as means with standard deviations for continuous variables. Baseline characteristics were compared using a Pearson’s chi-squared test and Fisher’s exact test (when output was expected to be <5) for categorical variables and independent samples t test for continuous variables. Linear regression was done for trends where appropriate. Trends; including length of stay and cost were calculated in the overall cohort given the smaller data size in matched cohort. To account for potential confounding factors and selection bias, a propensity score-matching model was developed using logistic regression to derive two matched groups for comparative outcome analysis. Given larger SAVR group and to minimize losses, a nearest neighbor 1:2 variable ratio, parallel, balanced propensity-matching model was made using a caliper width of SD 0.2. Univariate (multivariable), single step, logistic regression was performed to estimate odds ratios (ORs) with 95% confidence intervals (CIs) to determine predictors for in-hospital mortality in AVR in ESLD. Chi-square test was used for regression model testing. A type I error rate of <0.05 was considered statistically significant. All statistical analyses were performed using statistical package for social science (SPSS) version 26 (IBM Corp) and R 3.5 for propensity matching using “MatchIt” package.
3 |. RESULTS
3.1 |. Outcomes in TAVR as compared to SAVR in match and unmatched cohort
A total of 1,199 patients with either TAVR or SAVR were identified. Baseline characteristics of the study population are shown in Table 1. Mean age was 66.1 ([SD, 9.1] years.). Mean age for TAVR was 1.7 years greater than SAVR. Of these, 28.4% patients were women: 83.3% were Caucasian, 1.8% were African American, and 10.7% were Hispanics. Crude in-hospital mortality was 6.7% in TAVR group and 18.7% in SAVR group (Table 2). After 2:1 propensity matching 404 patients in SAVR group were matched to 273 patients in TAVR group. Baseline characteristics after propensity score matching are shown in supplementary. In matched data, the in-hospital mortality was 5.5% in TAVR group as compared to 19.4% in SAVR group. TAVR had significantly superior outcomes in several major matrices including discharge disposition to self-care, hospital length of stay, cost of stay as well as less complications of myocardial infarction and dialysis-dependent renal failure (Table 3).
TABLE 2.
Hospital encounter outcomes and resource utilization of the study cohort
| Variables | TAVR (n = 298) | SAVR (n = 901) | All ESLD (n = 1,199) | p value |
|---|---|---|---|---|
| Died at discharge | 20 (6.70%) | 169 (18.7%) | 189 (15.70%) | <.01 |
| Discharge disposition of surviving patients | ||||
| Routine/self-care | 135 (48.4%) | 158 (21.6%) | 293 (29.0%) | <.01 |
| Short-term hospital | 0 | 15 (2.0%) | 15 (1.5%) | |
| Another type of facility | 45 (16.1%) | 273 (37.2%) | 318 (31.4%) | |
| Home health care | 99 (35.5%) | 287 (39.2%) | 386 (38.1%) | |
| Resource utilization, mean (SD) | ||||
| Length of stay, mean (SD), days | 8.6 (8.0) | 19.7 (14.9) | 16.9 (14.4) | <.01 |
| Cost of hospitalization-mean (SD), $ | 241,666 (125,290) | 299,993 (242,087) | 285,483 (220,331) | <.01 |
| Procedures during stay | ||||
| Acute myocardial infraction | <11 (3.5%) | 58 (6.4%) | 63 (5.3%) | <.01 |
| Atrial fibrillation | 94 (31.5%) | 434 (48.2%) | 528 (44.0%) | <.01 |
| Cardiac arrest | <11 (3.5%) | 30 (3.3%) | 35 (2.9%) | .14 |
| Cardiogenic shock | 20 (6.7%) | 31 (3.4%) | 51 (4.2%) | .02 |
| Gastrostomy | <11 (3.5%) | 20 (2.2%) | 30 (2.5%) | .27 |
| Left heart catheterization | 94 (31.5%) | 434 (48.2%) | 528 (44.0%) | <.01 |
| Per cutaneous coronary intervention | <11 (3.5%) | <11 (<1.2%) | 15 (1.3%) | .44 |
| Hemodialysis | 0 | 85 (9.4%) | 85 (7.1%) | <.01 |
| Hepatorenal syndrome | <11 (3.5%) | 88 (9.8%) | 93 (7.8%) | <.01 |
| Hyponatremia | 40 (13.4%) | 179 (19.8%) | 219 (18.3%) | .01 |
| Septic shock | <11 (3.5%) | 69 (7.6%) | 74 (6.2%) | <.01 |
| Stroke | 15 (5.0%) | 90 (10.0% | 105 (8.7%) | <.01 |
| Vasopressin use | 0 | 45 (5.0%) | 45 (3.8%) | <.01 |
| Tracheostomy | <11 (3.5%) | 68 (7.5%) | 73 (6.1%) | <.01 |
| Red blood cells transfusion | 55 (18.4%) | 410 (45.5%) | 465 (38.7%) | <.01 |
| Ventilator | 49 (16.4%) | 219 (24.3%) | 268 (22.3%) | <.01 |
Abbreviations: ESLD, end-stage liver disease; SAVR, surgical aortic valve replacement; TAVR, transcatheter aortic valve replacement.
TABLE 3.
Outcomes and resource utilization after 1:2 propensity match in ESLD
| Variables | TAVR (n = 273) | SAVR (n = 404) | p value |
|---|---|---|---|
| Died at discharge | 15 (5.5%) | 78 (19.4%) | <.01 |
| Discharge disposition of surviving patients | |||
| Routine/self-care | 125 (48.3%) | 44 (13.5%) | <.01 |
| Another type of facility | 45 (17.4%) | 118 (36.3%) | |
| Home health care | 89 (34.4%) | 163 (50.2%) | |
| Resource utilization, mean (SD) | |||
| Length of stay, mean (SD), days | 9.0 (8.3) | 20.0 (16.1) | <.01 |
| Cost of hospitalization-mean (SD), $ | 248,989 (126,068) | 312,839 (255,856) | <.01 |
| Procedures during stay | |||
| Acute myocardial infraction | <11 (<2%) | 35 (8.7%) | <.01 |
| Atrial fibrillation | 84 (30.8%) | 210 (52.1%) | <.01 |
| Cardiac arrest | 5 (1.8%) | 20 (5.0%) | .04 |
| Cardiogenic shock | 20 (7.3%) | 20 (5.0%) | <.01 |
| Left heart catheterization | 58 (21.2%) | 120 (29.8%) | .01 |
| Per cutaneous coronary intervention | <11 (<2%) | <11 (<2%) | .5 |
| Hemodialysis | 0 | 50 (12.4%) | <.01 |
| Hepatorenal syndrome | <11 (<2%) | 29 (7.2%) | <.01 |
| Vasopressin use | 0 | 30 (7.4% | <.01 |
| Tracheostomy | <11 (<2%) | 29 (7.2%) | <.01 |
| Red blood cells transfusion | 55 (20.1%) | 185 (45.9%) | <.01 |
| Ventilator | 44 (16.1%) | 110 (27.2%) | <.01 |
Abbreviations: ESLD, end-stage liver disease; SAVR, surgical aortic valve replacement; TAVR, transcatheter aortic valve replacement.
3.2 |. Trends in in-hospital mortality in SAVR and TAVR
In-hospital mortality has decreased over the years (see Figure 2). The use of SAVR has gradually decreased over time. The proportion of TAVR in AVR has increased from almost zero in 2011 to 51.3% in 2015 (Figure 3a), noting that TAVR was commercially available in USA after August 2011. In-hospital mortality in SAVR group has decreased from 29.2% in 2005 to 26.3%. The in-hospital mortality in TAVR group has fluctuated over the years but has decreased rapidly since 2013, such that in-hospital mortality was zero in 2014 and 2015 from 27.3% in 2013. The overall in-hospital mortality in combined SAVR and TAVR has decreased from 29.2 to 12.8%. The number of AVR procedures has gone up especially since introduction of TAVR (Figure 3b).
FIGURE 2.
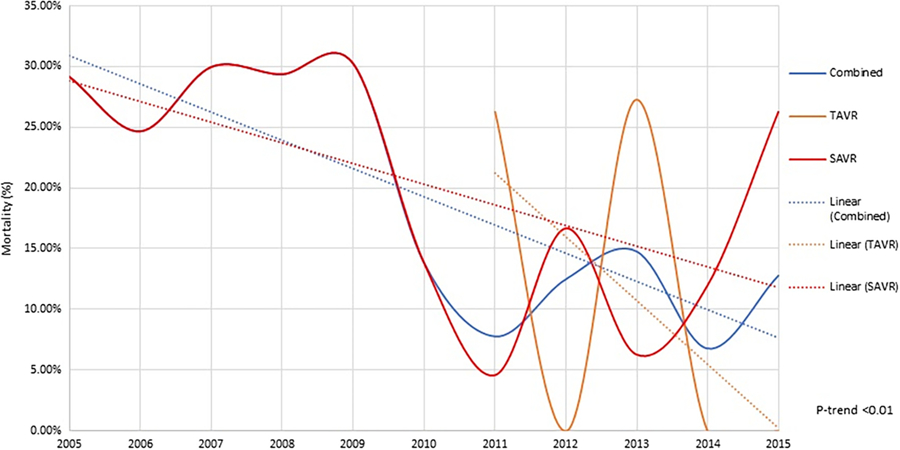
In-hospital mortality trends in patients of ESLD undergoing aortic valve replacement. ESLD, end-stage liver disease [Color figure can be viewed at wileyonlinelibrary.com]
FIGURE 3.
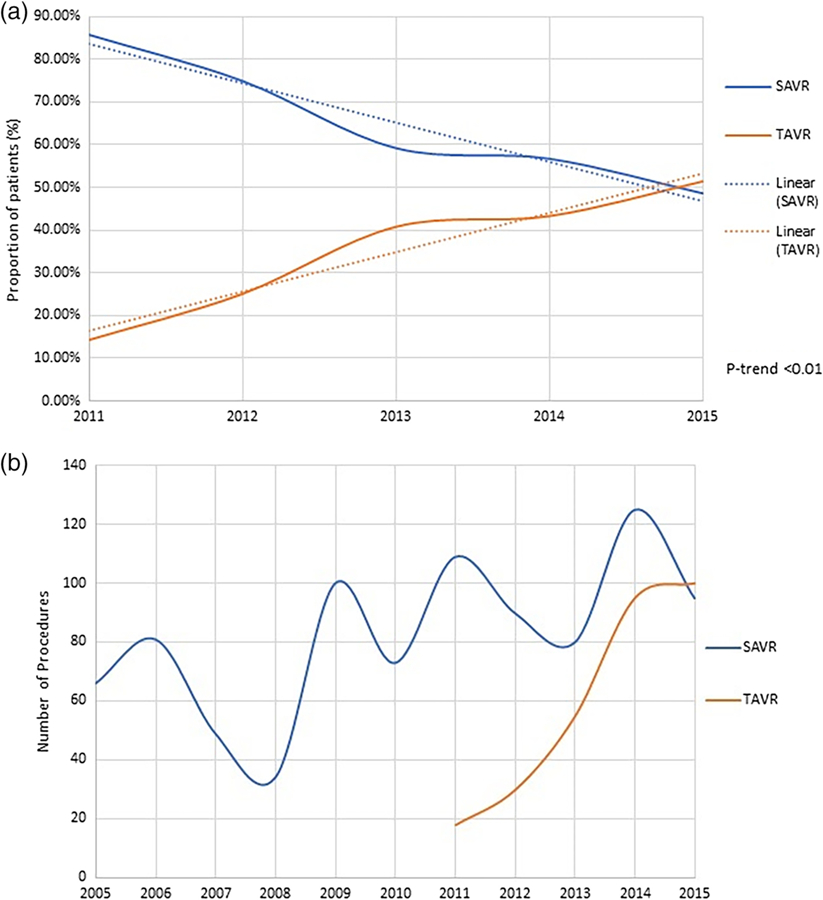
(a) Trends in aortic valve replacement in ESLD and(b) number of aortic valve replacements in ESLD. ESLD, end-stage liver disease [Color figure can be viewed at wileyonlinelibrary.com]
3.3 |. Trends in resource utilization and cost
There has been increase trend in mean cost for hospital stay over the years, this cost has increased in SAVR group (from 254,427$ in 2005 to 321,791$ in 2015) but decreased in TAVR group (from 313,116$ in 2012 to 228,096$ in 2015) (Figure 4a). Similarly, a large decrease in length of stay has been seen for TAVR group (14.5 days in 2011 to 5.4 days in 2015). In SAVR group the length of stay has initially decreased and then somewhat plateaued (24.9 days in 2005 to 17.5 days in 2011, and then to 17.1 days in 2015) (Figure 4b).
FIGURE 4.
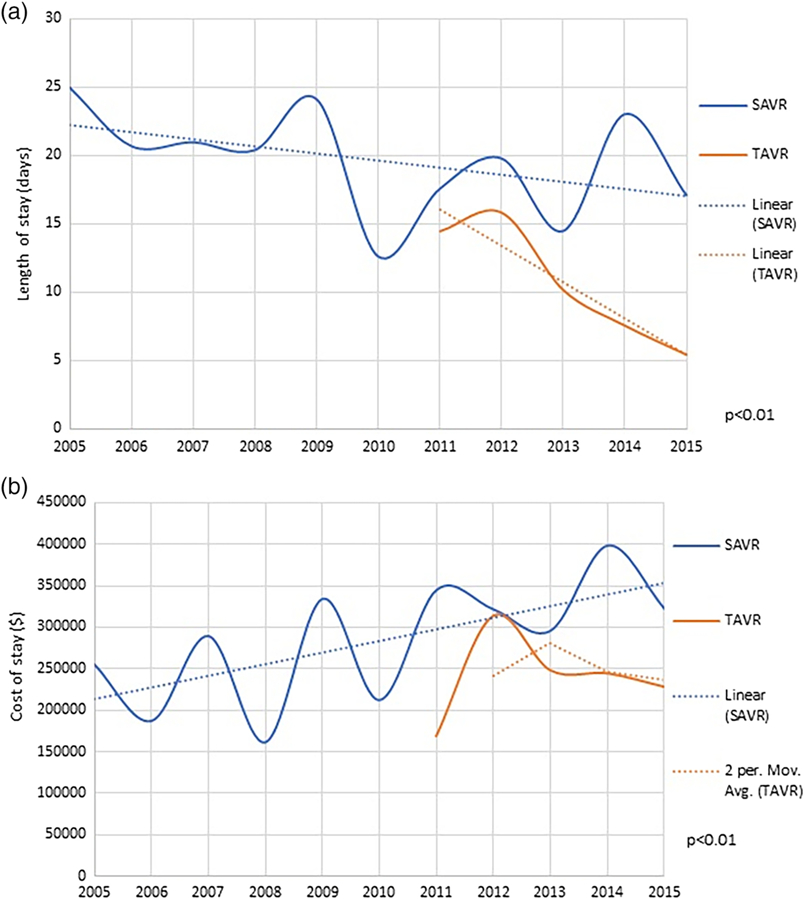
(a) Length of stay in aortic valve replacement and (b) cost of stay in aortic valve replacement [Color figure can be viewed at wileyonlinelibrary.com]
3.4 |. Predictor for in-hospital mortality in AVR
Predictors of in-hospital mortality for patients with ESLD undergoing AVR are shown in Figure 5. TAVR (OR: 0.42[95% CI: 0.20–0.87], p = .02) and recent year of procedure (OR: 0.87[95% CI: 0.81–0.93], p < .01) was associated with lower in-hospital mortality. While female gender (OR: 2.79 [95% CI: 1.72–4.55], p = .01), diabetes (OR: 1.92 [95% CI: 1.13–3.24], p = .02). Renal failure (OR: 3.74 [95% CI: 2.23–6.28], p < .01) were associated with high in-hospital mortality.
FIGURE 5.
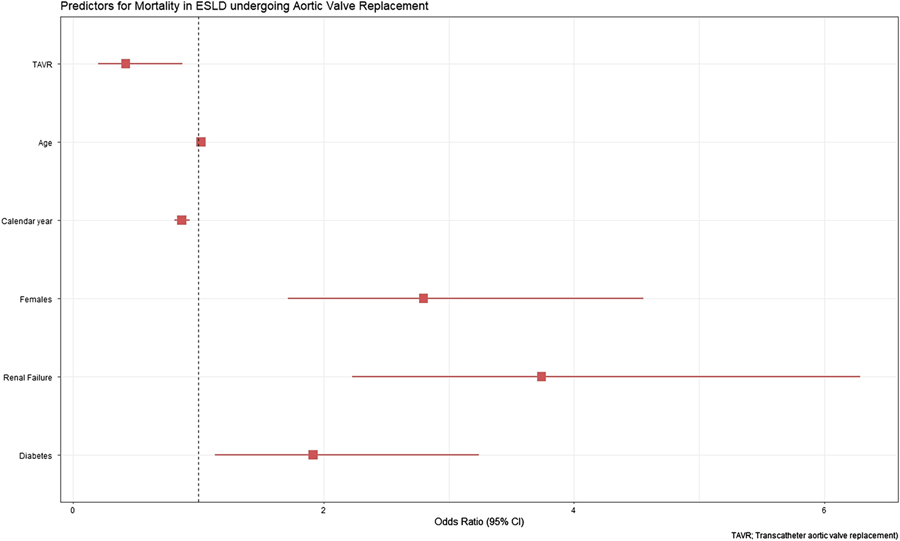
Predictors for in-hospital mortality in end-stage liver disease undergoing aortic valve replacement [Color figure can be viewed at wileyonlinelibrary.com]
4 |. DISCUSSION
In our analysis from the NIS including data till 2015, we found that utilization of TAVR as compared to SAVR in patients with aortic stenosis and ESLD has increased significantly. We found that from 2011 to 2015, utilization of TAVR increased from nonexistent to 50% of all AVR in this population. We also found that in propensity matched cohorts, in comparison to TAVR, patients undergoing SAVR had a 3.5 times higher in-hospital mortality. Similarly, length of stay was longer and cost was higher for patients undergoing SAVR as compared TAVR. There was a significant reduction in post procedure complications such as dialysis dependent renal failure, red blood cell transfusion, and myocardial infarction in TAVR group as compared to SAVR group.
ESLD has a major impact on post cardiac surgical morbidity and mortality; however, current STS predicted risk calculation may underestimate risk of aortic valve surgery in this population as it does not incorporate underlying liver disease in the calculator. Thielmann et al12 report the model for end-stage liver disease (MELD) score as a more reliable predictor of mortality in patients with liver disease undergoing cardiac surgery as compared to Child-Pugh and EuroSCORE. Thielmann et al13 have compared prediction tools in patients with chronic liver disease undergoing TAVR and found MELD-XI a more accurate predictor of mortality compared to STS, EuroSCORE, and EuroSCORE II.
In our study, several predictors of in-hospital mortality in ESLD patients undergoing AVR were identified including renal failure, diabetes, and female gender. Our results are consistent with previous studies5,7,8 that evaluated outcomes in cirrhotic patients, however, we are the first study to report these findings through a well-validated algorithm for ESLD9 and confirm significant complications with SAVR as compared to TAVR. Findings from Reference 6 reported no increase in risk of in-hospital mortality for cirrhotic patients undergoing TAVR, however, it lacked a comparative analysis with SAVR. Reference 7 analyzed NIS data from 2003 to 2014 and concluded that overtime there was a threefold increase in cirrhotic patients undergoing AVR. Their analysis showed a twofold increase in in-hospital mortality for SAVR as compared with TAVR, which is lower than our analysis though we included a larger sample size and validated data.
Although TAVR is now considered standard of care in patients with prohibitive surgical risk, patients with chronic liver disease have been under-represented in these high-risk randomized trials.14–18 In comparison with TAVR, SAVR was associated with increased procedural related morbidities. A recent pooled analysis19 of clinical outcomes found significantly lower odds of in-hospital, blood transfusion and periprocedural hospital length of stay, reduced cost of hospitalization, and reduced acute kidney injury in TAVR as compared to SAVR in patients with cirrhosis.
Several factors both intrinsic and extrinsic likely contributed to lower complications and morbidity in patients undergoing TAVR with underlying chronic liver disease including less invasive nature, early mobilization, reduced mechanical ventilation, and bleeding. This translates into a lower hospital length of stay, lower cost, as well as lower complication rate. Since patients with ESLD are at high-risk of postoperative complications due to several pathophysiological factors20 including coagulopathy, increased risk of infection, fluid and electrolyte shifts, with limited respiratory and renal reserve, they are very likely to benefit from less invasive option provided by TAVR.21–23 Therefore, in conclusion, our study supports TAVR is a safe option and a viable treatment options for aortic valve stenosis in patients with ESLD.
Our study has several limitations. NIS is an administrative claim-based database that uses ICD-9-CM codes for diagnosis that may be subject to error. Use of ICD insurance-based administrative data have validity issues, however, this study is based upon highly validated data.9 NIS collects data on in-patient discharges and each admission is registered as an independent event. NIS samples are not designed to follow patients longitudinally so long-term outcomes could not be assessed from the present data set. Like any retrospective database study association does not mean causation and conclusion should be drawn cautiously. We used propensity match analysis to equally match both the cohorts; however, residual confounding cannot be ruled out entirely with certainty. For example, we did not match for calendar year, given small data size selected variables of clinical significance were chosen for propensity matching. Similarly, ICD-9 codes do not differentiate between nature of implanted surgical aortic valve (metallic or biological). We did not include data from available NIS 2016 due to lack of validation of ICD-10 for ESLD. Also, various models that are currently utilized in prognostication of patients with ESLD such as MELD score and Child-Pugh score could not be computed from present dataset. ESLD is a known risk factor for worsened mortality in patients with infective endocarditis (IE). These patients are usually managed with SAVR provided they are candidates for such procedure. Increase mortality in SAVR group may in part be related to high prevalence of IE in this cohort. Unfortunately, data on IE were not readily available from NIS so we were unable to assess this important disease entity for our multivariate analysis.
5 |. CONCLUSION
In summary, TAVR appears to be a safe procedure in ESLD and is associated with lower in-hospital mortality, morbidity, length of stay, and health care cost as compared to SAVR.
Supplementary Material
Abbreviations:
- AHRQ
Agency for Healthcare Research and Quality
- AVR
aortic valve replacement
- ESLD
end-stage liver disease
- HCUP
Healthcare Cost and Utilization Project
- ICD-9-CM
International Classification of Diseases, Ninth revision, Clinical Modification
- NIS
National Inpatient Sample
- SAVR
surgical aortic valve replacement
- TAVR
transcatheter aortic valve replacement
Footnotes
CONFLICT OF INTERESTS
The authors declare no conflicts of interest.
SUPPORTING INFORMATION
Additional supporting information may be found online in the Supporting Information section at the end of this article.
REFERENCES
- 1.Nishimura RA, Otto CM, Bonow RO, et al. 2017 AHA/ACC focused update of the 2014 AHA/ACC guideline for the management of patients with valvular heart disease. J Am Coll Cardiol. 2017;135(25):e1159–e1195. 10.1161/CIR.0000000000000503. [DOI] [PubMed] [Google Scholar]
- 2.Popma JJ, Michael Deeb G, Yakubov SJ, et al. Transcatheter aortic-valve replacement with a self-expanding valve in low-risk patients. N Engl J Med. 2019;380(18):1706–1715. 10.1056/NEJMoa1816885. [DOI] [PubMed] [Google Scholar]
- 3.Mack MJ, Leon MB, Thourani VH, et al. Transcatheter aortic-valve replacement with a balloon-expandable valve in low-risk patients. N Engl J Med. 2019;380:1695–1705. 10.1056/NEJMoa1814052. [DOI] [PubMed] [Google Scholar]
- 4.Khan SU, Riaz H, Khan MU, et al. Meta-analysis of temporal and surgical risk dependent associations with outcomes after transcatheter versus surgical aortic valve implantation. Am J Cardiol. 2019;124:1608–1614. [DOI] [PMC free article] [PubMed] [Google Scholar]
- 5.Dhoble A, Bhise V, Nevah MI, et al. Outcomes and readmissions after transcatheter and surgical aortic valve replacement in patients with cirrhosis: a propensity matched analysis. Catheter Cardiovasc Interv. 2018;91:90–96. [DOI] [PubMed] [Google Scholar]
- 6.Yassin AS, Subahi A, Abubakar H, et al. Outcomes and effects of hepatic cirrhosis in patients who underwent transcatheter aortic valve implantation. Am J Cardiol. 2018;122:455–460. [DOI] [PubMed] [Google Scholar]
- 7.Alqahtani F, Aljohani S, Ghabra A, et al. Outcomes of transcatheter versus surgical aortic valve implantation for aortic stenosis in patients with hepatic cirrhosis. Am J Cardiol. 2017;120:1193–1197. [DOI] [PubMed] [Google Scholar]
- 8.Thakkar B, Patel A, Mohamad B, et al. Transcatheter aortic valve replacement versus surgical aortic valve replacement in patients with cirrhosis. Catheter Cardiovasc Interv. 2016;87:955–962. [DOI] [PubMed] [Google Scholar]
- 9.Goldberg D, Lewis JD, Halpern SD, Weiner M, Re VL. Validation of three coding algorithms to identify patients with end-stage liver disease in an administrative database. Pharmacoepidemiol Drug Saf. 2012;21(7):765–769. 10.1002/pds.3290. [DOI] [PMC free article] [PubMed] [Google Scholar]
- 10.National inpatient sample overview. https://www.hcup-us.ahrq.gov/nisoverview.jsp. Accessed November 2016.
- 11.Duseja A, Singh SP. Toward a better definition of acute-on-chronic liver failure. J Clin Exp Hepatol. 2017;7:262–265. https://www.ncbi.nlm.nih.gov/pubmed/28970714. [DOI] [PMC free article] [PubMed] [Google Scholar]
- 12.Thielmann M, Mechmet A, Neuhäuser M, et al. Risk prediction and outcomes in patients with liver cirrhosis undergoing open-heart surgery. Eur J Cardiothorac Surg. 2010;38(5):592–599. 10.1016/j.ejcts.2010.02.042. [DOI] [PubMed] [Google Scholar]
- 13.Arai T, Yashima F, Yanagisawa R, et al. Prognostic value of liver dysfunction assessed by MELD-XI scoring system in patients undergoing transcatheter aortic valve implantation. Int J Cardiol. 2017;228:648–653. 10.1016/j.ijcard.2016.11.096. [DOI] [PubMed] [Google Scholar]
- 14.Smith CR, Leon MB, Mack MJ, et al. Transcatheter versus surgical aortic-valve replacement in high-risk patients. N Engl J Med. 2011; 364:2187–2198. 10.1056/NEJMoa1103510. [DOI] [PubMed] [Google Scholar]
- 15.Adams DH, Popma JJ, Reardon MJ, et al. Transcatheter aortic-valve replacement with a self-expanding prosthesis. N Engl J Med. 2014; 370:1790–1798. 10.1056/NEJMoa1400590. [DOI] [PubMed] [Google Scholar]
- 16.Kodali SK, Williams MR, Smith CR, et al. Two-year outcomes after transcatheter or surgical aortic-valve replacement. N Engl J Med. 2012;366:1686–1695. 10.1056/NEJMoa1200384. [DOI] [PubMed] [Google Scholar]
- 17.Reardon MJ, Adams DH, Kleiman NS, et al. 2-year outcomes in patients undergoing surgical or self-expanding transcatheter aortic valve replacement. J Am Coll Cardiol. 2015;66(2):113–121. 10.1016/j.jacc.2015.05.017. [DOI] [PubMed] [Google Scholar]
- 18.Gleason TG, Reardon MJ, Popma JJ, et al. 5-year outcomes of self-expanding transcatheter versus surgical aortic valve replacement in high-risk patients. J Am Coll Cardiol. 2018;72:2687–2696. [DOI] [PubMed] [Google Scholar]
- 19.Ndunda P, Srinivasan S, Vindhyal M, Muutu T, Vukas R, Fanari Z. Clinical outcomes of transcatheter vs surgical aortic valve replacement in patients with chronic liver disease: a systematic review and metaanalysis. Ochsner J. 2019;19(3):241–247. 10.31486/toj.18.0178. [DOI] [PMC free article] [PubMed] [Google Scholar]
- 20.Greason KL, Mathew V, Wiesner RH, Suri RM, Rihal CS. Transcatheter aortic valve replacement in patients with cirrhosis. J Card Surg. 2013;28(5):492–495. 10.1111/jocs.12177. [DOI] [PubMed] [Google Scholar]
- 21.Indolfi C, Bartorelli AL, Berti S, et al. Updated clinical indications for transcatheter aortic valve implantation in patients with severe aortic stenosis: expert opinion of the Italian Society of Cardiology and GISE. J Cardiovasc Med. 2018;19(5):197–210. [DOI] [PubMed] [Google Scholar]
- 22.McLean KA, Drake TM, Sgrò A, et al. The effect of liver transplantation on patient-centred outcomes: a propensity-score matched analysis. Transpl Int. 2019;32:808–819. [DOI] [PubMed] [Google Scholar]
- 23.Wendt D, Kahlert P, Canbay A, et al. Impact of liver indicators on clinical outcome in patients undergoing transcatheter aortic valve implantation. Ann Thorac Surg. 2017;104:1357–1364. [DOI] [PubMed] [Google Scholar]
Associated Data
This section collects any data citations, data availability statements, or supplementary materials included in this article.