

Abstract
Objective:
Disturbed sleep is common among nurses and is associated with morbidity and mortality. Inflammation may be one mechanism linking sleep and disease. Yet most studies have relied on retrospective questionnaires to assess sleep, which fail to account for night-to-night fluctuations in sleep across time (i.e., intraindividual variability (IIV]). We examined prospective associations between mean and IIV in sleep with inflammation markers in nurses.
Methods:
Participants were 392 nurses (Mage = 39.54, 92% female; 23% night-shift working) who completed 7 days of sleep diaries and actigraphy to assess mean and IIV in total sleep time (TST) and sleep efficiency (SE). Blood was drawn on day 7 to assess inflammation markers C-reactive protein (CRP), interleukin-6 (IL-6), tumor necrosis factor-alpha (TNF-α), and interleukin-1 beta (IL-1β).
Results:
Greater intraindividual variability in TST — measured via both actigraphy and sleep diary — was associated with higher IL-6 (actigraphy β = 0.05, p = .046, sr2 = .01; diary β = 0.04, p = .030, sr2 = .01) and IL-1β (actigraphy β = 0.12, p = .008, sr2 = .02; diary β = 0.09, p = .025, sr2 = .01), but not CRP or TNF-α. IIV in actigraphy- and sleep diary-determined SE was not associated with inflammation biomarkers, nor were any mean sleep variables. Shift work did not moderate any associations.
Conclusions:
Nurses with more variable sleep durations had elevated levels of inflammation, which may increase risk for development of inflammatory-related diseases. Research should investigate how sleep regularization may change levels of inflammation and improve health.
Keywords: sleep, nurses, actigraphy, sleep diary, inflammation, intraindividual variability
Nurses are particularly likely to experience impaired sleep, given high levels of work stress and frequently rotating work/sleep schedules (1). Approximately 50–89% of nurses work some form of night shift per month (2–4), 29–57% meet criteria for insomnia (5 6), and 12% report short sleep duration (< 6 hr sleep/24 hr). Night shift work, insomnia, and short sleep are associated with increased risk for chronic diseases such as cardiovascular disease (7), depression (8), and Type II diabetes (9), as well as all-cause mortality (10).
Inflammation is one plausible biological mechanism linking impaired sleep with morbidity and mortality. During a night of insufficient sleep or poor quality sleep, the sympathetic nervous system releases norepinephrine and epinephrine, which up-regulate production of pro-inflammation biomarkers interleukin-6 (IL-6), C-reactive protein (CRP), interleukin-1 beta (IL-1β), and tumor necrosis factor alpha (TNF-α) (11 12). Previous studies have shown that night shift work, insomnia, and short sleep duration are associated with higher levels of these biomarkers (13 14). Higher levels of systemic inflammation are in turn prospectively implicated in the development of a number of common chronic diseases, including cardiovascular disease and depression (15–17).
The primary limitation of previous studies on nurses’ sleep and health is that typically sleep is measured with one or two survey questions or with retrospective questionnaires about recent or typical sleep (18 19). These types of measures are inadequate to assess the heterogeneity of sleep across different domains and across time. Sleep is composed of multiple domains, including efficiency, duration, and timing (20), each of which may be differentially associated with inflammation and health. Furthermore, no two nights of sleep are the same. Sleep fluctuates substantially from night-to-night (21), particularly in those who are engaged in rotating shift work (22). These within-person fluctuations are termed intraindividual variability (IIV) and can be quantified by computing the variation in sleep across time using prospective daily measures of sleep (e.g., sleep diaries or actigraphy).
Research has shown that greater intraindividual variability (IIV) in sleep is associated with disease beyond the influence of mean sleep (for a review, see Bei et al., 2016) (21). For example, greater IIV in sleep timing (i.e., bedtime and risetime), sleep duration, sleep quality, and sleep fragmentation have been associated with physical health conditions (e.g., diabetes, metabolic syndrome, chronic pain, obesity, heart conditions) (23–26), higher body mass index (BMI) and weight gain (23), insomnia (27), and greater depressive symptoms and negative mood (26 28 29). Greater IIV in sleep timing, sleep efficiency (i.e., total sleep time divided by time in bed ), and total sleep time are also associated with increased nocturnal norepinephrine (28 30), flatter cortisol diurnal slopes (31), higher levels of systemic inflammation (31–33), and greater allostatic load (31). Similarly, experimental circadian misalignment studies have demonstrated that greater variability in sleep timing and duration is associated with elevated inflammation (34). Yet no studies have examined associations between naturally-occurring IIV in sleep (measured both subjectively and objectively) as a prospective predictor of inflammation in nurses. Nurses are particularly likely to experience sleep disruptions (2 6) and are often the first line of care in most hospital settings. Therefore, it is critical to better understand associations between disruptions in their sleep and markers of health.
Furthermore, although greater IIV in sleep appears to be associated with poorer physiological function and health, it is likely this association is stronger among night shift working nurses. Night shift workers experience dramatic shifts in their sleep, and typically are in engaged in a 3 nights on/2 days off (or other similar) work schedule. This type of work/sleep schedule may result in a stronger “dose” of IIV in sleep than IIV in sleep due to other potential factors (e.g., fluctuations in mood, daily work tasks or family responsibilities, physical symptoms). Furthermore, epidemiological research and simulated shift work schedules in laboratory studies have shown that shift work is robustly associated with increases in inflammation (35–37). Together, this work suggests that night shift workers may have stronger positive associations between IIV in sleep and inflammation than day workers.
The primary aim of this study was to examine how both mean and IIV in multiple facets of sleep (sleep diary- and actigraphy-determined sleep efficiency and total sleep time) were associated with markers of inflammation (IL-6, CRP, IL-1β, and TNF-α) in a sample of nurses. On an exploratory basis, we examined recent night shift work status as a moderator of these associations, given the expectation night shift workers would have both more IIV in sleep and higher levels of inflammation.
Methods
Procedure
This study was part of a larger parent investigation on the effects of sleep on antibody response to the influenza vaccine that occurred from September 2018 to November 2018. Participants were recruited from two regional hospitals through nursing staff presentations, notification through employee email systems, and flyers that directed them to an initial online consent form. Four-hundred and sixty-one nurses provided online consent and were asked to complete initial online Qualtrics surveys to collect demographic information as well as retrospective self-report estimates of recent health. Participants were then invited to enroll in the main portion of the study in the early fall (i.e., the start of the influenza season), which included completion of in-person informed consent approximately one month later. At this time, participants were given instructions on completing the sleep diaries and wearing the actigraphy device, which they completed for the subsequent 7 days. On day 7, 392 participants reported to the hospital for a serum blood draw to assess inflammation biomarkers. All study procedures were approved by the Medical City Plano Institutional Review Board.
Participants
Inclusion criteria were: 1) not yet received the current season’s influenza vaccine, 2) between the ages of 18 and 65, and 3) registered nurses actively working at least part-time at one of two regional hospitals. Exclusion criteria were: 1) pregnant/nursing or planning to become pregnant or 2) having an egg allergy. Table 1 reports demographic characteristics for the entire sample and split by recent night shift work status. Generally, participants matched national demographics of nurses in the United States (38): The majority of participants were female (92%), white (78%), and non-Hispanic (89%). A significant portion of the sample also self-reported as Asian (10%) or African American (7%). A majority (63%) of the sample was currently married and most had children (65%). Twenty-three percent of the sample reported working at least one night shift during the 7-day daily diary period and were classified as recent night shift workers.
Table 1.
Participant Characteristics
| Whole sample (n = 392) |
Day workers (n = 302) |
Night workers (n = 90) |
|||
|---|---|---|---|---|---|
| M or n (SD or %) |
M or n (SD or %) |
M or n (SD or %) |
p-value |
SMD or Odds Ratio
(95%CI) |
|
| Age | 39.54 (11.15) | 40.63 (10.98) | 35.93 (10.98) | <0.001 | 0.427 |
| Sex (% female) | 360 (91.8%) | 281 (93.0%) | 79 (87.8%) | 0.11 | 1.05 (0.99–1.12) |
| BMI | 27.28 (5.84) | 27.27 (5.86) | 27.30 (5.79) | 0.96 | 0.006 |
| Race (% white) | 305 (77.8%) | 240 (79.5%) | 65 (72.2%) | 0.15 | 0.93 (0.84–1.03) |
| Ethnicity (% Hispanic/Latinx) | 42 (10.7%) | 26 (8.6%) | 16 (17.8%) | 0.015 | 1.10 (1.02–1.18) |
| Actigraphy Total Sleep Time iM (hrs.) | 6.72 (0.95) | 6.85 (0.84) | 6.28 (1.15) | <0.001 | 0.563 |
| Actigraphy Total Sleep Time iSD (hrs.) | 1.38 (0.70) | 1.20 (0.55) | 2.00 (0.81) | <0.001 | 1.146 |
| Actigraphy Sleep Efficiency iM (%) | 87.18 (5.13) | 87.64 (4.74) | 85.62 (6.03) | 0.001 | 0.372 |
| Actigraphy Sleep Efficiency iSD (%) | 4.97 (3.87) | 4.45 (3.27) | 6.78 (5.07) | <0.001 | 0.547 |
| Diary Total Sleep Time iM (hrs.) | 7.21 (0.92) | 7.34 (0.83) | 6.79 (1.06) | <0.001 | 0.579 |
| Diary Total Sleep Time iSD (hrs.) | 1.58 (0.79) | 1.39 (0.67) | 2.21 (0.82) | <0.001 | 1.106 |
| Diary Sleep Efficiency iM (%) | 90.90 (5.57) | 91.78 (5.03) | 87.96 (6.27) | <0.001 | 0.672 |
| Diary Sleep Efficiency iSD (%) | 6.19 (5.26) | 5.39 (4.23) | 8.87 (7.18) | <0.001 | 0.590 |
| Interleukin-6 (pg/mL) | 2.19 (2.15) | 2.09 (2.19) | 2.52 (1.99) | 0.10 | 0.204 |
| C-Reactive Protein (ng/mL) | 30.57 (25.28) | 31.43 (24.85) | 27.68 (26.62) | 0.22 | 0.146 |
| Interleukin-1β (pg/mL) | 0.08 (0.20) | 0.09 (0.22) | 0.05 (0.07) | 0.069 | 0.264 |
| Tumor necrosis factor-α (pg/mL) | 1.33 (1.97) | 1.37 (2.22) | 1.22 (0.63) | 0.53 | 0.092 |
Note. SMD = standardized mean difference. BMI = body mass index. iM = intraindividual mean. iSD = intraindividual standard deviation. All biomarkers represent raw (non-transformed) values.
Measures
Actigraphy-determined sleep.
For 7 days, participants were instructed to continuously wear an Actiwatch Spectrum Pro (Philips Respironics, Bend, OR, USA), a watch-like device used to infer objective sleep/wake patterns. Participants were asked to push an “event marker” button when they intended to go to sleep and when they got out of bed each morning. Actigraphy data were independently scored in Actiware software (Version 6.0.8) by two trained individuals using an in-lab protocol that systematically uses a combination of event markers, sleep diary data, activity data, and light levels. Discrepancies were resolved by a third person. Data were exported using default settings (10 immobile minutes for sleep onset and offset, medium wake threshold [40 activity counts]).
Sleep diary-determined sleep.
An electronic version of the Consensus Sleep Diary (39) was completed by participants each morning upon awakening using REDCap (40). Diaries were used to determine total sleep time (time in bed minus the sum of sleep onset latency, wake after sleep onset, and terminal wakefulness) and sleep efficiency (i.e., total sleep time divided by time in bed, multiplied by 100). These particular measures were chosen to comprehensively assess both sleep duration and sleep quality, two important facets of sleep relevant for health (20). For each sleep measure determined by both sleep diaries and actigraphy, the intraindividual mean (iM) and intraindividual standard deviation (iSD; i.e., measure of IIV) were calculated across the 7 days for each participant. (For example, if a participant reported a total sleep time of 6, 7, 8, 5, 7, 9, and 7 hours across the 7 days, their iM would be equal to 7 hours, and their iSD would be equal to 1.29 hours.)
Inflammation.
Serum blood was drawn by trained phlebotomists. All blood draws occurred between 7am and 12pm to control for circadian rhythmicity of inflammation. Samples sat for 60 minutes to clot and then were centrifuged at 3000 rpms for 30 minutes and aliquoted into cryovials. Samples were temporarily frozen on dry ice and then frozen at −80°C until assaying. All inflammation samples were assayed using high sensitivity enzyme-linked immunosorbent assays (ELISA) from R&D Systems, Inc. (Minneapolis, MN) within one year following collection. The lower limit of detection (LLD) for CRP was 0.010 ng/mL, 0.033 pg/mL for IL-1β, 0.022 pg/mL for TNF-α, and 0.039 pg/mL for IL-6. All IL-6 and TNF-α samples were within detectable limits. For IL-1β, 123 samples (31%) were below detectable limits. The standard curve revealed these were not missing data but were instead indicative of very low values; therefore, in alignment with previous research (41 42), half the lower limit of detection was imputed (i.e., 0. 0165ng/mL). For CRP, one sample was outside of detectable limits; therefore, half the lower limit of detection was imputed (i.e., 0.005 ng/mL). Intra-assay coefficients of variation (CVs) were 1.60% for CRP, 2.29% for IL-1β, 2.45% for TNF-α, and 3.26% for IL-6. Inter-assay CVs were 6.73% for CRP, 6.04% for IL-1β, 5.06% for TNF-α, and 7.21% for IL-6.
Recent night shift work status.
In the daily sleep diaries, participants reported whether they worked a night shift the previous day (“Did you have to be at work past 9PM OR before 6AM?”). Those who said “yes” to this question at least once during the 7 days were classified as a recent night shift worker. Those who answered “no” to this question across all 7 days were classified as a day worker.
Baseline covariates.
At baseline, participants reported on their age, sex (0 = female, 1 = male), race/ethnicity (0 = any other race, 1 = white), height, weight, and health behaviors. Body mass index (BMI) was calculated based participants’ self-reported height and weight according to CDC guidelines (43).
Analysis Plan
All data were screened for missingness, outliers, and violation of assumptions (e.g., excessive skew). As expected, inflammation biomarkers were not normally distributed (CRP skewness before half the LLD was imputed = 0.93, kurtosis = 3.22; IL-6 skewness = 3.47, kurtosis = 18.04; IL-1β skewness before half the LLD was imputed = 7.16, kurtosis = 63.43; TNF-α skewness = 12.76, kurtosis = 179.95). Therefore, as previously described, for IL-1β and CRP, values were imputed for samples below the LLD, and then all biomarkers were either square root or log-10 transformed to resolve non-normality for each biomarker (square-root CRP skewness after half the LLD was imputed = 0.21, kurtosis = 2.15; log-10 IL-6 skewness = 0.39, kurtosis = 3.32; log-10 IL-1β skewness after half the LLD was imputed = 0.35, kurtosis = 2.86; log-10 TNF-α skewness = 0.38, kurtosis = 13.68).
Analyses were run in R, an open source statistical program (44). Regression analyses were run using R base packages and the package apaTables (45), and all analyses covaried for age, sex, BMI, and shift work. Controlling for time of the day the blood samples were collected did not change the significance or pattern of results; therefore, this variable was not included as a covariate. Semi-partial correlations squared (sr2; i.e. the unique contribution to the total variance in the DV explained by each IV, after accounting for the variance explained by the other IVs) were used as a measure of effect size. Cohen’s (1988) heuristics (46) were used as determination of sr2, where a small sr2 = 0.02, a medium sr2 = 0.13, and a large sr2 = 0.26. A power analysis revealed that for a multiple linear regression with 8 variables in the model, a sample size of N = 392 (α = 0.05) yielded 81% power to detect a small to medium effect size (f2 = 0.04).
Results
Descriptive Results
Average sleep diary compliance was 83% (M = 5.79, SD = 2.52 out of 7 possible sleep diaries completed per participant). Compared to day workers, night shift workers were more likely to be younger and Hispanic/Latinx (Table 1). Night shift workers also had shorter diary- and actigraphy-determined mean total sleep time and lower sleep efficiency, as well as greater variability in diary- and actigraphy-determined total sleep time and sleep efficiency (Table 1). Approximately 24.4% of the 90 night shift workers (n = 22) had been engaged in some type of night shift work for < 1 year; 38.9% (n = 35) for 1 to 5 years; and 36.7% (n = 33) for 5 to 30 years. Night shift workers worked an average of 3.11 night shifts across the 7 days (SD = 1.44; range = 1–7; median = 3). There were no significant correlations between total number of night shifts in the past 7 days and inflammation biomarkers among shift workers (IL-6: r = 0.19, p = .075; IL-1β: r = −0.002, p = .99; TNF-α: r = −0.07, p = .52; CRP: r = .09, p = .39). Shift workers reported working an average of 0.75 (SD = 1.24) successive night shifts before the morning of the blood draw. There were no significant correlations between successive number of night shifts worked before the blood draw and inflammation biomarkers among shift workers (IL-6: r = 0.04, p = .72; IL-1β: r = 0.01, p = .90; TNF-α: r = −0.16, p = .15; CRP: r = −0.07, p = .49). Bivariate correlations between all study variables for the entire sample are presented in Figure 1, and bivariate correlations presented separately for shift and day workers can be found in Figure 2. In general, inflammation biomarkers were more strongly associated with sleep parameters in shift workers compared to day workers (Figure 2).
Figure 1. Bivariate Correlations for Entire Sample.
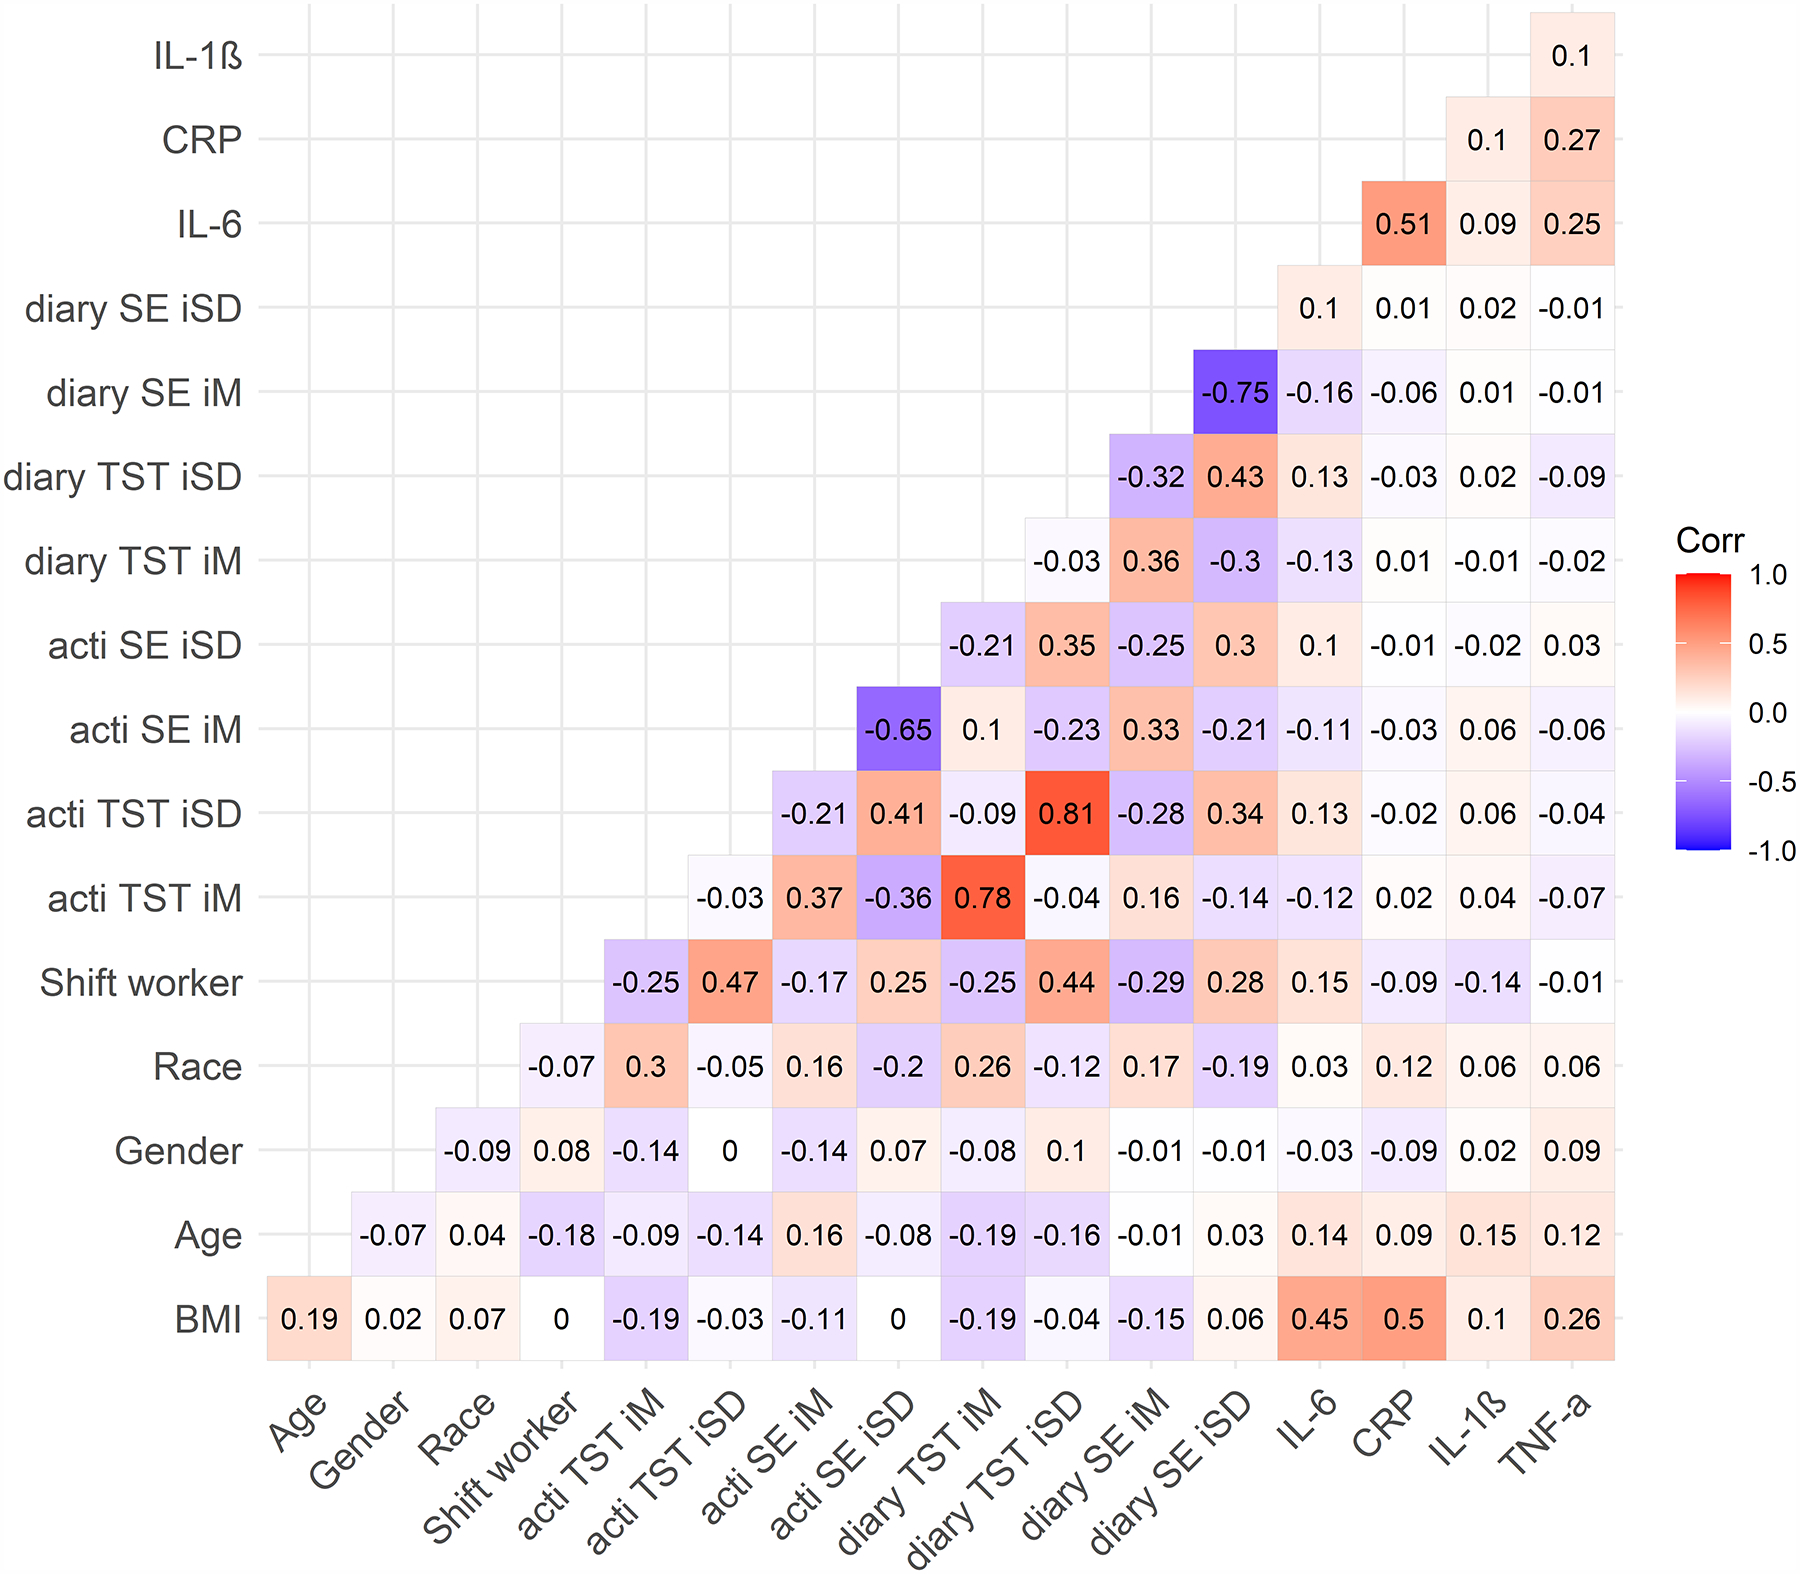
Note. N = 392. Numbers represent Pearson’s correlation coefficients. BMI = body mass index. TST = total sleep time. SE = sleep efficiency. acti = actigraphy. diary = sleep diary. iM = intraindividual mean. iSD = intraindividual standard deviation. Race (any other race = 0, white race = 1). Shift worker (based on sleep diary; day worker = 0, night shift worker = 1). Sex (0 = female, 1 = male). CRP = C-reactive protein (square-root transformed). IL-1β = interleukin-1 beta (log-10 transformed). IL-6 = interleukin-6 (log-10 transformed). TNF-α = tumor necrosis factor-alpha (log-10 transformed).
Figure 2. Bivariate Correlations by Shift Work Status.
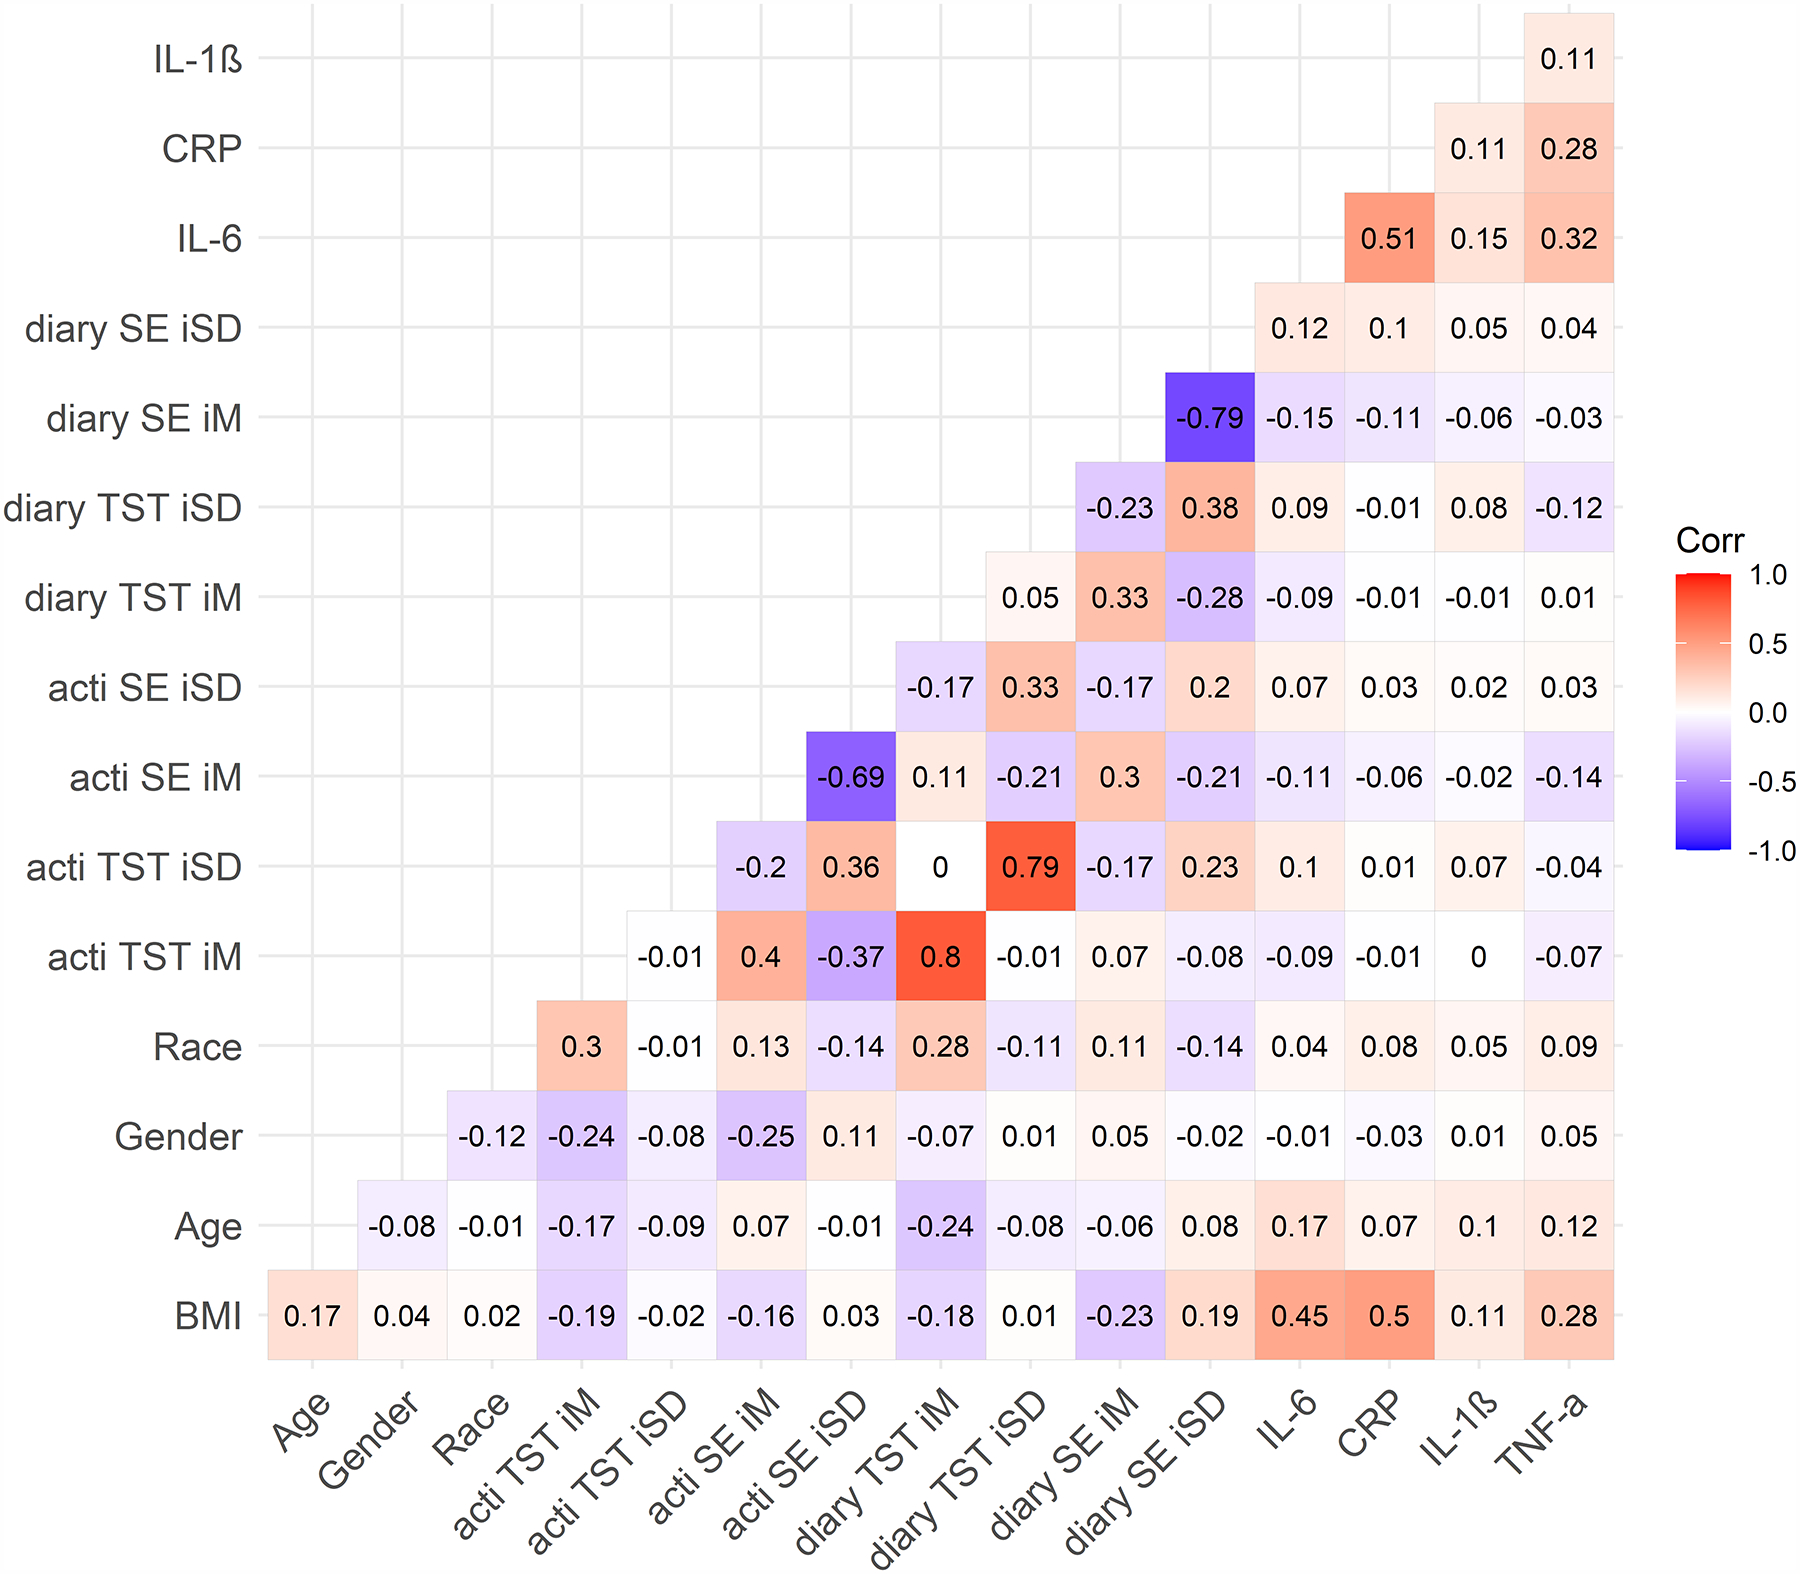
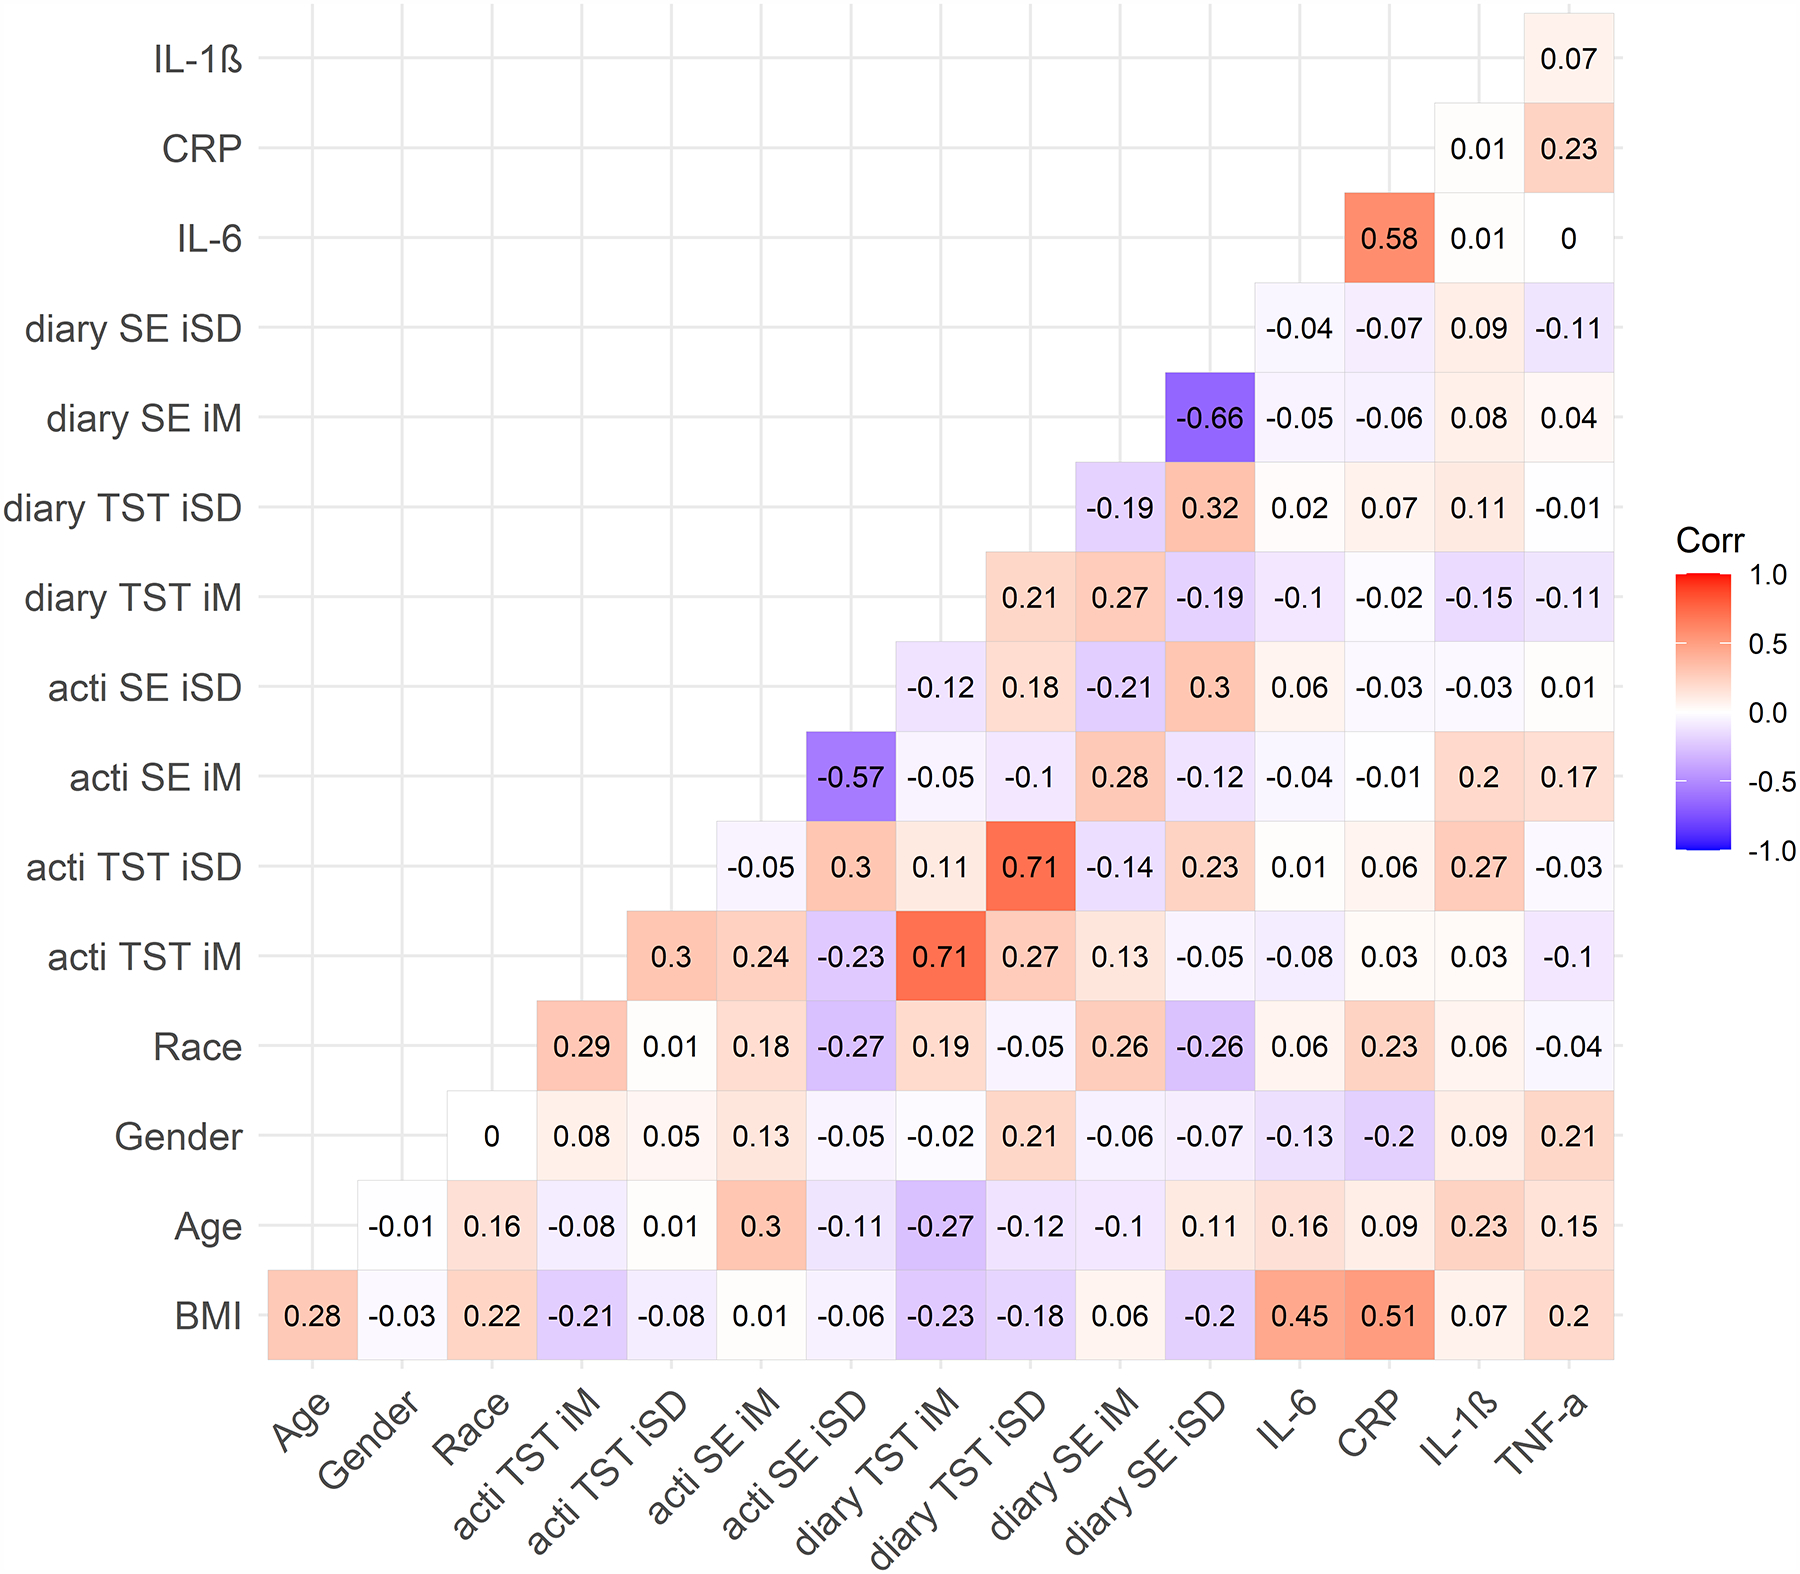
A) Day workers; B) shift workers.
Note. Numbers represent Pearson’s correlation coefficients. Day workers (N = 302, top figure), Night shift workers (N = 90, bottom figure). BMI = body mass index. TST = total sleep time. SE = sleep efficiency. acti = actigraphy. diary = sleep diary. iM = intraindividual mean. iSD = intraindividual standard deviation. Race (any other race = 0, white race = 1). Sex (0 = female, 1 = male). CRP = C-reactive protein (square-root transformed). IL-1β = interleukin-1 beta (log-10 transformed). IL-6 = interleukin-6 (log-10 transformed). TNF-α = tumor necrosis factor-alpha (log-10 transformed).
Intraindividual Mean Sleep and Inflammation
Actigraphy.
Neither intraindividual mean actigraphy-determined total sleep time or sleep efficiency were associated with CRP, IL-6, IL-1β, or TNF-α (Table 2), controlling for age, sex, BMI, and shift work.
Table 2.
Unstandardized Estimates of the Associations between Actigraphy-Determined Total Sleep Time and Sleep Efficiency with Plasma Inflammation Biomarkers CRP, IL-6, TNF-α and IL-1β
| CRP (ng/mL) | IL-6 (pg/mL) | TNF-α (pg/mL) | IL-1β (pg/mL) | |||||||||
|---|---|---|---|---|---|---|---|---|---|---|---|---|
| Predictor | b |
b 95% CI [LL, UL] |
sr2 | b |
b 95% CI [LL, UL] |
sr2 | b |
b 95% CI [LL, UL] |
sr2 | b |
b 95% CI [LL, UL] |
sr2 |
| (Intercept) | −1.96 | [−4.21, 0.30] | −0.59** | [−0.90, −0.28] | −0.25* | [−0.49, −0.01] | −2.20** | [−2.80, −1.61] | ||||
| TST iM | 0.21 | [−0.03, 0.45] | .01 | −0.00 | [−0.04, 0.03] | .00 | −0.00 | [−0.03, 0.02] | .00 | 0.03 | [−0.04, 0.09] | .00 |
| TST iSD | 0.13 | [−0.21, 0.48] | .00 | 0.05* | [0.00, 0.09] | .01 | −0.01 | [−0.04, 0.03] | .00 | 0.12** | [0.03, 0.21] | .02 |
| Shift work | −0.52 | [−1.12, 0.07] | .01 | 0.10* | [0.02, 0.18] | .01 | 0.00 | [−0.06, 0.06] | .00 | −0.22** | [−0.37, −0.06] | .02 |
| Age | −0.01 | [−0.03, 0.01] | .00 | 0.00 | [−0.00, 0.01] | .01 | 0.00 | [−0.00, 0.00] | .01 | 0.01* | [0.00, 0.01] | .02 |
| Sex | −0.68 | [−1.45, 0.08] | .01 | −0.05 | [−0.15, 0.06] | .00 | 0.07 | [−0.01, 0.15] | .01 | 0.10 | [−0.10, 0.30] | .00 |
| BMI | 0.21** | [0.17, 0.25] | .25 | 0.02** | [0.02, 0.03] | .18 | 0.01** | [0.01, 0.01] | .05 | 0.01 | [−0.00, 0.02] | .00 |
| (Intercept) | −1.78 | [−4.46, 0.89] | −0.64** | [−1.00, −0.28] | −0.26 | [−0.54, 0.03] | −2.28** | [−2.98, −1.57] | ||||
| TST iM | 0.20 | [−0.10, 0.49] | .00 | 0.00 | [−0.04, 0.04] | .00 | −0.00 | [−0.03, 0.03] | .00 | 0.04 | [−0.04, 0.12] | .00 |
| TST iSD | −0.91 | [−4.30, 2.49] | .00 | 0.18 | [−0.28, 0.65] | .00 | 0.03 | [−0.33, 0.39] | .00 | 0.01 | [−0.88, 0.90] | .00 |
| Shift work | 0.10 | [−0.34, 0.54] | .00 | 0.06* | [0.01, 0.12] | .01 | −0.01 | [−0.05, 0.04] | .00 | 0.10 | [−0.02, 0.21] | .01 |
| Age | −0.01 | [−0.03, 0.01] | .00 | 0.00 | [−0.00, 0.01] | .01 | 0.00 | [−0.00, 0.00] | .01 | 0.01* | [0.00, 0.01] | .02 |
| Sex | −0.70 | [−1.48, 0.08] | .01 | −0.04 | [−0.15, 0.07] | .00 | 0.07 | [−0.01, 0.15] | .01 | 0.11 | [−0.10, 0.31] | .00 |
| BMI | 0.21** | [0.17, 0.25] | .25 | 0.02** | [0.02, 0.03] | .18 | 0.01** | [0.01, 0.01] | .05 | 0.01 | [−0.00, 0.02] | .00 |
| Shift × TST iM | 0.04 | [−0.48, 0.56] | .00 | −0.00 | [−0.07, 0.07] | .00 | −0.00 | [−0.06, 0.05] | .00 | −0.06 | [−0.20, 0.08] | .00 |
| Shift × TST iSD | 0.08 | [−0.65, 0.80] | .00 | −0.05 | [−0.15, 0.05] | .00 | 0.00 | [−0.08, 0.08] | .00 | 0.08 | [−0.11, 0.28] | .00 |
| (Intercept) | 0.02 | [−5.45, 5.49] | −0.58 | [−1.34, 0.18] | 0.07 | [−0.52, 0.66] | −2.12** | [−3.59, −0.64] | ||||
| SE iM | −0.00 | [−0.06, 0.06] | .00 | 0.00 | [−0.01, 0.01] | .00 | −0.00 | [−0.01, 0.00] | .00 | 0.00 | [−0.01, 0.02] | .00 |
| SE iSD | 0.01 | [−0.07, 0.08] | .00 | 0.01 | [−0.01, 0.02] | .00 | −0.00 | [−0.01, 0.01] | .00 | 0.00 | [−0.02, 0.03] | .00 |
| Shift work | −0.56* | [−1.09, −0.04] | .01 | 0.13** | [0.05, 0.20] | .03 | −0.00 | [−0.06, 0.05] | .00 | −0.14* | [−0.28, −0.00] | .01 |
| Age | −0.01 | [−0.03, 0.01] | .00 | 0.00 | [−0.00, 0.01] | .01 | 0.00 | [−0.00, 0.00] | .01 | 0.01* | [0.00, 0.01] | .01 |
| Sex | −0.80* | [−1.57, −0.03] | .01 | −0.05 | [−0.16, 0.05] | .00 | 0.06 | [−0.02, 0.14] | .01 | 0.08 | [−0.12, 0.29] | .00 |
| BMI | 0.21** | [0.17, 0.24] | .23 | 0.02** | [0.02, 0.03] | .17 | 0.01** | [0.00, 0.01] | .05 | 0.01 | [−0.00, 0.02] | .00 |
| (Intercept) | −1.58 | [−8.39, 5.22] | −0.46 | [−1.38, 0.47] | 0.39 | [−0.33, 1.11] | −1.83* | [−3.63, −0.04] | ||||
| SE iM | 0.02 | [−0.06, 0.09] | .00 | −0.00 | [−0.01, 0.01] | .00 | −0.01 | [−0.01, 0.00] | .01 | 0.00 | [−0.02, 0.02] | .00 |
| SE iSD | 3.35 | [−7.67, 14.36] | .00 | −0.23 | [−1.77, 1.32] | .00 | −0.94 | [−2.13, 0.26] | .01 | −1.00 | [−4.01, 2.00] | .00 |
| Shift work | 0.03 | [−0.07, 0.14] | .00 | 0.00 | [−0.01, 0.02] | .00 | −0.01 | [−0.02, 0.00] | .00 | 0.00 | [−0.02, 0.03] | .00 |
| Age | −0.01 | [−0.03, 0.01] | .00 | 0.00 | [−0.00, 0.01] | .01 | 0.00 | [−0.00, 0.00] | .01 | 0.01* | [0.00, 0.01] | .01 |
| Sex | −0.77 | [−1.55, 0.02] | .01 | −0.06 | [−0.16, 0.05] | .00 | 0.05 | [−0.03, 0.13] | .00 | 0.07 | [−0.14, 0.28] | .00 |
| BMI | 0.21** | [0.17, 0.24] | .24 | 0.02** | [0.02, 0.03] | .17 | 0.01** | [0.00, 0.01] | .05 | 0.01 | [−0.00, 0.02] | .00 |
| Shift × SE iM | −0.04 | [−0.16, 0.08] | .00 | 0.00 | [−0.01, 0.02] | .00 | 0.01 | [−0.00, 0.02] | .01 | 0.01 | [−0.02, 0.04] | .00 |
| Shift × SE iSD | −0.06 | [−0.21, 0.09] | .00 | 0.00 | [−0.02, 0.03] | .00 | 0.01 | [−0.01, 0.03] | .00 | 0.00 | [−0.04, 0.05] | .00 |
Note.
p < .05,
p < .01.
sr2 = semi-partial correlation coefficient squared (i.e., effect size). BMI = body mass index. TST = total sleep time. SE = sleep efficiency. iM = intraindividual mean. iSD = intraindividual standard deviation. Shift worker (based on sleep diary/actigraphy; day worker = 0, night shift worker = 1). Sex (0 = female, 1 = male). CRP = C-reactive protein (square-root transformed). IL-1β = interleukin-1 beta (log-10 transformed). IL-6 = interleukin-6 (log-10 transformed). TNF-α = tumor necrosis factor-alpha (log-10 transformed). Shift × sleep parameter indicates the interaction between shift worker status and each sleep parameter.
Sleep diary.
Neither intraindividual mean sleep diary-determined total sleep time or sleep efficiency were associated with CRP, IL-6, IL-1β, or TNF-α (Table 3), controlling for age, sex, BMI, and shift work.
Table 3.
Unstandardized Estimates of the Associations between Sleep Diary-Determined Total Sleep Time and Sleep Efficiency with Plasma Inflammation Biomarkers CRP, IL-6, TNF-α and IL-1β
| CRP (ng/mL) | IL-6 (pg/mL) | TNF-α (pg/mL) | IL-1β (pg/mL) | |||||||||
|---|---|---|---|---|---|---|---|---|---|---|---|---|
| Predictor | b |
b 95% CI [LL, UL] |
sr2 | b |
b 95% CI [LL, UL] |
sr2 | b |
b 95% CI [LL, UL] |
sr2 | b |
b 95% CI [LL, UL] |
sr2 |
| (Intercept) | −1.90 | [−4.34, 0.54] | −0.68** | [−1.01, −0.34] | −0.40** | [−0.66, −0.14] | −1.93** | [−2.58, −1.28] | ||||
| TST iM | 0.19 | [−0.06, 0.43] | .00 | 0.01 | [−0.03, 0.04] | .00 | 0.02 | [−0.01, 0.05] | .01 | −0.01 | [−0.08, 0.06] | .00 |
| TST iSD | 0.11 | [−0.18, 0.40] | .00 | 0.04* | [0.00, 0.08] | .01 | −0.03 | [−0.06, 0.00] | .01 | 0.09* | [0.01, 0.17] | .01 |
| Shift work | −0.47 | [−1.04, 0.10] | .01 | 0.10* | [0.02, 0.18] | .01 | 0.03 | [−0.03, 0.09] | .00 | −0.24** | [−0.39, −0.09] | .02 |
| Age | −0.00 | [−0.02, 0.02] | .00 | 0.00* | [0.00, 0.01] | .01 | 0.00 | [−0.00, 0.00] | .01 | 0.01* | [0.00, 0.01] | .01 |
| Sex | −0.75* | [−1.50, −0.01] | .01 | −0.06 | [−0.16, 0.05] | .00 | 0.09* | [0.01, 0.16] | .01 | 0.06 | [−0.14, 0.25] | .00 |
| BMI | 0.21** | [0.17, 0.24] | .25 | 0.02** | [0.02, 0.03] | .18 | 0.01** | [0.01, 0.01] | .06 | 0.01 | [−0.00, 0.02] | .01 |
| (Intercept) | −1.94 | [−4.68, 0.79] | −0.69** | [−1.06, −0.31] | −0.47** | [−0.76, −0.18] | −2.19** | [−2.92, −1.47] | ||||
| TST iM | 0.22 | [−0.07, 0.51] | .00 | 0.01 | [−0.03, 0.05] | .00 | 0.03 | [−0.00, 0.06] | .01 | 0.02 | [−0.05, 0.10] | .00 |
| TST iSD | −0.54 | [−4.14, 3.06] | .00 | 0.13 | [−0.36, 0.63] | .00 | 0.21 | [−0.17, 0.59] | .00 | 0.50 | [−0.46, 1.45] | .00 |
| Shift work | −0.05 | [−0.40, 0.30] | .00 | 0.04 | [−0.00, 0.09] | .01 | −0.04* | [−0.08, −0.00] | .01 | 0.09 | [−0.00, 0.18] | .01 |
| Age | −0.00 | [−0.02, 0.02] | .00 | 0.00* | [0.00, 0.01] | .01 | 0.00 | [−0.00, 0.00] | .01 | 0.01* | [0.00, 0.01] | .02 |
| Sex | −0.82* | [−1.57, −0.07] | .01 | −0.06 | [−0.16, 0.05] | .00 | 0.08* | [0.00, 0.16] | .01 | 0.06 | [−0.14, 0.26] | .00 |
| BMI | 0.21** | [0.17, 0.25] | .25 | 0.02** | [0.02, 0.03] | .18 | 0.01** | [0.01, 0.01] | .06 | 0.01 | [−0.00, 0.02] | .01 |
| Shift × TST iM | −0.15 | [−0.66, 0.36] | .00 | −0.01 | [−0.08, 0.06] | .00 | −0.04 | [−0.09, 0.02] | .00 | −0.11 | [−0.25, 0.02] | .01 |
| Shift × TST iSD | 0.56 | [−0.08, 1.20] | .01 | 0.00 | [−0.09, 0.09] | .00 | 0.05 | [−0.02, 0.11] | .00 | 0.01 | [−0.16, 0.19] | .00 |
| (Intercept) | 1.88 | [−4.14, 7.91] | −0.27 | [−1.11, 0.56] | −0.55 | [−1.20, 0.10] | −2.79** | [−4.41, −1.17] | ||||
| SE iM | −0.02 | [−0.08, 0.04] | .00 | −0.00 | [−0.01, 0.01] | .00 | 0.00 | [−0.00, 0.01] | .00 | 0.01 | [−0.01, 0.03] | .00 |
| SE iSD | −0.01 | [−0.07, 0.05] | .00 | −0.00 | [−0.01, 0.01] | .00 | 0.00 | [−0.01, 0.01] | .00 | 0.02 | [−0.00, 0.03] | .01 |
| Shift work | −0.55* | [−1.08, −0.03] | .01 | 0.13** | [0.06, 0.20] | .02 | 0.01 | [−0.05, 0.06] | .00 | −0.19** | [−0.32, −0.05] | .02 |
| Age | −0.01 | [−0.03, 0.01] | .00 | 0.00 | [−0.00, 0.01] | .01 | 0.00 | [−0.00, 0.00] | .01 | 0.01* | [0.00, 0.01] | .01 |
| Sex | −0.77* | [−1.52, −0.03] | .01 | −0.05 | [−0.15, 0.05] | .00 | 0.07 | [−0.00, 0.15] | .01 | 0.08 | [−0.12, 0.28] | .00 |
| BMI | 0.20** | [0.16, 0.24] | .23 | 0.02** | [0.02, 0.03] | .17 | 0.01** | [0.01, 0.01] | .06 | 0.01 | [−0.00, 0.02] | .01 |
| (Intercept) | −0.57 | [−8.80, 7.65] | −0.35 | [−1.47, 0.78] | −0.76 | [−1.63, 0.11] | −1.80 | [−3.98, 0.37] | ||||
| SE iM | 0.01 | [−0.08, 0.09] | .00 | −0.00 | [−0.01, 0.01] | .00 | 0.00 | [−0.00, 0.01] | .00 | −0.00 | [−0.02, 0.02] | .00 |
| SE iSD | 5.04 | [−6.75, 16.83] | .00 | 0.34 | [−1.29, 1.96] | .00 | 0.44 | [−0.82, 1.70] | .00 | −2.48 | [−5.62, 0.66] | .01 |
| Shift work | 0.01 | [−0.09, 0.11] | .00 | −0.00 | [−0.02, 0.01] | .00 | 0.00 | [−0.01, 0.01] | .00 | 0.01 | [−0.02, 0.03] | .00 |
| Age | −0.01 | [−0.03, 0.01] | .00 | 0.00 | [−0.00, 0.01] | .01 | 0.00 | [−0.00, 0.00] | .01 | 0.01* | [0.00, 0.01] | .01 |
| Sex | −0.81* | [−1.56, −0.06] | .01 | −0.05 | [−0.15, 0.05] | .00 | 0.07 | [−0.01, 0.15] | .01 | 0.10 | [−0.10, 0.29] | .00 |
| BMI | 0.20** | [0.16, 0.24] | .23 | 0.02** | [0.02, 0.03] | .17 | 0.01** | [0.01, 0.01] | .06 | 0.01 | [−0.00, 0.02] | .01 |
| Shift × SE iM | −0.06 | [−0.18, 0.06] | .00 | −0.00 | [−0.02, 0.01] | .00 | −0.00 | [−0.02, 0.01] | .00 | 0.02 | [−0.01, 0.06] | .01 |
| Shift × SE iSD | −0.04 | [−0.16, 0.09] | .00 | 0.00 | [−0.02, 0.02] | .00 | −0.00 | [−0.02, 0.01] | .00 | 0.01 | [−0.02, 0.05] | .00 |
Note.
p < .05,
p < .01.
sr2 = semi-partial correlation coefficient squared (i.e., effect size). BMI = body mass index. TST = total sleep time. SE = sleep efficiency. iM = intraindividual mean. iSD = intraindividual standard deviation. Shift worker (based on sleep diary/actigraphy; day worker = 0, night shift worker = 1). Sex (0 = female, 1 = male). CRP = C-reactive protein (square-root transformed). IL-1β = interleukin-1 beta (log-10 transformed). IL-6 = interleukin-6 (log-10 transformed). TNF-α = tumor necrosis factor-alpha (log-10 transformed). Shift × sleep parameter indicates the interaction between shift worker status and each sleep parameter.
Intraindividual Variability in Sleep and Inflammation
Actigraphy.
Greater intraindividual variability in actigraphy-determined total sleep time was associated with higher IL-6 (β = .05, 95%CI [0.00, 0.09], sr2 = .01; Table 2 and Figure 3) and IL-1β (β = .12, 95%CI [0.03, 0.21], sr2 = .02; Table 2 and Figure 4), but not CRP or TNF-α (Table 2), controlling for age, sex, BMI, and shift work. Controlling for the same covariates, intraindividual variability in actigraphy-determined sleep efficiency was not associated with either CRP, IL-6, IL-1β, or TNF-α (Table 2).
Figure 3. Associations between Actigraphy- and Sleep Diary-Determined Total Sleep Time with Plasma Interleukin-6 (pg/mL).
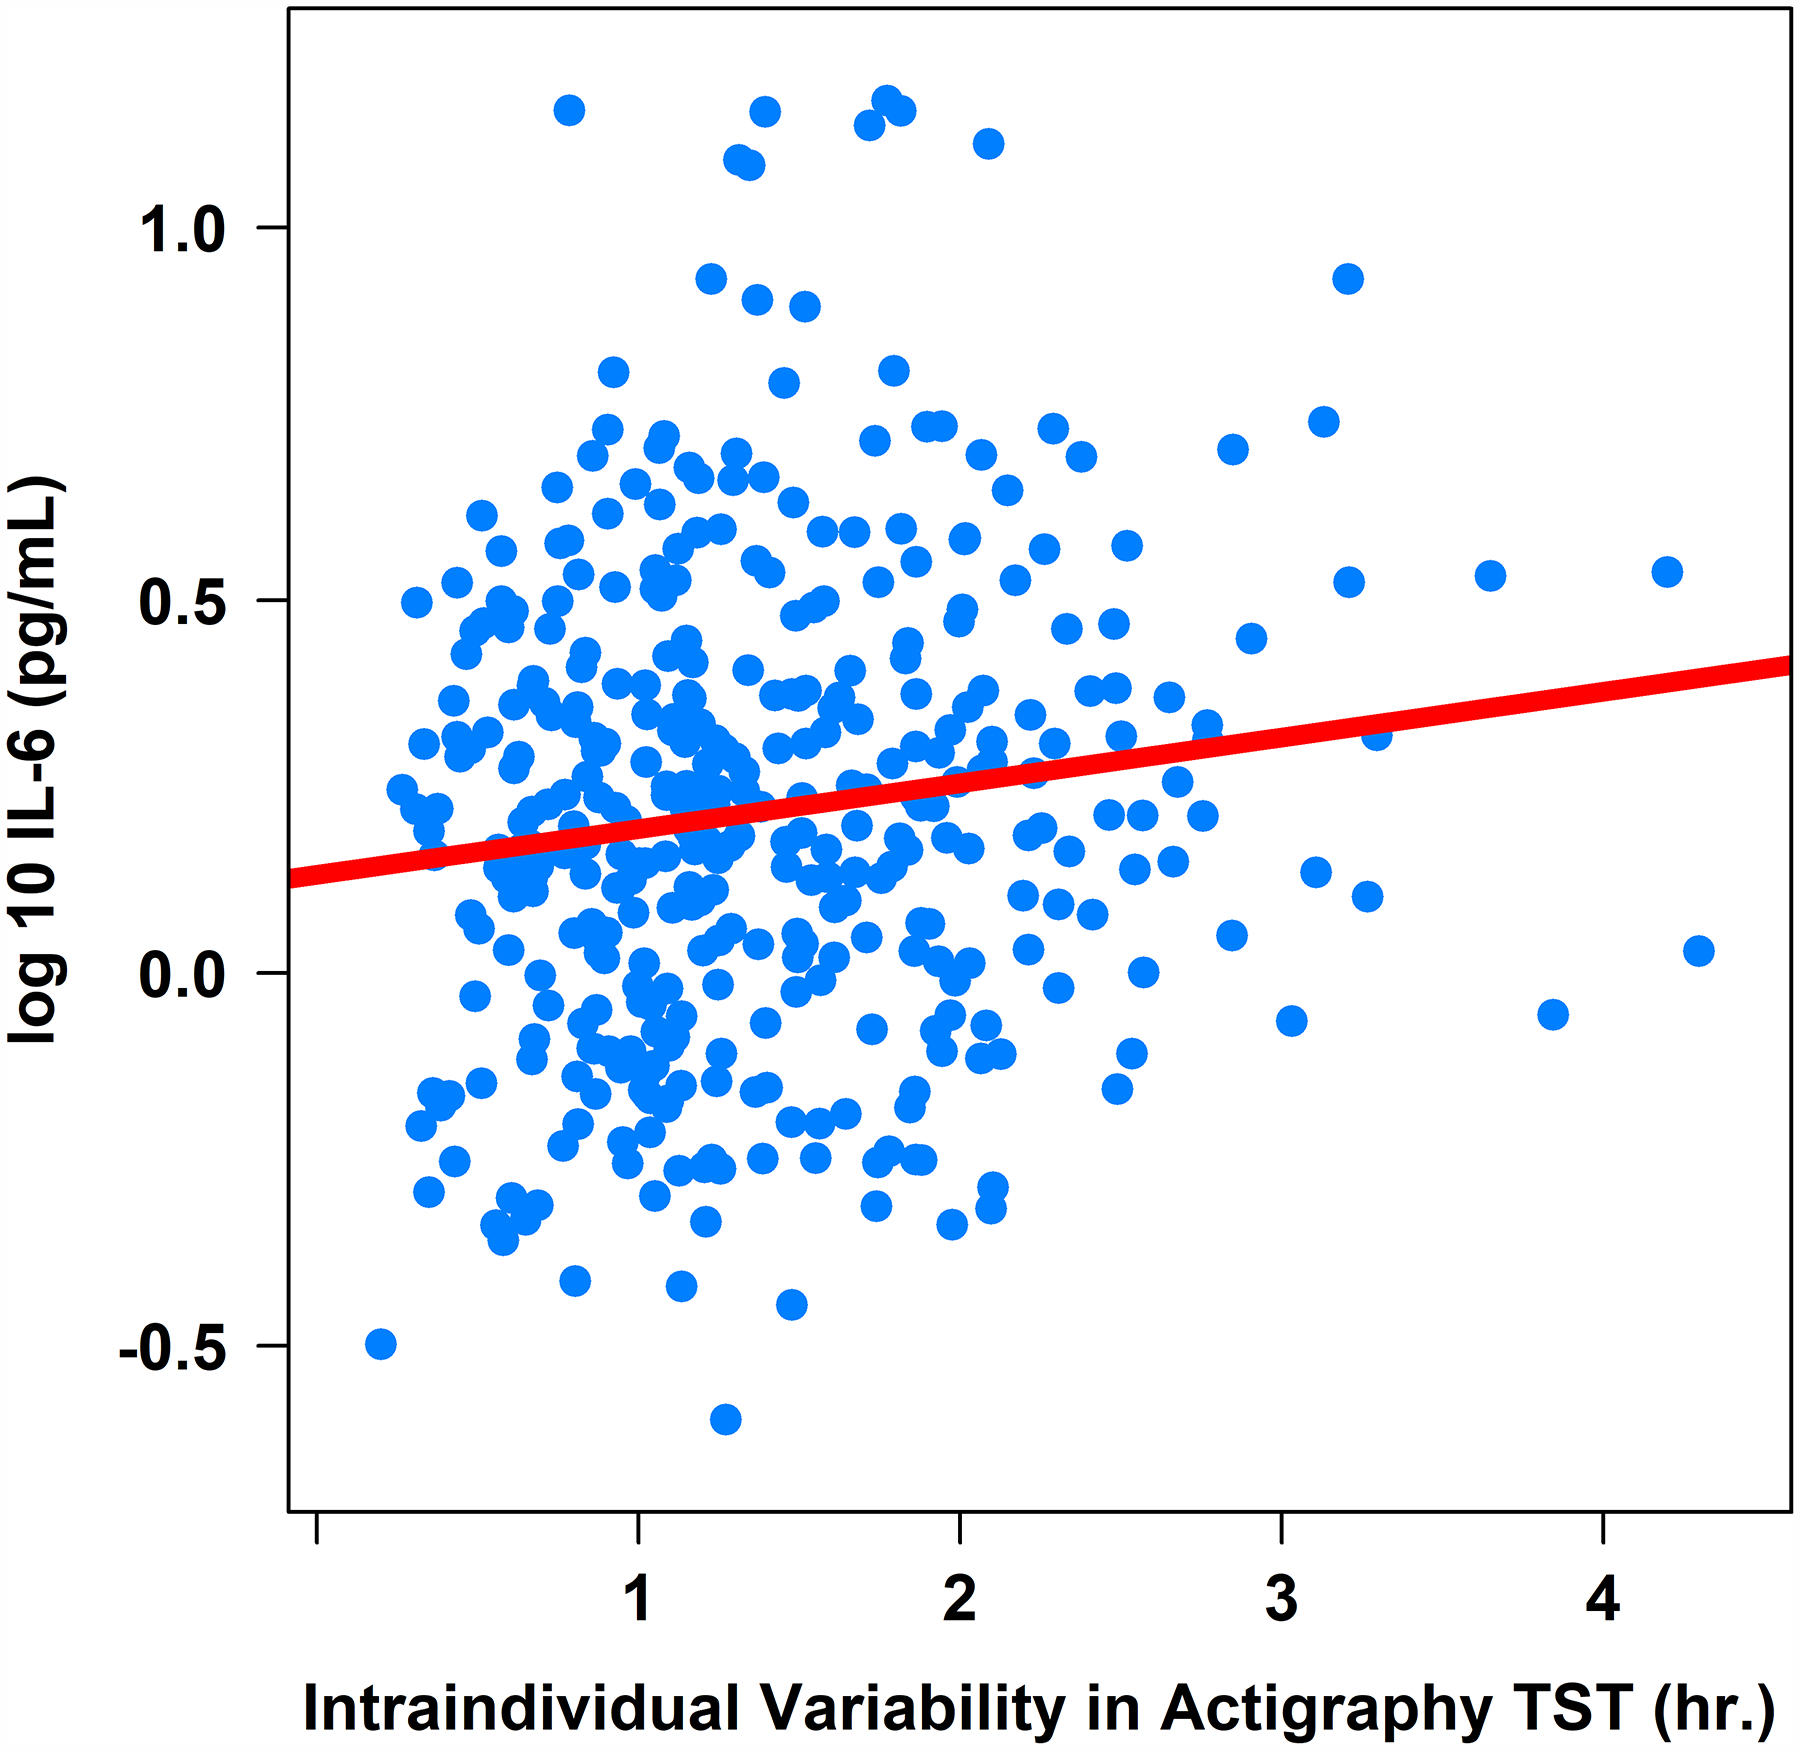
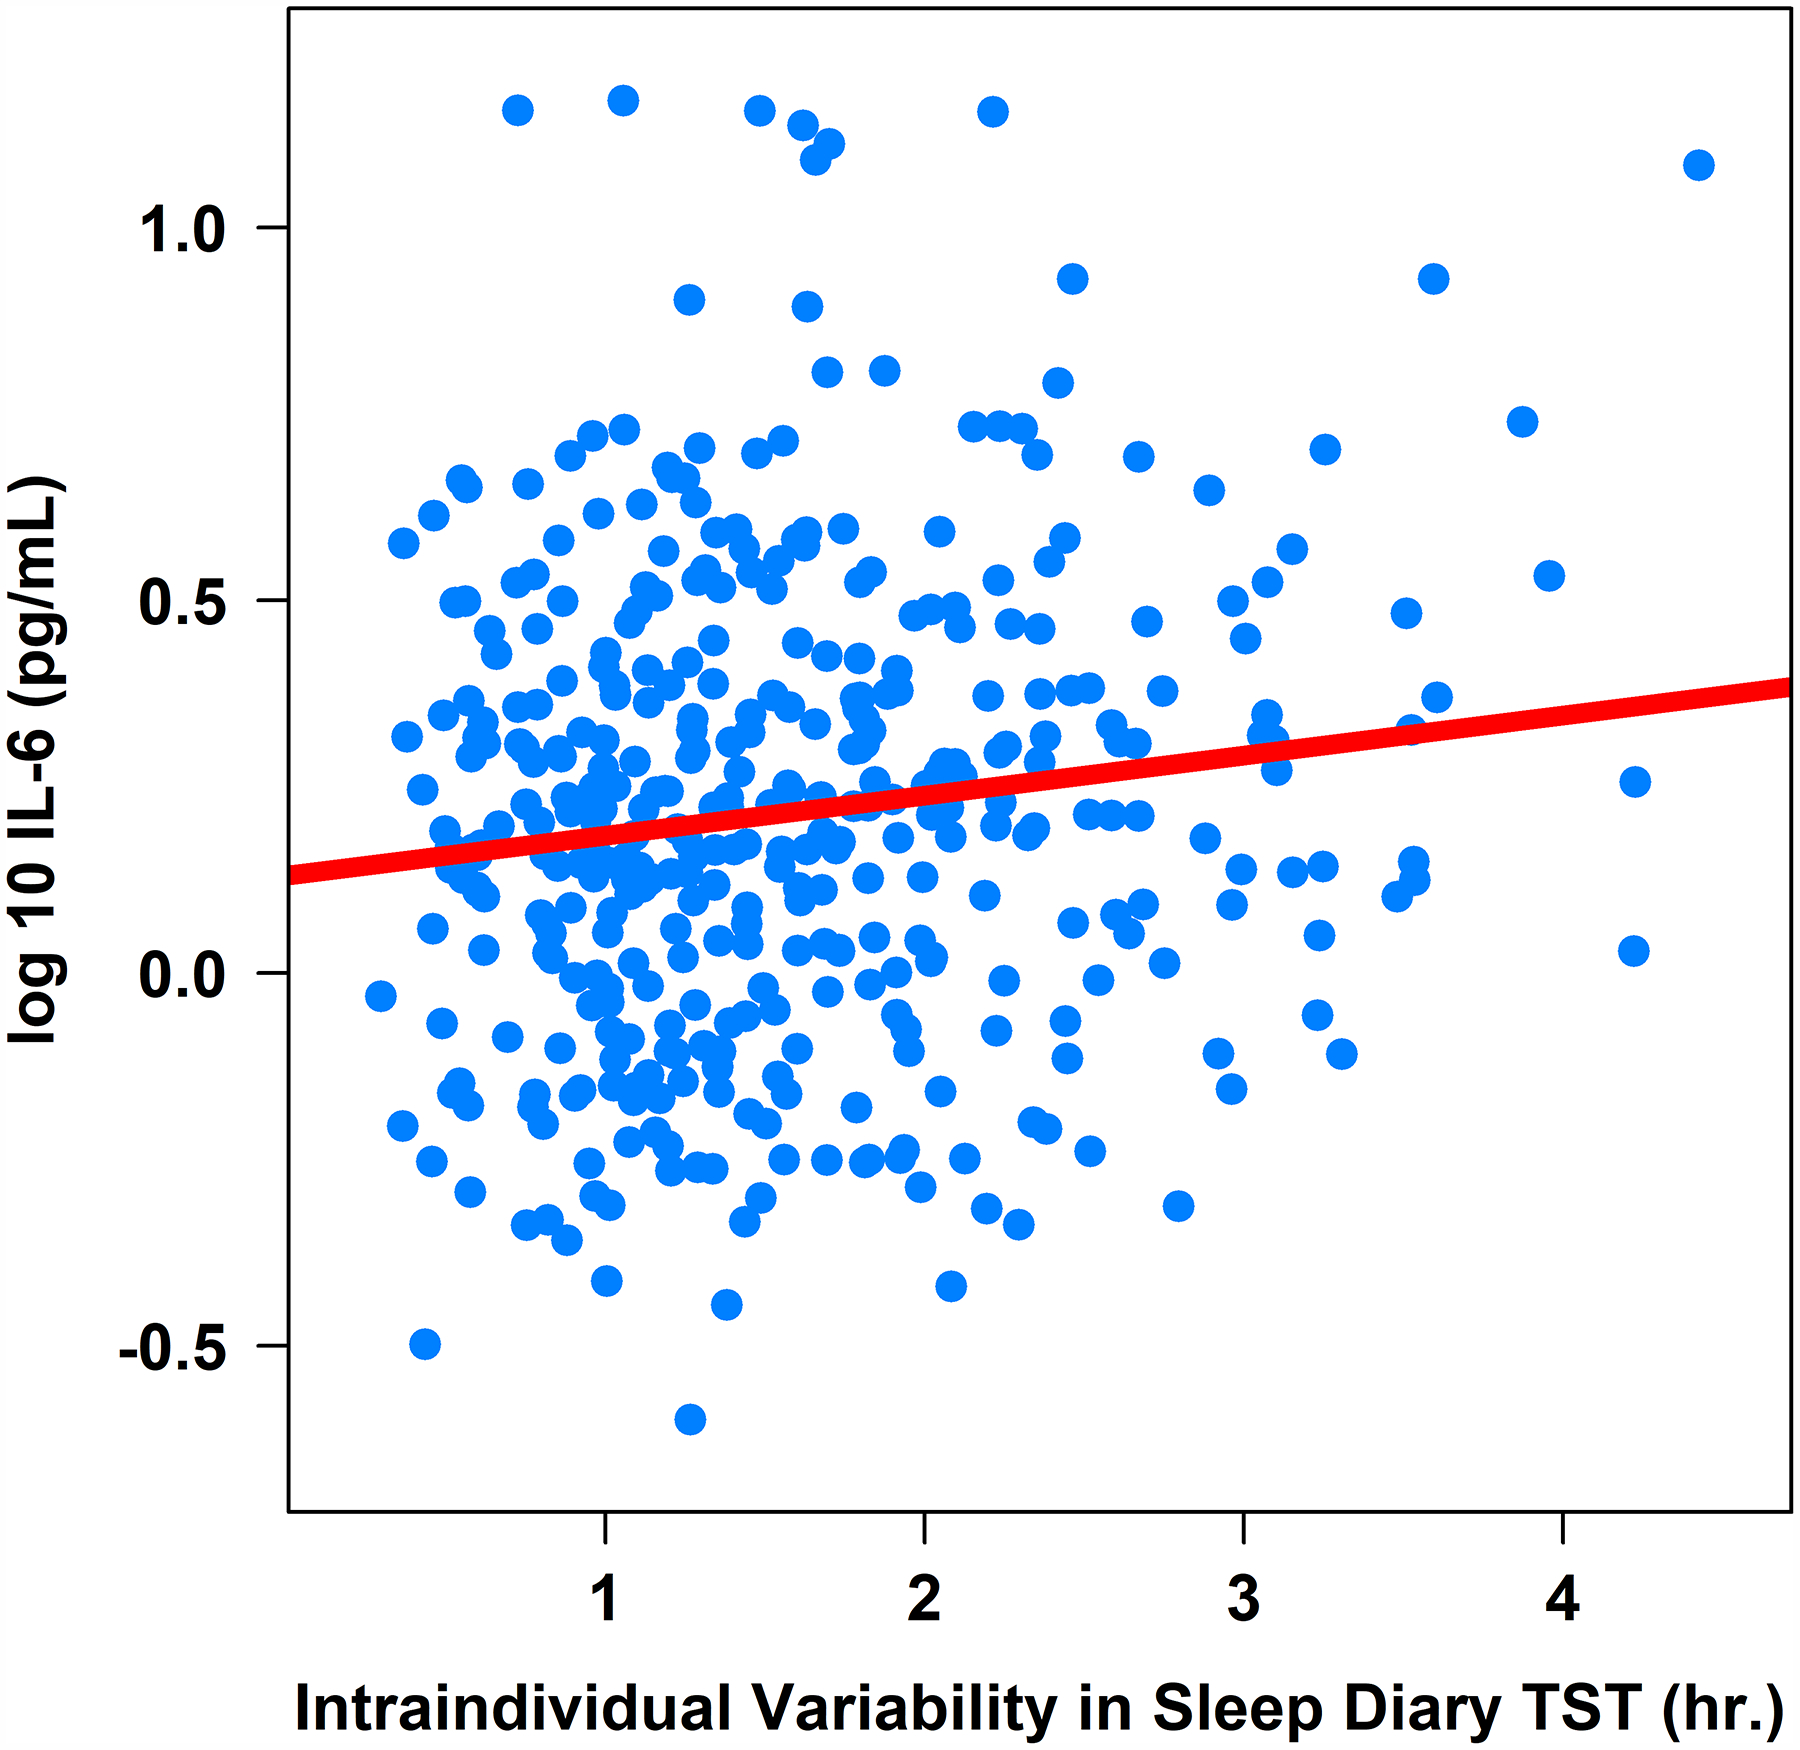
Note. TST = total sleep time. IL-6 = interleukin-6 (log-10 transformed).
Figure 4. Associations between Actigraphy- and Sleep Diary-Determined Total Sleep Time with Plasma Interleukin-1β (pg/mL).
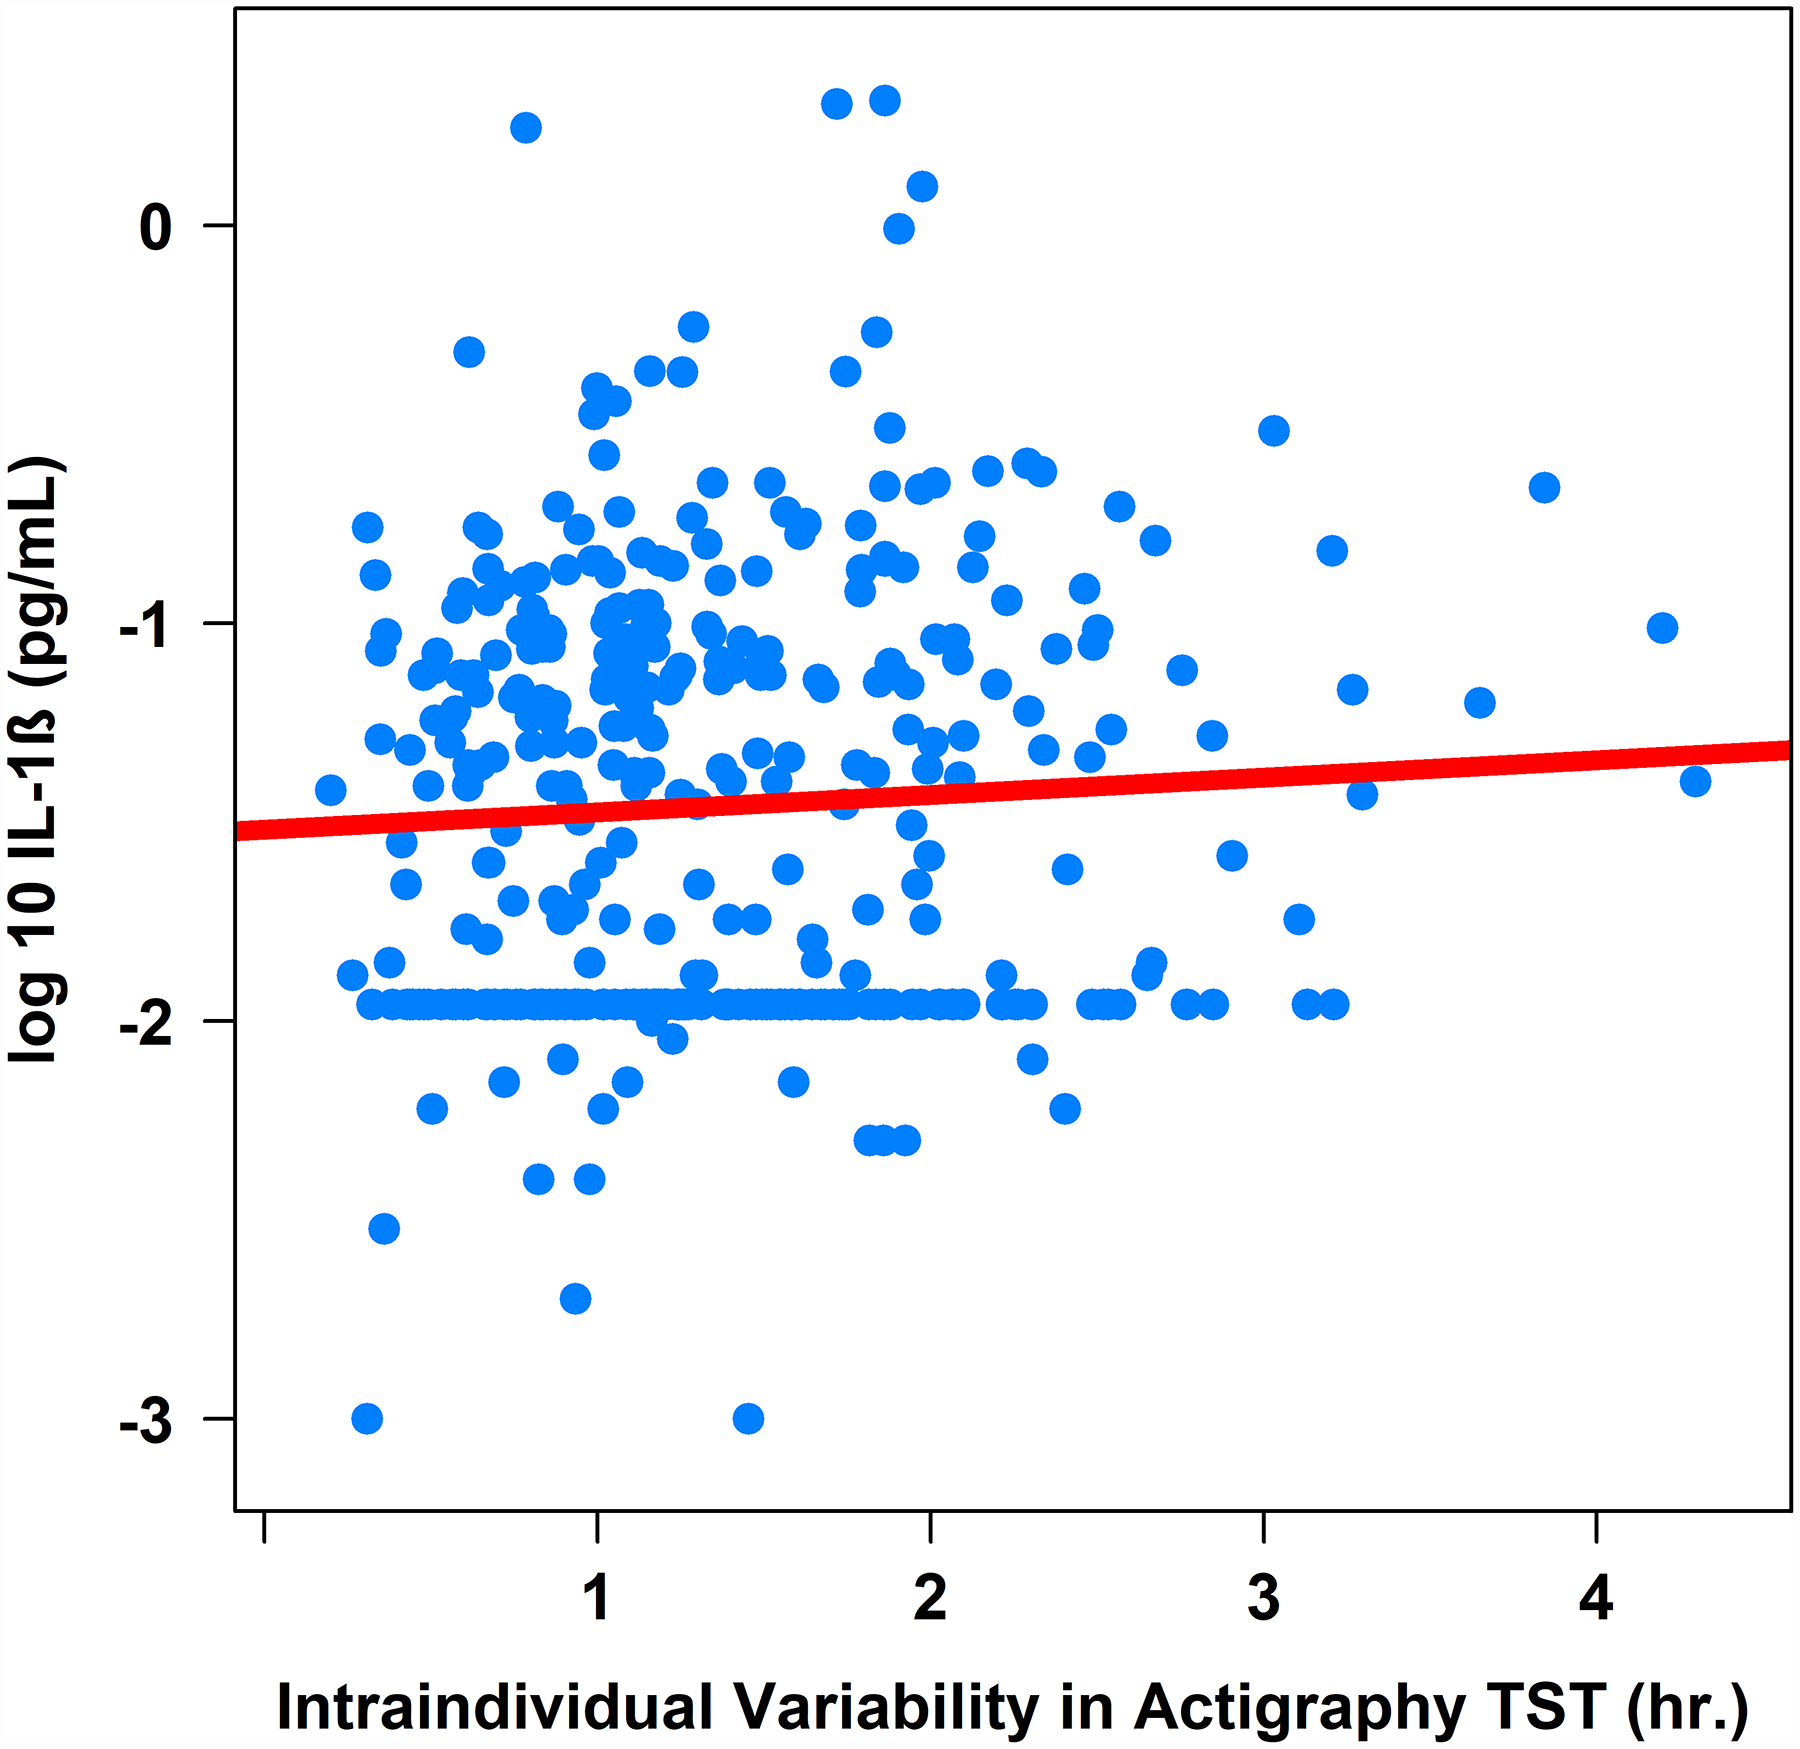
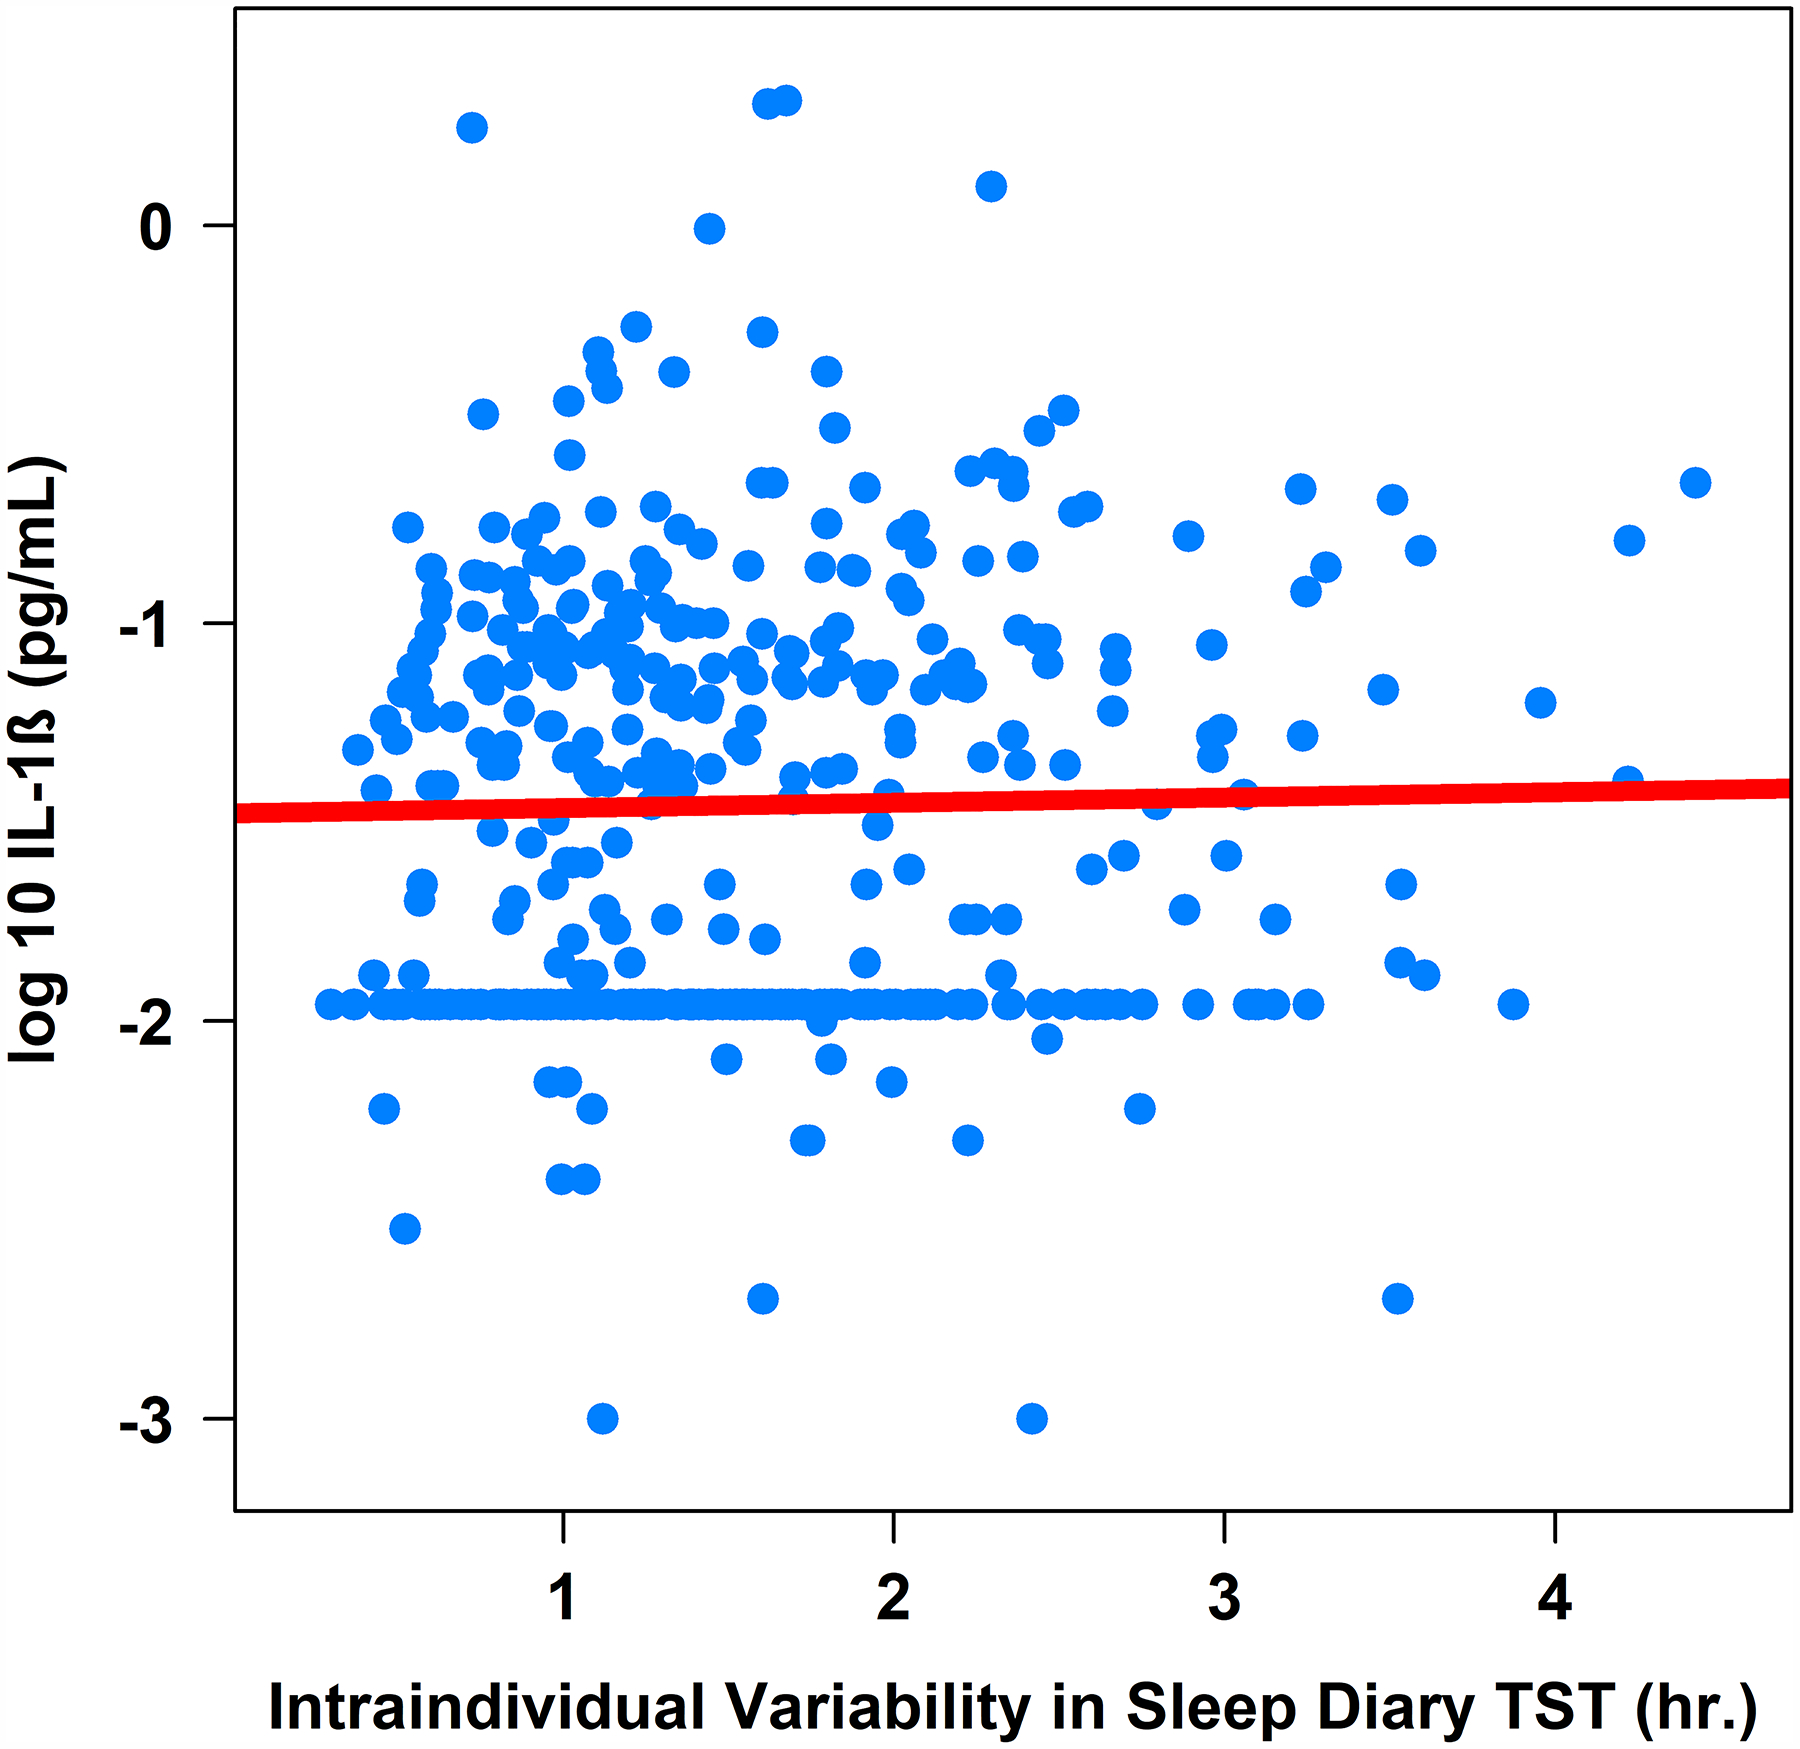
Note. TST = total sleep time. IL-1β = interleukin-1 beta (log-10 transformed).
Sleep diary.
Greater intraindividual variability in sleep diary-determined total sleep time was associated with higher IL-6 (β = .04, 95%CI [0.00, 0.08], sr2 = .01; Table 3 and Figure 3), higher IL-1β (β = .09, 95%CI [0.01, 0.17], sr2 = .01; Table 3 and Figure 4), but not CRP or TNF-α (Table 3), controlling for age, sex, BMI, and shift work. Controlling for the same covariates, intraindividual variability in sleep diary-determined sleep efficiency was not associated with either CRP, IL-6, IL-1β, or TNF-α (Table 3).
Moderation by Shift Work Status
Shift work status did not moderate any of the associations between the intraindividual mean or variability of any sleep parameters with CRP, IL-6, IL-1β, or TNF-α (Tables 2–3), controlling for age, sex, and BMI.
Exploratory Analyses
In an effort to explore other potentially important facets of sleep for inflammation, on a post-hoc basis, we examined actigraphy-determined sleep fragmentation (i.e., percentage of time spent mobile during the sleep episode) as a predictor of inflammation markers. Neither mean nor IIV in sleep fragmentation was associated with any inflammation biomarkers (mean sleep fragmentation on IL-6: β = −0.001, p = .73; IL-1β: β = −0.01, p = .077; TNF-α: β = 0.0003, p = .91; CRP: β = 0.03, p = .28; and IIV in sleep fragmentation on IL-6: β = −0.001, p = .80; IL-1β: β = 0.02, p = .16; TNF-a: β = −0.0005, p = .91; CRP: β = −0.04, p = .35).
On an exploratory basis, we also examined associations among IIV in total sleep time with inflammation markers separately in day workers and night shift workers. Among night shift workers, IIV in actigraphy-determined total sleep time was positively associated with IL-1β (β = 0.18, SE = 0.07, p = .018), but not with CRP (β = 0.19, SE = 0.31, p = .55), IL-6 (β = 0.02, SE = 0.04, p = .62), or TNF-α (β = −0.01, SE = 0.03, p = .81). Similarly, IIV in diary-determined total sleep time was positively associated with CRP (β = 0.62, SE = 0.29, p = .038), but not with IL-1β (β = 0.10, SE = 0.07, p = .19), IL-6 (β = 0.05, SE = 0.04, p = .17), or TNF-α (β = −0.01, SE = 0.03, p = .85).
Among day shift workers, IIV in actigraphy-determined total sleep time was positively associated with IL-6 (β = 0.07, SE = 0.03, p = .031), but not with CRP (β = 0.13, SE = 0.22, p = .57), IL-1β (β = 0.10, SE = 0.06, p = .11), or TNF-α (β = −0.01, SE = 0.02, p = .75). IIV in diary-determined total sleep time was negatively associated with TNF-α (β = −0.04, SE = 0.02, p = .031), but not with IL-6 (β = 0.04, SE = 0.02, p = .073), IL-1β (β = 0.09, SE = 0.05, p = .063), or CRP (β = −0.05, SE = 0.17, p = .78).
Discussion
This was the first study to demonstrate that greater night-to-night variability in actigraphy- and sleep diary-determined total sleep time is uniquely associated with higher levels of inflammation biomarkers IL-6 and IL-1β. Strengthening previous research on variability in sleep and inflammation (31–33), we assessed sleep for one week immediately before the blood draw, used both subjective and objective assessments of sleep, and assessed multiple inflammation biomarkers. Though the effects of intraindividual variability in sleep on inflammation were small, they were independent of the effects of intraindividual mean sleep (which was not uniquely associated with levels of inflammation). Furthermore, findings between intraindividual variability in sleep and inflammation did not differ by night shift work status. Together, these results highlight the importance of incorporating measures of variability in sleep to predict biomarkers of physiological functioning in future biobehavioral research.
Our findings contribute to a growing body of literature examining associations between intraindividual variability in sleep and biomarkers of inflammation. Two other studies have shown greater intraindividual variability in facets of sleep efficiency is associated with elevated inflammation. In one study of older adults, greater intraindividual variability in wake time and time in bed was associated with higher IL-6 among good sleepers (32). In another study of midlife adults, greater intraindividual variability in sleep onset latency and wake after sleep onset was associated with a composite measure of allostatic load (which included inflammation biomarkers CRP and IL-6) (31). In contrast to these studies, we found that intraindividual variability in total sleep time, but not sleep efficiency, was associated with elevated IL-6 and IL-1β among nurses. To examine these associations, we employed a rigorous naturalistic design, using both subjective and objective means to assess sleep and examining multiple facets of sleep in relation to four inflammation biomarkers particularly relevant for sleep and health. Supplementing previous research, we also assessed sleep and shift work for one week immediately prior to the blood draw, strengthening causal inference. Together with findings from other studies, our results suggest intraindividual variability in sleep may be a unique correlate of elevated inflammation, even beyond the influence of mean sleep.
Possible Mechanisms
It is possible the associations we observed may be mediated through disruption of neuroendocrine, circadian, and/or behavioral processes. For example, greater intraindividual variability in sleep has been associated with alterations in cortisol (31) and norepinephrine (28), both of which regulate production of inflammation markers. Intraindividual variability in sleep also may lead to poor health outcomes via direct disruption of circadian rhythms, which regulate key aspects of cell growth and survival, including the cell cycle, cellular senescence, and metabolism (47). Behaviorally, it is also possible that intraindividual variability in sleep may lead to disturbances in health behaviors (e.g., poor diet, reduced physical activity, increased substance use), which may indirectly lead to elevated inflammation.
However, the order in which these relationships unfold is unknown: intraindividual variability in sleep may cause disruption neuroendocrine function, health behaviors, and elevated inflammation, or these factors may cause intraindividual variability in sleep. In fact, it is highly likely that this relationship is bidirectional or cyclical. It is also possible that other variables, such as stress, may simultaneously contribute to both greater intraindividual variability in sleep and elevated levels of inflammation. Future longitudinal and experimental studies are needed to untangle these relationships across time, in order to understand if intraindividual variability is a cause and/or a consequence of elevated inflammation. Given that inflammation and disturbed sleep are both prospectively linked to multiple chronic diseases (9 15–17 48), it may be critical to understand which comes first to more effectively intervene to prevent disease.
Lack of Moderation by Shift Work Status
Somewhat surprisingly, we did not find the associations between mean or intraindividual variability in sleep and inflammation were moderated by recent shift work status among nurses. This suggests regardless of the timing of nurses’ work schedule in the past 7 days, more night-to-night variability in total sleep time across the week is associated with elevated inflammation. However, exploratory follow-up analyses conducted separately in day and night shift workers did reveal some discrepant findings. Among night shift workers only, greater intraindividual variability in actigraphy and diary total sleep time was associated with higher CRP. Among day shift workers only, greater intraindividual variability in actigraphy total sleep time was associated with higher IL-6. These preliminary results suggest variability in sleep may be associated with unique patterns of inflammation among day and night shift workers, though results should be replicated and extended with future research.
In the current study, night shift work also was associated with greater IL-6 independently of intraindividual variability in total sleep time, suggesting shift work and intraindividual variability in sleep are related but partially distinct constructs. For example, even those nurses not engaged in shift work may experience high variability in their sleep duration across a week due to day-to-day fluctuations in stress, work/family obligations, caregiving responsibilities, physical symptoms, mood, health behaviors, or medication use. Supporting our findings, one study similarly showed that independent of sleep duration, more variable sleep timing (i.e., delaying bedtimes by 8.5hr on 4 out of 8 days) is associated with elevated CRP (49). Future studies should continue to examine the relative importance of variable sleep timing and variable sleep duration on markers of physiological functioning.
Null Results with CRP and TNF-α
Our analyses did not reveal any significant associations with intraindividual variability in sleep and CRP and TNF-α. Other studies have found similarly null results with intraindividual variability in sleep and these biomarkers (31 32). It is possible that IL-6 and IL-1β may be more informative or sensitive biomarkers of variability in sleep compared to CRP and TNF-α. Indeed, other studies have shown that IL-6 is particularly sensitive to sleep loss and disturbed sleep (for a review see (50)). CRP also is more stable over short and long periods of time than is IL-6 and IL-1β (51–53), and therefore it may not be as responsive to acute fluctuations in sleep duration. However, given the small effect sizes we observed for associations between intraindividual variability in total sleep time with IL-6 and IL-1β, results should be interpreted cautiously. Findings should be replicated in other samples before definitive conclusions are drawn regarding which inflammation biomarkers are most robustly associated with intraindividual variability in sleep.
Null Results with Sleep Efficiency
In our analyses, neither intraindividual mean nor variability in sleep efficiency were associated with any markers of inflammation. This supports findings from another recent study, which showed greater intraindividual variability in total sleep time, but not sleep efficiency was associated with increased risk for a number of medical problems (i.e., pain, depression, and gastrointestinal, neurological, and breathing problems) (26). It is possible that maintaining a consistent sleep duration (i.e., total sleep time) is more important for health than is obtaining consistent sleep quality and consolidation (i.e., sleep efficiency). Future studies should examine the relative importance of intraindividual variability in different domains of sleep in relation to markers of health.
Limitations and Opportunities for Future Research
Although this study has many unique strengths (e.g., large representative sample of nurses, 7 days of self-report and actigraphy measures of sleep immediately prior to the blood draw), there are some limitations warranting discussion. First, we only investigated some of the potential correlates of intraindividual variability in sleep in this study (e.g., shift work, age, sex). There are likely other factors involved in the association between intraindividual variability in sleep and inflammation, such as medication use, underlying medical conditions, perceived stress, and/or social jetlag. Without a true control group (e.g., individuals randomly assigned to shift work), we were unable to tell if our sample’s dysregulated sleep was due to the nature of their work or these other factors. Future studies should examine other potential causes and/or consequences of intraindividual variability in sleep. Intensive longitudinal studies may be useful to untangle these bidirectional associations between nightly fluctuations in sleep and inflammation levels. A few studies have examined such associations in daily life and found that short sleep duration is associated with subsequent increases in salivary IL-6 (54), and that night shift work is associated with alterations in salivary IL-1β (37 55).
Second, although our sample demographics generally matched national demographics of nurses in the U.S. (38), our sample was primarily female, and therefore, we were unable to investigate potential sex or gender differences in these associations. Previous studies have shown that there are important sex differences in both intraindividual variability in sleep and inflammation, such that women may be more affected by the detrimental effects of sleep loss on inflammation (56 57). Women also tend to exhibit greater intraindividual variability in sleep than men (28).
Third, although our findings were consistent across multiple biomarkers and across sleep diaries and actigraphy, it is important to note that we did run multiple analyses, which may have increased our chances of making a Type 1 error. Fourth, IL-1β levels were non-detectable in approximately 31% of our sample. Based on examination of the standard curve, we can be certain that these non-detectable samples were truly very low levels. As with many markers of inflammation, it can be difficult to obtain detectable levels in relatively healthy samples (41 58). Values below detectable limits are data missing not at random (MNAR), which poses a unique challenge for data analysis. Multiple imputation techniques are not recommended for MNAR (59). Therefore, when missing data are due to low levels, researchers may benefit from imputing a small value for missing data (i.e., the value half the lower limit of detection). This is a common strategy when examining markers of inflammation (41 42 58) and capitalizes on using all available information. Finally, more days of sleep measurements would have provided more reliable estimates of intraindividual variability in sleep across time; however, adding measurement occasions should always be weighed against participant burden.
Conclusions
Given that nurses play a crucial role in maintaining patient health and safety, it is essential to understand the causes and consequences of their sleep problems. This study showed greater intraindividual variability in sleep duration may be a unique correlate of elevated inflammation in nurses. Surprisingly, mean sleep was unrelated to inflammation. We urge sleep researchers to consider the unique role of intraindividual variability in sleep on health whenever possible. Given that elevated inflammation is observed in many chronic diseases, future longitudinal studies should also examine whether inflammation may be a mediator between intraindividual variability in sleep and more distal disease outcomes. Regularizing sleep duration whenever possible may be one means to promote health among nurses.
Acknowledgements
We would like to thank the hospitals, nurse principal investigators, participants, and research assistants for their help facilitating this study.
Acronyms:
- BMI
body mass index
- CRP
C-reactive protein
- CV
coefficient of variation
- ELISA
enzyme-linked immunosorbent assay
- IL-1β
interleukin-1 beta
- IL-6
interleukin-6
- iM
intraindividual mean
- iSD
intraindividual standard deviation
- IIV
intraindividual variability
- LLD
lower limit of detection
- sr2
semi-partial correlations squared
- SE
sleep efficiency
- TIB
time in bed
- TST
total sleep time
- TNF-α
tumor necrosis factor-alpha
Footnotes
Conflicts of Interest and Source of Funding: The authors declare no conflicts of interest. This research was supported by National Institute of Allergy and Infectious Diseases grant 1R01AI128359–01 (PIs: Taylor & Kelly).
All data and code are available on Open Science Framework: https://osf.io/mwhvq/?view_only=3bd044722ece45a587259b8817bd9b53
References
- 1.Lin S-H, Liao W-C, Chen M-Y, Fan J-Y. The impact of shift work on nurses’ job stress, sleep quality and self-perceived health status. J. Nurs. Manag 2014; 22:604–12 [DOI] [PubMed] [Google Scholar]
- 2.Gold DR, Rogacz S, Bock N, Tosteson TD, Baum TM, Speizer FE, Czeisler CA. Rotating shift work, sleep, and accidents related to sleepiness in hospital nurses. Am J Public Health 1992; 82:1011–4 [DOI] [PMC free article] [PubMed] [Google Scholar]
- 3.Lee KA. Self-reported sleep disturbances in employed women. Sleep 1992; 15:493–8 [DOI] [PubMed] [Google Scholar]
- 4.Niedhammer I, Lert F, Marne MJ. Effects of shift work on sleep among French nurses. A longitudinal study. J Occup Med 1994; 36:667–74 [PubMed] [Google Scholar]
- 5.Kageyama T, Nishikido N, Kobayashi T, Oga J, Kawashima M. Cross-sectional survey on risk factors for insomnia in Japanese female hospital nurses working rapidly rotating shift systems. J Hum Ergol 2001; 30:149–54 [PubMed] [Google Scholar]
- 6.Øyane NMF, Pallesen S, Moen BE, Akerstedt T, Bjorvatn B. Associations between night work and anxiety, depression, insomnia, sleepiness and fatigue in a sample of Norwegian nurses. PloS One 2013; 8:e70228–e28 [DOI] [PMC free article] [PubMed] [Google Scholar]
- 7.Phillips B, Mannino DM. Do insomnia complaints cause hypertension or cardiovascular disease? J. Clin. Sleep Med 2007; 3:489–94 [PMC free article] [PubMed] [Google Scholar]
- 8.Taylor DJ, Lichstein KL, Durrence HH, Reidel BW, Bush AJ. Epidemiology of insomnia, depression, and anxiety. SLEEP 2005; 28:1457–64 [DOI] [PubMed] [Google Scholar]
- 9.Ayas NT, White DP, Al-Delaimy WK, Manson JE, Stampfer MJ, Speizer FE, Patel S, Hu FB. A prospective study of self-reported sleep duration and incident diabetes in women. Diabetes Care 2003; 26:380–84 [DOI] [PubMed] [Google Scholar]
- 10.Patel SR, Ayas NT, Malhotra MR, White DP, Schernhammer ES, Speizer FE, Stampfer MJ, Hu FB. A prospective study of sleep duration and mortality risk in women. SLEEP 2004; 27:440–44 [DOI] [PubMed] [Google Scholar]
- 11.Irwin M Effects of sleep and sleep loss on immunity and cytokines. Brain Behav. Immun 2002; 16:503–12 [DOI] [PubMed] [Google Scholar]
- 12.Irwin MR, Opp MR. Sleep health: Reciprocal regulation of sleep and innate immunity. Neuropsychopharmacology 2016; 42:129. [DOI] [PMC free article] [PubMed] [Google Scholar]
- 13.Irwin MR, Olmstead R, Carroll JE. Sleep disturbance, sleep duration, and inflammation: A systematic review and meta-analysis of cohort studies and experimental sleep deprivation. Biol Psychiatry 2016; 80:40–52 [DOI] [PMC free article] [PubMed] [Google Scholar]
- 14.Sookoian S, Gemma C, Fernandez Gianotti T, Burgueno A, Alvarez A, Gonzalez C, Pirola C. Effects of rotating shift work on biomarkers of metabolic syndrome and inflammation. J. Intern. Med 2007; 261:285–92 [DOI] [PubMed] [Google Scholar]
- 15.Cesari M, Penninx BW, Newman AB, Kritchevsky SB, Nicklas BJ, Sutton-Tyrrell K, Tracy RP, Rubin SM, Harris TB, Pahor M. Inflammatory markers and cardiovascular disease (The Health, Aging and Body Composition [Health ABC] Study). Am. J. Cardiol 2003; 92:522–8 [DOI] [PubMed] [Google Scholar]
- 16.Ford DE, Erlinger TP. Depression and C-reactive protein in US adults: Data from the Third National Health and Nutrition Examination Survey. Arch Intern Med 2004; 164:1010–4 [DOI] [PubMed] [Google Scholar]
- 17.Pradhan A, Manson J, Rifai N, Buring J, Ridker P. C-reactive protein, interleukin 6, and risk of developing type 2 diabetes mellitus. JAMA 2001; 286:327–34 [DOI] [PubMed] [Google Scholar]
- 18.Ananthakrishnan AN, Khalili H, Konijeti GG, Higuchi LM, de Silva P, Fuchs CS, Richter JM, Schernhammer ES, Chan AT. Sleep duration affects risk for ulcerative colitis: A prospective cohort study. Clin Gastroenterol Hepatol 2014; 12:1879–86 [DOI] [PMC free article] [PubMed] [Google Scholar]
- 19.Schernhammer ES, Laden F, Speizer FE, Willett WC, Hunter DJ, Kawachi I, Colditz GA. Rotating night shifts and risk of breast cancer in women participating in the nurses’ health study. J Natl Cancer Inst 2001; 93:1563–8 [DOI] [PubMed] [Google Scholar]
- 20.Buysse DJ. Sleep health: Can we define it? Does it matter? Sleep 2014; 37:9–17 [DOI] [PMC free article] [PubMed] [Google Scholar]
- 21.Bei B, Wiley JF, Trinder J, Manber R. Beyond the mean: A systematic review on the correlates of daily intraindividual variability of sleep/wake patterns. Sleep Med Rev 2016; 28:108–24 [DOI] [PubMed] [Google Scholar]
- 22.Akerstedt T Shift work and disturbed sleep/wakefulness. Occup Med 2003; 53:89–94 [DOI] [PubMed] [Google Scholar]
- 23.Patel SR, Hayes AL, Blackwell T, Evans DS, Ancoli-Israel S, Wing YK, Stone KL. The association between sleep patterns and obesity in older adults. Int J of Obes 2014; 38:1159–64 [DOI] [PMC free article] [PubMed] [Google Scholar]
- 24.Dautovich ND, Kay DB, Perlis ML, Dzierzewski JM, Rowe MA, McCrae CS. Day-to-day variability in nap duration predicts medical morbidity in older adults. Health Psych 2012; 31:671–6 [DOI] [PMC free article] [PubMed] [Google Scholar]
- 25.Huang T, Redline S. Cross-sectional and prospective associations of actigraphy-assessed sleep regularity with metabolic abnormalities: The Multi-Ethnic Study of Atherosclerosis. Diabetes Care 2019:dc190596. [DOI] [PMC free article] [PubMed] [Google Scholar]
- 26.Slavish DC, Taylor DJ, Lichstein KL. Intraindividual variability in sleep and comorbid medical problems. SLEEP 2019; 42 [DOI] [PMC free article] [PubMed] [Google Scholar]
- 27.Buysse DJ, Cheng Y, Germain A, Moul DE, Franzen PL, Fletcher M, Monk TH. Night-to-night sleep variability in older adults with and without chronic insomnia. Sleep Med 2010; 11:56–64 [DOI] [PMC free article] [PubMed] [Google Scholar]
- 28.Mezick EJ, Matthews KA, Hall M, Kamarck TW, Buysse DJ, Owens JF, Reis SE. Intra-individual variability in sleep duration and fragmentation: Associations with stress. Psychoneuroendocrinology 2009; 34:1346–54 [DOI] [PMC free article] [PubMed] [Google Scholar]
- 29.Bei B, Manber R, Allen NB, Trinder J, Wiley JF. Too long, too short, or too variable? Sleep intraindividual variability and its associations with perceived sleep quality and mood in adolescents during naturalistically unconstrained sleep. SLEEP 2017; 40 [DOI] [PubMed] [Google Scholar]
- 30.Irwin M, Clark C, Kennedy B, Gillin JC, Ziegler M. Nocturnal catecholamines and immune function in insomniacs, depressed patients, and control subjects. Brain, Behavior and Immunity 2003; 17:365–72 [DOI] [PubMed] [Google Scholar]
- 31.Bei B, Seeman TE, Carroll JE, Wiley JF. Sleep and physiological dysregulation: A closer look at sleep intraindividual variability. SLEEP 2017; zsx109. [DOI] [PMC free article] [PubMed] [Google Scholar]
- 32.Okun ML, Reynolds CF, Buysse DJ, Monk TH, Mazumdar S, Begley A, Hall M. Sleep variability, health-related practices and inflammatory markers in a community dwelling sample of older adults. Psychosom Med 2011; 73:142–50 [DOI] [PMC free article] [PubMed] [Google Scholar]
- 33.Park H, Tsai KM, Dahl RE, Irwin MR, McCreath H, Seeman TE, Fuligni AJ. Sleep and inflammation during adolescence. Psychosom Med 2016; 78:677–85 [DOI] [PMC free article] [PubMed] [Google Scholar]
- 34.Wright KP, Drake AL, Frey DJ, Fleshner M, Desouza CA, Gronfier C, Czeisler CA. Influence of sleep deprivation and circadian misalignment on cortisol, inflammatory markers, and cytokine balance. Brain Behav. Immun 2015; 47:24–34 [DOI] [PMC free article] [PubMed] [Google Scholar]
- 35.Puttonen S, Viitasalo K, Harma M. Effect of shiftwork on systemic markers of inflammation. Chronobiology international 2011; 28:528–35 [DOI] [PubMed] [Google Scholar]
- 36.Morris CJ, Purvis TE, Mistretta J, Hu K, Scheer F. Circadian misalignment increases C-reactive protein and blood pressure in chronic shift workers. J Biol Rhythms 2017; 32:154–64 [DOI] [PMC free article] [PubMed] [Google Scholar]
- 37.Reinhardt EL, Fernandes P, Markus RP, Fischer FM. Night work effects on salivary cytokines TNF, IL-1beta and IL-6. Chronobiol Int 2018; 19:1–16 [DOI] [PubMed] [Google Scholar]
- 38.Health Resources and Services Administration. The U.S. nursing workforce: Trends in supply and education. In: Department of Health and Human Services, ed., 2013. [Google Scholar]
- 39.Carney CE, Buysse DJ, Ancoli-Israel S, Edinger JD, Krystal AD, Lichstein KL, Morin CM. The consensus sleep diary: Standardizing prospective sleep self-monitoring. Sleep 2012; 35:287–302 [DOI] [PMC free article] [PubMed] [Google Scholar]
- 40.Harris P, Taylor R, Thielke R, Payne J, Gonzalez N, Conde J. Research electronic data capture (REDCap) – A metadata-driven methodology and workflow process for providing translational research informatics support. J Biomed Inform 2009; 42:377–81 [DOI] [PMC free article] [PubMed] [Google Scholar]
- 41.Newton TL, Fernandez-Botran R, Lyle KB, Szabo YZ, Miller JJ, Warnecke AJ. Salivary cytokine response in the aftermath of stress: An emotion regulation perspective. Emotion 2017; 17:1007–20 [DOI] [PubMed] [Google Scholar]
- 42.Szabo YZ, Fernandez-Botran R, Newton TL. Cumulative trauma, emotion reactivity and salivary cytokine levels following acute stress in healthy women. Anxiety Stress Coping 2018; 20:1–13 [DOI] [PubMed] [Google Scholar]
- 43.May AL, Freedman D, Sherry B, Blanck HM. Obesity—United States, 1988–2008. MMWR 2011; 60:73–7 [PubMed] [Google Scholar]
- 44.R: A language and environment for statistical computing [program]. Vienna, Austria: R Foundation for Statistical Computing, 2013. [Google Scholar]
- 45.apaTables: Create American Psychological Association (APA) Style Tables [program]. 1.5.1 version, 2017.
- 46.Cohen J. Statistical power analysis for the behavioral sciences. 2nd ed. Hillsdale, NJ: Lawrence Earlbaum Associates, 1988. [Google Scholar]
- 47.Sahar S, Sassone-Corsi P. Metabolism and cancer: The circadian clock connection. Nat. Rev. Cancer 2009; 9:886. [DOI] [PubMed] [Google Scholar]
- 48.Ayas NT, White DP, Manson JE, Stampfer MJ, Speizer FE, Malhotra A, Hu FB. A prospective study of sleep duration and coronary heart disease in women. Arch Intern Med 2003; 163 [DOI] [PubMed] [Google Scholar]
- 49.Leproult R, Holmbäck U, Van Cauter E. Circadian misalignment augments markers of insulin resistance and inflammation, independently of sleep loss. Diabetes 2014; 63:1860–69 [DOI] [PMC free article] [PubMed] [Google Scholar]
- 50.Rohleder N, Aringer M, Boentert M. Role of interleukin-6 in stress, sleep, and fatigue. Ann N Y Acad Sci 2012; 1261:88–96 [DOI] [PubMed] [Google Scholar]
- 51.Ferrari R, Tanni SE, Caram LM, Corrêa C, Corrêa CR, Godoy I. Three-year follow-up of Interleukin 6 and C-reactive protein in chronic obstructive pulmonary disease. Respir. Res 2013; 14:24. [DOI] [PMC free article] [PubMed] [Google Scholar]
- 52.Izawa S, Miki K, Liu X, Ogawa N. The diurnal patterns of salivary interleukin-6 and C-reactive protein in healthy young adults. Brain Behav. Immun 2013; 27:38–41 [DOI] [PubMed] [Google Scholar]
- 53.Shields GS, Slavich GM, Perlman G, Klein DN, Kotov R. The short-rerm reliability and long-term stability of salivary immune markers. Brain Behav. Immun 2019; [DOI] [PMC free article] [PubMed] [Google Scholar]
- 54.Reinhardt EL, Fernandes PA, Markus RP, Fischer FM. Short sleep duration increases salivary IL-6 production. Chronobiol Int 2016; 33:780–2 [DOI] [PubMed] [Google Scholar]
- 55.Reinhardt ÉL, Fernandes PACM, Markus RP, Fischer FM. Daily rhythm of salivary IL-1ß, cortisol and melatonin in day and night workers. Work 2012; 41 Suppl 1:5788–90 [DOI] [PubMed] [Google Scholar]
- 56.Suarez EC. Self-reported symptoms of sleep disturbance and inflammation, coagulation, insulin resistance and psychosocial distress: Evidence for gender disparity. Brain Behav. Immun 2008; 22:960–8 [DOI] [PMC free article] [PubMed] [Google Scholar]
- 57.Prather AA, Epel ES, Cohen BE, Neylan TC, Whooley MA. Gender differences in the prospective associations of self-reported sleep quality with biomarkers of systemic inflammation and coagulation: Findings from the Heart and Soul Study. J Psychiatric Res 2013; 47:1228–35 [DOI] [PMC free article] [PubMed] [Google Scholar]
- 58.Slavish DC, Jones DR, Smyth JM, Engeland CG, Song S, McCormick NM, Graham-Engeland JE. Positive and negative affect and salivary markers of inflammation among young adults. International Journal of Behavioral Medicine 2019; [DOI] [PMC free article] [PubMed] [Google Scholar]
- 59.Sterne JAC, White IR, Carlin JB, Spratt M, Royston P, Kenward MG, Wood AM, Carpenter JR. Multiple imputation for missing data in epidemiological and clinical research: Potential and pitfalls. BMJ 2009; 338:b2393–b93 [DOI] [PMC free article] [PubMed] [Google Scholar]