

Abstract
Annotation of untargeted high-resolution full-scan LC-MS metabolomics data remains challenging due to individual metabolites generating multiple LC-MS peaks arising from isotopes, adducts and fragments. Adduct annotation is a particular challenge, as the same mass difference between peaks can arise from adduct formation, fragmentation, or different biological species. To address this, here we describe a Buffer Modification Workflow (BMW), in which the same sample is run by LC-MS in both liquid chromatography solvent with 14NH3-acetate buffer, and in solvent with the buffer modified with 15NH3-formate. Buffer switching results in characteristic mass and signal intensity changes for adduct peaks, facilitating their annotation. This relatively simple and convenient chromatography modification annotated yeast metabolomics data with similar effectiveness to growing the yeast in isotope-labeled media. Application to mouse liver data annotated both known metabolite and known adduct peaks with 95% accuracy. Overall, it identified 26% of ~ 27,000 liver LC-MS features as putative metabolites, of which ~ 2600 showed HMDB or KEGG database formula match. This workflow is well-suited to biological samples that cannot be readily isotope labeled, including plants, mammalian tissues, and tumors.
Graphical Abstract
A major challenge in untargeted metabolomics is to correctly identify all detectable metabolites for a given biological system, e.g., cultured cell or plant or animal tissue. Nuclear Magnetic Resonance (NMR) and high resolution liquid chromatography mass spectrometry (LC-MS) are two common platforms [1–3]. Typical LC-MS runs detect >10,000 “peaks” or “features”, defined by mass-to-charge ratio (m/z) and retention time (RT). Not all of these peaks directly correspond to metabolite protonated or deprotonated ions [M+H]+ or [M−H]− [4–10]:
There are non-biological background peaks from diverse sources, such as culture medium, chemicals introduced during sample preparation (e.g. from Eppendorf tubes), and contaminants from the LC-MS system;
In addition to [M+H]+ and [M−H]− ions, a metabolite may produce additional ions including natural isotopes, adducts, and in-source fragments.
Thus, a critical aspect of untargeted analysis is to pinpoint the metabolite ions. One approach is to group all peaks from the same metabolite. This can be done based on RT and peak shape similarity within same sample, and/or peak abundance correlation across samples. Such grouping is followed by annotation using m/z differences [11–18].
An alternative approach applies a set of rules to categorize peaks without performing peak grouping as the first step [8]. A challenge is to find rules that accurately discriminate metabolite peaks. For microorganisms, such as E. coli and S. cerevisiae, analysis of unlabeled and isotope-labeled specimens facilitates accurate peak categorization [6, 8, 19–23]. One workflow, which we named a Peak Annotation and Verification Engine (PAVE), involves growing microbes in unlabeled, 13C, 15N, and dual 13C/15N-labeled media [8]. Biological peaks are differentiated from nonbiological peaks based on whether the peaks exhibit mass shifts between unlabeled and labeled samples. Moreover, the mass shifts can be used to derive metabolite C and N atom counts (with carbon or nitrogen atoms coming from adducting remaining unlabeled). Metabolite and adduct peaks share the same C and N counts, even though their masses are different, facilitating annotation. Fragments are annotated based on their peak intensity increasing under weak in-source collision-induced dissociation (CID).
Approaches based on isotope labeling work well for microorganisms that can grow in minimal media and thus are readily fully isotope labeled. Many types of samples are, however, difficult to label completely, including plant and animal tissues. An alternative approach is needed to annotate metabolite peaks in such samples. Through careful examination of the PAVE workflow, we found that adduct annotation is the step for which the isotope labelling is critical. Specifically, without knowing C/N counts, the analysis based on mass difference alone is not accurate. For example, our LC buffer contains ammonium acetate which is a common mobile phase additive. This leads to extensive [M+NH4]+ and [M+CH3COO]− adducts with mass difference of 17.0265 and 60.0211 from [M+H]+ and [M-H]− ions, respectively. Ions matching these mass differences can also come from unrelated metabolites or from fragmentation. When the cause of the mass difference is fragmentation, the metabolite peak is the heavier one. Conversely, when the cause is adduct formation, the metabolite peak is the lighter one.
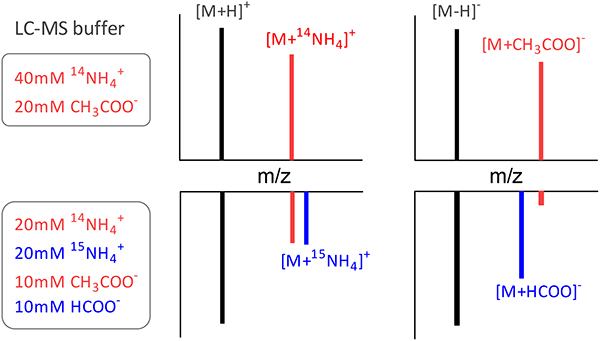
To annotate accurately metabolite peaks, we must distinguish these possibilities. To this end, here we modified the LC buffer by replacing half of the 14NH3-acetate with 15NH3-formate. This results in robust mass and intensity shifts in adduct ions specifically (e.g. ammonia adduct ions now appear as a pair of similar intensity peaks separated by 0.997 amu). Incorporation this additional information allowed us to develop a Buffer Modification Workflow (BMW), which is suitable for the untargeted analysis of samples that are not readily isotope labeled.
Experimental section.
LC-MS and buffer modification
LC used a Vanquish UHPLC system (Thermo Fisher) and Xbridge BEH Amide column (Waters) with 25 min HILIC gradient [8]. Solvent A is 95:5 water:acetonitrile with 20 mM ammonium hydroxide (14NH4OH) and 20 mM ammonium acetate (CH3COO14NH4), pH 9.4 [19]. Solvent B is acetonitrile. We designated this buffer system as “Buffer-1”. For modified buffer (“Buffer-2”), solvent A is 95:5 water:acetonitrile with 10 mM 14NH4 OH, 10 mM 15NH4OH, 10 mM CH3 COO15NH4 and 10 mM HCOO14NH4 resulting in 20 mM 14NH4+, 20 mM 15NH4+, 10 mM CH3COO− and 10 mM HCOO−. Solvent B is acetonitrile. LC was coupled to a QExactive Plus mass spectrometer to perform MS1 scan from m/z 70 to 1000, with a resolving power of 160,000 at m/z 200 and 80,000 at m/z 800.
S. cerevisiae metabolome analysis
S. cerevisiae strain FY4 was grown at 30°C in medium containing 1.7 g/L YNB without vitamin and amino acids (Sunrise, #1524), 0.002 mg/L biotin, 20 g/L glucose as carbon source, and 5 g/L (NH4)2SO4 as nitrogen source. Cells were grown under the following four labeling conditions: unlabeled, 13C, 15N and 13C/15N. Labeling was carried out for > 10 generations. Cells were harvested at OD600=0.80 by filtering and metabolites were extracted using 40:40:20:0.5% FA (acetonitrile:methanol:water:formic acid), followed by neutralization with 15% NH4HCO3 [24]. For unlabeled cultures, additional samples were collected at OD600=0.02 using same volume of extraction solvent to serve as a procedure blank which can be used to annotate “Background” peaks. All samples were analyzed in triplicate with Buffer-1, with additional runs applying in-source CID at 5 and 10 eV for unlabeled samples. In addition, the unlabeled samples were also analyzed with Buffer-2.
Mouse liver metabolome analysis
Twelve-month-old female wild-type C57BL/6 mice (Jackson Laboratory, Bar harbor, ME) on normal diet were sacrificed by cervical dislocation and tissues quickly dissected and snap frozen in liquid nitrogen with precooled Wollenberger clamp. To extract metabolites, frozen liver tissue samples were first weighed individually (~20 mg each sample) and ground with a cryomill machine (Retsch, Newtown, PA) maintained at cold temperature using liquid nitrogen. Samples were then extracted using 40:40:20:0.5% FA (acetonitrile:methanol:water:formic acid), followed by neutralization with 15% NH4HCO3. A procedure blank was generated identically without tissue. All samples were analyzed in triplicate with Buffer-1, with additional runs of in-source CID at 5 and 10 eV for liver extract. In addition, the liver extract was also analyzed with Buffer-2.
24-hour stability of fresh liver extract
Additional samples were generated to evaluate the stability of liver extract. 1.5 mL fresh liver extract was prepared as above, and transferred into a glass vial. The vial was loaded into LC autosampler maintained at 5 °C, and continuously analyzed over 24-hour period using the same LC-MS method. We estimate that there was approximately a 2-hour delay from the beginning of the extraction to the first time point.
Synthesis of formyl-serine from serine and formate in extraction solvent
Serine powder was dissolved into water at 1 mg/mL. 10 μL of this stock solution was added to 1 mL 40:40:20:0.5% FA (acetonitrile:methanol:water:formic acid) in a glass vial, vortexed, and allowed to sit on ice for 5 minutes followed by adding 84 μL of 15% NH4HCO3. The vial was transferred to the autosampler maintained at 5 °C and analyzed continuously for 24 hours using the above 25 min LC-MS method in negative mode. Control samples with serine standard alone in 50:50 methanol:H2O at 10 μg/mL and extraction solvent alone were analyzed in parallel.
Data analysis
Raw LC-MS data were converted to mzXML format using the command line “msconvert” utility [25]. The BMW analysis starts with a peak list generated from triplicate samples of interest using El-Maven software [26]. We specify that “100% peaks above minimum quality” in order to find those peaks showing up in all three replicates. Duplicate peaks were removed with m/z and RT tolerance of 10 ppm and 0.1 min. Peaks were annotated based on a set of rules as described below.
Results and discussion.
Overall strategy
We aimed to develop a workflow for peak annotation of samples that are not readily isotope labeled, such as liver extract. We initially sought to assign peaks into 5 major categories: “Background,” “Isotope,” “Adduct,” “Fragment,” or “Putative metabolite.” Later, we added a category for peaks that are formed by chemical reactions of metabolites with the extraction buffer and therefore increase over time after initial sample preparation (“Reaction product”) (Figure 1). Additional less common artifacts were added as subcategories of the main categories, such as Fourier transform artifact peaks [27, 28] and dimers.
Fig 1.
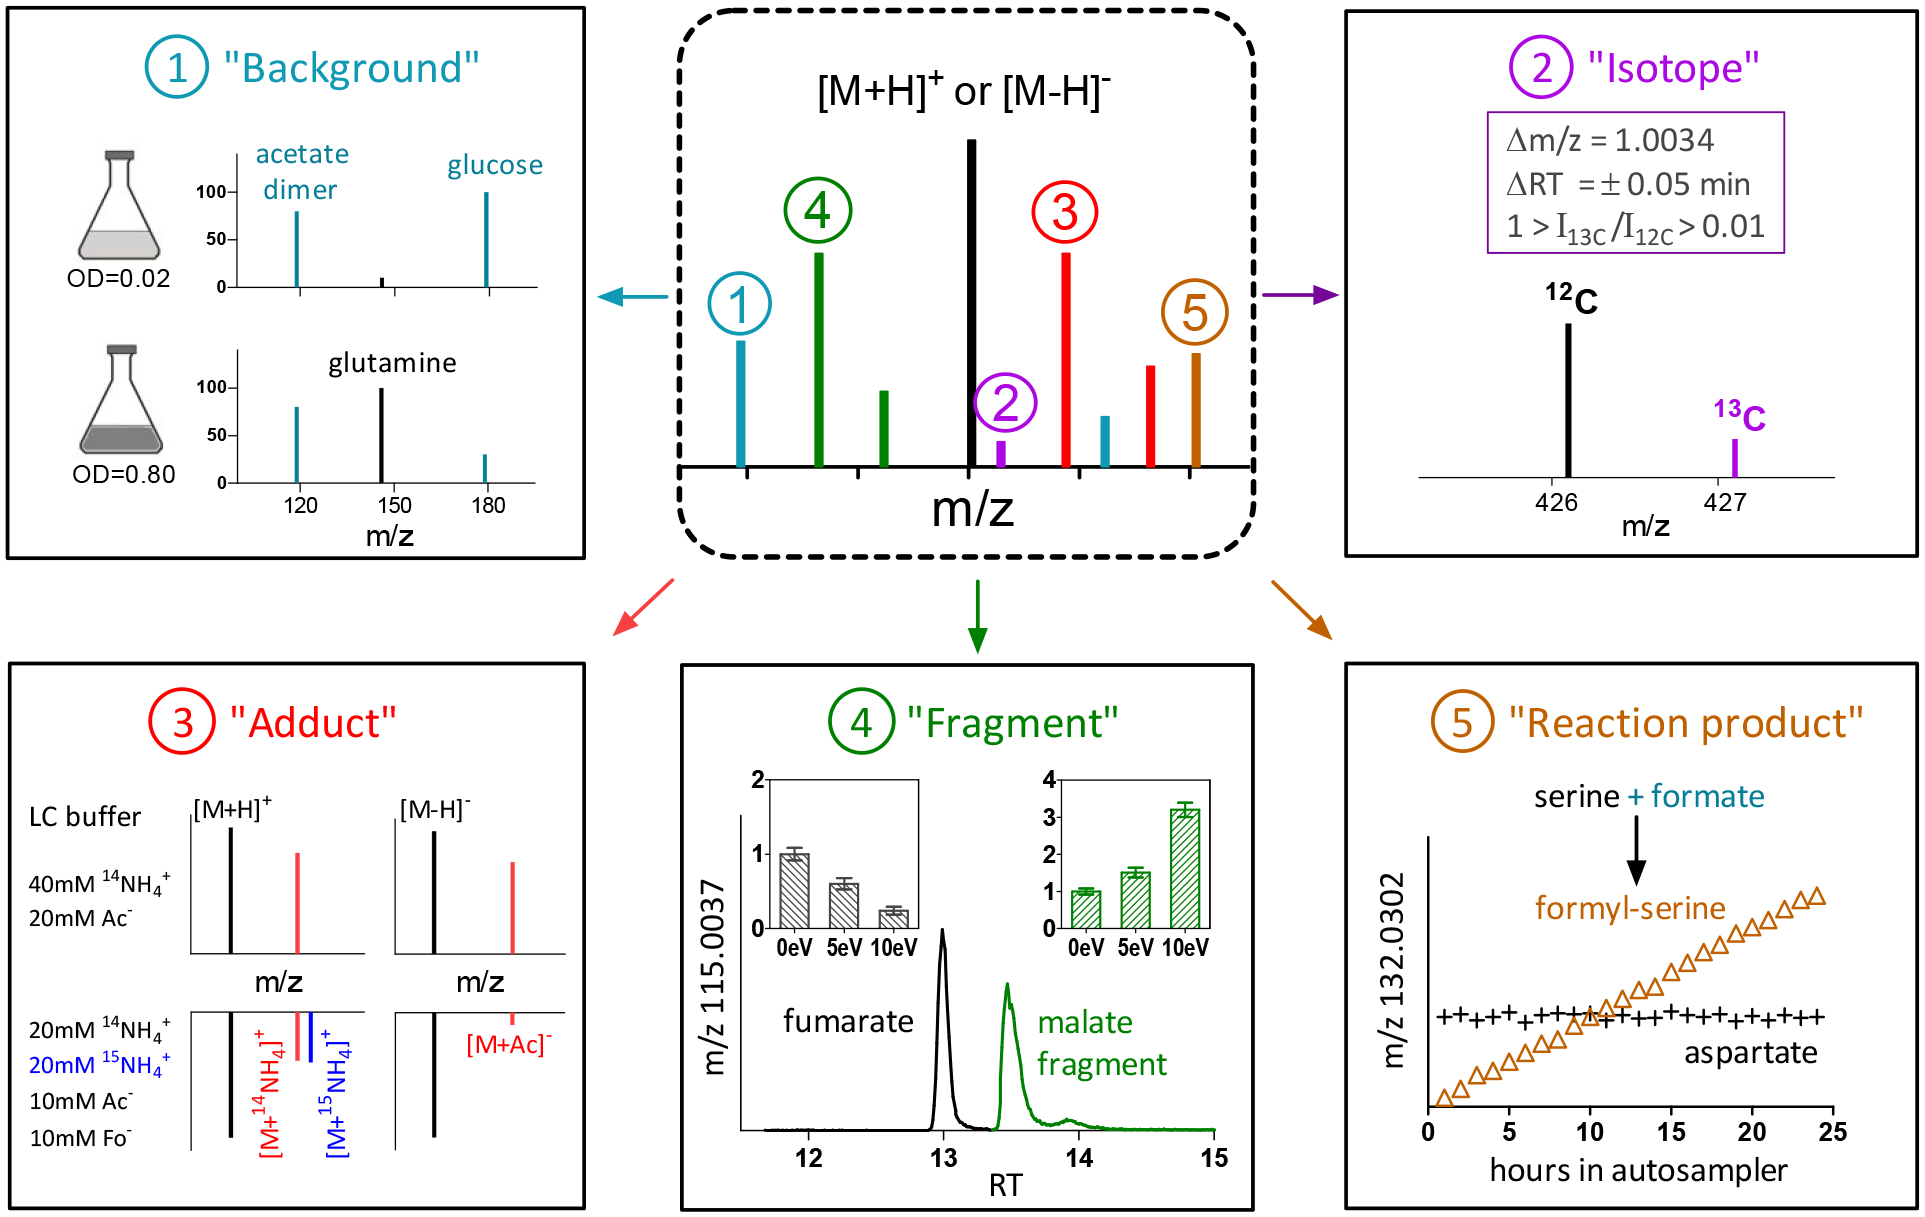
Five major peak annotation categories. (1) “Background” ions were annotated based on whether the peak intensity is < 2-fold of that in procedure blank. (2) “Isotope” peaks were annotated based on Δm/z match, RT match and intensity ratio within set range. (3) “Adduct” peaks were annotated similar to “Isotope”, with use of buffer modification to annotate accurately [M+NH4]+ and [M+CH3COO]− adducts. See Fig 2 and Fig 3 for more details. Ac−: CH COO−. Fo−: HCOO−.(4) “Fragment” peaks were annotated based on whether the peak intensity increases with 5 or 10 eV of in-source CID compared to 0 eV. The chromatogram of fumarate shows the peak of fumarate itself (13.0 min) (which falls in intensity with increasing CID) and a fragment from malate (13.5 min), which rises. (5) “Reaction product” refers to peaks that increase after extraction as sample sits inside the autosampler at 5 °C. These peaks can arise from the reactions between endogenous metabolites and the extraction buffer.
To establish the rules for each category, we relied on fundamental principles (e.g. background peaks should be similar in samples and procedure blanks) and chose the initial quantitative cutoffs based on roughly 200 manually selected known metabolite peaks in positive mode, and a similar number in negative mode. For fragments, the fundamental principle was increasing signal with a weak in source collision-induced dissociation voltage. For adducts, it was altered signal in the modified LC running buffer. Quantitative cutoffs were then refined by examining additional peaks whose annotation had been determined using isotope-labeled yeast samples.
BMW annotation rules
(1) “Background”: Peaks with intensity < 2-fold of “procedure blank”.
(2a) “FTMS artifact”: Low intensity “ringing” or “satellite” peaks > 2 order of magnitude smaller than their parents and located within ± 800 ppm m/z window [28]. Such peaks occur in Orbitrap and FT ICR MS but not time-of-flight.
(2b) “Isotope”: Isotopes were annotated based on three criteria: Δm/z match with a tolerance of ± 3 ppm, RT match with a tolerance of ± 0.05 min, and intensity ratio Iisotope/Imetabolite within set ranges based on the isotope’s natural abundance (Figure S1, Table S1).
(3a) “Adduct”: Adducts were first annotated using a general rule similar to isotopes. The three criteria were Δm/z match, RT match with a tolerance of ± 0.05 min, and intensity ratio Iadduct/Imetabolite within set ranges (Table S1). Δm/z tolerance of ± 3 ppm was used for all adducts except sodium adduct for which ± 1.5 ppm is used. This is due to the fact that [Na-H] and [C2-H2] have very similar masses (21.9819 vs. 21.9844) (Figure S1). The intensity ratio criteria were determined empirically based on data from a list of known adducts (Figure S2 & S3, Table S1).
(3b) “NH4+ and CH3COO− adduct”: The above rules are insufficient to annotate NH4+ and CH3COO− adducts for two reasons. First, due to the high concentrations of NH4+ and CH3COO− in LC buffer, the adduct intensity can be very high, sometimes far above the parent ion (Figure S2 & S3, Table S1). This is not, however, consistently the case – it depends on the intrinsic ionization properties of both the metabolite and the adduct – so we cannot discriminate such adducts based on intensity ratios. Secondly, for any pair of ions with the relevant Δm/z of ammonia or acetate, their relationship is nevertheless unclear: (i) the higher mass ion may be an adduct of the lower mass one, (ii) the lower mass ion may be a fragment of the higher mass one, or (iii) they may be biologically distinct. LC buffer modification distinguishes the adducts from the other two situations. In the modified buffer containing equal amounts of 14NH4+ and 15NH4+, the 14NH4+ adduct intensity decreases and a similar size peak appears at 0.997 m/z higher mass. Specifically, BMW requires the 14N and 15N peaks in the modified buffer to have an intensity ratio between 0.5 to 1.5 with Δm/z = 0.997 and m/z tolerance of ± 3 ppm (Figure 2). Similarly, in the modified buffer, half of the acetate is replaced by formate, resulting in lower acetate adduct signals. In practice, the 50% reduction of acetate in the LC running buffer produces at least a 2-fold decline in the acetate adduct signals, because the added formate also competes with the remaining acetate. Therefore, after normalizing to the [M−H]− peak intensity, BMW requires a > 2-fold intensity decrease in the modified buffer to annotate a peak as an acetate adduct (Figure 3).
Fig 2.
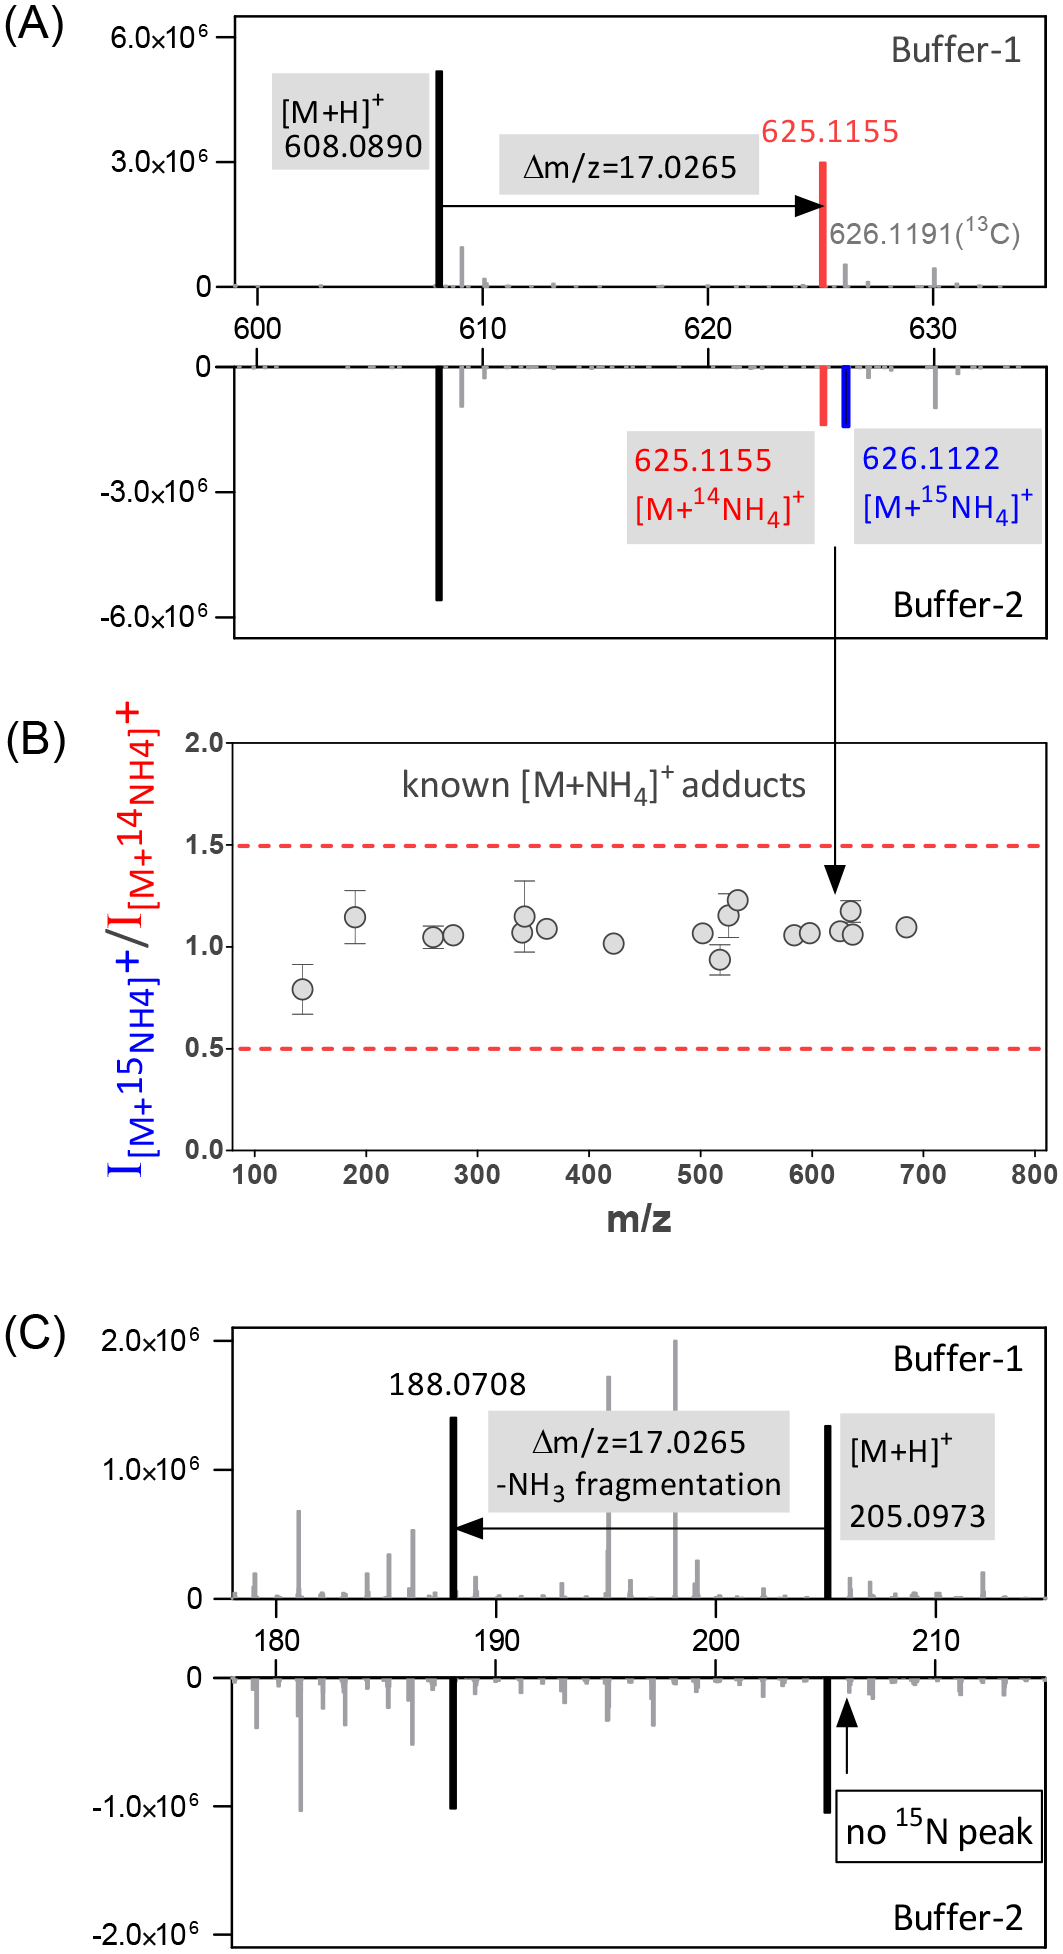
Annotation of ammonium adducts in positive mode is achieved by running the same sample in LC Buffer-1 which contains 40 mM 14NH4+, and Buffer-2 which contains 20mM 14NH4+ and 15NH4+. (A) For ammonium adducts, under Buffer-2, there is a pair of peaks of [M+14NH4]+ and [M+15NH4]+ with similar intensity (shown here for the metabolite UDP-N-acetylglucosamine). (B) In Buffer-2, the relative intensity of the 15N and 14N ammonia adduct peaks is consistently within 0.5 −1.5 (shown here for 18 known ammonium adducts). (C) Fragmentation with a loss of NH3 can be distinguished from adduct formation based on the absence of the 15N peak under Buffer-2 (shown here for the metabolite tryptophan).
Fig 3.
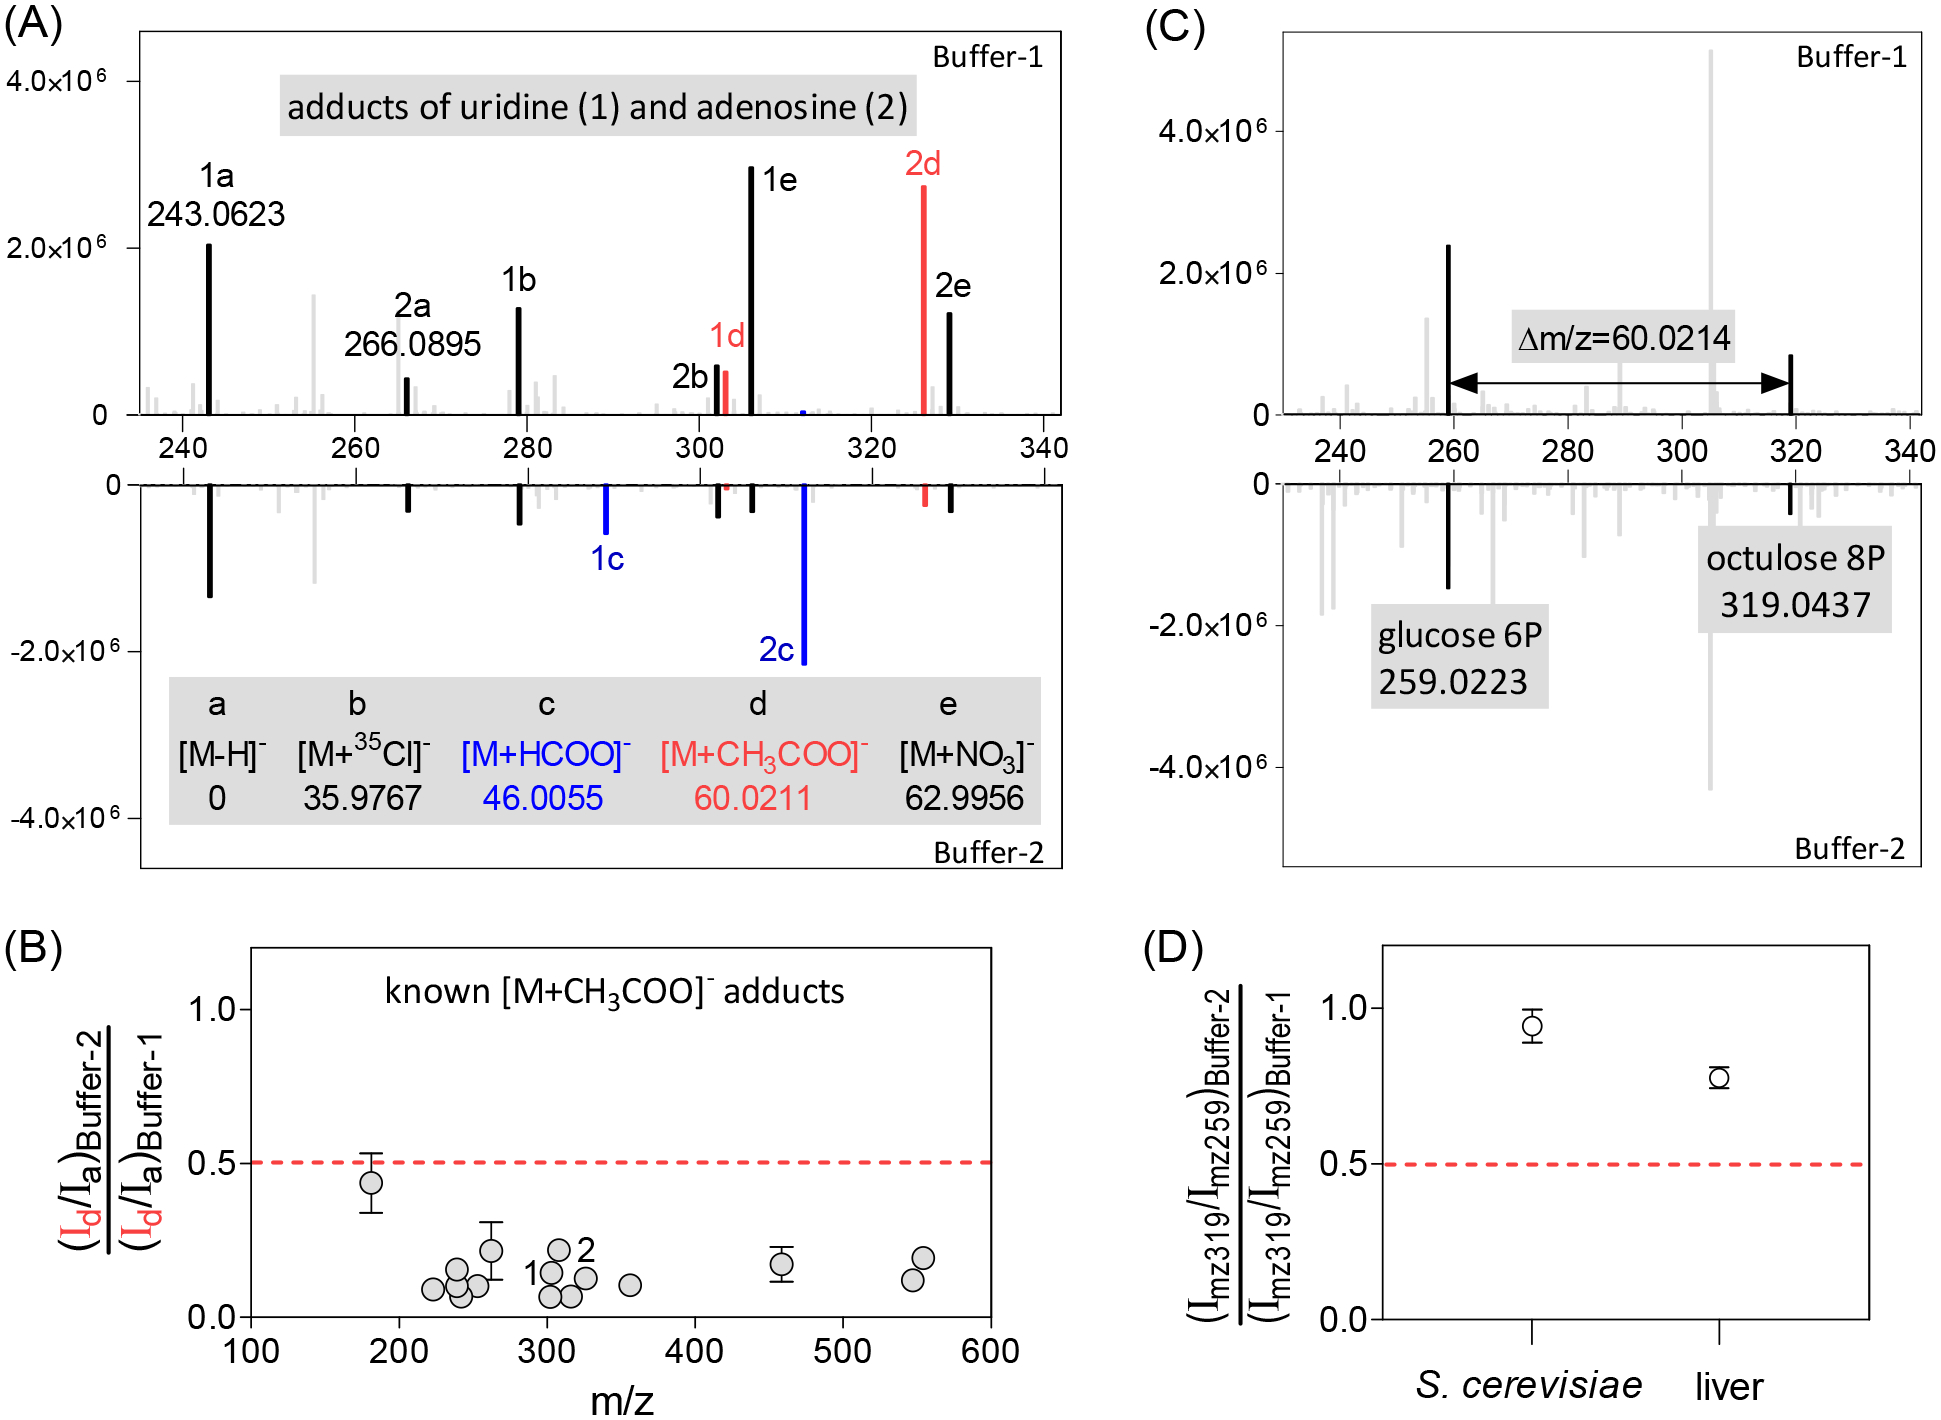
Annotation of acetate adducts in negative mode is achieved by running the same sample in LC Buffer-1 which contains 20 mM acetate, and Buffer-2 which contains 10 mM acetate and 10 mM formate. (A, B) For acetate adducts, peak intensity decreases >2-fold when switching buffer, after normalizing to the deprotonated peak intensity, as seen for 16 acetate adducts of known metabolites including uridine and adenosine. (C) The molecular formula of acetate (C2H4O2) is the same as two carbon units in a carbohydrate molecule (2 × CHOH). Acetate adducts can be distinguished from larger carbohydrates based on their response to Buffer-2. For example, at the retention time of glucose-6-phosphate (m/z 259.0223), there is an ion at m/z of 319.0437. (D) After normalizing to m/z 259 peak, the intensity of the m/z 319 peak does not decrease >2-fold. This indicates that the ion at m/z 319.0437 is not the acetate adduct of glucose-6-phosphate. Instead, it corresponds to the larger phosphorylated carbohydrate octulose-8-phosphate.
(3c) “Buffer sensitive”: Most known metabolite [M+H]+ and [M−H]− peaks did not change markedly in retention time or intensity with buffer switching (Figure 2 & 3). In contrast, many other peaks did. As seen in Figure 3, the formate adducts, acetate adducts, and NO3− adducts of uridine and adenosine change more than the deprotonated ions from Buffer-1 to Buffer-2. We wondered if peak intensity change with buffer switching could be used to filter metabolite from adduct peaks. To this end, we compared all yeast peaks to yeast metabolite peaks annotated using the PAVE workflow (~500 metabolite peaks both in positive and in negative mode) (Table S4). We found that the metabolite peaks were much less likely to change dramatically with buffer switching (Figure 4). Accordingly, we filtered out peaks with intensity changes with buffer switching exceeding 95% of metabolite peaks. At the expense of losing 5% of metabolite peaks, this filtering removed ~ 30% of total peaks.
Fig 4.
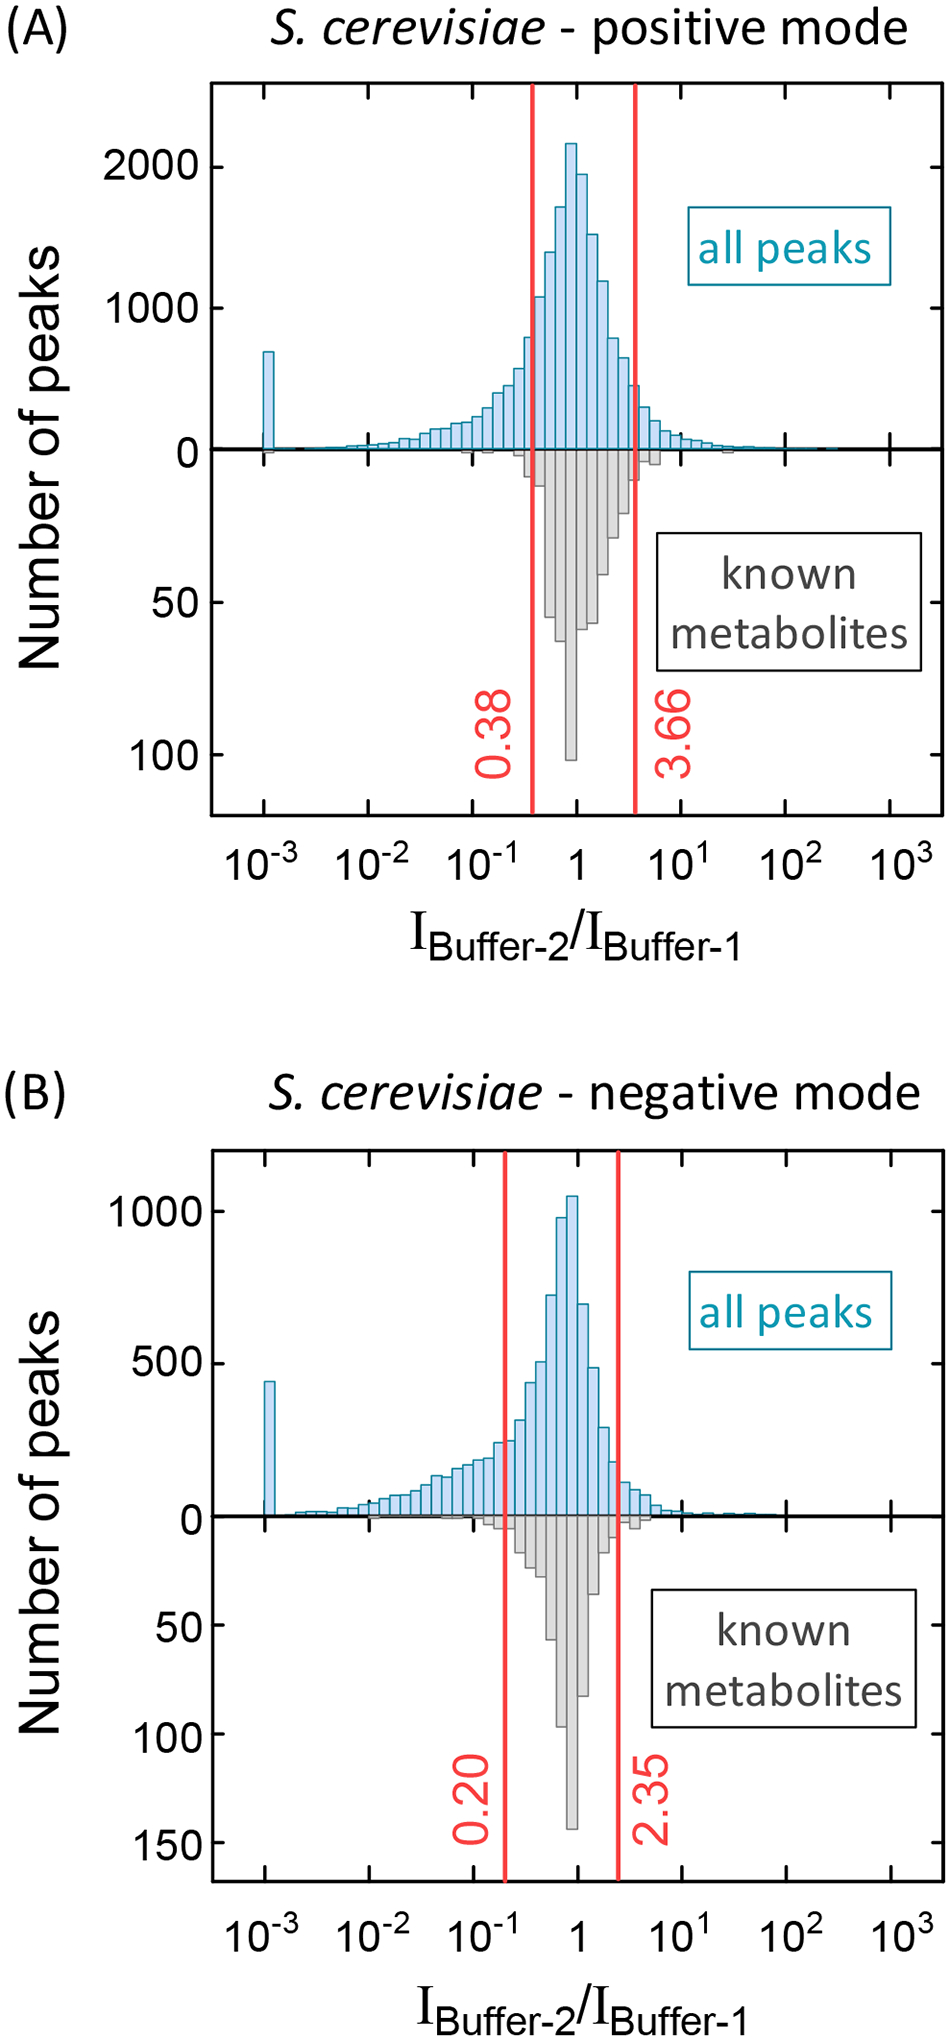
Peaks showing greater intensity changes in response to buffer switching than 95% of known metabolites are categorized by BMW as “Buffer sensitive.” Buffer sensitive peaks are likely to be unknown adducts, rather than metabolite [M+H]+ or [M−H]− ions. There is a cluster of peaks that essentially disappear with buffer switching (intensity ratio around 0.001). (A) Positive mode yeast data for all peaks versus known metabolites. (B) Negative mode data.
(3d) “Multicharge” and “Dimer”: Multicharge peaks were annotated based on the 13C peak being at higher mass of +1.0034/n, rather than simply +1.0034 (Table S1). For dimers, BMW requires a co-eluting single-charge monomer peak with Δm/z tolerance of ± 3 ppm, RT tolerance of ± 0.05 min, and intensity ratio Idimer/Imonomer <1.
(4) “Fragment”: Fragment peaks are identified based on the intensity increase upon ramping up the in-source CID energy [8]. Peaks with statistically significantly higher intensity with in-source CID of 5 or 10 eV as compared to 0 eV are candidate fragments. Such candidates include (i) actual fragments and (ii) metabolite ions, where the metabolite peak increases with increasing CID because the metabolite is released from adducts (Figure S4). Because we were using ammonium acetate buffer, the adducts that are abundant enough to release substantial metabolite are ammonium and acetate adducts. Accordingly, if a peak was previously annotated (at step 3b) as the parent ion of an ammonium or acetate adduct, it is excluded from being annotated as a fragment. This reinforces the value of the buffer modification to accurately annotate these abundant adducts.
All the remaining peaks were considered as “Putative metabolites” and searched against freely available metabolomics databases (HMDB [29] and KEGG [30]) for formula match with ± 5 ppm m/z tolerance.
Comparison of BMW with PAVE for yeast data
We evaluated the performance of BMW on yeast metabolomics data, using annotations based on isotope-labeling and the PAVE workflow. Both workflows start with the same peak list, from an unlabeled S. cerevisiae sample run in Buffer-1. This list consists of 18460 peaks in positive mode and 8555 peaks in negative mode. The rules used for BMW and PAVE are summarized in Tables S2 and S3. The major difference between BMW and PAVE is that the latter determines the C/N numbers for every peak in unlabeled sample based on mass shifts across unlabeled and labeled samples [8].
Metabolite annotation in PAVE is more stringent than BMW because of the requirement for the molecular formula to match both the metabolite mass and C/N counts. Not surprisingly, BMW found many more metabolites than PAVE: 1068 in positive mode and 853 in negative mode for BMW, versus 473 and 540 for PAVE (Table S4, Figure S5). The number of overlapping is 439 in positive mode and 503 in negative mode. Thus, BMW correctly identified 93% of metabolites found in PAVE.
Chemicals produced after the extract was made
In terms of the putative metabolites annotated in BMW but not PAVE, some of these are compounds like H3PO4 which lack carbon or nitrogen and thus fail to label from 13C or 15N. Others, like palmitate, are found extensively in the environment [31] and thus appear partially unlabeled in the 13C-labeled yeast samples, failing the labeling criteria of PAVE. In these cases, BMW provides the more accurate annotation.
Other putative metabolites found by BMW are overt artifacts that PAVE properly excludes. For example, two peaks were seen in the chromatogram of aspartate at m/z 132.0302 ± 10 ppm in negative mode with different RTs (11.3 min vs 13.6 min, Figure 5A). Both match the formula C4H6NO4−. The MS2 spectrum, however, shows that only the latter peak is aspartate (Figure S6A). Labeling data shows that the 11.3 min peak has 3 carbons (versus 4 for aspartate) (Figure S6B). Both peaks were also seen in liver data (Figure 5B). Repeated analysis of a fresh liver extract that was maintained at 5°C inside the autosampler over 24-hr period shows that the peak intensity of aspartate is steady, while the earlier-eluting isobaric peak increases dramatically (Figure 5C). Sauerchnig et al showed the potential for methanol to react with metabolites to generate artifactual peaks [32]. We later found out that the 11.3 min peak appears upon addition of pure serine, a three carbon metabolite, to clean extraction buffer which contains methanol, acetonitrile, and formic acid (Figure 5D). Thus, this peak is formyl-serine. Multiple other formyl amino acid ex vivo reaction products were found (Table S4): id 12, formyl-threonine; id 395, formyl-glutamine; id 1201, formyl-glycine; id 2640, formyl-asparagine.
Fig 5.
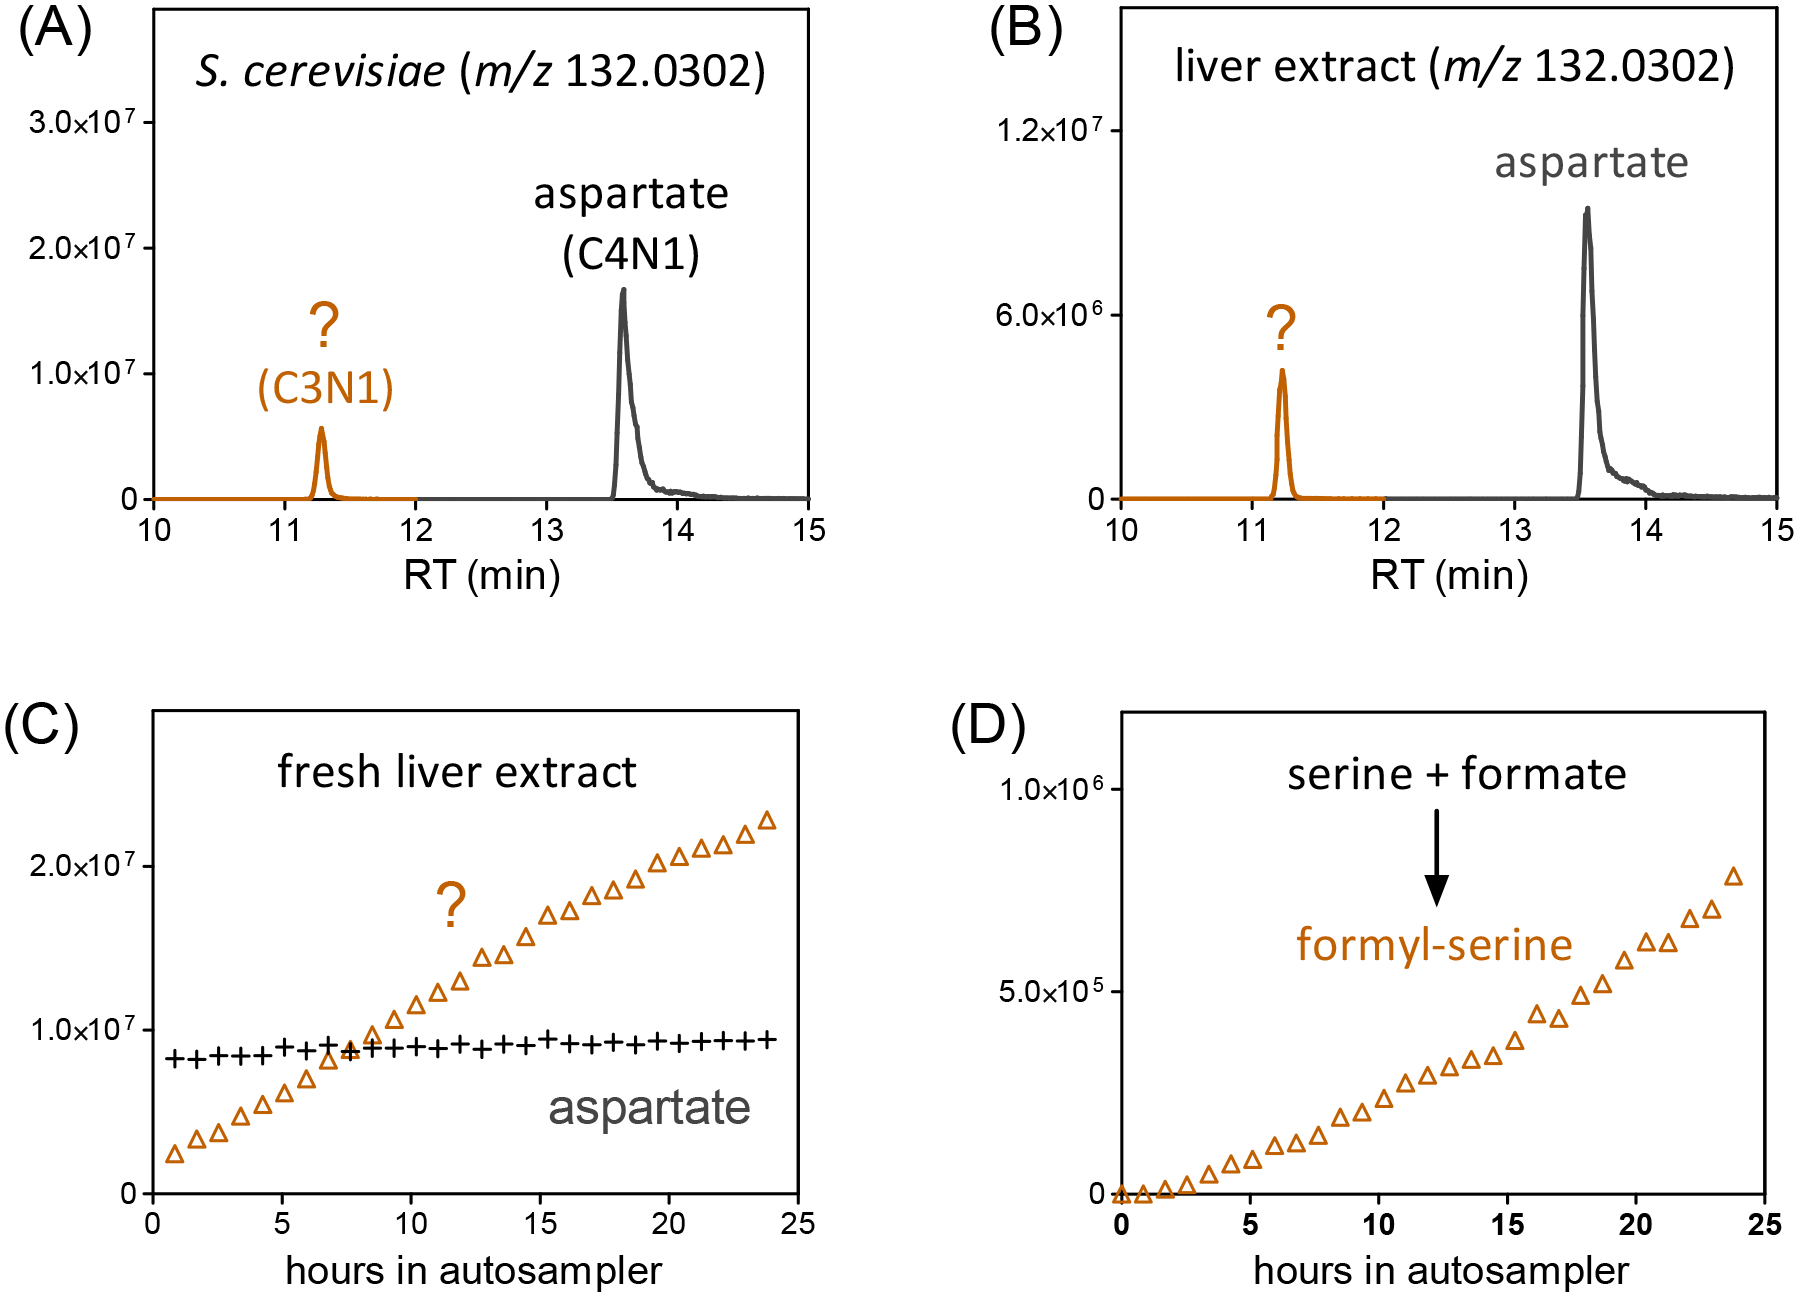
Chemicals can be made by reaction of extraction buffer components with metabolites. (A) The ion-specific chromatogram at aspartate m/z (132.0302 ± 10ppm) in negative mode from S. cerevisiae extract shows two prominent peaks. Both match a formula of C4H6NO4−. MS2 spectra shows that the 13.6 min peak is aspartate, while the 11.3 min peak is an unknown (Figure S6A). Labeling experiments show that the aspartate peak as expected has 4 carbons that label, while the 11.3 min peak has only 3, implying non-biological assimilation of one unlabeled carbon (Figure S6B). (B) Both peaks were also detected in liver extract. (C) The intensity for the 11.3 min peak increases as sample sits in the autosampler, while the aspartate peak is steady. (D) The 11.3 min peak is formyl-serine, and appears upon adding pure serine to the extraction solvent (40:40:20 acetonitrile:methanol:H2O with 0.5% formic acid).
Such ex vivo reaction products can easily be weeded out based on their increasing over time in the autosampler, a criterion that we incorporated into the BMW workflow (Figure 1, Table 1).
Table 1.
Workflow for liver untargeted metabolomics data analysis, showing the datasets used for different annotation steps.
| Steps | Notes | Buffer-1 | Buffer-2 | ||||
|---|---|---|---|---|---|---|---|
| procedure blank | liver extract at 0eV | liver extract at 5/10eV | 24-hr stability | liver extract at 0eV | |||
| Peak extraction | Finding all peaks in liver extract (m/z and RT) | X | |||||
| Annotation | 1 | “Background”: peaks in liver extract with intensity < 2-fold of that in “procedure-blank” | X | X | |||
| 2a | “FTMS artifact”: ringing peaks around strong intensity ions | X | |||||
| 2b | “Isotope” | X | |||||
| 3a | “Adduct”: other than NH4+ and CH3COO− | X | |||||
| 3b | NH4+ and CH3COO− adducts | X | X | ||||
| 3c | “Buffer sensitive”: peaks with large intensity change when switching buffer | X | X | ||||
| 3d | “Multicharge”/”Dimer” | X | |||||
| 4 | “Fragment”: peaks with intensity increasing significantly at 5 or 10 eV of in-source CID, with special rules for peaks with abundant adducts | X | X | ||||
| 5 | “Reaction product”: peaks with intensity increasing > 2-fold during 21-hr period after extract preparation | X | |||||
| Metabolite identification | Remaining peaks are considered “Putative metabolite” and searched against database to find formula matches | X | |||||
(5) “Reaction product”: Any peak that increases more than 2-fold over 21-hour period starting from a fresh extract.
Validation of BMW using known peaks in liver
We further evaluated the performance of BMW using the manually curated list of known metabolite, adduct, and fragment peaks which was initially used to set up the rules. This was done by running the BMW procedure on the liver extract, as opposed to the yeast extracts used for workflow development. For 196+212 known metabolites (positive+negative mode), BMW correctly annotated 187+201 (95% properly annotated as metabolites) (Table S5). Two points should be noted here. Some of the misannotated metabolites were categorized as “Buffer sensitive.” This is as statistically expected (Figure 4). Secondly, half of these misannotated metabolites were correctly annotated in opposite ionization mode, showing the value of using both ionization modes for more complete coverage.
For 93+126 known adducts, 82+121 were correctly annotated as adducts with additional 5+2 annotated as “Buffer sensitive” (95% properly annotated as either “Adduct” or “Buffer sensitive”) (Table S5). For 21 [M+NH4]+ adducts in positive mode and 16 [M+CH3COO]− adducts in negative mode, 20+15 were correctly annotated with the 2 others annotated as “Buffer sensitive”. For 65+51 fragments, 61+49 were correctly annotated (95% properly annotated as fragments).
Global peak annotations in liver extract
For liver data, we detected a total of 16508+10309 peaks (positive+negative mode) with intensity >103 (Table S6 &S7). Many peaks were removed based on previously well-recognized classes of LC-MS artifact: “Background” (4289+2043), “Isotope” (2742+1714), “Adduct” (1446+1417), and “Fragment” (638+417). Strikingly, even after such removal, large number of peaks were annotated as “Buffer sensitive” (1627+972) and “Reaction product” (1032+366). Thus, these additional filters efficiently clean up peaks that are not likely to be metabolites.
The analysis results in a total of 4197+2806 putative metabolites (positive+negative mode), among which 1422+1195 match database formula. Peaks with matched formula represent diverse compound classes, from polar water-soluble metabolites to nonpolar lipid species. Compared to the Mouse Multiple Tissue Metabolome Database which contains 219 known polar metabolites in mouse liver [33], the present study is a significant expansion in terms of number of putative metabolites that can be detected, with definitive identification using MS2 and/or RT comparison with authentic standards ongoing [34–36].
Regarding peaks without formula match, some could be unannotated LC-MS artifacts (e.g, adducts, fragments), while some could be true metabolites. Some of these peaks might match alternative metabolomics databases that were not searched here [37]. We found that some such peaks arise from signal overlap between multiple metabolites, generating an erroneous mass that does not precisely match either compound. For example, the peak at m/z 808.5801 (Table S6, id 8857, not annotated) has the contribution from two overlapping peaks, m/z 808.5851 (12C46H83NO8P+ or 12C-PC 38:5) and m/z 808.5759 (13C212C44H81NO8P+, or13C2-PC 36:3) (Figure S7), resulting in an intermediate measured mass that does not correspond to any actual metabolite.
Conclusion.
Building on substantial recent progress in annotating untargeted LC-MS metabolomics data [38], here we address a key bottleneck: adduct annotation. We show that switching the LC running buffer enables robust annotation of ammonium and acetate adducts, which are otherwise hard to differentiate from fragmentation events or actual distinct metabolites. The buffer switching generally has limited effects on the intensities of metabolite peaks ([M+H]+ and [M−H]−), but substantially changes the intensities of many other peaks, most of which are likely unannotated adducts. In addition, we show that roughly 5% of peaks accumulate during extract storage, and therefore are some form of abiotic reaction product [39].
In liver extract, across positive and negative mode, the buffer modification workflow pulls out about 7000 putative metabolite peaks from over 27,000 total peaks. A majority of these do not match any known metabolite molecular formula. This is particularly true of less abundant peaks (peak height < 105 ion counts), while the more abundant peaks (> 106 ion counts) mainly match known metabolites. Further work is required to confirm the identities of peaks with formula match and identify abundant peaks lacking formula match. It remains to be determined whether the numerous less abundant peaks lacking formula match mainly arise from yet-to-be-discovered analytical artifacts or novel metabolites.
Supplementary Material
Acknowledgement
We thank members of Rabinowitz lab for input. This research is supported by NIH Grants DP1DK113643, P30DK019525 and DOE Grant DE-SC0018420 to J.D.R.; NIH Grant R50CA211437 to W.L. M.R.M is supported by both the Howard Hughes Medical Institute and the Burroughs Wellcome Fund via the Hanna H. Gray Fellows and Postdoctoral Enrichment Programs.
Footnotes
Supporting information
Supporting experimental methods for cell culture and metabolite extraction, LC-MS, and data analysis; supporting tables of BMW and PAVE workflow for S. cerevisiae data analysis, summary of liver LC-MS peak annotation; supporting figures of the statistical distributions of the relative Δm/z errors for all the pairwise peaks matching the expected mass differences of 13C-12C, C2H4O2, and Na-H, the intensity ratio Iadduct/Imetabolite for selected known adducts, metabolite ions that behave like fragments when examined by in-source CID due to the presence of abundant adduct ions, comparison of the annotation of “Metabolite” for S. cerevisiae using BMW and PAVE, MS2 and labeling analysis of the two peaks in the chromatogram of aspartate, annotation problem resulting from two ions with similar masses that are not fully resolved, TIC of liver extract and EICs of selected metabolites in Buffer-1 and Buffer-2. (PDF)
Parameter setting for “Isotope” and “Adduct” annotation (Excel table)
Results of S. cerevisiae data annotation using PAVE and BMW (Excel table)
Validation of BMW using known metabolite, adduct and fragment peaks in liver data (Excel table) Results of liver data annotation (Excel table)
References
- 1.Uppal K; Walker DI; Liu K; Li S; Go YM; Jones DP Computational Metabolomics: A Framework for the Million Metabolome. Chem Res Toxicol 2016, 29, 1956–1975. [DOI] [PMC free article] [PubMed] [Google Scholar]
- 2.Lu W; Su X; Klein MS; Lewis IA; Fiehn O; Rabinowitz JD Metabolite Measurement: Pitfalls to Avoid and Practices to Follow. Annu Rev Biochem 2017, 86, 277–304. [DOI] [PMC free article] [PubMed] [Google Scholar]
- 3.Blazenovic I; Kind T; Ji J; Fiehn O Software Tools and Approaches for Compound Identification of LC-MS/MS Data in Metabolomics. Metabolites 2018, 8, 31. [DOI] [PMC free article] [PubMed] [Google Scholar]
- 4.Guo X; Bruins AP; Covey TR Characterization of typical chemical background interferences in atmospheric pressure ionization liquid chromatography-mass spectrometry. Rapid Commun Mass Spectrom 2006, 20, 3145–3150. [DOI] [PubMed] [Google Scholar]
- 5.Xu YF; Lu W; Rabinowitz JD Avoiding Misannotation of In-Source Fragmentation Products as Cellular Metabolites in Liquid Chromatography-Mass Spectrometry-Based Metabolomics. Analytical Chemistry 2015, 87, 2273–2281. [DOI] [PMC free article] [PubMed] [Google Scholar]
- 6.Mahieu NG; Patti GJ Systems-Level Annotation of a Metabolomics Data Set Reduces 25000 Features to Fewer than 1000 Unique Metabolites. Anal Chem 2017, 89, 10397–10406. [DOI] [PMC free article] [PubMed] [Google Scholar]
- 7.Domingo-Almenara X; Montenegro-Burke JR; Benton HP; Siuzdak G Annotation: A Computational Solution for Streamlining Metabolomics Analysis. Anal Chem 2018, 90, 480–489. [DOI] [PMC free article] [PubMed] [Google Scholar]
- 8.Wang L; Xing X; Chen L; Yang L; Su X; Rabitz H; Lu W; Rabinowitz JD Peak Annotation and Verification Engine for Untargeted LC-MS Metabolomics. Anal Chem 2019, 91, 1838–1846. [DOI] [PMC free article] [PubMed] [Google Scholar]
- 9.Damont A; Olivier MF; Warnet A; Lyan B; Pujos-Guillot E; Jamin EL; Debrauwer L; Bernillon S; Junot C; Tabet JC; Fenaille F Proposal for a chemically consistent way to annotate ions arising from the analysis of reference compounds under ESI conditions: A prerequisite to proper mass spectral database constitution in metabolomics. J Mass Spectrom 2019, 54, 567–582. [DOI] [PubMed] [Google Scholar]
- 10.Erngren I; Haglof J; Engskog MKR; Nestor M; Hedeland M; Arvidsson T; Pettersson C Adduct formation in electrospray ionisation-mass spectrometry with hydrophilic interaction liquid chromatography is strongly affected by the inorganic ion concentration of the samples. J Chromatogr A 2019, 1600, 174–182. [DOI] [PubMed] [Google Scholar]
- 11.Kuhl C; Tautenhahn R; Bottcher C; Larson TR; Neumann S CAMERA: an integrated strategy for compound spectra extraction and annotation of liquid chromatography/mass spectrometry data sets. Anal Chem 2012, 84, 283–289. [DOI] [PMC free article] [PubMed] [Google Scholar]
- 12.Alonso A; Julia A; Beltran A; Vinaixa M; Diaz M; Ibanez L; Correig X; Marsal S AStream: an R package for annotating LC/MS metabolomic data. Bioinformatics 2011, 27, 1339–1340. [DOI] [PubMed] [Google Scholar]
- 13.Uppal K; Walker DI; Jones DP xMSannotator: An R Package for Network-Based Annotation of High-Resolution Metabolomics Data. Anal Chem 2017, 89, 1063–1067. [DOI] [PMC free article] [PubMed] [Google Scholar]
- 14.DeFelice BC; Mehta SS; Samra S; Cajka T; Wancewicz B; Fahrmann JF; Fiehn O Mass Spectral Feature List Optimizer (MS-FLO): A Tool To Minimize False Positive Peak Reports in Untargeted Liquid Chromatography-Mass Spectroscopy (LC-MS) Data Processing. Anal Chem 2017, 89, 3250–3255. [DOI] [PMC free article] [PubMed] [Google Scholar]
- 15.Kachman M; Habra H; Duren W; Wigginton J; Sajjakulnukit P; Michailidis G; Burant C; Karnovsky A Deep annotation of untargeted LC-MS metabolomics data with Binner. Bioinformatics 2019, 36, 1801–1806. [DOI] [PMC free article] [PubMed] [Google Scholar]
- 16.Tsugawa H; Nakabayashi R; Mori T; Yamada Y; Takahashi M; Rai A; Sugiyama R; Yamamoto H; Nakaya T; Yamazaki M; Kooke R; Bac-Molenaar JA; Oztolan-Erol N; Keurentjes JJB; Arita M; Saito K A cheminformatics approach to characterize metabolomes in stable-isotope-labeled organisms. Nat Methods 2019, 16, 295–298. [DOI] [PubMed] [Google Scholar]
- 17.Scheltema R; Decuypere S; Dujardin J; Watson D; Jansen R; Breitling R Simple data-reduction method for high-resolution LC-MS data in metabolomics. Bioanalysis 2009, 1, 1551–1557. [DOI] [PubMed] [Google Scholar]
- 18.Lynn KS; Cheng ML; Chen YR; Hsu C; Chen A; Lih TM; Chang HY; Huang CJ; Shiao MS; Pan WH; Sung TY; Hsu WL Metabolite identification for mass spectrometry-based metabolomics using multiple types of correlated ion information. Anal Chem 2015, 87, 2143–2151. [DOI] [PubMed] [Google Scholar]
- 19.Bajad SU; Lu WY; Kimball EH; Yuan J; Peterson C; Rabinowitz JD Separation and quantitation of water soluble cellular metabolites by hydrophilic interaction chromatography-tandem mass spectrometry. J Chromatogra A 2006, 1125, 76–88. [DOI] [PubMed] [Google Scholar]
- 20.Hegeman AD; Schulte CF; Cui Q; Lewis IA; Huttlin EL; Eghbalnia H; Harms AC; Ulrich EL; Markley JL; Sussman MR Stable isotope assisted assignment of elemental compositions for metabolomics. Anal Chem 2007, 79, 6912–6921. [DOI] [PubMed] [Google Scholar]
- 21.Giavalisco P; Li Y; Matthes A; Eckhardt A; Hubberten HM; Hesse H; Segu S; Hummel J; Kohl K; Willmitzer L Elemental formula annotation of polar and lipophilic metabolites using (13) C, (15) N and (34) S isotope labelling, in combination with high-resolution mass spectrometry. Plant J 2011, 68, 364–376. [DOI] [PubMed] [Google Scholar]
- 22.de Jong FA; Beecher C Addressing the current bottlenecks of metabolomics: Isotopic Ratio Outlier Analysis, an isotopic-labeling technique for accurate biochemical profiling. Bioanalysis 2012, 4, 2303–2314. [DOI] [PMC free article] [PubMed] [Google Scholar]
- 23.Mahieu NG; Huang X; Chen YJ; Patti GJ Credentialing features: a platform to benchmark and optimize untargeted metabolomic methods. Anal Chem 2014, 86, 9583–9589. [DOI] [PMC free article] [PubMed] [Google Scholar]
- 24.Lu W; Wang L; Chen L; Hui S; Rabinowitz JD Extraction and Quantitation of Nicotinamide Adenine Dinucleotide Redox Cofactors. Antioxid Redox Signal 2018, 28, 167–179. [DOI] [PMC free article] [PubMed] [Google Scholar]
- 25.Adusumilli R; Mallick P Data Conversion with ProteoWizard msConvert. Methods Mol Biol 2017, 1550, 339–368. [DOI] [PubMed] [Google Scholar]
- 26.Agrawal S; Kumar S; Sehgal R; George S; Gupta R; Poddar S; Jha A; Pathak S El-MAVEN: A Fast, Robust, and User-Friendly Mass Spectrometry Data Processing Engine for Metabolomics. Methods Mol Biol 2019, 1978, 301–321. [DOI] [PubMed] [Google Scholar]
- 27.Brown M; Wedge DC; Goodacre R; Kell DB; Baker PN; Kenny LC; Mamas MA; Neyses L; Dunn WB Automated workflows for accurate mass-based putative metabolite identification in LC/MS-derived metabolomic datasets. Bioinformatics 2011, 27, 1108–1112. [DOI] [PMC free article] [PubMed] [Google Scholar]
- 28.Mitchell JM; Flight RM; Wang QJ; Higashi RM; Fan TW; Lane AN; Moseley HNB New methods to identify high peak density artifacts in Fourier transform mass spectra and to mitigate their effects on high-throughput metabolomic data analysis. Metabolomics 2018, 14, 125. [DOI] [PMC free article] [PubMed] [Google Scholar]
- 29.Wishart DS; Mandal R; Stanislaus A; Ramirez-Gaona M Cancer Metabolomics and the Human Metabolome Database. Metabolites 2016, 6, 10. [DOI] [PMC free article] [PubMed] [Google Scholar]
- 30.Hattori M; Tanaka N; Kanehisa M; Goto S SIMCOMP/SUBCOMP: chemical structure search servers for network analyses. Nucleic Acids Res 2010, 38, W652–656. [DOI] [PMC free article] [PubMed] [Google Scholar]
- 31.Yao CH; Liu GY; Yang K; Gross RW; Patti GJ Inaccurate quantitation of palmitate in metabolomics and isotope tracer studies due to plastics. Metabolomics 2016, 12, 143. [DOI] [PMC free article] [PubMed] [Google Scholar]
- 32.Sauerschnig C; Doppler M; Bueschl C; Schuhmacher R Methanol Generates Numerous Artifacts during Sample Extraction and Storage of Extracts in Metabolomics Research. Metabolites 2017, 8, 1. [DOI] [PMC free article] [PubMed] [Google Scholar]
- 33.Sugimoto M; Ikeda S; Niigata K; Tomita M; Sato H; Soga T MMMDB: Mouse Multiple Tissue Metabolome Database. Nucleic Acids Res 2012, 40, D809–814. [DOI] [PMC free article] [PubMed] [Google Scholar]
- 34.Sumner LW; Amberg A; Barrett D; Beale MH; Beger R; Daykin CA; Fan TW; Fiehn O; Goodacre R; Griffin JL; Hankemeier T; Hardy N; Harnly J; Higashi R; Kopka J; Lane AN; Lindon JC; Marriott P; Nicholls AW; Reily MD; Thaden JJ; Viant MR Proposed minimum reporting standards for chemical analysis Chemical Analysis Working Group (CAWG) Metabolomics Standards Initiative (MSI). Metabolomics 2007, 3, 211–221. [DOI] [PMC free article] [PubMed] [Google Scholar]
- 35.Schymanski EL; Jeon J; Gulde R; Fenner K; Ruff M; Singer HP; Hollender J Identifying small molecules via high resolution mass spectrometry: communicating confidence. Environ Sci Technol 2014, 48, 2097–2098. [DOI] [PubMed] [Google Scholar]
- 36.Kind T; Tsugawa H; Cajka T; Ma Y; Lai Z; Mehta SS; Wohlgemuth G; Barupal DK; Showalter MR; Arita M; Fiehn O Identification of small molecules using accurate mass MS/MS search. Mass Spectrom Rev 2018, 37, 513–532. [DOI] [PMC free article] [PubMed] [Google Scholar]
- 37.Guijas C; Montenegro-Burke JR; Domingo-Almenara X; Palermo A; Warth B; Hermann G; Koellensperger G; Huan T; Uritboonthai W; Aisporna AE; Wolan DW; Spilker ME; Benton HP; Siuzdak G METLIN: A Technology Platform for Identifying Knowns and Unknowns. Anal Chem 2018, 90, 3156–3164. [DOI] [PMC free article] [PubMed] [Google Scholar]
- 38.Sindelar M; Patti GJ Chemical Discovery in the Era of Metabolomics. J Am Chem Soc 2020, 142, 9097–9105. [DOI] [PMC free article] [PubMed] [Google Scholar]
- 39.Evans AM; Mitchell MW; Dai H; DeHaven CD Categorizing Ion-Features in Liquid Chromatography/Mass Spectrometry Metabolomics Data. Metabolomics 2012, 2, 110. [Google Scholar]
Associated Data
This section collects any data citations, data availability statements, or supplementary materials included in this article.