

Abstract
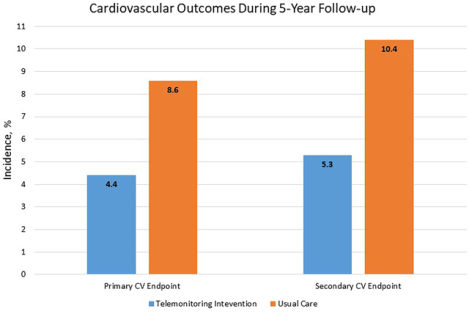
Uncontrolled hypertension is a leading contributor to cardiovascular (CV) disease. A cluster-randomized trial in 16 primary care clinics showed that 12 months of home blood pressure (BP) telemonitoring and pharmacist management lowered BP more than usual care for 24 months. We report CV events (non-fatal myocardial infarction [MI], non-fatal stroke, hospitalized heart failure (HF), coronary revascularization, and CV death) and costs over 5 years of follow-up. In the telemonitoring intervention (TI group, n=228) there were 15 CV events (5 MI, 4 stroke, 5 HF, 1 CV death) among 10 patients. In usual care (UC group, n=222) there were 26 events (11 MI, 12 stroke, 3 HF) among 19 patients. The CV composite endpoint incidence was 4.4% in the TI group vs. 8.6% in the UC group (OR = 0.49, 95% CI: 0.21 – 1.13, p=.09). Including 2 coronary revascularizations in the TI group and 10 in the UC group, the secondary CV composite endpoint incidence was 5.3% in the TI group vs. 10.4% in the UC group (OR = 0.48, 95% CI: 0.22–1.08, p=.08). Microsimulation modeling showed the difference in events far exceeded predictions based on observed BP. Intervention costs (in 2017 U.S. dollars) were $1,511 per patient. Over 5 years, estimated event costs were $758,000 in the TI group and $1,538,000 in the UC group for a return on investment of 126% and a net cost savings of about $1,900 per patient. Telemonitoring with pharmacist management lowered BP and may have reduced costs by avoiding CV events over 5 years.
Keywords: Hypertension, blood pressure, self-monitoring, telemonitoring, pharmacist, team-based care, economics
Graphical Abstract
Introduction
Uncontrolled high blood pressure (BP) is the largest modifiable risk factor for all-cause mortality (contributing 30%) and cardiovascular (CV) mortality (contributing 41%) in the U.S. population.1 Between 2007–2016, about half of people with hypertension in the U.S. did not have BP controlled to <140/90 mm Hg.2,3 The prevalence of uncontrolled hypertension is even higher with the lower target level of <130/80 mm Hg specified in the 2017 ACC/AHA guideline.4,5
Self-monitoring of BP without additional patient support offers at best modest BP lowering for up to 6 months,6,7 but when combined with moderate or high levels of patient support, there are 4 to 6 mm Hg greater mean reductions in systolic BP (SBP) and ~2 mm Hg greater mean reductions in diastolic BP (DBP), as well as about 50% improvement in BP control compared to usual care for 12 months.8 Individual patient counseling and educational care management support can be provided by nurses or pharmacists as part of team-based care, which has also been shown to lower BP and improve BP control with or without self-monitoring.9 Home telemonitoring allows BP data to be transmitted electronically to care managers, and has also been shown to substantially improve BP compared to usual care.10,11
In the Hyperlink trial, our research team compared an intervention combining home BP telemonitoring and pharmacist care management (Telemonitoring Intervention, TI) to usual primary care (UC) in primary care patients with uncontrolled hypertension. After the 12 month intervention, SBP was 10 mm Hg lower and DBP was 5 mm Hg lower in the TI group than in the UC group, with BP differences persisting for up to 24 months.12,13 Despite ample data on the BP lowering effects of telemonitoring, self-monitoring, and team-based care for hypertension, few studies report long-term follow-up with clinical outcomes. To address this important evidence gap, we report CV events and costs over 5 years of follow-up of Hyperlink.
Methods
Data available on request from the authors
Study Design, Setting, and Patients
The Hyperlink study was a cluster-randomized trial in 16 primary care clinics at HealthPartners Medical Group clinics that had a Medication Therapy Management (MTM) pharmacist on site at least once weekly at the start of the study in 2009. The study protocol was approved by the HealthPartners institutional review board, and all enrolled patients provided written informed consent. Detailed study methods have been published.14
Recruitment, enrollment, and follow-up of the study cohort is shown in Figure 1. Briefly, 14,492 adults with uncontrolled hypertension as identified through electronic systems were invited by mail to participate. A total of 2,020 patients were screened for eligibility, including having uncontrolled BP (>=140/90mmHg or >= 130/80mmHg if diabetes or kidney disease was present) based on the mean of 3 automated measurements taken using a standardized protocol in the research clinic. Of these, 450 were eligible and agreed to participate and all are included in this analysis of health and economic outcomes. Clinics were randomized to either TI (8 clinics with 228 patients) or UC (8 clinics with 222 patients). Patients were blinded to their clinic’s treatment assignment before randomization.
Figure 1.
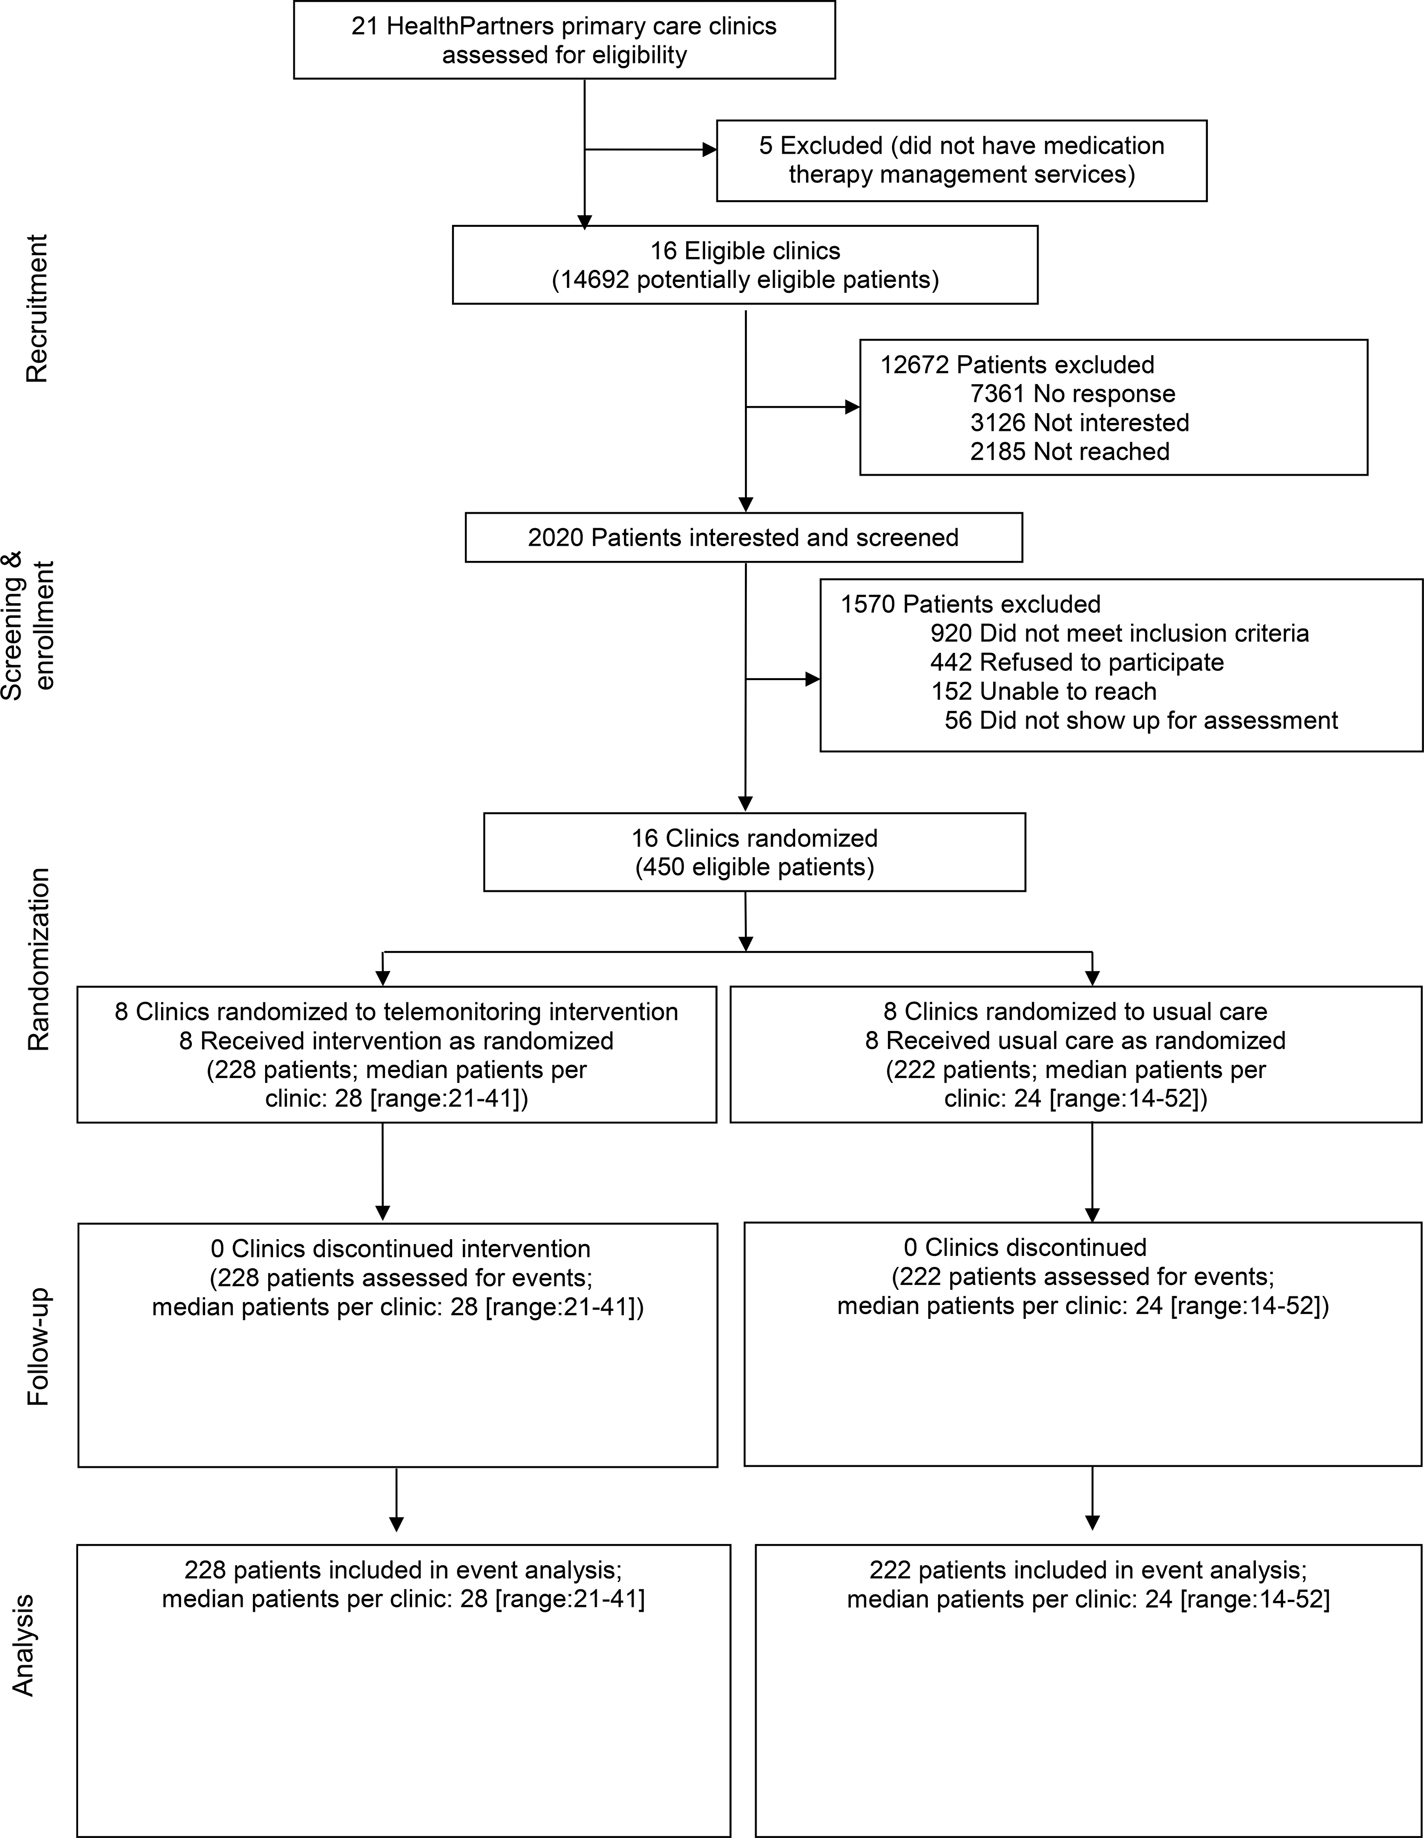
Participant recruitment, enrollment, randomization, and follow-up
Interventions
TI patients received an automated oscillometric home BP monitor (A&D Medical 767PC®, San Jose, CA) that stored and transmitted BP data to a secure website (AMC Health, New York, NY). In an initial face-to-face visit with the pharmacist, they were instructed to transmit at least 6 BP measurements weekly, including both morning and evening measurements. During the first 6 months, patients and pharmacists met every two weeks via telephone until BP control was sustained for 6 weeks, then frequency was reduced to monthly. During the second 6 months of the intervention period, phone visits were reduced to every two months, after which patients returned the telemonitors and resumed hypertension care managed by their primary care physician.
Telephone visits included review of home BP data, discussion of adherence to medication and lifestyle changes, and treatment issues. A collaborative practice agreement between pharmacists and primary care physicians at all 16 study clinics allowed pharmacists to prescribe and change antihypertensive therapy according to a specified protocol. In the TI group, pharmacists were asked to adjust antihypertensive drug therapy if less than 75% of readings since the last visit met the BP goal (<135/85mmHg or <125/75mmHg for patients with diabetes or kidney disease) and the patient could tolerate additional treatment. The UC group had hypertension care managed by their primary care physicians as usual. This could include referral to an MTM pharmacist for consultation and conventional home BP measurement.
Measurements and Outcomes
BP and CV events
Methods for measuring BP and other outcomes during follow-up have been described in detail and reported previously.13 BP was measured at research clinic visits at baseline and 6, 12, 18, and 54 months using a standardized technique. In a separate analysis, we also extracted routine clinical BP measurements for each participant from the electronic health record. Participants were asked at each follow-up visit at 6, 12, 18, and 54 months to report any hospitalization for 12 hours or longer. All hospital stays and deaths were reviewed by a physician adjudicator blinded to study treatment group for evidence of the following cardiovascular events: MI, stroke, heart failure, or coronary revascularization. All deaths were classified as due to cardiovascular disease, cancer, or other causes. Available documents used to adjudicate events included death certificate, discharge summary, admission history and physical examination, emergency room notes, cardiology and neurology consultations, other physician and nurse notes, laboratory reports, electrocardiogram tracings, and cardiac, vascular, and neurologic imaging reports. To search for events that were not self-reported or occurred in participants who did not attend a follow-up visit, we searched electronic health records and insurance claims data for all participants through 60 months of follow-up. The search included ICD-9 or ICD-10 diagnosis or procedure codes indicative of MI, stroke, heart failure, or coronary revascularization. After removing duplicate events that had already been reported and adjudicated, inpatient and outpatients records were reviewed and events adjudicated in a similar manner as for self-reported events.
Cardiovascular deaths were deaths due to MI, stroke, heart failure, cardiac arrhythmia, or sudden deaths judged likely to be related to underlying cardiovascular disease. Myocardial infarction was based on the presence of at least two of three criteria: chest pain, cardiac enzymes at least 2 times the upper limit of normal, and ischemic EKG changes. Stroke was based on rapidly developing neurological signs lasting at least 24 hours (unless interrupted by surgery or death) of probable cerebrovascular origin, corroborated by abnormalities on neuroimaging studies. Heart failure hospitalization was based on physician diagnosis and treatment and findings on physical examination, chest x-ray, cardiac ultrasound, and laboratory tests. Coronary revascularization was based on operative or cardiac catheterization laboratory reports.
Costs
We previously reported that direct program costs, which were comprised of and split almost equally between MTM pharmacist care management services and telemonitoring services, were about $1,350 per patient at market prices at the time of the study intervention.12 TI patients had a mean (SD) of 11.4 (3.9) pharmacist visits lasting 34.2 minutes per visit, and 217 TI patients used telemonitoring services for an average (SD) of 9.8 (2.5) months.12 We adjusted direct costs for inflation to 2017 US dollars ($1,511). Prior analysis revealed that the change in costs from the 12 month intervention period compared to previous 12 months for clinic visits, total pharmacy, laboratory and radiology did not differ significantly between TI and UC patients.15 Therefore, these costs are not included in intervention costs. The increase in costs for hyperlipidemia and BP medications alone were $100 (2017 US dollars) higher for TI patients. We assessed the inclusion of these costs in a sensitivity analysis.
The costs of events are taken from the literature for observed events and simulated events. Ambulatory, inpatient, and pharmacy costs associated with myocardial infarction, stroke, and heart failure hospitalization events were estimated from Medical Expenditure Panel Survey data16 and inflation-adjusted to 2017 dollars. For each of these events, one cost was assigned during the year of the event and another cost was assigned for subsequent years as follows: MI $45,259 in 1st year and $3,038 subsequent years; stroke $22,196 and $6,575; heart failure $36,686 and $14,132. Revascularizations that were not preceded by an MI were assigned costs of $33,339 in 2017 dollars based upon a literature review17 and assuming a 75%/25% mix of percutaneous coronary intervention and coronary artery bypass grafting. The costs of revascularizations that were preceded by an MI (n=0 in TI group; n = 4 in UC) are reflected in the cost of MIs and were not costed separately to avoid double counting. We did not assign a cost to premature CV death.
Statistical Analysis
We conducted two analyses for this report: a comparison of CV events observed in the 5-year follow-up period, and a microsimulation analysis. The analysis of CV events was not pre-specified in the analysis plan and should thus be considered exploratory. The microsimulation analysis was pre-specified. Counts of CV events are reported along with the count and proportion of patients having one or more CV events by treatment group. The primary CV composite endpoint included MI, stroke, heart failure, and CV death; the secondary CV endpoint also included coronary revascularization. Logit analysis accommodating clinic clustering utilized generalized estimating equations with robust standard errors to test differences in CV event incidence by group. Marginal Cox models estimated the hazard ratio for time to first CV event by treatment group.18 The observation period for patients without CV events was censored by non-CV death date, and for those without death dates by the latest of 1) the date on which the last research visit occurred, 2) date of health plan disenrollment, 3) date on which the last patient encounter occurred.
We calculated 5-year return on investment (ROI) on a per capita basis as ROI = net return / intervention costs x 100%, where net return = (UC event costs – TI event costs) – intervention costs. ROI tabulated in this manner is directly comparable to how return on financial investments are reported (e.g. the interest rate on a bond). To facilitate comparisons in the health literature we also report benefit cost ratios measured as (UC event costs – TI event costs)/intervention costs. Future costs were discounted to present value at a rate of 3% per year when calculating ROI and benefit-cost ratios.
Simulation model
We used the HealthPartners Institute ModelHealth™: Cardiovascular Disease microsimulation model to determine whether the observed CV events were similar to model predicted results, based on the observed SBP differences through 54 months. Details on the simulation model itself are published elsewhere.16,19–21 To conduct the comparison, the model was initialized with virtual counterparts of the patients in each study group using characteristics at baseline, which maintained all applicable differences between groups described in Table 1, including the 1.8 year difference in mean age (Table 1). The model simulated the incidence of CV events (MI, stroke, heart failure, and CV death) for subjects in each group over 5 years while maintaining the mean difference in SBP observed between the TI and UC groups in the research clinic at 12 and 54 months (with the difference linearly interpolated between these time points). Simulations were repeated 1,000 times, from which mean incidence of events, median odds ratios of event incidence between arms, and the percentage of simulations in which the model predicted a ratio at or better than the incidence of the primary CV composite endpoint observed between the TI and UC group (i.e., ≤0.49) were calculated with adjustment for the age difference between groups. Confidence intervals were calculated using the percentile method. Sensitivity analyses included a simulation with the TI group receiving no differential effect in SBP compared to the UC group (i.e., assuming no effect of the TI intervention) and calculating results without the age adjustment.
Table 1.
Patient Characteristics at Enrollment
| Mean (sd) or No. (%) | Mean (sd) or No. (%) | |
|---|---|---|
| Patient Characteristic | Telemonitoring Intervention (n=228) | Usual Care (n=222) |
| Age, mean (sd) | 62.0 (11.7) | 60.2 (12.2) |
| Women, n (%) | 103 (45.2) | 98 (44.1) |
| Non-Hispanic White, n (%) | 191 (83.8) | 177 (79.7) |
| Education below 4-year college degree, n (%) | 108 (48.9) | 119 (55.3) |
| Household income <$50,000/year, n (%) | 61 (32.6) | 67 (34.4) |
| Current smoker, n (%) | 24 (10.7) | 25 (11.4) |
| Diabetes, n (%) | 46 (20.2) | 40 (18.0) |
| Chronic kidney disease, n (%) | 47 (20.6) | 37 (16.7) |
| Cardiovascular disease, n (%) | 23 (10.1) | 20 (9.0) |
| Antihypertensive medication classes, mean (sd) | 1.6 (1.2) | 1.4 (1.2) |
| Systolic BP, mm Hg, mean (sd) | 148.2 (12.9) | 147.7 (13.2) |
| Diastolic BP, mm Hg, mean (sd) | 84.5 (11.7) | 84.9 (11.5) |
Results
The study population (Table 1) has been described in detail.12 Briefly, the 450 study participants had a mean age of 61, 45% were women, 82% were non-Hispanic white, and 10–20% had additional individual co-morbidities (smoking, diabetes, chronic kidney disease, cardiovascular disease). They reported taking a mean of 1.5 antihypertensive drug classes and mean BP was 145/85 mm Hg at enrollment. The TI and UC group did not differ significantly on these and other key characteristics, although the mean age in the TI group was 1.8 years greater than in the UC group. Compared with the UC group, SBP decreased more from baseline among patients in the TI group at 6 months (−10.7mm Hg, P<.001), at 12 months (−9.7mm Hg, P<.001), and at 18 months (−6.6 mm Hg, P = .004), but did not differ from the UC group at 54 months (−2.5 mm Hg, P = .18).13 Routine clinical measurements taken from the electronic health record suggested significantly lower SBP and DBP in the TI group for up to 24 months.
Cardiovascular events during 5-year follow-up
During the follow-up period there were 15 CV events (5 MI, 4 stroke, 5 HF, 1 CV death) among 10 patients in the TI group and 26 events (11 MI, 12 stroke, 3 HF) among 19 patients in the UC group (Table 2). The primary CV composite endpoint incidence was 4.4% in the TI group vs. 8.6% in the UC group (OR = 0.49, 95% CI: 0.21 – 1.13, p=.09). Including 2 coronary revascularizations in the TI group and 10 in the UC group, the secondary CV composite endpoint incidence was 5.3% in the TI group vs. 10.4% in the UC group (OR = 0.48, 95% CI: 0.22–1.08, p=.08). Time-to-first-event analyses showed similar results for the primary endpoint (HR=0.50, 95% CI: 0.22 – 1.11, p=.09) and the secondary endpoint including coronary revascularization (HR=0.49, 95% CI: 0.23 – 1.04, p=.06).
Table 2.
Cardiovascular events during 5 years of follow-up
| Intervention (n=228) | Usual Care (n=222) | |||
|---|---|---|---|---|
| Type of Event | Events, N | Patients, N (%) | Events, N | Patients, N (%) |
| MI | 5 | 11 | ||
| Stroke | 4 | 12 | ||
| Heart failure | 5 | 3 | ||
| CV Death | 1 | 0 | ||
| Total Events | 15 | 10 (4.4%) | 26 | 19 (8.6%) |
| Revascularization | 2 | 10 | ||
| Total Events | 17 | 12 (5.3%) | 36 | 23 (10.4%) |
5-year follow-up ROI
Over 5 years, event costs were estimated to total $2,772 per person in the TI group and $5,721 in the UC group for a difference of $2,949 favoring the TI group (Table 3). Based on $1,511 in intervention costs, there was a net cost savings of about $1,438 per patient ($1,241 when discounted to present value). Return on investment was 82% (for every dollar spent, that dollar was recouped plus $0.82). Using the secondary composite measure (including revascularization costs), the difference in event costs increases to $3,517 per patient, net savings increase to $2,006 ($1,792 when discounted), and the ROI becomes 119%.
Table 3.
5-year return on investment (ROI) and benefit-cost ratios
| Intervention | Usual Care | Difference | |
|---|---|---|---|
| Event costs per participant | |||
| MI | $1,166 | $2,598 | $(1,433) |
| Stroke | $678 | $2,118 | $(1,440) |
| Heart failure | $928 | $1,005 | $(77) |
| Revascularization | $273 | $841 | $(568) |
| Composite event costs per participant | |||
| Composite 1 | $2,772 | $5,721 | $(2,949) |
| Composite 1, discounted | $2,595 | $5,347 | $(2,752) |
| Composite 2 | $3,045 | $6,562 | $(3,517) |
| Composite 2, discounted | $2,841 | $6,144 | $(3,303) |
| Intervention costs1 | $1,511 | $- | $1,511 |
| 5-year return on investment1 | |||
| Composite 1 | 82% | ||
| Composite 2 | 119% | ||
| 5-year benefit-cost ratio1 | |||
| Composite 1 | 1.82 | ||
| Composite 2 | 2.19 |
ROI = Return on Investment; ROI and benefit-cost ratios reflect discounting of future benefits to their present value in the enrollment year at a rate of 3% per year; all interventions costs occurred in the enrollment year and therefore are not discounted.
In sensitivity analyses, adding the costs of hypertension and lipids medications that were previously found to be statistically different between the TI and UC group,15 reduces ROI slightly to 71% and 105% using the primary and secondary composite endpoints, respectively. Reducing and increasing the costs of all event rates by one-third produces a range of ROIs of 21% to 143% using costs of primary composite events, and 46% to 191% using costs of secondary composite events. Reducing intervention costs by one-third, assuming lower costs of new technology and increased scale, increases net savings to $1,942 and $2,510 per patient using the primary and secondary composite event definitions, respectively, and the increases corresponding ROI measures to 178% and 228%.
Simulated CV events during 5-year follow-up
The mean age-adjusted CV event incidence over 5 years predicted by the model was 18.0 events for the TI group and 20.5 events for the UC group (median OR = 0.88, 95% CI: 0.49–1.65) (Figure 2). Only 5.3% of simulations yielded an OR ≤ 0.49 (the observed OR for the primary composite endpoint). Without adjustment for the baseline age differences between groups, the predicted median OR narrowed to 0.97 (95% CI: 0.54–1.78), and only 2.2% of simulations yielded an OR ≤ 0.49. Additionally, when the model assumed no beneficial BP effect for the TI group, the model predicted the TI group would have experienced CV events at a greater rate compared to the UC group (median OR = 1.06, 95% CI: 0.61–1.87).
Figure 2.
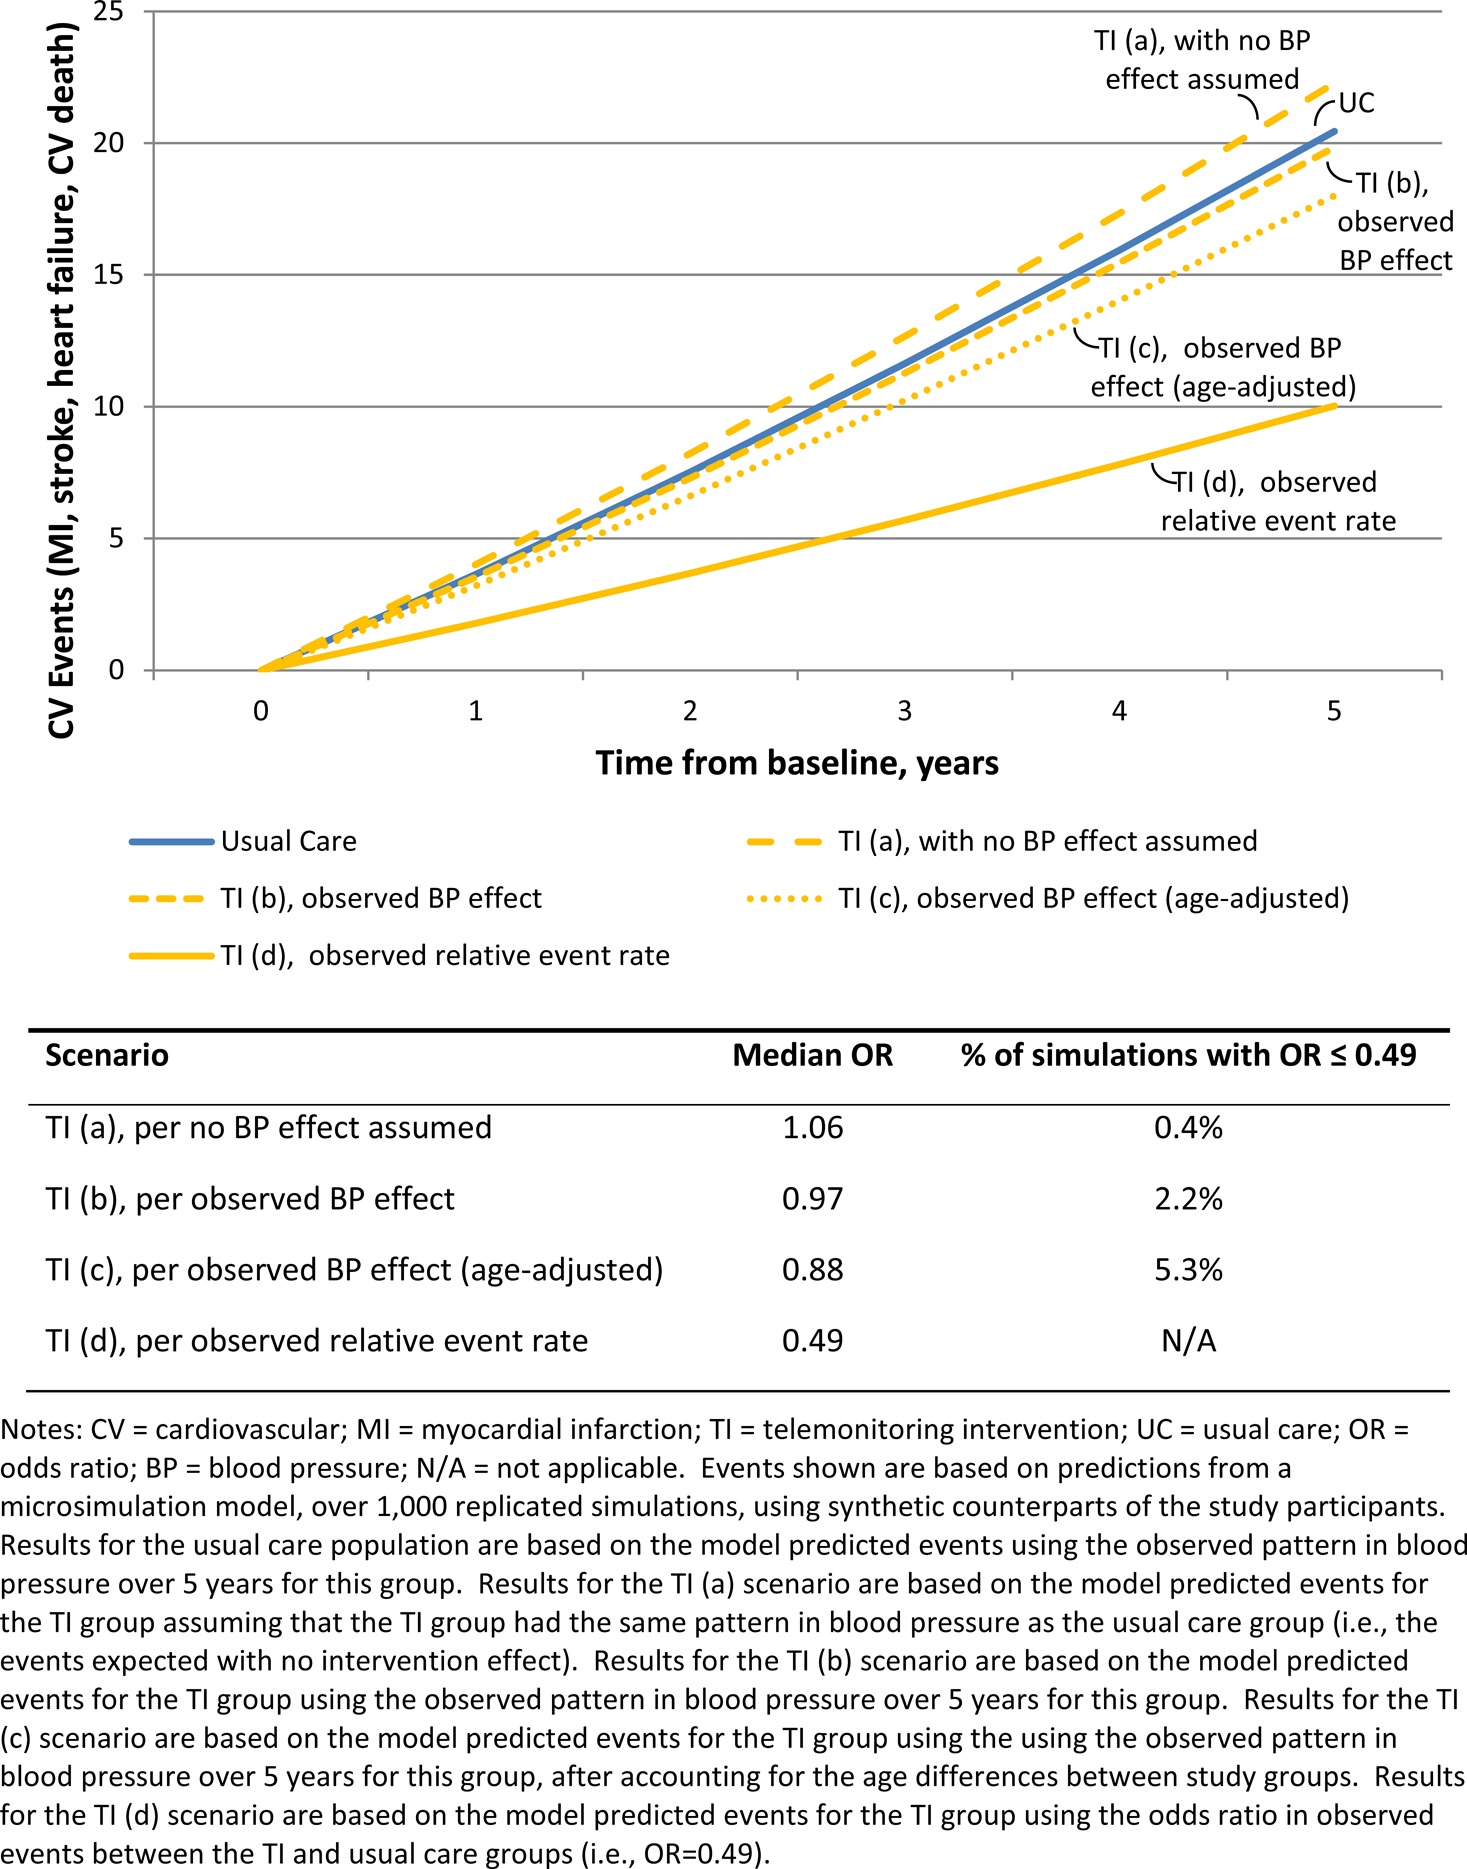
Microsimulation model predicted 5-year event rates for study population
Discussion
In this 5-year follow-up of a randomized trial, in which 6 months of intensive home BP telemonitoring and pharmacist care management lowered BP for about 2 years compared with usual primary care13, we observed reduced CV events in the TI group by about 50% over 5 years. Although the reduction in CV events was substantial, the study was not powered for this outcome and the reduction was not statistically significant. However, if the reduction in CV events is not due to chance, the intervention is cost-saving over 5 years.
The observed effect on cardiovascular events in the current study is greater than predicted based on meta-analyses of large-scale BP lowering trials. In a meta-analysis of 123 trials with 613,815 participants, every 10 mmHg reduction in SBP reduced the relative risk of major cardiovascular events by 20% (95% CI 7% – 13%).22 In another meta-analysis of 19 trials and 44,989 participants comparing more and less intensive BP lowering strategies, the mean difference in SBP was 7 mmHg and the relative risk for major cardiovascular events was reduced by 14% (95% CI 4% −22%).23 These observations led us to use microsimulation to replicate the trial using the observed SBP results, and this was consistent with the clinical trial data: a 12% predicted reduction in cardiovascular events when accounting for the baseline age difference of 2 years between the TI and UC groups.
Few studies have reported on long-term effects of the types interventions used in the present study (self-monitoring of BP, BP telemonitoring, and team-based care for hypertension) on cardiovascular events, as noted in meta-analyses of these topics.6,9,10 One longitudinal pre-post study in North Carolina of pharmacist education with hypertension and lipid therapy management found about a 50% decrease in CV events compared to historical rates.24 A trial in the UK of nurse-led clinics for hypertension and lipid management in patients with diabetes found a 45% reduction in all-cause mortality compared with usual care (OR 0.55, 95% CI 0.32 – 0.92).25 A cluster-randomized trial in South Asia of home visits by community health workers for BP monitoring and counseling linked with existing public health care led to improved BP and reduced cardiovascular mortality compared to usual care over 24 months (0.6% vs. 1.7%, p=0.006).26 It is worth noting that these were all studies of forms of team-based care that likely influenced CV risk more broadly than in hypertension treatment efficacy trials, which could explain the larger treatment effects. An alternative explanation is that most trials did not collect data on CV events or did not report null results.
The economic evidence on self-monitoring of BP has been thoroughly reviewed for the Guide to Community Preventive Services, categorized as self-monitoring of BP alone, with some support, and with team-based care.27 Using standardized estimates of quality-adjusted life years saved per one mmHg reduction in SBP, self-monitored BP alone was cost-saving in two studies and not cost-effective in three studies. Self-measured BP with some support and with team-based care was cost-effective but not cost-saving. Follow-up was 24 or fewer months in studies in which downstream cost-offsets were observed.
Simulation models of home BP monitoring in U.S. health care systems have a longer time horizon but also produced varied results. One study estimated that home BP monitoring to adjust treatment would have no cost savings at 5 years for privately insured 20–44 year olds, an ROI of 1.87 for privately insured 45–64 year olds, and an ROI of 13.96 for Medicare recipients age 65 and above.28 The mean change in SBP used in their analysis (2.6 mm Hg) was similar to the difference between our TI and UC groups at 54 months (2.5 mg Hg), but predicted event rates were not reported. Another study compared the experience of participants in a home BP monitoring study to assumptions (bounded by data) on what participants’ experience would have been without intervention.29 With program costs of $2,142 per person, they found the program to be cost-saving only with optimistic assumptions and 10-year follow-up. While they did not report absolute event rates, the difference in events rates at 10 years (0.47% to 1.32%) is substantially smaller than the observed difference at 5 years between our TI and UC groups (5.1%). A third study found that telemonitoring combined with pharmacist care management was cost-effective in the long-term without factoring in any reduction in event costs.30
Reports of both observed and simulated economic analysis of home BP monitoring vary on several dimensions that may substantially influence results and costs. The most notable differences include the study population, the protocol for home BP monitoring, the extent and nature of additional support, the length of follow-up observed or time horizon simulated, the costs that result from differing intervention designs, and the types of health care utilization included in potential cost-offsets.
Several caveats are important to consider when interpreting our trial results. The trial was relatively small, was conducted in a single medical group in urban and suburban clinics, and included relatively few minority and low socioeconomic status participants; hence, our results might not be representative of those that would be seen in other settings or with different populations. The reduction in cardiovascular events was not statistically significant and could have been due to chance. Another potential explanation for our findings is that the pharmacist intervention may have had effects on important cardiovascular risk factors besides BP that we did not measure precisely, including effects on tobacco use, lipid management and other medications. Intervention costs were among the highest of those reported in the literature.27 However, advances in technology, including the ability to use patient-provided smart phones, and more targeted follow-up may reduce costs without reducing effectiveness of the intervention. Finally, in our study, home BP monitoring was not used to diagnose or confirm hypertension, which may be more cost-effective than using it for treatment monitoring alone.28,31
Perspectives
Telemonitoring with pharmacist management lowered BP and may have reduced costs by avoiding CV events over 5 years. Future studies of telemonitoring and pharmacist care should plan for long-term follow-up and be powered to detect differences in clinical CV events. They should also carefully measure changes in other CV risk factors, like lipids and smoking, that could be influenced by pharmacists or other care team members.
Novelty and Significance:
What Is New
Reporting of cardiovascular events and costs during 5 years of follow-up of a randomized trial of home BP telemonitoring with pharmacist management for uncontrolled hypertension
What Is Relevant
Self-monitoring of BP (including telemonitoring) with additional support as part of team-based care has been shown to lower BP compared to routine care
Few studies of similar interventions have reported long-term follow-up, costs, or cardiovascular outcomes
Summary
Telemonitoring with pharmacist management may have reduced CV events by about 50% over 5 years.
Savings from the reduction in CV events more than offset the intervention costs
Acknowledgments:
Sources of Funding:
Funded by National Heart, Lung, and Blood Institute (R01 HL090965)
Footnotes
Clinical trials registration: clinicaltrials.gov identifier NCT00781365
Conflicts of Interest/Disclosures:
None
Tweet
Home blood pressure telemonitoring w/ pharmacists’ help lowered BP & healthcare costs by avoiding cardiac and stroke events over 5 yrs @_HealthPartners
References
- 1.Yang Q, Cogswell ME, Flanders WD, Hong Y, Zhang Z, Loustalot F, Gillespie C, Merritt R, Hu FB. Trends in cardiovascular health metrics and associations with all-cause and CVD mortality among US adults. JAMA. 2012;307(12):1273–1283. [DOI] [PMC free article] [PubMed] [Google Scholar]
- 2.Yoon SS, Carroll MD, Fryar CD. Hypertension Prevalence and Control Among Adults: United States, 2011–2014. NCHS Data Brief. 2015(220):1–8. [PubMed] [Google Scholar]
- 3.Fryar CD, Ostchega Y, Hales CM, Zhang G, Kruszon-Moran D. Hypertension Prevalence and Control Among Adults: United States, 2015–2016. NCHS Data Brief. 2017(289):1–8. [PubMed] [Google Scholar]
- 4.Muntner P, Carey RM, Gidding S, Jones DW, Taler SJ, Wright JT Jr., Whelton PK. Potential US. Population Impact of the 2017 ACC/AHA High Blood Pressure Guideline. J Am Coll Cardiol. 2018;71(2):109–118. [DOI] [PMC free article] [PubMed] [Google Scholar]
- 5.Whelton PK, Carey RM, Aronow WS, Casey DE Jr., Collins KJ, Dennison Himmelfarb C, DePalma SM, Gidding S, Jamerson KA, Jones DW, MacLaughlin EJ, Muntner P, Ovbiagele B, Smith SC Jr., Spencer CC, Stafford RS, Taler SJ, Thomas RJ, Williams KA Sr., Williamson JD, Wright JT Jr. 2017 ACC/AHA/AAPA/ABC/ACPM/AGS/APhA/ASH/ASPC/NMA/PCNA Guideline for the Prevention, Detection, Evaluation, and Management of High Blood Pressure in Adults: A Report of the American College of Cardiology/American Heart Association Task Force on Clinical Practice Guidelines. Hypertension. 2018;71(6):e13–e115. [DOI] [PubMed] [Google Scholar]
- 6.Uhlig K, Patel K, Ip S, Kitsios GD, Balk EM. Self-measured blood pressure monitoring in the management of hypertension: a systematic review and meta-analysis. Ann Intern Med. 2013;159(3):185–194. [DOI] [PubMed] [Google Scholar]
- 7.Reboussin DM, Allen NB, Griswold ME, Guallar E, Hong Y, Lackland DT, Miller EPR 3rd, Polonsky T, Thompson-Paul AM, Vupputuri S. Systematic Review for the 2017 ACC/AHA/AAPA/ABC/ACPM/AGS/APhA/ASH/ASPC/NMA/PCNA Guideline for the Prevention, Detection, Evaluation, and Management of High Blood Pressure in Adults: A Report of the American College of Cardiology/American Heart Association Task Force on Clinical Practice Guidelines. J Am Coll Cardiol. 2018;71(19):2176–2198. [DOI] [PMC free article] [PubMed] [Google Scholar]
- 8.Tucker KL, Sheppard JP, Stevens R, Bosworth HB, Bove A, Bray EP, Earle K, George J, Godwin M, Green BB, Hebert P, Hobbs FDR, Kantola I, Kerry SM, Leiva A, Magid DJ, Mant J, Margolis KL, McKinstry B, McLaughlin MA, Omboni S, Ogedegbe O, Parati G, Qamar N, Tabaei BP, Varis J, Verberk WJ, Wakefield BJ, McManus RJ. Self-monitoring of blood pressure in hypertension: A systematic review and individual patient data meta-analysis. PLoS Med. 2017;14(9):e1002389. [DOI] [PMC free article] [PubMed] [Google Scholar]
- 9.Proia KK, Thota AB, Njie GJ, Finnie RK, Hopkins DP, Mukhtar Q, Pronk NP, Zeigler D, Kottke TE, Rask KJ, Lackland DT, Brooks JF, Braun LT, Cooksey T, Community Preventive Services Task F. Team-based care and improved blood pressure control: a community guide systematic review. Am J Prev Med. 2014;47(1):86–99. [DOI] [PMC free article] [PubMed] [Google Scholar]
- 10.Duan Y, Xie Z, Dong F, Wu Z, Lin Z, Sun N, Xu J. Effectiveness of home blood pressure telemonitoring: a systematic review and meta-analysis of randomised controlled studies. J Hum Hypertens. 2017;31(7):427–437. [DOI] [PubMed] [Google Scholar]
- 11.Omboni S, Gazzola T, Carabelli G, Parati G. Clinical usefulness and cost effectiveness of home blood pressure telemonitoring: meta-analysis of randomized controlled studies. J Hypertens. 2013;31(3):455–467; discussion 467–458. [DOI] [PubMed] [Google Scholar]
- 12.Margolis KL, Asche SE, Bergdall AR, Dehmer SP, Groen SE, Kadrmas HM, Kerby TJ, Klotzle KJ, Maciosek MV, Michels RD, O’Connor PJ, Pritchard RA, Sekenski JL, Sperl-Hillen JM, Trower NK. Effect of home blood pressure telemonitoring and pharmacist management on blood pressure control: a cluster randomized clinical trial. JAMA. 2013;310(1):46–56. [DOI] [PMC free article] [PubMed] [Google Scholar]
- 13.Margolis KL, Asche SE, Dehmer SP, Bergdall AR, Green BB, Sperl-Hillen JM, Nyboer RA, Pawloski PA, Maciosek MV, Trower NK, O’Connor PJ. Long-term Outcomes of the Effects of Home Blood Pressure Telemonitoring and Pharmacist Management on Blood Pressure Among Adults With Uncontrolled Hypertension: Follow-up of a Cluster Randomized Clinical Trial. JAMA Netw Open. 2018;1(5):e181617. [DOI] [PMC free article] [PubMed] [Google Scholar]
- 14.Margolis KL, Kerby TJ, Asche SE, Bergdall AR, Maciosek MV, O’Connor PJ, Sperl-Hillen JM. Design and rationale for Home Blood Pressure Telemonitoring and Case Management to Control Hypertension (HyperLink): a cluster randomized trial. Contemp Clin Trials. 2012;33(4):794–803. [DOI] [PMC free article] [PubMed] [Google Scholar]
- 15.Dehmer SP, Maciosek MV, Trower NK, Asche SE, Bergdall AR, Nyboer RA, O’Connor PJ, Pawloski PA, Sperl-Hillen JM, Green BB, Margolis KL. Economic Evaluation of the Home Blood Pressure Telemonitoring and Pharmacist Case Management to Control Hypertension (Hyperlink) Trial. J Am Coll Clin Pharm. 2018;1(1):21–30. [DOI] [PMC free article] [PubMed] [Google Scholar]
- 16.Dehmer SP, Maciosek MV, LaFrance AB, Flottemesch TJ. Health Benefits and Cost-Effectiveness of Asymptomatic Screening for Hypertension and High Cholesterol and Aspirin Counseling for Primary Prevention. Ann Fam Med. 2017;15(1):23–36. [DOI] [PMC free article] [PubMed] [Google Scholar]
- 17.Nagle PC, Smith AW. Review of recent US cost estimates of revascularization. Am J Manag Care. 2004;10(11 Suppl):S370–376. [PubMed] [Google Scholar]
- 18.Wei L, Lin D, Weissfeld L. Regression Analysis of Multivariate Incomplete Failure Time Data by Modeling Marginal Distributions. J Am Stat Assoc. 1989;84(408):1065–1073. [Google Scholar]
- 19.Overwyk KJ, Dehmer SP, Roy K, Maciosek MV, Hong Y, Baker-Goering MM, Loustalot F, Singleton CM, Ritchey MD. Modeling the Health and Budgetary Impacts of a Team-based Hypertension Care Intervention That Includes Pharmacists. Med Care. 2019;57(11):882–889. [DOI] [PMC free article] [PubMed] [Google Scholar]
- 20.Dehmer SP, Maciosek MV, Flottemesch TJ, LaFrance AB, Whitlock EP. Aspirin for the Primary Prevention of Cardiovascular Disease and Colorectal Cancer: A Decision Analysis for the U.S. Preventive Services Task Force. Ann Intern Med. 2016;164(12):777–786. [DOI] [PubMed] [Google Scholar]
- 21.Dehmer SP, Baker-Goering MM, Maciosek MV, Hong Y, Kottke TE, Margolis KL, Will JC, Flottemesch TJ, LaFrance AB, Martinson BC, Thomas AJ, Roy K. Modeled Health and Economic Impact of Team-Based Care for Hypertension. Am J Prev Med. 2016;50(5 Suppl 1):S34–S44. [DOI] [PMC free article] [PubMed] [Google Scholar]
- 22.Ettehad D, Emdin CA, Kiran A, Anderson SG, Callender T, Emberson J, Chalmers J, Rodgers A, Rahimi K. Blood pressure lowering for prevention of cardiovascular disease and death: a systematic review and meta-analysis. Lancet. 2016;387(10022):957–967. [DOI] [PubMed] [Google Scholar]
- 23.Xie X, Atkins E, Lv J, Bennett A, Neal B, Ninomiya T, Woodward M, MacMahon S, Turnbull F, Hillis GS, Chalmers J, Mant J, Salam A, Rahimi K, Perkovic V, Rodgers A. Effects of intensive blood pressure lowering on cardiovascular and renal outcomes: updated systematic review and meta-analysis. Lancet. 2016;387(10017):435–443. [DOI] [PubMed] [Google Scholar]
- 24.Bunting BA, Smith BH, Sutherland SE. The Asheville Project: clinical and economic outcomes of a community-based long-term medication therapy management program for hypertension and dyslipidemia. J Am Pharm Assoc (2003). 2008;48(1):23–31. [DOI] [PubMed] [Google Scholar]
- 25.New JP, Mason JM, Freemantle N, Teasdale S, Wong LM, Bruce NJ, Burns JA, Gibson JM. Specialist nurse-led intervention to treat and control hypertension and hyperlipidemia in diabetes (SPLINT): a randomized controlled trial. Diabetes Care. 2003;26(8):2250–2255. [DOI] [PubMed] [Google Scholar]
- 26.Jafar TH, Gandhi M, de Silva HA, Jehan I, Naheed A, Finkelstein EA, Turner EL, Morisky D, Kasturiratne A, Khan AH, Clemens JD, Ebrahim S, Assam PN, Feng L, Group C-BS. A Community-Based Intervention for Managing Hypertension in Rural South Asia. N Engl J Med. 2020;382(8):717–726. [DOI] [PubMed] [Google Scholar]
- 27.Jacob V, Chattopadhyay SK, Proia KK, Hopkins DP, Reynolds J, Thota AB, Jones CD, Lackland DT, Rask KJ, Pronk NP, Clymer JM, Goetzel RZ, Community Preventive Services Task F. Economics of Self-Measured Blood Pressure Monitoring: A Community Guide Systematic Review. Am J Prev Med. 2017;53(3):e105–e113. [DOI] [PMC free article] [PubMed] [Google Scholar]
- 28.Arrieta A, Woods JR, Qiao N, Jay SJ. Cost-benefit analysis of home blood pressure monitoring in hypertension diagnosis and treatment: an insurer perspective. Hypertension. 2014;64(4):891–896. [DOI] [PubMed] [Google Scholar]
- 29.Trogdon JG, Larsen B, Larsen D, Salas W, Snell M. Cost-effectiveness evaluation of a collaborative patient education hypertension intervention in Utah. J Clin Hypertens (Greenwich). 2012;14(11):760–766. [DOI] [PMC free article] [PubMed] [Google Scholar]
- 30.Fishman PA, Cook AJ, Anderson ML, Ralston JD, Catz SL, Carrell D, Carlson J, Green BB. Improving BP control through electronic communications: an economic evaluation. Am J Manag Care. 2013;19(9):709–716. [PMC free article] [PubMed] [Google Scholar]
- 31.Beyhaghi H, Viera AJ. Comparative Cost-Effectiveness of Clinic, Home, or Ambulatory Blood Pressure Measurement for Hypertension Diagnosis in US Adults. Hypertension. 2019;73(1):121–131. [DOI] [PubMed] [Google Scholar]