

Abstract
Background
Adaptive thermogenesis during prolonged energy deficit refers to the greater than expected reduction in energy expenditure (EE) independent of concomitant loss of metabolically active body mass.
Objective
As inter-individual variability in the magnitude of adaptive thermogenesis may influence the extent of energy deficit thereby predicting the amount of weight reduction, we investigated whether early adaptive thermogenesis is a determinant of weight loss after 6 weeks of daily 50% caloric restriction in an inpatient setting.
Design and methods
The current study report the results of an exploratory, secondary analysis in overweight but otherwise healthy subjects (n=11, 7 men, 35±9y, BMI=40±7 kg/m2, body fat=63.3±5.3%). Body composition and 24-hour EE (24hEE) measurement in a whole-room indirect calorimeter were used to calculate the magnitude adaptive thermogenesis while on caloric restriction after 1, 3 and 6 weeks. Energy deficit during caloric restriction was quantified via food, stool, and urine bomb calorimetry. Fasting hormonal concentrations (FT4, FT3, FGF21, leptin) were obtained at baseline and at weeks 3 and 6 during caloric restriction.
Results
The magnitude of adaptive thermogenesis in 24hEE after 1 week of caloric restriction was −178±137 kcal/day (mean±SD), was overall stable during and following caloric restriction, and demonstrated remarkable intra-individual consistency. A relatively greater decrease in 24hEE of 100 kcal/d after 1 week was associated on average with reduced energy deficit by 8,195 kcal over 6 weeks and predicted 2.0 kg less weight loss, of which 0.5 kg was fat mass, after 6 weeks. No correlations were found between hormonal concentrations and weight loss.
Conclusions
The extent of weight loss is influenced by the magnitude of adaptive thermogenesis in the early stage of caloric restriction. Although these results need replication in larger study groups with adequate statistical power, targeting adaptive thermogenesis may help to optimize long-term interventions in obesity therapy.
Keywords: Caloric Restriction, Energy Metabolism, Thermogenesis, Obesity, Energy Balance, Weight Loss
Introduction
The extent of weight loss during caloric restriction varies significantly among individuals [1]. Identifying determinants of weight loss may lead to new therapies to improve individual outcomes of lifestyle, pharmacotherapy, and surgery interventions in the treatment of obesity [2-4]. Metabolic adaptive processes refer to changes in the metabolic rate during caloric restriction aimed to conserve energy, thus altering the extent of energy deficit during caloric restriction and limiting the amount of weight loss over time [3-7].
We have demonstrated the relevance of short-term adaptation in 24-h energy expenditure (24hEE) on the extent of weight loss during sustained underfeeding by showing that the inter-individual variability in the 24hEE response to acute (24h) fasting prior to caloric restriction is a determinant of subsequent weight loss after 6 weeks of 50% caloric restriction [1]. Adaptive thermogenesis, i.e. the greater decline in EE than would be predicted by the decrease in metabolically active mass during sustained energy deficit [3, 4, 8], may also counteract body weight loss [5]. The dynamics of adaptive thermogenesis during caloric restriction may be affected by the way body composition changes during different phases of weight loss [7, 9-11]. In fact, initial weight loss during the first week of caloric restriction is mostly due to a reduction in body fat-free mass (FFM) rather than in fat mass (FM) [7, 9]. As the strongest determinant of daily EE [12], the diet-induced reduction in FFM during early stages of caloric restriction is responsible for the decline in EE (i.e., adaptive thermogenesis) by altered insulin, sympatho-adrenergic, thyroid, and adipokine signaling [4]. Thus, the magnitude of adaptive thermogenesis may be identifiable early on during caloric restriction and may predict longer-term energy deficit [3, 4, 13, 14].
This current work analyzes data from our 6-week caloric restriction inpatient study which previously demonstrated that greater decrease in 24hEE to acute fasting measured prior to dietary intervention predicted less weight loss over 6 weeks of caloric restriction [1]. Herein, we sought to determine whether adaptive thermogenesis measured during the early phase of caloric restriction (i.e. within a week) predicted subsequent changes in body weight and composition in healthy, overweight/obese subjects. Repeated assessments of 24-hour EE (24hEE) and body composition prior to, during, and following six weeks of 50% daily caloric restriction with direct measures of energy deficit via food, stool, and urine kcal bomb calorimetry were performed in an inpatient setting. We hypothesized that a greater extent of adaptive thermogenesis observed within the first week of caloric restriction, namely, a relatively greater decrease in 24hEE in response to underfeeding would: (i) predict less weight loss (ii) predict less total daily energy deficit (iii) correlate with changes in circulating hormones involved in energy homeostasis.
Material and Methods
Study participants
This clinical trial was designed to identify metabolic determinants of weight loss in a 11-week, carefully controlled inpatient setting (clinicaltrials.gov identifier: NCT00687115) [1]. The study design consisted of three periods as explained in detail in Figure 1: i) a 3-week baseline period, in which subjects underwent metabolic tests while consuming a weight maintaining diet before they started caloric restriction; ii) a 6-week dietary intervention period, during which participants consumed daily a 50% calorie-reduced diet (58% carbohydrate, 27% fat, and 15% protein) to induce weight loss; and, iii) a 2-week post-caloric restriction period when subjects repeated metabolic tests while again consuming a weight maintaining diet. Volunteers were fully informed of the nature and purpose of the study and written informed consent was obtained before admission. The study was approved by the Institutional Review Board of the National Institute of Diabetes and Digestive and Kidney Diseases.
Figure 1. Study outline.

Study outline for the three study periods. The inpatient study consisted of a 3-week baseline period, a 6-week caloric restriction (CR) period, and a 2-week post-CR period. Due to scheduling of procedures during the baseline and post-CR period, the number of days spent by volunteers on the clinical unit varied slightly.
During the 3-week baseline period (highlighted in green), body composition was measured using DXA (DXA1), and whole-room indirect calorimetry was used to obtain precise measures of 24hEE during energy balance by performing two consecutive assessments (EB1 and EB2). Specifically, a first 24-hour stay in the whole room indirect calorimeter (EB1) served to obtain an individual’s 24hEE close to perfect energy balance in this setting by administering a eucaloric, balanced diet based on unit-specific equations [12]. Forty-eight hours after this first session, 24hEE was measured again inside the calorimeter (EB2); however, this time, the total caloric content of meals provided to the individual in the calorimeter equaled the 24hEE value measured during EB1 to more closely achieve energy balance. Therefore, 24hEE of EB2 was used as the baseline measurement for further analyses (see Statistical analyses). During week 2 of the baseline period, stool, urine, and food bomb calorimetry were performed. During the CR period (highlighted in purple), study participants were fed a 50% calorie-reduced diet for 42 days and 24hEE was measured after 1 and 3 weeks of CR (EECR1 and EECR3). DXA measurements were performed at the same time points (DXACR1 and DXACR3). Bomb calorimetry of food was performed daily while urine and stool bomb calorimetry were performed on 3 days/week. Activity monitors were continuously worn during the CR period.
During the post-CR period (highlighted in blue), anthropometry (DXA2) and 24hEE assessment during energy balance (as based on weight maintaining energy needs after 42 days of CR; EB3) as well as bomb calorimetry of stool, urine, and food were repeated. An OGTT was performed before and after CR to assess glucose tolerance (OGTT1 and 2). Only non-diabetic individuals were admitted to the study [15].
CR, caloric restriction; DXA, dual X-ray absorptiometry; EB1, 24-h energy expenditure assessment in energy balance based on weight maintaining energy needs (admission weight); EB2, 24-h energy expenditure assessment where caloric content of diet equaled energy expended during EB1; EB3, 24-h energy expenditure assessment in energy balance based on weight maintaining energy needs after 42 days of CR; 24hEE, 24-h energy expenditure; EECR1, 24-h energy expenditure assessment after one week of CR; EECR3, 24-h energy expenditure assessment after 3 weeks of CR; OGTT, oral glucose tolerance test; WMD, weight maintaining diet.
Between 2008 and 2016, overweight but otherwise healthy individuals based on physical examination, laboratory analysis, electrocardiography, and psychological assessment were screened for participation in this study (Supplemental Figure 1). Out of 54 screened individuals, a total of 18 non-diabetic (determined on day 4 upon admission as per 75-g oral glucose tolerance test, OGTT) [15] individuals (BMI>27 kg/m2) were admitted to our clinical research unit and placed on a daily weight-maintaining diet (WMD; 50% carbohydrate, 30% fat, and 20% protein) to keep their body weight within ±1% of admission weight during the 3-week baseline period of the study [16]. Daily fasting weights measured by a calibrated scale in the morning upon awakening were available for the entire length of the study. On day 2 of this baseline period, percentage body fat, FFM, and FM were obtained via dual-energy X-ray absorptiometry (DXA; DPX-1, Lunar Radiation Corp, Madison, WI).
Out of 18 admitted study participants, 17 started the 6-week caloric restriction period during which subjects were administered daily a subject-specific, calorie-reduced, liquid diet (Ensure; Abbott Laboratories, Columbus, OH) with total energy content equal to 50% of the WMD given during the baseline period. During this 6-week caloric restriction period, DXA scans were performed weekly to estimate body composition while 24hEE was measured at the end of week 1 (EECR1) and at the end of week 3 (EECR3). Only subjects with valid EECR1 measurement were included in the analysis (n=11; 7 men).
Lastly, in the post-caloric restriction period participants were fed a WMD based on their body weight measured at the end of 6-week caloric restriction period (i.e. after weight loss), underwent another DXA scan, an OGTT, and a 24hEE assessment in the new energy balance state (EB3).
Whole-room indirect calorimetry
EE was assessed upon breakfast between 8:00AM and 7:45AM of the following morning (23.75 hours) via continuous measurement of respiratory flow in a whole-room indirect calorimeter, as previously described [12]. The average measured CO2 production and O2 consumption were extrapolated to 24 hours and used to calculate 24-h respiratory quotient (24hRQ) and 24hEE [12]. Sleeping EE (SLEEP) was calculated as the average EE of all minute-by-minute time points between 11:30PM and 5:00AM during which spontaneous physical activity (SPA, assessed by radar sensors) was <1.5% [12, 17], The “awake and fed” thermogenesis (AFT) [18], defined as the increase in an individual’s EE in the awake, nonactive, and fed state, was calculated as: AFT=EE0–SLEEP, where EE0 is the EE in the inactive state, calculated as the intercept of the regression line between EE and SPA minute-by-minute time points between 11:00AM and 1:00AM [18]. Twenty-four-hour lipid (LIPOX) and carbohydrate (CARBOX) oxidation rates were calculated from 24hRQ after accounting for protein oxidation rate (PROTOX) estimated via 24-h urinary nitrogen excretion [19].
Bomb calorimetry and activity level
Measurement of the energy content of provided food, urine, and stool samples via bomb calorimetry was performed using the Isoperibol Calorimeter 6200 with a model 1108 oxygen bomb as previously described [1, 20]. Bomb calorimetry of food was performed daily while urine and stool bomb calorimetry was performed on 3 days/week.
Physical activity was measured continuously during the entire 6-week caloric restriction period, including days spent in the calorimeter. Five omnidirectional accelerometers (Actical; Philips Respironics, Bend, OR) were attached to each volunteer’s waist, left wrist, right wrist, left ankle, and right ankle, and a daily activity factor (DAF) was calculated as previously described [1].
Cumulative energy deficit and energy partitioning
During the 6-week caloric restriction period, the cumulative energy deficit (CED) was calculated from 24hEE, DAF, and direct measurements of calories of nutrient intake, feces, and urine by bomb calorimetry, as previously described [1, 21]. Briefly, the 24hEE and DAF measured at week 1 of caloric restriction were used as the reference values. The daily DAF during caloric restriction was then multiplied by the reference 24hEE and divided by the reference DAF to obtain the estimated daily 24hEE, which was then subtracted from the absorbed calories on the same day (as determined by daily bomb calorimetry of food, and bomb calorimetry of feces and urine performed 3 days/week) to obtain a daily energy deficit which was summated across all 42 days of caloric restriction to calculate CED as following:
The CED could not be determined in one subject due to insufficient accelerometer data. This subject was excluded from the CED analyses.
As a measure of the relative amount of energy mobilized from FM and FFM during caloric restriction, energy partitioning (Pratio) was calculated using DXA measurements at week 1 and 3 of caloric restriction, and post caloric restriction [22]:
where α = 9.05 equals the ratio of energy equivalents for FM and FFM (38.9 MJ/kg and 4.3 MJ/kg, respectively), with relative amount of protein in FFM and energy density for protein in FFM assumed as previously published [23-25], and δFM/δFFM equals the relative change of FM and FFM during caloric restriction.
Hormonal measurements
Blood for measurements of free triiodothyronine (FT3), free thyroxine (FT4; Phoenix Pharmaceuticals, Burlingame CA; intra- and inter-assay coefficient of variation [CV] 3.0% and 4.5% for FT3 and 2.8% and 4.0% for total FT4, respectively), leptin (R&D Systems, Minneapolis, MN; intra- and inter-assay CV: 1.34% and 1.58%, respectively), and fibroblast growth factor 21 (FGF21; R&D Systems, intra- and inter-assay CV: 2.51% and 5.2%, respectively) concentrations was collected at baseline (in the morning after an overnight fast prior to the EB2 assessment), and after 3 and 6 weeks of caloric restriction. Serum samples were stored in a freezer at −70°C for measurements of hormones by the NIDDK Core laboratory in Bethesda, MD, via ELISA.
Urine was collected during the 24-hour stay inside the whole room indirect calorimeter at baseline and the end of caloric restriction and stored in a freezer at −70°C for measurement of catecholamines at the Mayo Collaborative Services, LLC (Rochester, MN, USA) using High-Performance Liquid Chromatography.
Statistical analyses
SAS Software (SAS Institute Inc., version 7.11, Cary, NC) was used for statistical data analysis. Data are reported as mean±SD or 95% confidence interval (CI). Power analyses conducted before data analysis and considering a statistical power >0.80 (2-sided alpha=0.05) and a sample size of 11 subjects indicated a minimum detectable correlation of r=0.74 between the magnitude of adaptive thermogenesis in 24hEE after one week of caloric restriction and weight loss following six weeks of caloric restriction. As the current study report the results of an exploratory, secondary analysis with pre-specified hypothesis and data analysis plan, no adjustment for multiple tests were performed [26].
For each subject, the magnitude of adaptive thermogenesis was calculated at the end of week 1 and week 3 of caloric restriction and during the post-caloric restriction period as the difference between measured 24hEE in these two settings minus the predicted value of 24hEE, which was calculated by applying the linear regression equation between 24hEE during energy balance at baseline (dependent variable) vs. baseline FFM and FM (independent variables) to FFM and FM at the respective weeks during caloric restriction. To increase precision of regression estimates of the linear equation, we combined 24hEE and body composition data from the current study (NCT00687115) with data from another study at our section (NCT00523627) where measurements were taken with the same procedures. Based on data from 115 subjects, the regression equation for predicted 24hEE (kcal/day) was equal to: 543+23.1×FFM+7.6×FM (for association of 24hEE with body composition measures, please refer to Supplemental Figure 2). Sensitivity analyses were run by calculating the predicted values of 24hEE using the regression equation calculated in the current study group (Supplemental Figure 3). The magnitude of adaptive thermogenesis at each time point was tested via one-sample Student’s t-test vs. 0. Linear mixed model analysis for repeated measures followed by post-hoc comparisons using the Tukey-Kramer method was conducted to assess changes in the magnitude of adaptive thermogenesis across time points. Similar calculations and analyses were done for each 24hEE component (SLEEP, EE0, CARBOX, LIPOX, and PROTOX). Similar results for adaptive thermogenesis were obtained when considering metabolic active FFM in place of total FFM (Supplemental Figure 4).
Student’s paired t-test was used to assess changes (Δ) in body weight, FFM, and FM both during and after 6-week caloric restriction. Due to the intra-individual variability in daily body weight during caloric restriction, the weekly rate of weight loss was calculated as the slope of the linear regression equation of 42 daily weight values (both in kg and as percentage of body weight recorded on the first day of caloric restriction) vs. actual days during the caloric restriction period and multiplying the slope by 7 days (Supplemental Figure 5). Correlation analyses using the Pearson’s correlation coefficient were then performed to test whether changes in body weight and composition after the 6-week caloric restriction period, as well as the weekly rate of weight loss, were associated with the extent of adaptive thermogenesis. Sensitivity analyses included the intention-to-treat analysis including all subjects who started the caloric restriction period, where all participants with missing values for 6-week weight loss had their missing values replaced by carrying forward the last valid observation on the basis of their actual daily rate of weight loss while on the diet (Supplemental Figure 6). Data were scanned for potential outliers using the methods of Grubbs [27], Tukey [28] and the generalized Extreme Studentized Deviate (ESD) test [29]. No outliers were identified by these tests.
Results
The characteristics of study volunteers are presented in Table 1. After one week of 50% caloric restriction, body weight decreased in all subjects (Δ=−3.6 kg, CI: −5, −2.2, P=0.0002, Figure 2A) reflecting a decrease in FFM (Δ=−3.2 kg, CI: −4.7, −1.7, P=0.0008), whereas FM was on average unchanged (P=0.28) until after 3 weeks of caloric restriction (Δ=−1.6 kg, CI: −2.7, −0.5, P=0.01) when body weight and FFM further decreased (both P<0.01) (Figure 2B).
Table 1.
Demographic and anthropometric characteristics of the study group.
| Baseline (n=11) | Week 1 (n=11) | Week 3 (n=9) | Post-CR (n=8) | |
|---|---|---|---|---|
| Age (years) | 34.5 ± 9.2 (22, 47) | - | - | - |
| BMI (kg/m2) | 40.2 ± 6.7 (28.9, 50) | 38.9 ± 6.7 (27.8, 47.8) | 37.2 ± 6.2 (27.4, 46.2) | 35.4 ± 5.5 (26.3, 44.8) |
| DXA weight (kg) | 112.3 ± 20 (81.6, 136) | 108.6 ± 20 (78.4, 136) | 104 ± 18.8 (77.2, 134)1 | 98.4 ± 16 (74.3, 119)2 |
| Percentage body fat (%) | 63.3 ± 5.3 (54.8, 70.2) | 62.6 ± 4.5 (55.1, 67.6) | 62.4 ± 5.2 (54.2, 68.0) | 62.7 ± 5.6 (54.8, 68.8) |
| FFM (kg) | 71.6 ± 16.3 (46.6, 90) | 68.4 ± 15.4 (46.3, 88) | 65.2 ± 14.6 (45, 87)1 | 61.9 ± 12.5 (45.2, 76)2 |
| FM (kg) | 40.7 ± 6.4 (29.1, 50) | 40.2 ± 6.5 (28.2, 48) | 38.7 ± 6.8 (26, 48)1 | 36.5 ± 7.1 (24.6, 47)2 |
| 24hEE (kcal/day) | 2441 ± 423 (1657, 2846) | 2253 ± 396 (1590, 2657) | 2166 ± 433 (1481, 2758) | 2055 ± 394 (1481, 2455) |
| 24hEE AT (kcal/day) | - | −178 ± 137 (−378, 76) | −154 ± 222 (−459, 212) | −165 ± 140 (−408, 54) |
| SLEEP (kcal/day) | 1901 ± 320 (1310, 2299) | 1805 ± 261 (1310, 2030) | 1718 ± 298 (1278, 2143) | 1689 ± 296 (1219,1977) |
| SLEEP AT (kcal/day) | - | −101 ± 145 (−313, 135) | −101 ± 186 (−354, 146) | −52 ± 155 (−226, 177) |
| EE0 (kcal/15h) | 1630 ± 298 (1102, 1955) | 1492 ± 276 (1064, 1771) | 1441 ± 311 (983, 1880) | 1337 ± 266 (977, 1584) |
| EE0 AT (kcal/15h) | - | −129 ± 87 (−247, 43) | −106 ± 151 (−262, 184) | −142 ± 84 (−268, −18) |
| AFT (kcal/15h) | 442 ± 144 (256, 695) | 364 ± 153 (97, 551) | 367 ± 164 (132, 541) | 281 ± 122 (119, 420) |
| AFT AT (kcal/15h) | - | −66 ± 110 (−311, 67) | −43 ± 123 (−269, 98) | −110 ± 84 (−248, −4) |
| 24hRQ (ratio) | 0.85 ± 0.04 (0.8, 1) | 0.8 ± 0.03 (0.75, 1) | 0.8 ± 0.03 (0.76, 1) | 0.84 ± 0.06 (0.75, 1) |
| Carbohydrate oxidation (kcal/day) | 1090 ± 354 (714, 1692) | 695 ± 300 (313, 1162) | 664 ± 263 (363, 1103) | 889 ± 482 (278, 1558) |
| Carbohydrate oxidation AT (kcal/day) | - | −363 ± 258 (−789, 28) | −362 ± 258 (−697, 44) | −110 ± 446 (−774, 511) |
| Lipid oxidation (kcal/day) | 878 ± 425 (301, 1572) | 1274 ± 307 (814, 1926) | 1287 ± 453 (662, 2095) | 835 ± 502 (201, 1797) |
| Lipid oxidation AT (kcal/day) | - | 364 ± 285 (−112, 931) | 439 ± 367 (−38, 1120) | 43 ± 516 (−687, 902) |
| Protein oxidation (kcal/day) | 442 ± 96 (308, 621) | 265 ± 101 (99, 438) | 201 ± 52 (106, 257) | 309 ± 127 (89, 508) |
| Protein oxidation AT (kcal/day) | - | −169 ± 76 (−261, −63) | −216 ± 49 (−287, −154) | −93 ± 99 (−259, 79) |
Clinical characteristics at baseline, during weeks 1 and 3 of caloric restriction (CR), and post-CR are presented as mean ± SD with minimum and maximum values in parentheses. The extent of adaptive thermogenesis (AT) during CR and post-CR was calculated as the actual/measured energy expenditure (EE) at that time point minus the predicted EE calculated using the regression equation on the basis of FFM and FM values.
Sample size during week 3 of CR is n=10 for body weight and body composition measures.
Sample size during post-CR period n=9 for body weight and body composition measures.
AT, adaptive thermogenesis; AFT, awake-fed thermogenesis; CR, caloric restriction; DXA, dual X-ray absorptiometry; EE, energy expenditure; EE0, EE in the inactive state; 24hEE, 24-hour energy expenditure; FFM, fat-free mass; FM, fat mass; SLEEP, sleeping energy expenditure, 24hRQ, 24-h respiratory quotient.
Figure 2. Changes in body weight and body composition during and after six weeks of caloric restriction.

Changes in body weight, fat free mass (FFM) and fat mass (FM) by DXA after the first week (panel A), after 3 weeks (panel B), and after six weeks (panel C) of caloric restriction (CR) relative to baseline. The average changes (Δ) are reported along with p-values by one-sample Student’s t-test vs. 0. Anthropometric data was available in 10 out of 11 subjects at week 3 of caloric restriction (CR) and in 9 of 11 subjects during the post-CR period.
Weight loss was accompanied by concomitant changes in thermogenic hormones, that is, a decrease in FT4 by 0.15 ng/dL (CI: −0.22 to −0.07, Figure 3A), FT3 by 0.24 pg/mL (CI: −0.48 to 0.001, Figure 3B), leptin by 9.5 ng/mL (CI: −13.3 to −5.6, Figure 3C), and urinary norepinephrine 24-h excretion rate by 16.8 μg/24h (CI: −28.0 to −5.5, Figure 3E) after 6 weeks of caloric restriction, whereas serum FGF21 and urinary epinephrine 24-h excretion rate remained unchanged (Figure 3D and 3F, respectively). No differences were observed for the magnitude of hormonal changes between Week 3 and 6 of the caloric restriction period (all Time P>0.20, Figure 3, panels A-D).
Figure 3. Changes in thyroid hormones, leptin, FGF21, and urinary catecholamine concentrations after three and six weeks of caloric restriction.

Absolute changes in serum FT4 (panel A), serum FT3 (panel B), serum leptin (panel C), and serum FGF21 (panel D) after 3 and after 6 weeks of caloric restriction compared to baseline. Changes in 24-h urinary norepinephrine (panel E) and epinephrine (panel F) excretion rates are shown after 6 weeks of caloric restriction. The average changes (Δ) are reported along with p-values by one-sample Student’s t-test vs. 0. The significance of differences across time points in panels A-D (i.e., “Time” p-value) was obtained by repeated measures mixed model analysis. FT3, free triiodothyronine; FT4, free thyroxine; FGF21, fibroblast growth factor 21.
Adaptive thermogenesis after one week of caloric restriction
At the end of the first week of caloric restriction, 24hEE was, on average, lower than predicted by the changes that occurred in FFM and FM (−178 kcal/day, CI: −270, −86, P=0.002; Figure 4A), although there was broad inter-subject variability (SD=137 kcal/day, range: −379 to +76 kcal/day). This early change in 24hEE relative to changes in body composition was reflected by changes both in EE0 (−129 kcal/15h, CI: −187, −70, P=0.0006; Figure 4B) and in SLEEP (−101 kcal/day, CI: −198, −4, P=0.04; Figure 4C), whereas AFT remained unchanged after 1 week of caloric restriction (P=0.07, Figure 4D). Similar to 24hEE, 24hRQ (−0.05, CI: −0.06, −0.03, P<0.0001, Figure 4E), CARBOX (−363 kcal/day, CI: −536, −189, P=0.0009; Figure 4G) and PROTOX (−169 kcal/day, CI: −220, −118, P<0001; Figure 4H) were on average relatively lower than predicted by changes in body composition, whereas LIPOX was relatively higher (+364 kcal/day, CI: 173, 555, P=0.002; Figure 4F). There were no correlations among measures of adaptive thermogenesis after 1 week of caloric restriction and changes in hormone concentration after 3 and 6 weeks of caloric restriction (all P>0.05). With the exception of PROTOX, no differences were observed for the magnitude of adaptive thermogenesis measures during and following the caloric restriction period (all Time P>0.06, Figure 4).
Figure 4. Changes in energy metabolism during and after six weeks of caloric restriction.
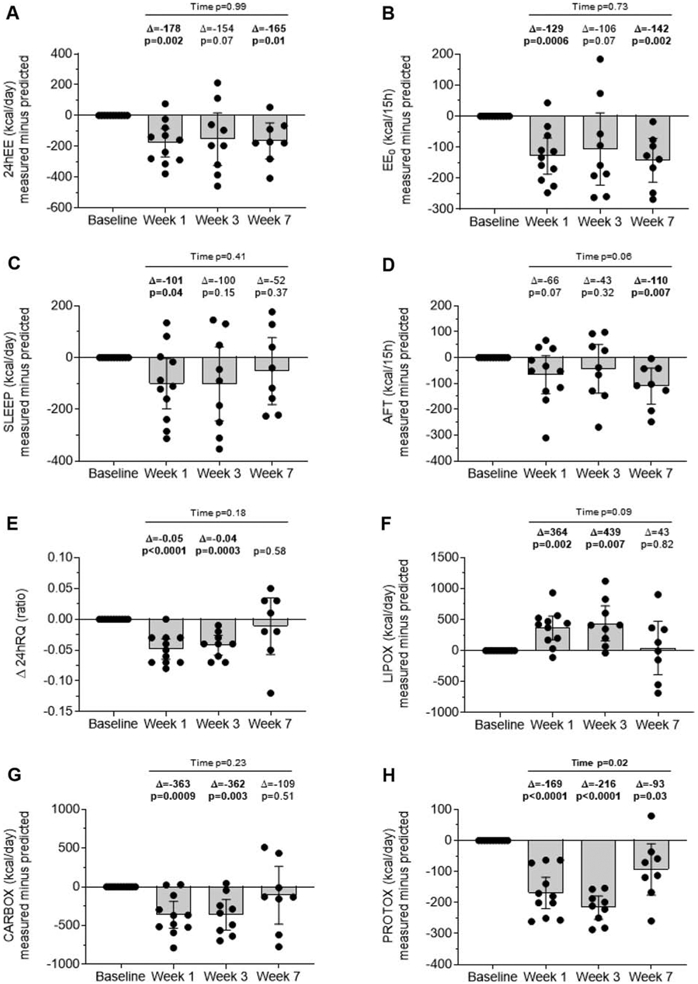
Extent of adaptive thermogenesis in 24hEE (panel A), EE0 (panel B), SLEEP (panel C), AFT (panel D), 24hRQ (panel E), LIPOX (panel F), CARBOX (panel G), and PROTOX (panel H) after 1 and 3 weeks of caloric restriction (CR) and during the post-CR period. Residual values shown on the y-axis were calculated by subtraction of predicted EE value from measured EE value at given timepoint. Predicted EE measures were calculated on the basis of FFM and FM using a linear regression equation. Error bars indicate the 95% CI of the mean. The average changes (Δ) are reported along with p-values by one-sample Student’s t-test vs. 0. The significance of differences across time points (i.e., “Time” p-value) was obtained by repeated measures mixed model analysis.
AT, adaptive thermogenesis; AFT, awake-fed thermogenesis; CR, caloric restriction; DXA, dual X-ray absorptiometry; EE0, EE in the inactive state; 24hEE, 24-hour energy expenditure; FFM, fat-free mass; FM, fat mass; SLEEP, sleeping energy expenditure, 24hRQ, 24-h respiratory quotient.
Changes in body composition and energy metabolism during and after six weeks of caloric restriction
As expected, there was a substantial weight loss after six weeks of caloric restriction (Δ=−8.7 kg, CI: −11.8, −5.7, P=0.0002; Figure 2C) with a large inter-subject variability (SD=4.0 kg, range: −13.7 to −2.5 kg). The average weekly rate of weight loss over 42 days of caloric restriction was 1.3±0.4 kg/week (1.2±0.2% of weight on day 1 of caloric restriction) with inter-individual differences ranging from 0.7 to 1.7 kg/week (Supplemental Figure 5). The loss in body mass after six weeks of caloric restriction mainly reflected losses in FFM (Δ=−5.7 kg, CI: −8.6, −2.8, P=0.002; Figure 2C) but also in FM (Δ=−3.1 kg, CI: −3.8, −2.3, P<0.0001; Figure 2C). The average calculated CED was −38,467±12,804 kcal over 6 weeks (range: −55,955 to −17,295 kcal). Pratio showed a large inter-individual variability especially at the end of week 1 of caloric restriction (SD = 0.46 SD) with intra-individual constancy throughout and following caloric restriction (P = 0.20, Supplemental Figure 7).
After six weeks of caloric restriction and one week of weight stabilization in the new energy balance state after weight loss (Week 7), measured 24hEE (−165 kcal/day, CI: −281.8, −48.3, P=0.01), EE0 (−142 kcal/15h, CE −212.9, −71.9, P=0.002), AFT (−110 kcal/15h, CI: −180.1, −40.0, P=0.007), and PROTOX (−93 kcal/day, CI: −175.9, −10.1, P=0.03), but not SLEEP, RQ, CARBOX and LIPOX (all P>0.3), were still relatively lower compared to predicted values (Figure 4). Baseline hormone concentration and changes in hormone concentration after three and six weeks of caloric restriction did not predict weight loss after six weeks of caloric restriction (all P>0.05).
Interestingly, the extent of relative changes in 24hEE during and after caloric restriction demonstrated remarkable consistency during caloric restriction with a strong intra-individual correlation of these measures, such that the relative decrease in 24hEE after one week of caloric restriction was strongly correlated with that obtained after 3 weeks (r=0.92, P<0.001, Figure 5A) and during the post-caloric restriction period (r=0.78, P=0.02, Figure 5B).
Figure 5. Consistency of measures of 24hEE adaptive thermogenesis during different stages of caloric restriction.

Correlations between measures of adaptive thermogenesis in 24hEE after 1 week of caloric restriction (CR) and measures of adaptive thermogenesis in 24hEE after 3 weeks of CR (panel A) and adaptive thermogenesis in 24hEE at the post-CR period (panel B). In each panel, the Pearson correlation index is shown along with significance and sample size.
CR, caloric restriction; 24hEE, 24-hour energy expenditure.
Predictive ability of early adaptive thermogenesis relative to weight loss after six weeks of caloric restriction.
A lower-than-predicted change in 24hEE after 1 week of caloric restriction was associated with less weight loss after subsequent six weeks of caloric restriction, as assessed by the difference in bodyweight measured at the DXA scans (absolute weight loss: r=−0.75, P=0.02; Figure 6A; percentage weight loss: r=−0.83, P=0.006; Figure 6B) and the weekly rate of body weight loss calculated over the 42 days of caloric restriction (absolute rate: r=−0.69, P=0.04, Figure 6C; percentage rate: r=−0.81, P=0.009; Figure 6D). Specifically, a decrease of 100 kcal/day in measured 24hEE below what was predicted by changes in FM and FFM was on average associated with 2.0-kg less weight loss after six weeks (CI: −3.6, −0.4 kg). The assessment of 24hEE components revealed that these results for adaptive changes in 24hEE vs. weight loss measures were reflected by EE0 but not SLEEP (Supplemental Figure 8). Further, a relatively lower-than-predicted 24hEE was associated with less FFM (r =−0.64, P=0.06; Figure 7A) and FM (r =−0.66, P=0.05; Figure 7B) losses following six weeks of caloric restriction, such that a 100 kcal/day relative deficit in 24hEE was on average associated with 0.5-kg less FM loss after six weeks of caloric restriction (CI: −1.01, 0.01 kg).
Figure 6. Relationships between measurements of adaptive thermogenesis in 24hEE after one week of caloric restriction and weight loss following six weeks of caloric restriction.

Correlations between measures of adaptive thermogenesis in 24hEE after 1 week of caloric restriction with absolute weight loss (panel A), percentage weight loss (panel B), absolute daily rate of weight loss (panel C), and daily rate of weight loss expressed as percentage of initial body weight (panel D) after 6 weeks of caloric restriction (CR). In each panel, the Pearson correlation index is shown along with significance and sample size.
CR, caloric restriction; 24hEE, 24-hour energy expenditure.
Figure 7. Relationships between measurements of adaptive thermogenesis after one week of caloric restriction and body composition changes and cumulative caloric deficit following six weeks of caloric restriction.

Correlations between measures of adaptive thermogenesis in 24hEE after 1 week of caloric restriction and FFM loss (panel A), FM loss (panel B), and cumulative energy deficit (panel C) after 6 weeks of caloric restriction (CR). In each panel, the Pearson correlation index is shown along with significance and sample size.
CR, caloric restriction; 24hEE, 24-hour energy expenditure; FFM, fat-free mass; FM, fat mass.
There was an inverse association between CED and relative changes in 24hEE (r =−0.85, P=0.007; Figure 7C), such that a lower-than-predicted 24hEE by 100 kcal/day after 1 week of caloric restriction was associated on average with reduced CED (less calories lost) by 8,195 kcal during the subsequent 6-week caloric restriction period (CI: −13,226 to −3,163 kcal). The Pratio after 1 week of caloric restriction did not correlate with concomitant changes in EE (all P > 0.05). There were no associations between 6-week weight loss measures and relative changes in RQ, CARBOX, LIPOX, and PROTOX after the first week of caloric restriction (all P>0.05).
Discussion
The current study investigated whether the metabolic slowing that occurs early (i.e., within a week) during carefully controlled caloric restriction predicts longer-term changes in body composition and body weight in overweight but otherwise healthy individuals undergoing a 6-week, 50% caloric restriction period. The relative decrease in 24hEE (i.e., adaptive thermogenesis) induced by caloric restriction as accurately assessed for 24 hours within a whole-room indirect calorimeter demonstrated remarkable intra-individual consistency over the course of the 6-week weight loss under carefully controlled conditions. Our results show that the magnitude of adaptive thermogenesis, observed as early as after one week of caloric restriction, impacted daily energy balance during caloric restriction and predicted the extent of weight loss and, particularly, FM loss after six weeks of sustained, daily caloric restriction. These results indicate that longer-term weight loss outcomes in individuals undergoing caloric restriction may be in part driven by early adaptive thermogenesis to reduced daily caloric intake. Thus, in the attempt to improve weight loss outcomes in obesity therapy, our study points to immediate adaptive thermogenesis in the beginning of dietary intervention as a novel determinant of longer-term weight loss.
Adaptive thermogenesis in response to negative energy balance aims at the conservation of energy to counteract loss of body weight [3, 4]. During caloric restriction changes in body composition and shifts in hormone profiles occur with dynamic, diet-induced weight reduction in three specific proposed phases (I-III) [4]: During phase I, lasting approximately one week [7, 30, 31], initial weight loss is mainly due to a greater decrease of FFM rather than FM [4, 9]. FFM loss is substantially governed by an immediate diet-induced reduction in insulin secretion leading to depletion of hepatic glycogen stores, lower glucose oxidation and, as a consequence, losses of extracellular and intracellular water [4, 7]. Additionally proteolysis also contributes to the FFM reduction during this phase [7, 32]. On the hormonal level, decreased insulin secretion is paralleled by relatively lower secretion of thyroid hormones, leptin, and activity of the sympatho-adrenergic system [4, 9, 30, 31] as also confirmed in the present study. It is these metabolic processes which appear to underlie adaptive thermogenesis and induce metabolic slowing during early stages of caloric restriction as they result in changes in glycolytic and oxidative activity of the metabolically active organs affected by limited energy availability during conditions of energy deficit [3]. Yet, the determinants of early adaptive thermogenesis remain to be elucidated but might include sympathetic nervous system activity, adipokines (e.g., leptin) and thyroid hormones, as well as genetic and epigenetic response to caloric restriction and weight loss. During phase II, weight loss is determined by the overall greater mobilization of triglycerides from adipose tissue compartments with a concomitant increase in LIPOX compared to phase I [9]. During this phase, the decrease in actual, daily EE parallels body weight loss which is dominated by a reduction in FM. As a consequence, there is little additional metabolic adaptation during this time and no further increase in the magnitude of adaptive thermogenesis [4, 9, 33]. Our observations support this, as in our current study the extent of adaptive thermogenesis was similar at weeks 1 and 3, which is in line with a previous study showing similar intra-individual correlation after 10% and 20% weight loss [34]. Lastly, maintenance of weight loss after long-term caloric restriction is characterized by FM and FFM stability but with low thyroid hormone, leptin, insulin, and sympatho-adrenergic activity (phase III). During this phase, a relatively low EE is reached and metabolic adaptation is absent [4, 9, 33].
Based on the nonlinear dynamics of energy metabolism and weight loss over time, computational models that reliably predicted weight trajectories in response to negative energy balance in humans have been formulated and validated in different settings [35-39]. However, one limitation of these mathematical models includes the lack of inclusion of a direct assessment of the inter-individual variability in changes in 24hEE during weight loss [38]. Based on our data, the early decline in 24hEE which is predictive of further weight loss shows great variability even, as is the case here, when caloric restriction is carefully controlled. In line with a previous study assessing changes in resting metabolic rate in normal-weight men undergoing 3 weeks of caloric restriction [40, 41], the inter-individual variability in the adaptive thermogenesis after 1 week of caloric restriction ranged from −379 to +76 kcal/day [1] and represents an intriguing target to optimize weight loss regimes [1, 4, 5].
As adaptive thermogenesis occurs during phase I of weight reduction and appears to be stable throughout phase II [9, 33], our data indicate that interventions to counteract adaptive thermogenesis should occur early in weight loss. One approach is to recommend increased physical activity as part of lifestyle changes in those with greater extent of adaptive thermogenesis [12], [42-45]. This would aim to increase the non-resting component of EE to counteract the relatively greater decrease in EE. Increasing or maintaining FFM may also result in overall greater weight loss by blunting adaptive thermogenesis [46]. Interventions during caloric restriction may focus on reversing early hormonal changes, such as occurring for thyroid hormones, leptin and catecholamines, as were observed in our study and which might be related to metabolic adaptive processes [4]. Notably, we did not observe significant associations between measures of adaptive thermogenesis or weight loss and reported hormonal changes during caloric restriction or their baseline measures, although these analyses had limited statistical power and only included hormonal measures in the late phases of caloric restriction (weeks 3 and 6) but not during the early phase due to blood draw limitations. To elucidate the hormonal mechanisms underlying processes of metabolic adaptation, future studies are warranted and should include simultaneous measurement of hormones, anthropometry, bioenergetics of muscle and adipose tissue measured in concordance with energy expenditure especially during early phases of caloric restriction. In an interventional approach and comparable to previous studies [47, 48], substitution of leptin and levodopa, but also levothyroxine during the early phase of caloric restriction might reduce the extent of adaptive thermogenesis, thus eventually leading to better weight loss outcomes in the subsequent phases. Clinical trials targeting adaptive thermogenesis to influence weight loss may further improve our limited understanding of the physiologic underpinnings of adaptive thermogenesis. Already, algorithms modeling weight loss dynamics are helpful to predict the outcome of therapies [49], thus the addition of direct measures of early adaptive thermogenesis into such models could improve their clinical use.
We observed evidence of adaptive thermogenesis in EE0 and SLEEP in particular, i.e. measures of the energy expended in the inactive state [18]. This is in line with the original definition of adaptive thermogenesis referring to a process of metabolic adaptation during the resting component of 24hEE [50]. Notably, we found strong intra-individual correlation of repeated measures of adaptive thermogenesis throughout the course of our intervention supporting previous assumptions that metabolic adaptation is a subject-specific trait [4, 9], perhaps genetically determined given the heritability of 24hEE [51]. Indeed, changes in EE during energy deficit are affected by the genetic background [38]. Adding a measure of adaptive thermogenesis to assessments such as those used to categorize spendthrift versus thrifty phenotypes may help identify a more comprehensive human metabolic phenotype that characterizes the susceptibility to weight change [52]. Comparable to measures of adaptive thermogenesis and in line with previous results [53], there was intra-individual constancy in measures of energy-partitioning (Pratio) throughout the caloric restriction period but considerable inter-individual variation, especially during early stages during caloric restriction. Given the relevance of FFM in processes of adaptive thermogenesis, investigating energy-partitioning during different stages of controlled energy deficit and underlying biological mechanisms may further our understanding of metabolic adaptation.
We acknowledge that our observations derive from a small study with some missing data. Owing to technical and logistical limitations of conducting a caloric restriction study for 42 continuous days simultaneously in multiple subjects admitted to our clinical research unit, not all the volunteers could undergo the clinical tests on the scheduled days. However, it should be pointed out that these few missing values were missing completely at random, thus it is unlikely their exclusion constitutes a bias in interpreting the presented results as our sensitivity analyses with the last observation carried forward to replace missing values showed similar results. Our measurements were done in a highly controlled setting and our observed changes in energy metabolism were in line with what has been previously reported [3, 4, 9]. It is also true that measured adaptive thermogenesis may depend on the diet administered to study participants [7] and we administered a balanced liquid diet only. However, other reports claim that adaptive thermogenesis is independent of diet [54-56] and the one we used has been administered in other caloric restriction studies and did not appear to interfere with 24hEE assessments [1, 57]. Compared to a previous caloric restriction study employing different body composition techniques concomitantly [9], our assessment of body composition changes during caloric restriction by DXA could not quantify changes in anatomical composition and hydration of FFM which could have partly altered our results. Notably, more elaborate assessment of dynamic changes in FM and FFM could have addressed energy-partitioning in investigated subjects which may have aided in explaining the variability in weight loss outcomes [22]. Due to blood draw restrictions we could not assess changes in insulin secretion which was previously proposed as a determinant of adaptive thermogenesis [9]. Lastly, as we did not measure hormone concentrations during the first week of caloric restriction, we cannot exclude that hormonal changes may play a role in the extent of adaptive thermogenesis. Further, the results from these analyses (particularly, those comparing differences in the magnitude of changes during the caloric restriction period) are exploratory and should be confirmed in future studies in larger cohorts.
To conclude, our results show that the early individual metabolic response to diet is consistent during prolonged caloric restriction, affects daily energy balance during caloric restriction, and is a determinant of the extent of body weight and FM loss over time, such that less metabolic slowing is associated with greater longer-term loss of FM and body weight. These findings emphasize that weight loss outcomes are greatly influenced by inter-individual variability in the metabolic response to caloric restriction, which can be seen as early as the first week on a diet. Thus, new therapies aiming at early adaptive thermogenesis during dieting might prove helpful in our attempt to optimize interventions in obesity and obesity-related disorders.
Supplementary Material
Highlights.
Adaptive thermogenesis (AT) refers to metabolic slowing during caloric restriction
AT can be detected as early as the first week of daily caloric restriction (CR)
AT is consistent during prolonged CR and affects daily energy balance during CR
Early AT predicts subsequent weight loss and fat mass loss following 6-week of CR
Acknowledgements
The authors thank the staff of the Obesity and Diabetes Clinical Research Section and the participants of this long-term inpatient study. The technical and logistic support of Susan Bonfiglio, PA, National Institute of Diabetes and Digestive and Kidney Diseases, in performing procedures and collecting data is gratefully acknowledged.
Funding. This research was supported by the Intramural Research Program of the NIH, The National Institute of Diabetes and Digestive and Kidney Diseases (NIDDK). P.P. was supported by the program “Rita Levi Montalcini for young researchers” from the Italian Minister of Education and Research.
Funding source: This study was supported by the Intramural Research Program of the National Institutes of Health, National Institute of Diabetes and Digestive and Kidney Diseases.
Abbreviations:
- 24hEE
24-hour energy expenditure
- 24hRQ
24-h respiratory quotient
- AFT
awake-fed thermogenesis
- CARBOX
carbohydrate oxidation rate
- CED
cumulative energy deficit
- DAF
daily activity factor
- DXA
dual-energy X-ray absorptiometry
- EE0
EE in the inactive state
- LIPOX
lipid oxidation rate
- FFM
fat-free mass
- FM
fat mass
- OGTT
oral glucose tolerance test
- PROTOX
protein oxidation rate
- SLEEP
sleeping energy expenditure
- SPA
spontaneous physical activity
- WMD
weight maintaining diet
Footnotes
Disclosure summary. The authors declare no conflict of interest.
Prior presentation. This work has not been presented previously.
Conflict of interest Statement: The authors have nothing to disclose.
ClinicalTrials.gov identifier: NCT00687115
Publisher's Disclaimer: This is a PDF file of an unedited manuscript that has been accepted for publication. As a service to our customers we are providing this early version of the manuscript. The manuscript will undergo copyediting, typesetting, and review of the resulting proof before it is published in its final form. Please note that during the production process errors may be discovered which could affect the content, and all legal disclaimers that apply to the journal pertain.
References
- [1].Reinhardt M, Thearle MS, Ibrahim M, Hohenadel MG, Bogardus C, Krakoff J, et al. A human thrifty phenotype associated with less weight loss during caloric restriction. Diabetes. 2015;64:2859–67. [DOI] [PMC free article] [PubMed] [Google Scholar]
- [2].Heymsfield SB, Wadden TA. Mechanisms, pathophysiology, and management of obesity. New England Journal of Medicine. 2017;376:254–66. [DOI] [PubMed] [Google Scholar]
- [3].Müller M, Bosy-Westphal A. Adaptive thermogenesis with weight loss in humans. Obesity. 2013;21:218–28. [DOI] [PubMed] [Google Scholar]
- [4].Müller MJ, Enderle J, Bosy-Westphal A. Changes in energy expenditure with weight gain and weight loss in humans. Current obesity reports. 2016;5:413–23. [DOI] [PMC free article] [PubMed] [Google Scholar]
- [5].Tremblay A, Royer M, Chaput J, Doucet E. Adaptive thermogenesis can make a difference in the ability of obese individuals to lose body weight. International journal of obesity. 2013;37:759. [DOI] [PubMed] [Google Scholar]
- [6].Dulloo AG, Jacquet J, Montani JP, Schutz Y. Adaptive thermogenesis in human body weight regulation: more of a concept than a measurable entity? Obesity Reviews. 2012;13:105–21. [DOI] [PubMed] [Google Scholar]
- [7].Heymsfield S, Thomas D, Nguyen A, Peng J, Martin C, Shen W, et al. Voluntary weight loss: systematic review of early phase body composition changes. obesity reviews. 2011;12. [DOI] [PubMed] [Google Scholar]
- [8].Rosenbaum M, Leibel RL. Adaptive thermogenesis in humans. International journal of obesity. 2010;34:S47. [DOI] [PMC free article] [PubMed] [Google Scholar]
- [9].Müller MJ, Enderle J, Pourhassan M, Braun W, Eggeling B, Lagerpusch M, et al. Metabolic adaptation to caloric restriction and subsequent refeeding: the Minnesota Starvation Experiment revisited. The American journal of clinical nutrition. 2015;102:807–19. [DOI] [PubMed] [Google Scholar]
- [10].Bosy-Westphal A, Schautz B, Lagerpusch M, Pourhassan M, Braun W, Goele K, et al. Effect of weight loss and regain on adipose tissue distribution, composition of lean mass and resting energy expenditure in young overweight and obese adults. International journal of obesity. 2013;37. [DOI] [PubMed] [Google Scholar]
- [11].Fothergill E, Guo J, Howard L, Kerns JC, Knuth ND, Brychta R, et al. Persistent metabolic adaptation 6 years after “The Biggest Loser” competition. Obesity. 2016;24:1612–9. [DOI] [PMC free article] [PubMed] [Google Scholar]
- [12].Ravussin E, Lillioja S, Anderson TE, Christin L, Bogardus C. Determinants of 24-hour energy expenditure in man. Methods and results using a respiratory chamber. Journal of Clinical Investigation. 1986;78:1568–87. [DOI] [PMC free article] [PubMed] [Google Scholar]
- [13].Heymsfield S, Thomas D, Nguyen A, Peng J, Martin C, Shen W, et al. Voluntary weight loss: systematic review of early phase body composition changes. obesity reviews. 2011;12:e348–e61. [DOI] [PubMed] [Google Scholar]
- [14].Piaggi P, Thearle MS, Bogardus C, Krakoff J. Lower energy expenditure predicts long-term increases in weight and fat mass. The Journal of Clinical Endocrinology & Metabolism. 2013;98:703–7. [DOI] [PMC free article] [PubMed] [Google Scholar]
- [15].Association AD. Report of the expert committee on the diagnosis and classification of diabetes mellitus. Diabetes care. 2003;26:s5–s20. [DOI] [PubMed] [Google Scholar]
- [16].Ferraro R, Boyce VL, Swinburn B, De Gregorio M, Ravussin E. Energy cost of physical activity on a metabolic ward in relationship to obesity. The American journal of clinical nutrition. 1991;53:1368–71. [DOI] [PubMed] [Google Scholar]
- [17].Schutz Y, Ravussin E, Diethelm R, Jequier E. Spontaneous physical activity measured by radar in obese and control subject studied in a respiration chamber. International journal of obesity. 1981;6:23–8. [PubMed] [Google Scholar]
- [18].Piaggi P, Krakoff J, Bogardus C, Thearle MS. Lower “awake and fed thermogenesis” predicts future weight gain in subjects with abdominal adiposity. Diabetes. 2013;62:4043–51. [DOI] [PMC free article] [PubMed] [Google Scholar]
- [19].Abbott WG, Howard BV, Christin L, Freymond D, Lillioja S, Boyce VL, et al. Short-term energy balance: relationship with protein, carbohydrate, and fat balances. The American journal of physiology. 1988;255:E332–7. [DOI] [PubMed] [Google Scholar]
- [20].Hollstein T, Ando T, Basolo A, Krakoff J, Votruba SB, Piaggi P. Metabolic response to fasting predicts weight gain during low-protein overfeeding in lean men: further evidence for spendthrift and thrifty metabolic phenotypes. Am J Clin Nutr. 2019. [DOI] [PMC free article] [PubMed] [Google Scholar]
- [21].Hollstein T, Ando T, Basolo A, Krakoff J, Votruba SB, Piaggi P. Metabolic response to fasting predicts weight gain during low-protein overfeeding in lean men: further evidence for spendthrift and thrifty metabolic phenotypes. The American journal of clinical nutrition. 2019;110:593–604. [DOI] [PMC free article] [PubMed] [Google Scholar]
- [22].Dulloo A, Jacquet J. The control of partitioning between protein and fat during human starvation: its internal determinants and biological significance. British Journal of Nutrition. 1999;82:339–56. [DOI] [PubMed] [Google Scholar]
- [23].Forbes R, Mitchell H, Cooper A. Further studies on the gross composition and mineral elements of the adult human body. Journal of Biological Chemistry. 1956;223:969–75. [PubMed] [Google Scholar]
- [24].Forbes RM, Cooper A, Mitchell H. The composition of the adult human body as determined by chemical analysis. Journal of Biological Chemistry. 1953;203:359–66. [PubMed] [Google Scholar]
- [25].Livesey G, Elia M. Estimation of energy expenditure, net carbohydrate utilization, and net fat oxidation and synthesis by indirect calorimetry: evaluation of errors with special reference to the detailed composition of fuels. The American journal of clinical nutrition. 1988;47:608–28. [DOI] [PubMed] [Google Scholar]
- [26].Bender R, Lange S. Adjusting for multiple testing—when and how? Journal of clinical epidemiology. 2001;54:343–9. [DOI] [PubMed] [Google Scholar]
- [27].Grubbs FE. Procedures for detecting outlying observations in samples. Technometrics. 1969;11:1–21. [Google Scholar]
- [28].Tukey JW. Exploratory data analysis. Reading, Ma. 1977;231:32. [Google Scholar]
- [29].Rosner B Percentage points for a generalized ESD many-outlier procedure. Technometrics. 1983;25:165–72. [Google Scholar]
- [30].Forbes GB. Weight loss during fasting: implications for the obese. The American journal of clinical nutrition. 1970;23:1212–9. [DOI] [PubMed] [Google Scholar]
- [31].Forbes GB, Drenick EJ. Loss of body nitrogen on fasting. The American journal of clinical nutrition. 1979;32:1570–4. [DOI] [PubMed] [Google Scholar]
- [32].Lehninger AL, Nelson DL, Cox MM, Cox MM. Principles of biochemistry: Macmillan; 2005. [Google Scholar]
- [33].James Müller M Adaptive thermogenesis: Do we need new thinking? Obesity. 2016;24:1610–1. [DOI] [PubMed] [Google Scholar]
- [34].Rosenbaum M, Leibel RL. Models of energy homeostasis in response to maintenance of reduced body weight. Obesity (Silver Spring). 2016;24:1620–9. [DOI] [PMC free article] [PubMed] [Google Scholar]
- [35].Hall KD. Computational model of in vivo human energy metabolism during semistarvation and refeeding. American Journal of Physiology-Endocrinology and Metabolism. 2006;291:E23–E37. [DOI] [PMC free article] [PubMed] [Google Scholar]
- [36].Hall KD. Predicting metabolic adaptation, body weight change, and energy intake in humans. American Journal of Physiology-Endocrinology and Metabolism. 2009;298:E449–E66. [DOI] [PMC free article] [PubMed] [Google Scholar]
- [37].Hall KD. Mechanisms of metabolic fuel selection: modeling human metabolism and bodyweight change. IEEE Engineering in Medicine and Biology Magazine. 2010;29:36–41. [DOI] [PubMed] [Google Scholar]
- [38].Hall KD, Sacks G, Chandramohan D, Chow CC, Wang YC, Gortmaker SL, et al. Quantification of the effect of energy imbalance on bodyweight. The Lancet. 2011;378:826–37. [DOI] [PMC free article] [PubMed] [Google Scholar]
- [39].Heilbronn LK, de Jonge L, Frisard MI, DeLany JP, Larson-Meyer DE, Rood J, et al. Effect of 6-month calorie restriction on biomarkers of longevity, metabolic adaptation, and oxidative stress in overweight individuals: a randomized controlled trial. Jama. 2006;295:1539–48. [DOI] [PMC free article] [PubMed] [Google Scholar]
- [40].James Muller M Adaptive thermogenesis: Do we need new thinking? Obesity (Silver Spring). 2016;24:1610–1. [DOI] [PubMed] [Google Scholar]
- [41].Muller MJ, Enderle J, Pourhassan M, Braun W, Eggeling B, Lagerpusch M, et al. Metabolic adaptation to caloric restriction and subsequent refeeding: the Minnesota Starvation Experiment revisited. The American journal of clinical nutrition. 2015;102:807–19. [DOI] [PubMed] [Google Scholar]
- [42].Forbes GB. Exercise and body composition. Journal of Applied Physiology. 1991;70:994–7. [DOI] [PubMed] [Google Scholar]
- [43].Forbes GB. Body fat content influences the body composition response to nutrition and exercise. Annals of the New York Academy of Sciences. 2000;904:359–65. [DOI] [PubMed] [Google Scholar]
- [44].Ballor DL, Poehlman ET. Exercise-training enhances fat-free mass preservation during diet-induced weight loss: a meta-analytical finding. 1994. [PubMed] [Google Scholar]
- [45].Garrow J, Summerbell C. Meta-analysis: effect of exercise, with or without dieting, on the body composition of overweight subjects. European journal of clinical nutrition. 1995;49:1–10. [PubMed] [Google Scholar]
- [46].Johannsen DL, Knuth ND, Huizenga R, Rood JC, Ravussin E, Hall KD. Metabolic slowing with massive weight loss despite preservation of fat-free mass. The Journal of Clinical Endocrinology & Metabolism. 2012;97:2489–96. [DOI] [PMC free article] [PubMed] [Google Scholar]
- [47].Rosenbaum M, Murphy EM, Heymsfield SB, Matthews DE, Leibel RL. Low dose leptin administration reverses effects of sustained weight-reduction on energy expenditure and circulating concentrations of thyroid hormones. The Journal of Clinical Endocrinology & Metabolism. 2002;87:2391–4. [DOI] [PubMed] [Google Scholar]
- [48].Shetty P, Jung R, James W. Effect of catecholamine replacement with levodopa on the metabolic response to semistarvation. The Lancet. 1979;313:77–9. [DOI] [PubMed] [Google Scholar]
- [49].Guo J, Brager DC, Hall KD. Simulating long-term human weight-loss dynamics in response to calorie restriction. The American journal of clinical nutrition. 2018;107:558–65. [DOI] [PMC free article] [PubMed] [Google Scholar]
- [50].Keys A, Brozek J, Henschel A, Mickelsen O, Taylor HL, Simson E, et al. The biology of human starvation. The Biology of Human Starvation. 1950. [Google Scholar]
- [51].Piaggi P, Masindova I, Muller YL, Mercader J, Wiessner GB, Chen P, et al. A genome-wide association study using a custom genotyping array identifies variants in GPR158 associated with reduced energy expenditure in American Indians. Diabetes. 2017;66:2284–95. [DOI] [PMC free article] [PubMed] [Google Scholar]
- [52].Piaggi P Metabolic Determinants of Weight Gain in Humans. Obesity. 2019;27:691–9. [DOI] [PMC free article] [PubMed] [Google Scholar]
- [53].Dulloo AG, Jacquet J, Girardier L. Autoregulation of body composition during weight recovery in human: the Minnesota Experiment revisited. International journal of obesity and related metabolic disorders: journal of the International Association for the Study of Obesity. 1996;20:393–405. [PubMed] [Google Scholar]
- [54].Ebbeling CB, Swain JF, Feldman HA, Wong WW, Hachey DL, Garcia-Lago E, et al. Effects of dietary composition on energy expenditure during weight-loss maintenance. Jama. 2012;307:2627–34. [DOI] [PMC free article] [PubMed] [Google Scholar]
- [55].De Jonge L, Bray GA, Smith SR, Ryan DH, De Souza RJ, Loria CM, et al. Effect of diet composition and weight loss on resting energy expenditure in the POUNDS LOST study. Obesity. 2012;20:2384–9. [DOI] [PMC free article] [PubMed] [Google Scholar]
- [56].Racette SB, Schoeller DA, Kushner RF, Neil KM, Herling-Iaffaldano K. Effects of aerobic exercise and dietary carbohydrate on energy expenditure and body composition during weight reduction in obese women. The American journal of clinical nutrition. 1995;61:486–94. [DOI] [PubMed] [Google Scholar]
- [57].Heinitz S, Piaggi P, Yang S, Bonfiglio S, Steel J, Krakoff J, et al. Response of skeletal muscle UCP2-expression during metabolic adaptation to caloric restriction. International journal of obesity. 2018. [DOI] [PubMed] [Google Scholar]
Associated Data
This section collects any data citations, data availability statements, or supplementary materials included in this article.