
Figure 6. Pathway analysis indicates IL-10 signaling is enriched in IBR+VEN resistant samples.
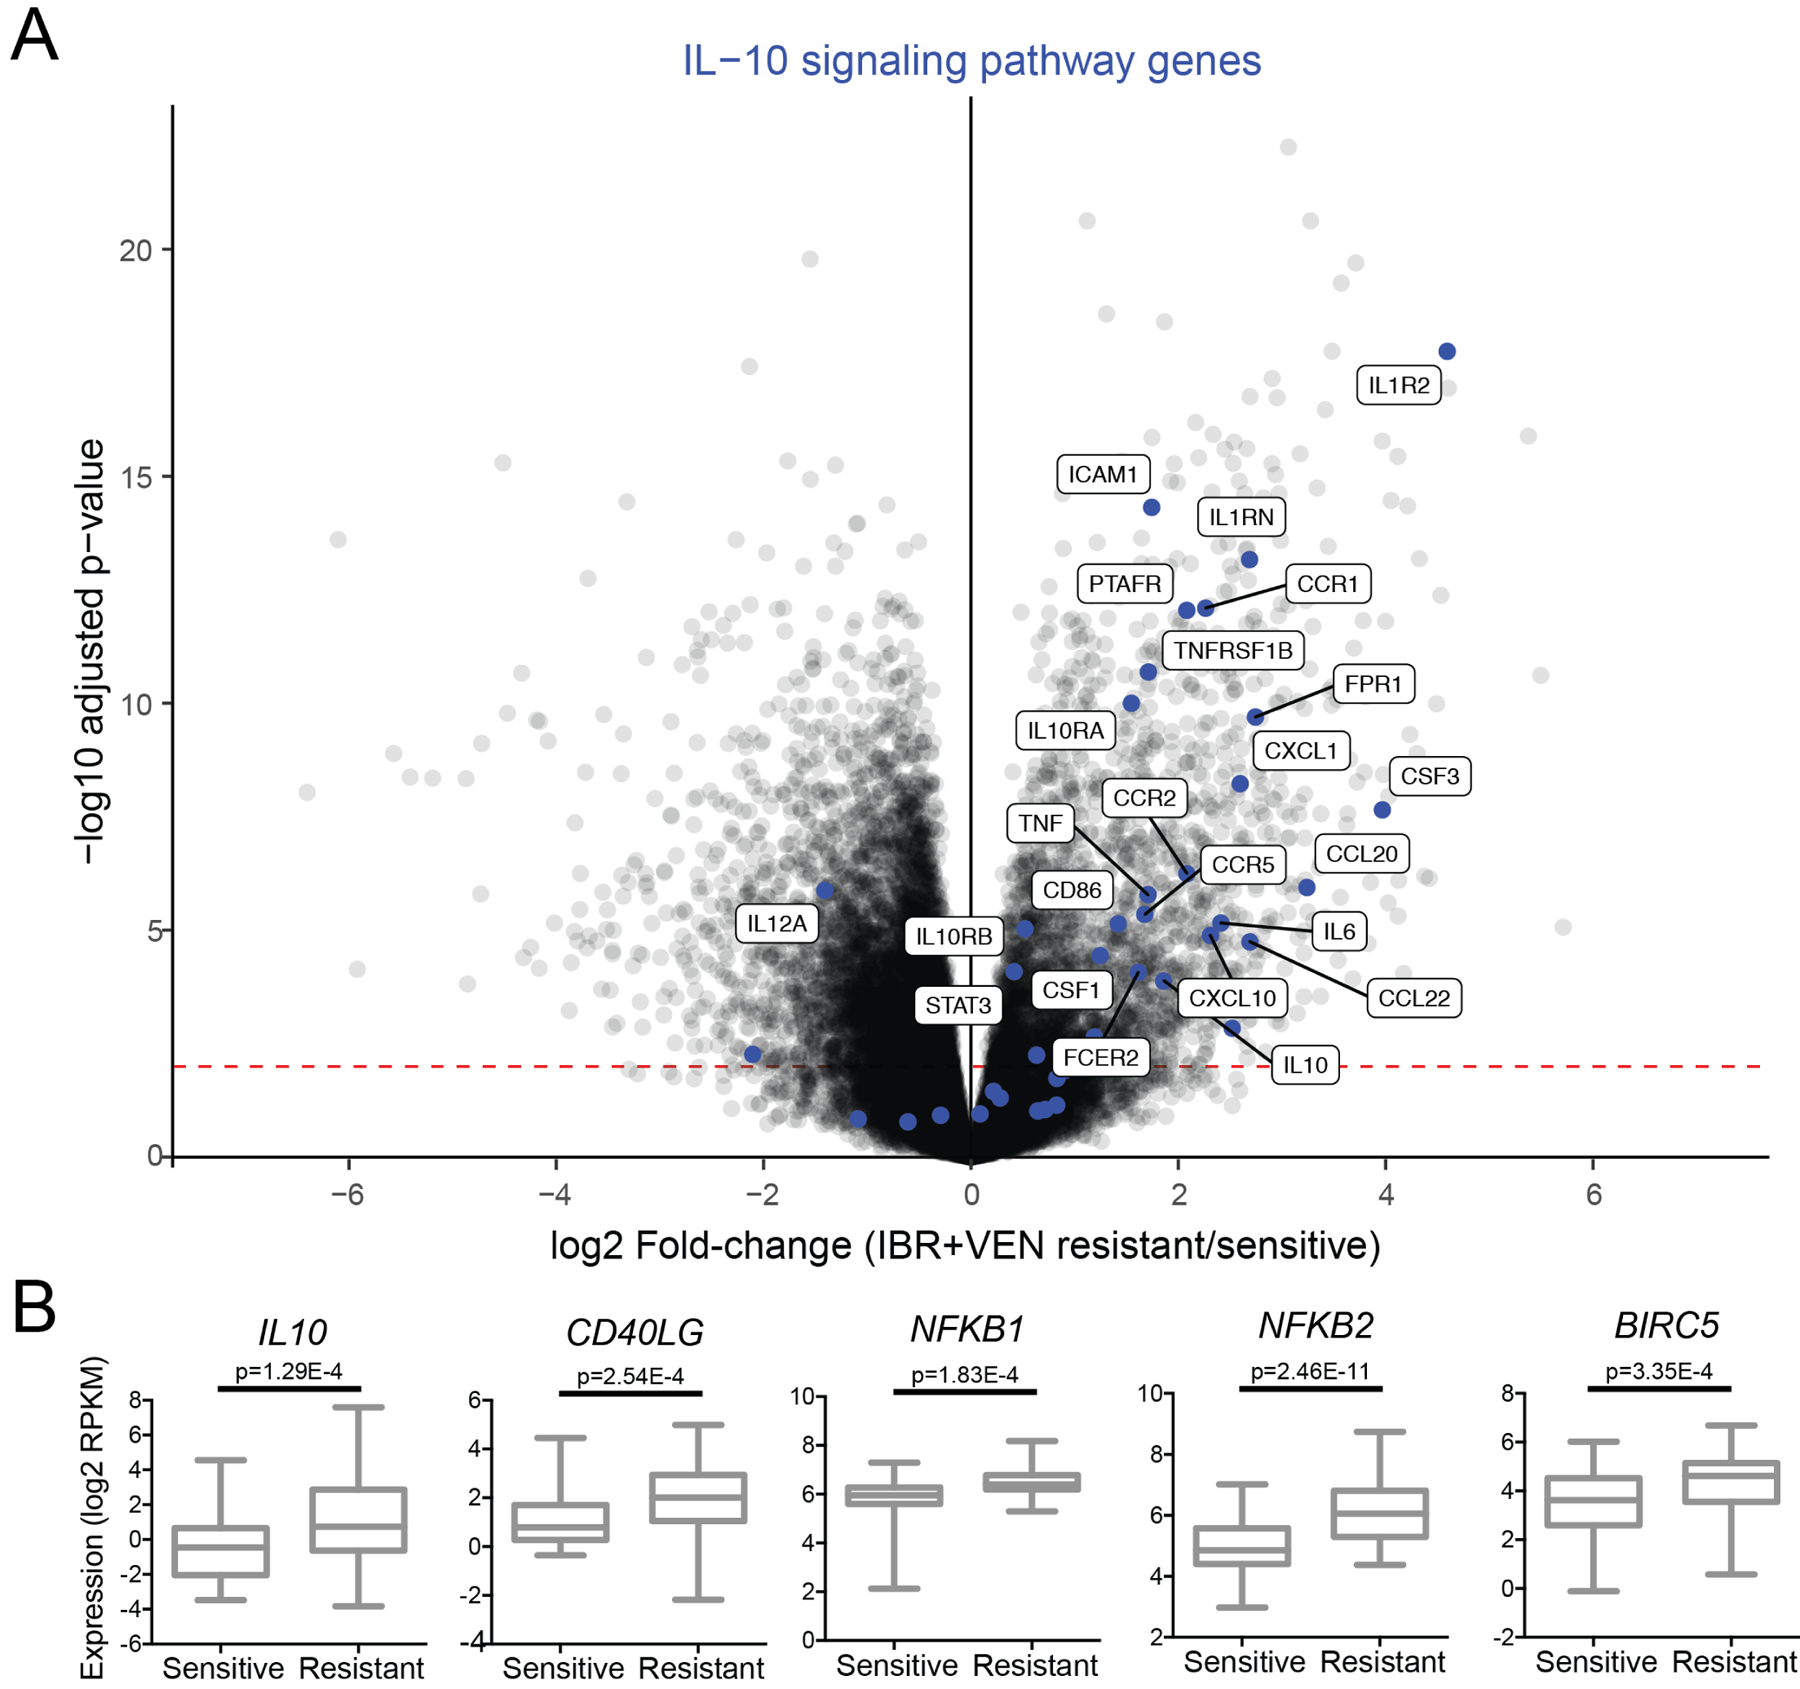
A. The IL-10 signaling pathway is enriched in IBR+VEN resistant samples as represented in the volcano plot depicting the relative expression of ~22,000 genes. Genes involved in the IL-10 signaling pathway are highlighted by blue dots; differentially expressed genes with an adjusted p-value < 0.001 are labeled. Red dashed line indicates p-value of 0.01. B. Dot plot comparisons of expression for select DE inflammatory signaling pathway genes.