

Summary
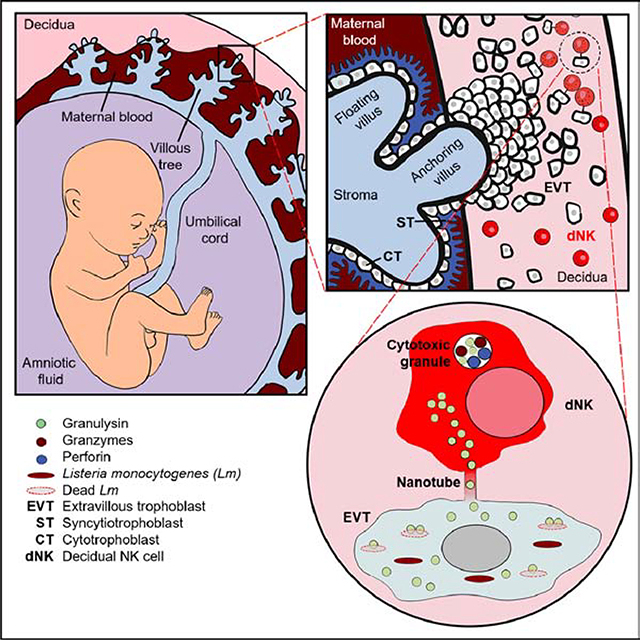
Maternal decidual NK cells (dNK) promote placentation, but how they protect against placental infection, while maintaining fetal tolerance, is unclear. Here we show human dNK highly express the antimicrobial peptide granulysin (GNLY) and selectively transfer it via nanotubes to extravillous trophoblasts to kill intracellular Listeria monocytogenes (Lm) without killing the trophoblast. Transfer of GNLY, but not other cell death-inducing cytotoxic granule proteins, strongly inhibits Lm in human placental cultures and in mouse and human trophoblast cell lines. Placental and fetal Lm loads are lower and pregnancy success is greatly improved in pregnant Lm-infected GNLY-transgenic mice than in wild-type mice that lack GNLY. This immune defense is not restricted to pregnancy - peripheral NK (pNK) also transfer GNLY to kill bacteria within macrophages and dendritic cells, without killing the host cell. Nanotube transfer of GNLY allows dNK to protect against infection while leaving the maternal-fetal barrier intact.
Keywords: decidual NK, granulysin, maternal-fetal tolerance, extravillous trophoblast, Listeria monocytogenes, pregnancy, nanotube, cytotoxic granule
In brief
Natural killer cells fend off Listeria infection in the placenta by funneling an antimicrobial peptide through nanotubes to infected trophoblasts.
Graphical Abstract
Introduction
dNK, the most abundant immune cell at the maternal-fetal interface in the first trimester of pregnancy, are prime candidates for protection against placental infection. dNK are armed to kill – they express high levels of the cytolytic effectors perforin (PFN), granzymes (Gzm) and granulysin (GNLY) (King et al., 1993; Koopman et al., 2003; Vujaklija et al., 2011). However, they do not kill classical NK target cells as well as pNK (Hanna et al., 2006; Koopman et al., 2003; Kopcow et al., 2005; Moffett-King, 2002). Although dNK kill human cytomegalovirus-infected decidual (maternal) stromal cells, they do not degranulate or kill (fetal) extravillous trophoblasts (EVT) even when they are infected (Crespo et al., 2016; Siewiera et al., 2013). Thus, the maternal immune response in the placenta is handicapped for defense against infection.
Fetal and maternal cells contact each other at the villi where maternal blood bathes villous trophoblast (VT) syncytia for nutrient exchange and the maternal decidua where extravillous trophoblasts (EVT) anchor the villi to the uterus (Moffett-King, 2002). VT syncytia resist some bacterial infections, while EVT have heightened susceptibility and can be infected by a variety of pathogens (Cao and Mysorekar, 2014; Robbins et al., 2010). Maternal infection can be transmitted by trophoblasts and spread to the fetus with severe consequences. In utero infection with viruses (Zika, HCMV, other herpesviruses, rubella, B19 parvovirus), bacteria (Lm, group B streptococci (GBS), syphilis), and parasites (Toxoplasma gondii, Plasmodium spp.) causes fetal distress and loss, premature labor, congenital anomalies, and intrauterine growth restriction (Błaszkowska and Góralska, 2014; Zeldovich and Bakardjiev, 2012).
dNK tolerance of infected VT and EVT contributes to pathogen persistence and promotes fetal transmission. Tolerance has been linked to special properties of trophoblasts (Hanna et al., 2006; Kopcow et al., 2005; Moffett-King, 2002). VT do not express classical MHC class I (to avoid T cell recognition) or known NK activating ligands. EVT only express HLA-C and nonclassical MHC molecules, including HLA-E and -G, which are recognized by both inhibitory and activating NK receptors. The molecular basis for reduced dNK cytotoxicity is not well understood. dNK secrete cytokines, such as IL-8, VEGF and GM-CSF, that increase trophoblast migration, uterine spiral artery remodeling, placentation and uterine vascularization (Hanna et al., 2006; Koopman et al., 2003) and regulation of trophoblast invasion and differentiation to promote placentation is considered the main role of dNK. The tolerogenic placental environment favors fetal and placental development (Crespo et al., 2017; Erlebacher, 2013; Zeldovich and Bakardjiev, 2012), but interferes with immune defense.
GNLY, an antimicrobial peptide expressed only by killer lymphocytes, selectively disrupts bacterial, fungal, and parasite membranes (Dotiwala and Lieberman, 2019). GNLY is proteolytically processed from a 15 kDa precursor to a 9 kDa active protein. Most mammals, but not rodents, express GNLY. The other cytotoxic granule pore-forming protein, PFN, selectively injures mammalian, but not microbial, membranes. Ordinarily, when a killer cell recognizes an infected cell, cytotoxic granules move to the immune synapse and release their cytotoxic granule proteins into the synapse (Walch et al., 2014). PFN delivers GNLY and the Gzms into the infected host cell, where the Gzms kill the host cell. Within the target, GNLY delivers the Gzms into intracellular microbes to trigger microptosis, programmed cell death in microbes (Dotiwala et al., 2016, 2017; Walch et al., 2014). Thus, killer cell-mediated death of intracellular microbes requires all three cytotoxic effector molecules – PFN, Gzms and GNLY. At high concentrations GNLY on its own lyses bacteria, but at lower concentrations bacterial killing depends on Gzms (Dotiwala et al., 2016; Stenger et al., 1998; Walch et al., 2014).
dNK express more GNLY than pNK and secrete GNLY constitutively (Vujaklija et al., 2011). However, the role of GNLY in dNK defense against placental infection has not been studied. To investigate whether dNK GNLY helps protect against intrauterine infection in pregnancy, we studied Lm infection. Lm spreads to the placenta either via an ascending vaginal infection or from the blood. Pregnant women have 17-fold more clinically symptomatic Lm infection than the general population. Lm can cause miscarriage, stillbirth, preterm delivery, and neonatal sepsis. Here we describe a way that dNK balance the contradictory demands of tolerating fetal cells and protecting against infection. dNK kill intracellular Lm in trophoblasts without killing the infected trophoblast. GNLY and cell-cell connections via nanotubes are involved.
Results
dNK highly express GNLY in cytotoxic granules and the cytosol
dNK from healthy first trimester placentas expressed GNLY and other cytolytic granule proteins (PFN, GzmA and GzmB), as previously reported (Crespo et al., 2016; King et al., 1993; Vujaklija et al., 2011) (Figure 1A, S1A). dNK contained 10X more 9 kDa and total GNLY than healthy donor pNK, assessed using DH2 and RB1 monoclonal antibodies, respectively. PFN was about 10X lower in dNK than pNK, consistent with their reduced cytotoxicity against mammalian cells. After overnight culture in a low amount of IL-15 (2.5 ng/ml), dNK constitutively secreted ~20-fold more GNLY than pNK (Figure 1B). Only the active form was secreted (Figure 1C). dNK secreted significantly less GzmA, GzmB and PFN than GNLY (Figure S1B). Because GNLY was selectively secreted compared to other cytotoxic granule components, GNLY and PFN localization in dNK were compared. By confocal microscopy (Figure 1D, S1C) and imaging flow cytometry (Figure 1E–G, S1D, E), two pools of dNK GNLY were visualized - in cytotoxic granules and in the cytosol. In contrast, PFN was only in granules. In fresh pNK, GNLY staining was dimmer and localized with PFN in cytotoxic granules. In pNK activated for 6 days with 5 ng/ml IL-15 and 50 U/ml IL-2, GNLY expression increased, but was still lower than in dNK, and was in both the cytoplasm and granules. Thus, when GNLY expression is high in dNK or activated pNK, it localizes to both cytotoxic granules and cytosol, while PFN is restricted to cytotoxic granules.
Figure 1. dNK express GNLY within cytotoxic granules and in the cytosol.

(A) Representative flow cytometry histograms (left) of GNLY (9 kDa (clone DH2) and total (clone RB1)), GzmA, GzmB and PFN and mean fluorescence intensity (MFI) (right) of GNLY staining of human dNK and pNK.
(B) GNLY in 12 h culture supernatants of human dNK (n=18) and pNK (n=13) by ELISA.
(C) Representative immunoblot, probed with GNLY polyclonal rabbit antisera, of purified GNLY or clone DH10 (which recognizes 9 kDa and 15 kDa GNLY)-immunoprecipitated (IP) GNLY from dNK or pNK cell lysates or supernatants (sup). JEG-3 lysate is a negative control.
(D) Confocal images of representative dNK, fresh pNK and activated pNK stained for total GNLY (RB1) and PFN, acquired with a Zeiss LSM 700 microscope. Scale bars, 5 μm.
(E) Representative raw images from imaging flow cytometry of NK stained for total GNLY (RB1), PFN and DAPI. Scale bars, 7 μm.
(F, G) Examples of cytoplasmic and granule masks (F) used to measure GNLY localization in (G). Scale bars, 7 μm. Cytoplasmic and granule GNLY MFI were measured in 1,000–6,000 cells from 3–5 donors by imaging flow cytometry. Data show median with interquartile range (A, B) or mean ± s.e.m (G). ** p<0.01, ***p<0.001 by Mann-Whitney rank test or Kolmogorov-Smirnov test (A, B) or unpaired one-way ANOVA, followed by Tukey’s post-test of each cell type compared with every other type (G). See also Figure S1A–E.
dNK kill Lm within a trophoblast-like cell line, without degranulating or killing trophoblasts
To investigate whether the high amounts of secreted 9 kDa GNLY kill bacteria, dNK and pNK supernatants were added to cell-free Lm or to an Lm-infected trophoblast-like choriocarcinoma cell line, JEG-3 (Apps et al., 2009) (Figure 2A). dNK, but not pNK, supernatants reduced cell-free Lm colony forming units (CFU) by 2-fold. However, neither supernatant reduced Lm CFU within JEG-3. Next, the ability of dNK and pNK to kill intracellular Lm within JEG-3 was tested. A 3 h coculture with dNK or pNK significantly reduced intracellular Lm CFU in JEG-3 (Figure 2B, left). Surprisingly, dNK and pNK did not kill JEG-3 (Figure 2B, right) or release their cytotoxic granules, assessed by externalization of CD107a, during co-culture with uninfected or Lm-infected JEG-3 (Figure 2C). In contrast, both dNK and pNK degranulated and killed 721.221, a conventional NK target (Figure 2C, D right). Lm suppression without host cell death provides a potential mechanism to establish immunity without breaking placental immune tolerance.
Figure 2. NK kill Lm within a trophoblast-like cell line without killing the host cell.

(A) Cell-free Lm (left) or Lm CFU in infected JEG-3 (right) after 3 h culture with medium or supernatants from dNK or pNK overnight cultures.
(B) Intracellular CFU (left) and JEG-3 viability (right), normalized to medium control samples, after 3 h coincubation of Lm-infected JEG-3 with medium or dNK or pNK (effector:target (E:T) ratio 10:1).
(C) Representative dNK and pNK flow cytometry dot plots (left) and percent of NK with externalized CD107a (right) after 4 h incubation with 721.221 (221) or uninfected or Lm-infected JEG-3.
(D) Intracellular CFU in Lm-infected JEG-3 (left) or 721.221 viability (right), after incubation with dNK or pNK that were pretreated with anti-GNLY or control IgG, BFA, EGTA, or DCI. Antibodies and EGTA were also present during the co-culture.
(E) Intracellular CFU in Lm-infected JEG-3 in the bottom chamber after co-culture for 12 h with dNK or pNK in the same chamber or separated by a Transwell membrane. CFU was normalized to Ctrl samples without NK.
Shown are median with interquartile range. *p<0.05, ** p<0.01, ***p<0.001; by non-parametric unpaired one-way ANOVA (Kruskall-Wallis test) (A, B left, D, E) followed by Dunn’s post-tests comparing each NK type with medium (A, B left), or treatment within pNK or dNK with untreated control (D, E) and Kolmogorov-Smirnov test (B right, C). See also Figure S1F.
To understand how bacteria are suppressed without killing the host cell, dNK and pNK were pre-incubated overnight with anti-GNLY (clone DH10) or isotype control antibody and then co-cultured with Lm-infected JEG-3 in the continued presence of antibody. Incubation with GNLY blocking antibody, which was internalized by both dNK and JEG-3 during overnight co-culture (Figure S1F), blocked bacterial killing by dNK or pNK (Figure 2D, left). Pre-incubation of dNK and pNK with brefeldin A (BFA), which blocks transport of secreted proteins from the ER to the Golgi and loading of cytotoxic granules, and its continued presence in the culture medium during coculture, also completely prevented bacterial killing. However, EGTA, which blocks degranulation and PFN pore formation, or 3,4-dichloroisocoumarin (DCI), a pan-Gzm inhibitor, did not reduce killing of Lm within JEG-3 (Figure 2D, left). Thus, killing of intracellular Lm depends on GNLY, but occurs independently of degranulation, PFN and Gzms. By contrast, and as expected, dNK and pNK killing of 721.221 was blocked by BFA, EGTA and DCI, but not by anti-GNLY (Figure 2D, right), consistent with cytotoxic granule-mediated killing of 721.221. To determine whether direct cell contact was required to kill intracellular Lm, dNK and pNK were cocultured with Lm-infected JEG-3 while separated or not by a Transwell membrane. Bacteria were not killed when dNK or pNK were separated from Lm-infected JEG-3 (Figure 2E). To determine if cell contact might only be necessary to activate dNK secretion of GNLY, which could then be taken up by cells in the bottom chamber, we exposed dNK to infected JEG-3 in the top insert and measured killing of intracellular Lm within JEG-3 in the bottom of the Transwell (Figure 2E, last lane). Bacteria were not killed in the separated infected JEG-3. Therefore, dNK and pNK killing of intracellular Lm requires cell contact.
dNK kill Lm within 1° EVT without killing the EVT
To verify that the results obtained with JEG-3 hold for 1° EVT, isolated 1° EVT were infected with Lm before co-culture with dNK or pNK. Both pNK and dNK significantly reduced intracellular Lm CFU in 1° EVT but did not kill the EVT (Figure 3A). To investigate whether dNK suppress Lm infection in primary tissue, 3D placental villous explants that maintain the structure and tissue distribution of placental cells, prepared as described (Rizzuto et al., 2016; Robbins et al., 2010), were infected with Lm for 72 h. Infection mostly occurred in HLA-G+ CDH-1+ cells with large nuclei located at the tips of the villi, which identified them as EVT (Figure 3B–D), confirming previous reports that EVT are the main Lm-infected placental cells (Cao and Mysorekar, 2014; Robbins et al., 2010). Cytotrophoblasts (CT, cells with small nuclei located under EVT or syncytium and identified by CDH-1 expression) made up ~20% of the remaining infected cells. Lm was rarely seen in stromal cells or syncytiotrophoblasts (ST, identified as SDC-1+ cells with small nuclei in a continuous layer surrounding the villi), consistent with a previous report that ST are resistant to infection (Robbins et al., 2010). About 80% of EVT were infected, while only ~20% of CT and a few percent of ST were infected. CT infection may have been partly a culture artifact because some of the syncytial layer, which forms a barrier to infection, was eroded in the tissue slices (Robbins et al., 2010). When dNK were added to Lm-infected villous explants for 72 h, overall bacterial burden assessed by CFU was reduced 2-fold (Figure 3E). The number of infected trophoblasts of each subtype counted in stained tissue slices revealed a similar decline in infected EVT and CT in the presence of dNK (Figure 3D). Thus, dNK kill intracellular Lm and significantly reduce bacterial load in primary cells and tissues. However, dNK do not kill 1° EVT even when they are infected.
Figure 3. dNK kill Lm in 1° trophoblasts in vitro and in 3D villous cultures in situ.

(A) Intracellular CFU in HLA-G+ EVT (left) and EVT survival (right) after co-culture with dNK, pNK or medium for 3 h.
(B) Representative immunofluorescence images of three consecutive 5 μm cryosections of a placental villous tree infected with Lm and stained for DAPI, Lm, SDC-1 (ST marker, left), HLA-G (EVT marker, middle) and E-cadherin (CDH-1, CT and EVT marker, right), acquired with an Axio Observer spinning disk confocal microscope. Cell types were identified by staining, nuclear size and localization. Scale bar, 50 μm.
(C) Distribution of Lm-infected cells amongst trophoblast cell types 72 h after infection of villous explants.
(D) Percentage of infected EVT, CT and ST in villi cultured with or without autologous dNK or medium for 72 h. Percentages in (C,D) were calculated in 10 imaging fields (217x magnification) from a representative donor.
(E) Lm CFU in villous cultures incubated for 72 h with dNK or medium. For each donor sample CFU were normalized to the tissue size estimated by DNA quantification and CFU in dNK samples were normalized to samples without added NK.
Shown are median ± interquartile range (A) or mean ± s.e.m. (C-E). *p<0.05, ** p<0.01, ***p<0.001; by unpaired non-parametric one-way ANOVA (Kruskall-Wallis test followed by Dunn’s post-test (A left, comparing cells co-cultured with and without NK), Wilcoxon rank test (A right), one-way ANOVA followed by Tukey’s post-test comparing each cell type with each other (C) and paired t-test (D-E).
dNK deliver GNLY, but not GzmB, into trophoblasts
The cell contact and GNLY dependence of bacterial killing suggest that NK directly transfer GNLY to JEG-3. To investigate this possibility, JEG-3 were incubated for 5–45 min with no NK or a 10-fold excess of dNK or pNK and stained for intracellular GNLY (Figure 4A, S2A) and GzmB (Figure 4B). Within 10 min of dNK co-culture, JEG-3 stained strongly for intracellular GNLY, but not for GzmB. After 3 h dNK:JEG-3 co-culture, JEG-3 became almost as bright as donor dNK (GNLY MFI of JEG-3, 2850±1130 vs dNK, 3430±912, Figure S2B). During dNK co-culture for 3 h with autologous 1° trophoblasts, GNLY was detected in both HLA-G− VT and HLA-G+ EVT (Figure 4C). (In these experiments cells were trypsinized before staining to guarantee that detected GNLY was intracellular.) By contrast, GNLY and GzmB were not detected in JEG-3 after co-culture with pNK, even after 3 h (Figure S2B). However, cytokine-activated pNK, which express significantly more GNLY than freshly isolated pNK (Figure 1G, 4D), transferred detectable amounts of GNLY to JEG-3 after 1 h of coculture (Figure 4E). dNK transfer of GNLY to uninfected and Lm-infected JEG-3 was comparable (Figure S2C), suggesting that GNLY transfer is constitutive. Thus, dNK efficiently and selectively transfer GNLY, but not GzmB, to JEG-3 and 1° EVT, while pNK transfer to JEG-3 becomes detectable only if pNK GNLY is increased.
Figure 4. dNK transfer GNLY, but not GzmB, into JEG-3 and 1° trophoblasts.

(A) Representative flow cytometry histograms (top) and GNLY MFI (bottom) in NK or JEG-3 cultured without or with dNK or pNK for the indicated times.
(B) Representative flow cytometry histograms (left) of GzmB in NK or JEG-3 cultured without or with dNK or pNK for the indicated times. Graph (right) shows GzmB MFI in JEG-3 after coculture for 45 min.
(C) Representative flow cytometry histograms of dNK and isolated human 1° trophoblasts (mixture of HLA-G+ EVT and HLA-G− ST and CT) cultured with or without dNK for 3 h (left). GNLY MFI in trophoblasts after 3 h culture with dNK or pNK (right).
(D) Representative flow cytometry histogram (left) and GNLY MFI (right) in freshly isolated pNK and after 6 d of cytokine activation.
(E) Representative flow cytometry histogram (left) and GNLY MFI (right) in activated pNK and JEG-3 cultured without or with activated pNK.
(F) Flow cytometry histograms of intracellular GNLY in dNK or indicated target cells cultured for 3 h with or without dNK. (Data are representative of 3 dNK samples.)
(G, H) Host cell viability (G) and mean change in intracellular Lm CFU (H) when Lm-infected cells were incubated for 3 h with dNK or pNK from 3–5 donors or medium.
In all experiments, E:T ratio, 10:1. Graphs show median ± interquartile range (A-C) or mean ± s.e.m. (D, E, G, H). *p<0.05, ** p<0.01, ***p<0.001; by paired non-parametric one-way ANOVA (Friedman’s test followed by Dunn’s post-test comparing each time point with time 0 (A), unpaired non-parametric one-way ANOVA (Kruskal-Wallis followed by Dunn’s post-test of each NK type compared to no NK (B), each target with NK compared to sample without NK (G, H), Wilcoxon rank sum test (C) and paired t-test (D, E). See also Figures S2 and S3.
NK transfer small dyes to JEG-3
To determine whether transfer was specific for GNLY, JEG-3 were co-cultured with a 10-fold excess of dNK or pNK stained with CFSE (cytosolic dye) or DiO (membrane dye) and dye transfer was evaluated by flow cytometry. Both dNK and pNK transferred CFSE and DiO to JEG-3 as early as 15 min (Figure S2D, E). The amount of dye in JEG-3 increased with time and correlated with the amount of dye in the NK (activated pNK>dNK>fresh pNK). However, when JEG-3 were loaded with CFSE or DiO, no dye was transferred from JEG-3 to NK (Figure S2F, G). Thus, transfer was unidirectional from NK to JEG-3 in the 3 h time period studied. However, transfer of cell surface HLA-G from EVT to dNK by trogocytosis has been observed with longer incubations (Tilburgs et al., 2015a).
dNK transfer GNLY and kill intracellular Lm in macrophages and dendritic cells
To assess whether dNK transfer GNLY to other cell types, dNK were co-cultured for 3 h with uninfected human 1° blood monocyte-derived macrophages (pMɸ), decidual macrophages (dMɸ), THP-1 cells differentiated into dendritic cells (DC), foreskin fibroblasts (HFF), HeLa and U-251 glioblastoma and stained for intracellular GNLY (Figure 4F). dNK efficiently transferred GNLY to all these cells, but transfer was greatest to HFF. dNK or pNK did not kill these cells when they were infected with Lm (Figure 4G). However, dNK and pNK reduced bacterial colonies in JEG-3, pMɸ, dMɸ and DC, but surprisingly not in HFF, HeLa or U-251, even though all these cells internalized GNLY during dNK co-culture (Figure 4H). Bacterial killing did not correlate with the efficiency of GNLY transfer. To begin to understand why transferred GNLY kills bacteria only in some cells, GNLY localization with bacteria was compared by confocal microscopy within cells in which bacteria were killed (JEG-3, pMɸ) or were not killed (HeLa, HFF) (Figure S3). GNLY co-localized significantly more with fluorescently labeled Lm in the cells in which bacteria were killed, suggesting that differences in GNLY or bacterial trafficking may determine whether bacteria are killed. Further work is needed to understand why GNLY localization and bacterial killing differ amongst infected target cells.
NK form nanotubes to trophoblasts that transfer GNLY
In previous studies, GNLY transfer and cytotoxic lymphocyte-mediated killing of infected target cells occurred at the immune synapse after granule exocytosis and depended on PFN (Dotiwala et al., 2016; Walch et al., 2014). However, NK killing of Lm within JEG-3 and EVT is unusual since it is contact-dependent, but independent of PFN, Gzms or degranulation (Figure 2, 3). To probe the mechanism of transfer, contacts between dNK and pNK with Lm-infected or uninfected JEG-3 or 721.221 were visualized using confocal microscopy 45–60 min after co-culture. Slides were fixed and stained for GNLY, PFN, LFA-1 (expressed by NK, but not JEG-3 or 721.221), and actin (Figure S4A–E). LFA-1 and actin rearrange at the immune synapse. Both dNK and pNK formed LFA-1-capped immune synapses with 721.221 (Figure S4C, D). In most of these conjugates, cytotoxic granules localized to the point of contact (Figure S4E). However, significantly fewer dNK than pNK immune synapses had polarized granules, consistent with previous reports (Kopcow et al., 2005; Tilburgs et al., 2015a). dNK and pNK did not form classical immune synapses or polarize granules to uninfected or infected JEG-3 (Figure S4A, B, D, E). Remarkably, cytoplasmic extensions, which stained for both actin and LFA-1, connected both types of NK to JEG-3, more frequently from dNK than pNK (Figure S4A, B). These structures resemble nanotubes (also called cytoplasmic bridges, tunneling nanotubes or cytonemes) previously described connecting NK and T cells with target cells (Chauveau et al., 2010; Davis and Sowinski, 2008; Önfelt et al., 2004; Sowinski et al., 2008). The proportion of contacting dNK that formed visible nanotubes with JEG-3 was similar whether or not the cells were infected (data not shown). No nanotubes were seen between dNK or pNK and 721.221.
To better visualize dNK and JEG-3/EVT connections, super-resolution confocal microscopy with structured illumination (SIM) was used to image slides stained for LFA-1, GNLY, actin and DAPI (Figure 5A, B). With higher resolution, GNLY was observed within nanotubes connecting dNK to both JEG-3 and EVT. GNLY was also visible in the trophoblast cytoplasm (Figure 5A middle row, 5B bottom row). Because the structured illumination algorithm preferentially enhances high intensity signals, to simultaneously visualize GNLY in nanotubes and the more diffuse GNLY signal in target cells, we also acquired images with a Zeiss Airyscan 880 microscope (Figure S4G). When dNK were incubated with JEG-3 or 1° EVT, GNLY was simultaneously detected being transferred to target cells in nanotubes and in the target cell. Control JEG-3 or EVT, cultured without dNK, did not stain for GNLY (Figure S4F; see also Figure 4, S2 and S3). To determine the origin of the nanotubes, cocultured CellTracker-labeled JEG-3 and DiO-labeled dNK were stained with CD49f, expressed only by JEG-3, and CD56, expressed only by dNK (Figure 6A). All nanotubes stained along their length for DiO and only a minority stained with CellTracker or CD49f, suggesting that nanotubes mostly originated from dNK. In some JEG-3, transferred DiO was detected, but no transferred CellTracker was detected in dNK, consistent with unidirectional transfer seen by flow cytometry (Figure S2D–G). When this experiment was repeated with 1° EVT, dNK formed nanotubes with 1° EVT that stained along their length with DiO (Figure 6B). Videomicroscopy of co-cultured DiO-labeled dNK and JEG-3 confirmed dNK nanotube formation in real time (Movies S1 and S2). While some nanotube connections were fleeting, some were more sustained. Thus, dNK form GNLY-staining nanotube connections, suggesting GNLY transfer from NK to trophoblasts via nanotubes.
Figure 5. NK form nanotubes to JEG-3 and EVT that contain GNLY.

(A, B) Representative single channel SIM images showing GNLY (RB1 - green) in the cytoplasmic connections (actin, magenta) between dNK and JEG-3 (A) or 1° EVT (B). Images were fixed after 60 min co-culture and acquired with a Zeiss ELYRA microscope. LFA-1 (red) is only expressed in dNK. JEG-3 and EVT cell membranes outlined in white. Arrows indicate GNLY in the target cell. Scale bars, 5 μm. See also Figure S4.
Figure 6. Nanotubes originate from dNK and transfer GNLY in an actin-dependent manner.

(A) Representative single channel SIM images of DiO-labeled dNK co-cultured with CellTracker® Deep Red-labeled JEG-3 and stained for CD56 (dNK marker) and CD49f (JEG-3 integrin). The top panel show membrane projections originating from both cells, while the bottom shows projections only from dNK. Scale bars, 10 μm. JEG-3 membrane is delineated. Shown at right is mean ± s.e.m percentage of membrane projections staining with DiO (dNK) or CD49f (JEG-3) from analysis of 25 contacts in each of 2 donors.
(B) Representative single channel SIM images of CellTracker-labeled 1° EVT co-cultured with DiO-labeled dNK stained for CD56 and B7-H3 (EVT marker, magenta). Scale bar, 5 μm. EVT membrane is outlined.
(C) Representative single channel SIM images of dNK co-cultured for 1 h with JEG-3, stained for CD56 (dNK), CD49f (JEG-3), actin and tubulin. In the bottom panel both tubulin and actin stain the nanotubes, while in the top, only actin. JEG-3 membrane is delineated. Scale bars, 5 μm. Shown at right is mean ± s.e.m. percentage of nanotubes staining for actin or tubulin from analysis of 20–45 contacts in each of 3 donors. All co-cultures lasted 1 h. Images were acquired with the Zeiss ELYRA microscope.
(D) Representative flow cytometry histograms (left) and (median ± interquartile range) fold change in GNLY MFI in JEG-3 after culture for 15 min with NK (E:T ratio, 3:1) from 3–5 donors in the presence or absence of cytochalasin D (cytoD) or Dynasore.
(E) Effect of inhibitors on the percentage of dNK:JEG-3 interactions with visible nanotube connections (left) and the percentage of NK in contact with JEG-3 (right) after 15 min co-culture. Shown is fold change compared to no inhibitors (mean ± s.e.m). For each condition, at least 24 dNK:JEG-3 contacts per donor in 3–5 donors were analyzed.
(F) Effect of inhibitors on NK suppression of intracellular Lm CFU in JEG-3 after 3 h co-culture. Shown are mean ± s.e.m of percentages relative to culture without NK in 3 donors. *p<0.05, **p˂0.01, ***p<0.001, by χ2 test (A, C, E), paired non-parametric one-way ANOVA (Friedman’s test) followed by Dunn’s post-test comparing each treatment with no inhibitor (D) and unpaired non-parametric one-way ANOVA (Kruskal-Wallis test) followed by Dunn’s post-test, comparing each treatment with no inhibitor (F). See also Figure S5.
GNLY transfer and bacterial killing depend on actin
Nanotubes lack known specific markers (other than actin) and cannot be inhibited except nonspecifically by inhibiting the actin cytoskeleton. All NK-JEG-3 connections stained for F-actin and about a third also stained for tubulin, consistent with our identification of them as nanotubes (Figure 6C). To verify the role of nanotubes in GNLY transfer, the effect of inhibitors of actin polymerization (cytochalasin D), endocytosis (Dynasore) and microtubules (nocodazole) on GNLY transfer from dNK to JEG-3 was assessed (Figure 6D–F and S5A–C). Cells were mixed and centrifuged at 4° C to bring them into close contact before adding inhibitors (except for Dynasore, which was pre-added only to JEG-3). Both the number of cell contacts with connecting nanotubes and GNLY transfer were significantly reduced by cytochalasin D after 15 min of contact, but Dynasore had no effect, suggesting that the actin cytoskeleton, but not endocytosis, was required for both nanotube formation and GNLY transfer (Figure 6D, E left). Importantly, neither inhibitor reduced cell contacts (Figure 6E, right). Because cytochalasin was toxic for JEG-3 in longer incubations, the incubation time could not be extended. Pre-incubation of NK with cytochalasin D, but not pre-incubation of JEG-3 with Dynasore, completely rescued viable bacteria inside JEG-3 co-cultured for 3 h with either dNK or pNK (Figure 6F), further supporting the role of actin in GNLY transfer and bacterial killing. Nocodazole significantly reduced GNLY transfer in the first 15 min of contact, but not after 3 h, and also had no effect on the frequency of contacts, nanotube formation between dNK and JEG-3, or Lm viability within NK-cocultured JEG-3 (Figure S5A–C). Thus, the actin cytoskeleton, but not microtubules or endocytosis, mediates GNLY transfer and suppression of intracellular infection, providing additional support for GNLY transfer via actin-dependent nanotubes. Moreover, since inhibiting endocytosis had no effect on bacterial killing or GNLY transfer, uptake of secreted GNLY does not contribute significantly to intracellular bacterial killing.
Neuraminidase treatment of JEG-3 inhibits nanotubes, GNLY transfer and bacterial killing
Because inhibiting the cytoskeleton affects cell movement and many functions, identifying cell surface receptor-ligand pairs used to make nanotube connections could help to understand how nanotubes are formed. To identify such receptors, JEG-3 or dNK were incubated with blocking antibodies to cell surface receptors (integrins (CD49f (ITGα6), CD104 (ITGβ4), CD11a (LFA-1), CD58 (LFA-3)), integrin ligand CD2, CD324 (E-cadherin), NK receptors (NKG2A, KIR2DL, LILRB1), HLA (HLA-A/B/C and G), CD43, CD45, and Siglec-7) (Koopman et al., 2003; Tilburgs et al., 2015b) before and during co-culture. None of the antibodies tested individually inhibited GNLY transfer (data not shown). Since some immune receptors use sialic acid for binding (Crocker et al., 2007), pre-incubation with neuraminidase was also assessed. Neuraminidase treatment of JEG-3, but not dNK, significantly reduced GNLY transfer (Figure S5D) and the frequency of nanotube connections (Figure S5E, left) without affecting dNK:JEG-3 contacts (Figure S5E, right). Neuraminidase treatment of Lm-infected JEG-3 just before adding NK increased bacterial CFU 3–4-fold (Figure S5F, G). Thus, NK recognition of sialylated JEG-3 ligands promotes nanotube formation, GNLY transfer and control of intracellular Lm.
GNLY-Tg mice are resistant to Lm-induced spontaneous abortion
Since mice do not express GNLY, GNLY-Tg mice can be used to evaluate the in vivo role of GNLY during Lm infection in pregnancy. GNLY-Tg mice express GNLY selectively in killer lymphocytes at comparable levels to humans (Huang et al., 2007). As in humans, uterine NK (uNK) were abundant in the mouse pregnant uterus (Manaster and Mandelboim, 2010) and a high proportion of GNLY-Tg uNK and splenic (s)NK, isolated on gestation day (g.d.) 10, stained for GNLY (Figure 7A). uNK, but not sNK, from GNLY-Tg mice secreted GNLY into culture supernatants at similar levels as human dNK (Figure 7B,1B). As expected, uNK and sNK from GNLY-Tg and WT mice comparably killed the NK target YAC-1 (Figure 7C). Although uNK did not kill the mouse trophoblast cell line SM9–1 (Rasmussen et al., 1999), uNK and sNK from GNLY-Tg, but not from WT, mice, significantly reduced intracellular Lm CFU in infected SM9–1, confirming that Lm killing by mouse NK requires GNLY (Figure 7D). To determine if PFN contributes to antibacterial activity against Lm, uNK were isolated from Prf1−/− WT and GNLY-Tg BALB/c mice. As expected, uNK from Prf1−/− WT and GNLY-Tg mice did not kill either YAC-1 or Lm-infected SM9–1 (Figure S6A, B). However, Prf1−/−GNLY-Tg uNK reduced Lm colonies in SM9–1 as well as PFN-sufficient GNLY-Tg uNK (Figure S6C). Thus, mouse uNK and sNK, like human dNK and pNK, control intracellular bacteria in vitro in a GNLY-dependent, but PFN-independent, manner, without killing the host trophoblast.
Figure 7. GNLY-Tg mouse NK kill intracellular bacteria without killing a mouse trophoblast cell line and protect GNLY-Tg dams from abortion after Lm infection.

(A) Flow cytometry dot plots showing the percentage of murine splenic NK (sNK) and uterine NK (uNK) within CD45+ cells (left) and the percentage of NK staining for GNLY (clone RB1) (right). (Data are representative of 3 mice analyzed on g.d. 10.)
(B) Secreted GNLY in WT and GNLY-Tg mice (n=3) sNK and uNK 12 h culture supernatants.
(C, D) Viability of YAC-1 (C) or Lm-infected SM9–1 (left) and intracellular Lm CFU in SM9–1 (right) (D) after 3 h co-culture with sNK or uNK from WT or GNLY-Tg animals (n=3).
(E, F) Bacterial CFU on g.d. 9 (E) and dams with live pups (left) and mean number of pups/litter in mice that had viable pups (right) (F) in WT (n=10) and GNLY-Tg (n=11) mice that were infected with Lm on g.d. 6.
(G) Pregnancy outcome in WT and GNLY-Tg mice depleted of lymphocyte subsets using control antibody (Ctrl) or NK, CD4 or CD8 depleting antibodies (starting at g.d. 3) and then infected with Lm on g.d. 6. Depletion was verified on g.d. 6 (Figure S6D).
χ2 test compared pregnancy outcome in WT and GNLY-Tg mice (F) or in depleted mice with mice treated with the control (Ctrl) antibody (G). Shown are mean ± s.e.m (B-D, F). Red lines in (E) represent median values. ns, not significant, *p<0.05, ** p<0.01, ***p<0.001; by unpaired one-way ANOVA (B) or unpaired non-parametric one-way ANOVA (Kruskal-Wallis test (C, D)) followed by post-tests comparing each NK type in each mice group with every other group (B) and area under the curves (C, D); and Mann-Whitney/Kolmogorov-Smirnov test (comparing WT with GNLY-Tg for each tissue (E)). See also Figure S6.
To investigate whether GNLY enhances immune protection early in pregnancy, sublethal Lm infection on g.d. 6 was compared in pregnant WT and GNLY-Tg BALB/c mice. All pregnant WT mice had high bacterial counts in the spleen and liver 3 d after infection (~104 CFU/g) (Figure 7E). In contrast, bacteria were not detected in the spleen and liver of about a third of GNLY-Tg mice. In mice that had detectable bacteria, CFU were more than 10X lower than in WT mice. Similarly, bacterial loads were significantly lower in the placenta and fetuses of GNLY-Tg than WT mice (Figure 7E). Most importantly, 6 of 10 GNLY-Tg dams carried their pregnancies to term and had normal numbers of healthy-appearing pups, while 10 of 11 WT dams had failed pregnancies (p=0.013, Figure 7F). Thus, the GNLY transgene strongly improves pregnancy outcome after Lm infection.
To assess which lymphocytes contribute to Lm resistance, bacterial loads and pregnancy outcome in WT and GNLY-Tg mice, depleted or not of NK, CD4 or CD8 T cells (Figure S6D), were compared after Lm challenge on g.d. 6. In WT and GNLY-Tg mice, depletion of NK, but not CD4+ or CD8+ cells, significantly increased bacterial loads 3 d later in all tissues analyzed (Figure S6E). As expected, GNLY-Tg mice treated with a control antibody were protected from Lm-induced abortion, since 6 of 11 GNLY-Tg, while only 1 of 7 WT mice gave birth to normal litters (Figure 7G). Depletion of NK or CD8+ cells, but not CD4+ cells, led to Lm-induced resorption in all GNLY-Tg mice, indicating that both NK and CD8 T cells contribute to protecting the fetus (Figure 7G). Thus, GNLY in killer lymphocytes significantly reduces bacterial loads in pregnant GNLY-Tg mice and protects mice from Lm-induced resorption.
Discussion
Here we show that dNK transfer GNLY to fetal cells, killing intracellular Lm without killing the host cell. This is an unexpected way to protect the placenta from intracellular infection. GNLY transfer occurs independently of cytotoxic granules by nanotubes, which connect the cytosols of two cells through an undefined mechanism. Once in the host cell, GNLY traffics to and kills bacteria, presumably by disrupting their cell membranes. GNLY transfer strongly inhibits Lm in 1° human EVT, human 3D villous explants and mouse and human trophoblast cell lines. Pregnant GNLY-Tg mice better handle Lm infection than GNLY-deficient WT mice and gave birth to normal litters. However, dNK only partially control infection, presumably because GNLY on its own is less effective than protection by cytotoxic granules. Cytotoxic granules deploy PFN and Gzms to kill the host cell, removing a favorable niche for Lm replication. The combination of Gzms and GNLY more potently kills bacteria because together they not only damage the cell membrane, but also disrupt essential bacterial electron transport, protein synthesis and central metabolism pathways (Dotiwala et al., 2016, 2017; Walch et al., 2014). Nonetheless, GNLY-mediated protection without PFN significantly reduced bacterial loads in all in vitro and in vivo experiments performed. Importantly, GNLY provides an immune defense mechanism that avoids rejection of placental trophoblasts and is thus compatible with maintenance of maternal-fetal immune tolerance. Because GNLY broadly disrupts microbial membranes (Chun et al., 2007; Dotiwala et al., 2016; Stenger et al., 1998; Walch et al., 2014), it may also protect placental and fetal tissues against other bacterial, fungal and parasite pathogens.
Most experiments were performed using a choriocarcinoma cell line (JEG-3) as a model for EVT, as 1° human trophoblast yields are limiting. Although JEG-3 may not be a perfect surrogate (Tilburgs et al., 2015b), it is the only cell line that mimics EVT MHC expression (Apps et al., 2009), which is critical for NK interactions. Importantly, our key results (killing of intracellular bacteria without killing the host cell, GNLY transfer via nanotubes) were verified using human 1° EVT and 3D villous explant cultures. In placental explants, EVT were the main cell type infected with Lm, but dNK suppressed Lm replication in both EVT and CT. Human samples varied in the extent of dNK suppression of Lm, suggesting that genetic or environmental variations affect this immune response.
This study focused on Lm infection in early pregnancy, when dNK are the main decidual immune cell, comprising about a third of all maternal decidual cells and two thirds of decidual immune cells. dNK are replaced by decidual CD8+ T cells as pregnancy advances (Paffaro et al., 2003). While depletion of NK, but not CD8+ cells, increased bacterial loads in spleen, liver, placenta and fetus after 3 d of infection (before antigen-specific CD8+ T cells have expanded), depletion of either NK or CD8 T+ cells led to Lm-induced abortion in GNLY-Tg animals. Thus, both NK and CD8+ T cells contribute to fetal protection. CD8+ T cell protection in pregnancy may be due to both Lm-specific CD8+ T cell control of systemic bacterial infection plus antimicrobial function in the decidua nearer to term. In line with this, neither Prf1−/− WT nor Prf1−/− GNLY-Tg mice gave birth to viable pups when challenged with sublethal Lm (data not shown). Bacterial loads in Prf1−/− GNLY-Tg mice, however, were significantly reduced compared to Prf1−/− mice lacking the transgene both systemically and in the fetus (data not shown). The difference in pregnancy outcome between PFN deficient and sufficient mice suggests that both granule (and PFN) dependent and independent mechanisms contribute to Lm protection in pregnancy. Both GNLY and PFN are likely important in CD8+ T cell control of systemic infection by killing infected host cells and suppressing bacteria within them, as previously demonstrated in nonpregnant mice (Walch et al., 2014). PFN-dependent protection by degranulation of peripheral (and possibly decidual) CD8 T cells later in pregnancy likely explains why no Prf1−/− mice had successful pregnancies, even if they expressed GNLY. At present there are no ways to assess the importance of GNLY or PFN in decidual vs peripheral killer cells by conditionally expressing or knocking out genes only in decidual lymphocytes.
GNLY transfer from dNK to JEG-3 and EVT was actin-dependent via nanotubes, which also transferred CFSE and DiO, but not GzmB, unidirectionally from dNK to target cells. GNLY transfer occurred rapidly within minutes of co-culture and was incredibly efficient since co-cultured trophoblasts stained almost as brightly for GNLY as dNK. Nanotube formation and GNLY transfer was constitutive and did not change with target cell infection. The presence of GNLY in uninfected cells could prevent bacterial replication as soon as cells became infected. In other systems, nanotube transport of small cytosolic molecules depends on the actin cytoskeleton, while transport of organelles depends on microtubules (Kimura et al., 2012). Here, the nanotube connections between NK and JEG-3 stained for actin, but infrequently for tubulin. GNLY transfer and Lm killing were inhibited by blocking actin polymerization but not by inhibiting endocytosis or microtubules. Nocodazole inhibited GNLY transfer in the first 15 min, but after 3 h of NK:JEG-3 coincubation in the presence of nocodazole, enough GNLY was transferred to kill intracellular bacteria. This initial difference may indicate that microtubules are involved in initiating nanotubes or in GNLY trafficking to the nanotube. Indeed, the SIM images (Figure 5) suggest that GNLY accumulates near the origin of the nanotube. Nanotube formation likely requires receptor-ligand interactions between the connecting cells, but blocking cell surface receptors that mediate dNK-EVT interactions did not interfere with nanotube connections or GNLY transfer. Neuraminidase treatment of the target inhibited GNLY transfer, suggesting that binding of dNK receptor(s) to sialylated protein(s) on the target cell promotes nanotube formation. The lack of inhibition by single blocking antibodies could be due to redundancy of receptors that mediate nanotube formation. Further work is needed to understand how nanotube connections are formed.
In addition to direct transfer to target cells, dNK secrete GNLY into culture supernatants (Figure 1B, C), which kills extracellular Lm, but not Lm in trophoblasts (Figure 2A). These results suggest that dNK secretion of GNLY might help control cell-free bacteria before they invade trophoblasts and also control infection by bacteria whose lifestyle is primarily extracellular. However, even a 1:1 dilution of dNK culture supernatants (not shown) or pNK culture supernatants was inactive against extracellular Lm. Intracellular L. innocua were previously shown to be killed within DC by micromolar concentrations of recombinant GNLY in culture media (Walch et al., 2005). Based on the level of secreted GNLY in culture media (<10 nM), secreted GNLY may not reach in vivo concentrations needed to kill extracellular bacteria. Although the concentration of secreted GNLY in uterine, decidual and placental fluids is unknown and will be difficult to measure, GNLY-Tg mice could be used to study the role of secreted GNLY in controlling infection with extracellular pathogens, such as GBS.
Decidual and peripheral NK selectively killed an intracellular microbe without destroying the host cell. The key to selective bacterial killing is the selective transfer of GNLY, but not cytotoxic granules or other cytotoxic granule components, which would kill the host cell. Although we showed that small dyes were also transferred from dNK to trophoblasts, we did not examine whether additional endogenous proteins were also transferred or whether nanotube connections altered the properties or functions of the connected cell. Although crosstalk between dNK and EVT to facilitate placentation has been assumed to be mediated by uptake of dNK-secreted growth factors and cytokines, direct transfer of cytosolic proteins and other molecules, including nutrients, by nanotubes could contribute to dNK regulation of placentation.
dNK are not the only killer cells to transfer GNLY to selectively kill intracellular bacteria and trophoblasts are not the only target cell in which Lm could be suppressed without killing the host cell. pNK also transfer GNLY, form nanotube connections and selectively kill bacteria within trophoblasts, macrophages and dendritic cells. Although nanotube connections by pNK and T cells have previously been observed (Chauveau et al., 2010; Davis and Sowinski, 2008; Önfelt et al., 2004; Sowinski et al., 2008), their function was not clear. dNK express much more GNLY than pNK, while GNLY transfer from pNK was only detected if GNLY levels were increased by cytokine activation. Nonetheless, even though GNLY transfer by freshly isolated pNK was below the level of detection, pNK had comparable anti-bacterial potency as dNK in multiple experiments (Figure 2B–E,3A, 4H, 6F, S5C, G). These results suggest that dNK have a surfeit of GNLY, much more than is needed to kill intracellular bacteria. pNK killing, despite low levels of GNLY, recalls the potent cytolytic activity of PFN, which can kill target cells even when it is below the detection limit of flow cytometry (Nagler-Anderson et al., 1989). It is worth investigating whether GNLY-expressing adaptive and innate-like cytotoxic T cells, also use nanotubes to transfer GNLY selectively for anti-microbial defense. This immune defense may be important in immune privileged sites, where killer lymphocyte-mediated degranulation is suppressed, or against infected target cells that are resistant to conventional granule-mediated cytotoxicity. Although GNLY was efficiently transferred by dNK and pNK to other cell types, bacteria were only killed in EVT, macrophages and dendritic cells, but not in HeLa, HFF, or a glioblastoma cell line. What distinguishes the cells in which bacteria are killed is not clear, except that GNLY localized more with bacteria in those cells. All the cells in which bacteria were killed (including EVT) are highly phagocytic, which might affect the trafficking of bacteria or GNLY.
This study demonstrates an unexpected role of dNK in providing immunity to placental infection. The constraints of maternal-fetal tolerance, which interferes with unleashing the full power of cytotoxic granules to fight infection, lead to more serious infection during pregnancy. Although GNLY transfer via nanotubes may not be as powerful as degranulation for controlling intracellular microbes, our in vivo comparison of Lm infection in WT and GNLY-Tg mice indicates a profound GNLY-dependent improvement in pregnancy outcome after Lm infection. Further understanding of the molecular mechanisms responsible for GNLY transfer and intracellular bacteria killing may provide insights into how mother-to-fetus transmission of infection could be better treated.
STAR METHODS
RESOURCE AVAILABILITY
Lead Contact
Further information and requests for resources and reagents should be directed and will be fulfilled by the Lead Contact, Judy Lieberman (judy.lieberman@childrens.harvard.edu)
Materials Availability
This study did not generate new unique reagents.
Data and Code Availability
This study did not generate datasets or code.
EXPERIMENTAL MODEL AND SUBJECT DETAILS
Human subjects
Human placental and decidual material were obtained from women undergoing elective pregnancy termination at a local clinic. All tissues were visually inspected for signs of excessive inflammation (including discoloration, large infarctions and foul odor) and only healthy tissues were used for further processing. Peripheral blood leukocytes were isolated from healthy volunteer blood donor leukopacks or collars. All human samples were de-identified, discarded clinical material and their use was approved by the Boston Children’s Hospital and Harvard University human studies review boards. Placental and decidual sample gestational age ranged from 6 – 12 weeks. Human decidual samples were female, while the placental (fetal) sample sex and blood donor sex and age could not be determined due to constraints of the IRB protocol. The sample size for each experiment is given in the figure legend or shown in dot plots.
Cell lines
JEG-3 (male), 721.221 (female), YAC-1 (mouse lymphoma), YT-Indy (male) and SM9–1 (mouse trophoblast) were cultured in RPMI with 10% FCS supplemented with 1% Pen/Strep and 1% L-glutamine. HFF (male), U-251 (male) and HeLa (female) were cultured in DMEM with 10% FCS supplemented with 1% Pen/Strep and 1% L-glutamine. THP-1-derived DCs were obtained by culturing THP-1 in RPMI with 10% FCS, 1% Pen/Strep and 1% L-glutamine supplemented with 1500 IU/ml IL-4 and 1500 IU/ml GM-CSF changing the medium every 2 d. After 5 d, the medium was changed to serum-free RPMI supplemented with 3000 IU/ml IL-4, 1500 IU/ml GM-CSF, 2000 IU/ml TNF-α and 200 ng/ml ionomycin. Cells were cultured for 2 more d, and adherent cells were used (Berges et al., 2005). All cell lines were cultured at 37°C. Cell lines were recent passages and were periodically tested for mycoplasma contamination; flow cytometry was used to confirm surface markers. Whenever target cells were plated for bacterial infection, cells were washed three times in antibiotic-free medium immediately before infection or seeded for overnight culture in antibiotic-free media.
Mouse strains
GNLY-Tg C57BL/6, rederived at Jackson Laboratory as previously described (Huang et al., 2007; Walch et al., 2014), were backcrossed for more than 20 generations into the BALB/c background. These mice were crossed with Prf1−/− BALB/c mice (which were also generated by backcrossing Prf1−/− C57BL/6 (Jackson Laboratory) into the BALB/c background). All transgenic animals were bred and maintained in specific-pathogen free (SPF) conditions within the animal facility of Boston Children’s Hospital until infection with Listeria monocytogenes. Virgin female mice (7–9 weeks old) were mated with male mice and the appearance of a vaginal plug was used to mark g.d. 0.5. Pregnant animals were infected on g.d. 6. All pregnant animals were included in the final analysis. Animal use was approved by the Animal Care and Use Committees of Boston Children’s Hospital and Harvard Medical School.
Bacteria
L. monocytogenes (Lm) 10403S strain (Walch et al., 2014) was used. Lm were grown in 3.7% BHI with 50μg/ml streptomycin at 37°C.
METHODS DETAILS
Experimental design
At least two biological replicates (donors) were performed for each experiment (human or mouse), except for immunoprecipitation of GNLY from dNK supernatants/lysates (Figure 1C), confocal microscopy imaging of isolated NK cells (Figure 1D, S1C), determination of GNLY and perforin/granzyme colocalization by imaging flow cytometry (Figure S1D, E), placental explant infection quantification by imaging (Figure 3B–D), co-localization of GNLY with Lm in different cell targets (Figure S3) and LFA-1/granule polarization or nanotube quantification in NK:JEG-3 contacts under control conditions or after neuraminidase treatment (Figure S4B–E, S5E). None of the experiments were blinded. No statistical methods were used to predetermine sample size. Tissue from donors with a clinical history or symptoms of probable future miscarriage or infection, or tissue that was clearly inflamed or discolored were not used. No data were excluded from any of the experiments.
Isolation of NK cells, macrophages and trophoblasts
The procedure to isolate EVT, dNK and pNK was previously described (Tilburgs et al., 2015a). Briefly, decidual and villous tissues were macroscopically identified and separated. Primary cells were isolated from villous tissue by gently removing the basal membrane and digesting for 8 min at 37°C with 75 ml of 0.2% trypsin 0.02% EDTA. DMEM/F-12 medium (25 ml) containing 10% Newborn Calf Serum (NCS) and 1% Pen/Strep was added and the digested tissue was filtered over a gauze mesh. The filtrate was washed and layered on Ficoll for density gradient centrifugation (20 min, 800g). Cells were collected from the interface, washed and incubated for 20 min at 37°C in a tissue culture dish to remove adherent macrophages. EVT were obtained after sorting for live large CD45− cells or CD45−B7-H3+ cells. Sorted cells were plated in 96 or 48 well plates with or without 10 mm coverslips (1.5 mm thick, TedPella Inc) coated with 20 μg/ml fibronectin in EVT medium (see Cell Culture) and non-adherent cells were removed 3–18 h later. Adherent cells were 50–95% HLA-G+ EVT (Crespo et al., 2016; Tilburgs et al., 2015b).
To isolate immune cells, decidual tissue was washed with PBS, minced and digested with 0.25% collagenase type IV and 0.025% DNase I with gentle shaking in a water bath for 75 min at 37°C. Released lymphocytes were washed with RPMI 10% FBS filtered through 100, 70 and 40 μm sieves (BD, Labware; NJ), and the filtrate was resuspended in 20 ml 1.023 g/ml Percoll and layered on a Percoll gradient (10 ml 1.080 g/ml topped with 15 ml 1.053 g/ml) for density gradient centrifugation (25 min/800 g). Lymphocytes were isolated from the 1.080 g/ml/1.053 g/ml interface, washed with RPMI and stained for flow cytometry analysis or sorting of dNK and decidual macrophages using the gating strategy described in (Tilburgs et al., 2015b). pNK were isolated using a RosetteSep™ human NK enrichment cocktail followed by Ficoll density gradient centrifugation (20 min, 800g). Monocyte-derived macrophages were obtained by isolating peripheral blood mononuclear cells by Ficoll density gradient centrifugation (20 min, 800g) and culturing overnight in RPMI + 10% FCS without antibiotics. Non-adherent cells were removed, and adherent cells were used as macrophages.
Mouse uNK were isolated as previously described (Zhang et al., 2005). Briefly, the mesometrial lymphoid aggregate of pregnancy and decidua were minced and incubated with collagenase IV for 60 min. Single cell suspensions were subjected to Percoll gradient centrifugation. The uterine leukocyte band at the 40%−80% Percoll interface was collected. Mouse splenocytes were obtained after mechanical dissociation of spleens and passage through a 70 μm sieve. NK were isolated from uterine leukocytes or splenocytes using an NK cell magnetic purification kit.
Placental villous 3D cultures
Villous trees (2–3 mm length) from 6–9 weeks gestation human pregnancies were dissected and cultured in Transwell inserts (0.4 μm pore, Costar) coated with Matrigel (Rizzuto et al., 2016). Villi were allowed to invade the Matrigel for 12–15 h with collection medium (DMEM/F12 with 2.5% FBS, 1% Pen/Strep, 50 μg/ml gentamicin and 1.25 μg/ml amphotericin) only in the bottom well. For infection, villi were washed with antibiotic-free villous medium (DMEM/F12 with 20% FCS) and cultured in the same medium for 1 h before infection. Cultures were harvested for CFU assay and imaging after 3 d of culture with or without added autologous dNK.
Primary human and mouse cell culture
Human pNK and dNK were cultured in X-VIVO 10™ media without antibiotics supplemented with 5% human AB serum and 2.5 ng/ml recombinant human IL-15 for 12–18 h prior to experiments. Human dMϕ and pMϕ were cultured in RPMI with 10% FCS without antibiotics. Human HLA-G+ EVT were cultured in DMEM/F12 medium supplemented with 10% NCS, 1x Pen/Strep, 1x insulin, transferrin, selenium (ITS), 5 ng/ml EGF, and 400 units human gonadotropic hormone as described (Tilburgs et al., 2015a). Murine sNK and uNK isolated from pregnant WT or GNLY-Tg mice were cultured in RPMI with 10% FCS without antibiotics supplemented with 2.5 ng/ml recombinant mouse IL-15.
Flow Cytometry
For surface staining, cells were stained for 30 min on ice in the dark in PBS 1% FCS after 5 min incubation with Fc-Block. Cells were analyzed immediately or fixed in 1% paraformaldehyde (PFA) for 10 minutes for next day analysis. For intracellular staining, cells were fixed and permeabilized using the BD CytoFix/CytoPerm kit. Analysis was performed on a FACSCalibur, LSR II or FACSCanto II (BD) using FlowJo Version 10 and sorting was done using a BD Aria II.
Cytolytic proteins in culture supernatants
dNK, pNK, uNK and sNK (2×10⁶ cells/ml) were cultured for 12 h in antibiotic-free X-vivo 10™ with 2.5 ng/ml IL-15. Culture supernatants were collected and snap frozen at −80°C until analysis. GNLY concentration was measured by ELISA. GzmA, GzmB and PFN concentration were measured by Milliplex MAX in a Luminex instrument.
GNLY immunoprecipitation and immunoblot
dNK and pNK supernatants from 12 h cultures (4×10⁶ cells/ml in IL-15-containing medium as described above) and NK lysates were incubated for 1 h with Protein G Dynabeads pre-loaded with 10 μg of anti-GNLY. The precipitates were eluted in NuPage 4x Loading Buffer 0.7% β-ME. JEG-3 were lysed using RIPA buffer with complete protease inhibitor. Lysates from JEG-3, purified GNLY isolated from YT-Indy cells (Thiery et al., 2010) and the IP from NK lysates and supernatants were analyzed by immunoblot probed with goat anti-human GNLY antibody (1:1000) and mouse anti-human β-actin antibody (1:1000).
Imaging Flow Cytometry
Freshly sorted dNK and pNK, or pNK stimulated with 5 ng/ml IL-15 and 50 IU/ml IL-2 for 6 d were fixed and permeabilized using the BD CytoFix/CytoPerm kit, and stained first with anti-GNLY (clone RB1), anti-PFN and anti-GzmB for 20 min, and then with Hoechst 33342 for 10 min. Mitochondria were stained by incubation with 500 nM Mitotracker Deep Red in serum-free medium for 30 min at 37°C, and cells were washed in complete medium, and then fixed and permeabilized using the BD CytoFix/CytoPerm Kit for GNLY staining. Images were acquired using an AMNIS Imagestream X Mark II (Luminex). Approximately 10,000 events were acquired for each cell type from 5–6 donors and analyzed using IDEAS Software. Focused cells were identified by the highest Gradient RMS value in the brightfield channel. Single cells were then identified by gating on cells with intermediate Area and high Aspect Ratio in the brightfield channel. To quantify granule vs cytoplasmic fluorescence, cells staining for Hoechst, GNLY and PFN were analyzed using a spot mask (with a spot to cell background ratio of 5 and a radius of 1) to identify GNLY granules, and an intensity mask to identify the whole cell in the GNLY channel. The spot mask was subtracted from the intensity mask to generate a cytoplasm mask. The fluorescence intensity of the granules and cytoplasm was calculated using the Median Intensity Feature (with subtracted background) in each mask. To assess the co-localization of GNLY with PFN or mitochondria, 400 focused cells co-staining for GNLY and PFN were analyzed using the Bright Detail Similarity Feature, which identifies the brightest elements in the fluorescent channel and calculates a log of the Pearson correlation in each cell. Values of 2–3 are considered correlated.
Bacterial and host cell killing assays
NK were harvested after overnight culture in antibiotic-free X-vivo 10™ with 2.5 ng/ml IL-15. Target cells, except for 1° EVT, seeded overnight in 96 well plates (10,000 cells HLA-G+ enriched cells/well), were infected with Lm MOI 5 for 30 min. Primary trophoblasts were infected with Lm MOI 20. Infected cells were washed 3 times and then treated with gentamicin (50 μg/ml) for 30 min to kill extracellular bacteria, washed 3 times and then cultured with 105 dNK or pNK in duplicate for 3 h in RPMI 10% FCS, or with 100 μl dNK or pNK overnight culture supernatant (from 2×10⁶ cells/ml) for 3 h. Cell-free Lm (104 bacteria/100 μl) were also cultured with the same culture supernatants or medium for 3 h. For in vitro experiments with mouse cells, SM9–1 were seeded, infected with Lm at MOI 5 and co-cultured with NK isolated from pregnant mice at indicated E:T ratios. Villous cultures were infected with 1.5 × 10⁸ CFU of Lm for 5 h and then washed 3 times with PBS, before adding 1 ml of villous medium containing 50 μg/ml gentamicin and 2.5 ng/ml IL-15, with or without 106 autologous dNK. One d later, the medium was replaced (without disturbing dNK) with fresh medium containing IL-15 without gentamicin. Cultures were maintained for 2 additional d with daily medium changes. At harvest, villi were washed with PBS and mechanically dissociated, digested with trypsin (as described for isolating primary trophoblasts) and filtered through 100 μm sieves to obtain a single cell suspension. DNA was extracted from 1/3 of the cells using the DNeasy Blood & Tissue Kit and quantified by measuring absorbance at 260 nm by Nanodrop. The remaining cells were used for colony forming unit (CFU) assay. Intracellular bacterial viability was measured by CFU after hypotonic lysis. Colonies were counted after plating 10-fold serial dilutions on BHI agar plates. Host cell viability, except for primary trophoblasts, was assessed by 51Cr release assay. Primary trophoblasts were trypsinized and stained for HLA-G and CD49f and Zombie Yellow to detect dead cells. The percentage of dead HLA-G+ infected trophoblasts cultured without NK was subtracted from the percentage of dead trophoblasts in dNK co-cultures to determine the percentage of specifically killed cells.
Degranulation assay
dNK or pNK, cultured overnight as above, were co-cultured with 721.221 in a 1:3 E:T ratio or with uninfected or Lm-infected confluent JEG-3 in antibiotic free RPMI 10% FCS in the presence of CD107a antibody (250 ng/ml) for 4 h before fixing for 10 min in 1% PFA and staining for surface markers.
Transwell experiments
JEG-3 (10,000 cells/well), seeded overnight in the indicated wells of a 96-well Transwell plate (Corning), were infected with Lm (MOI 5) for 30 min and then treated with gentamicin to eliminate extracellular bacteria. dNK or pNK (105 cells/well) were then added to the indicated wells; 12 h later, infected JEG-3 in the bottom wells were lysed to count CFU.
GNLY/CFSE/DiO transfer experiments
Target cells (50,000 cells/well in 24-well plates) were infected or not with Lm (MOI 5, JEG-3; MOI 20, EVT), and co-cultured with NK at indicated E:T ratios and times before washing away NK and trypsinizing targets. For antibody uptake experiments, dNK were cultured overnight without or with 10 μg/ml GNLY blocking antibody (clone DH10 conjugated with CF647 using Mix-n-Stain kit) or IgG1 AF647™. DH10-CF647 was also added to JEG-3 and NK cultured separately for 1 hr. For nanotube transfer analysis, DiO or CFSE-labeled NK or JEG-3 (labeled according to the manufacturer’s instructions) were co-cultured at a NK:JEG-3 ratio of 10:1 or 1:3 for the indicated times (15–60 min for CFSE, 3 h for DiO). Targets and NK were permeabilized and stained for intracellular GNLY (clone RB1) and GzmB, or not permeabilized for analysis of DH10-CF647 or DiO/CFSE uptake. To identify target cells and separate them from NK, JEG-3 and EVT were first surface-stained for HLA-G, CD45 and CD56. Other target cells were stained for CD45 and CD56 (and also CD14 for dMϕ and pMϕ). Target cells were gated based on size and cell surface staining.
Inhibitor experiments
To inhibit intracellular bacterial killing, NK were cultured overnight (2×10⁶ cells/ml in IL-15-containing medium as above) in the presence of 10 μg/ml GNLY blocking antibody (DH10) or isotype control, 3 μM brefeldin A or 2 mM EGTA. In some cases, NK or JEG-3 were pre-treated with 2 μM cytochalasin D, 10 μM Dynasore or 200 nM DCI for 30 min. In other experiments, indicated cells were treated with 100 U/ml of α2–3,6,8,9 neuraminidase for 1 h in serum-free RPMI, before adding FCS to stop the reaction. Nocodazole (20 μM) was added at the beginning of NK-target cell co-culture. For all inhibitors (except cytochalasin D, Dynasore, neuraminidase, and DCI, which were toxic for long incubations and were washed before the next step), NK were co-cultured with JEG-3 in the presence of the inhibitors or antibody. For cytochalasin and nocodazole treatments in GNLY transfer and microscopy analysis, NK and JEG-3 were centrifuged at 2000 rpm, 2 min at 4°C, before adding cytochalasin D (2 μM) or nocodazole (20 μM) in HBSS and cells were co-cultured for 15 min or 3 h at 37°C before staining for flow cytometry or microscopy imaging. For antibody blocking of GNLY transfer (detected by flow cytometry), dNK of JEG-3 were pre-incubated with 10 μg/ml blocking antibody for 30 min, and antibodies were still present during dNK:JEG-3 co-culture.
Confocal microscopy, Airyscan and structured illumination super-resolution microscopy
NK were adhered for 1 h onto 1.5 mm coverslips (Tedpella, Inc.) coated with 0.01% poly-L-lysine, fixed with 4% PFA for 10 min and then permeabilized with PBS/0.1% Triton-X for 10 min before staining with conjugated antibodies (anti-PFN, anti-GNLY or respective isotypes). Cells were washed and stained with Hoechst 33342 for 10 min. For imaging NK-target cell interactions, target cells (infected or not with DDAO-Far Red-labeled Lm MOI 50–200) were co-cultured on 1.5 mm glass coverslips (previously coated with 20 μg/ml fibronectin) with dNK or pNK (E:T ratio 10:1) for 45–60 min. When indicated, JEG-3 or primary EVT were pre-labeled with 1:10,000 CellTracker Deep Red) and dNK were pre-labeled with 1:1000 Vybrant DiO for 30 min in serum-free RPMI and then washed 3 times before co-culture. Coverslips were fixed with 4% PFA in PBS, blocked with PBS containing 10% BSA for 30 min, and stained with surface antibodies to LFA-1, CD56, CD14, CD49f and B7-H3 when indicated for 1 h. After washing, secondary antibodies were added when necessary for 1 h. For GNLY, PFN and tubulin staining, cells were permeabilized with 0.1% Triton-X and blocked again with 10% BSA for 30 min, before staining overnight at 4°C or for 2–3 h at RT with the primary antibodies, followed by secondary antibodies when necessary. For actin staining, Rhodamine Phalloidin was added to permeabilized cells for 1 h. DAPI was added for 10 min to permeabilized cells. Cells were mounted in Vinol mounting medium.
Villous organ cultures were fixed in 4% paraformaldehyde for 30 min and dehydrated by immersion in 10% sucrose in PBS for 1 h, followed by 20% sucrose for 1 h and 30% sucrose overnight before embedding in OCT medium for flash freezing. Sections (5 μm) were cut using a cryostat (Microm HM 550, ThermoFisher Scientific) and adhered to positively charged glass slides (Denville). OCT was removed by immersion in 1x PBS and tissue was blocked for 30 min in buffer (1% BSA, 22.5 mg/mL glycine, 0.1% Tween 20 in PBS), and then stained overnight at 4°C with primary antibodies to detect CDH-1 (1:25), HLA-G (20 μg/ml), SDC-1 (1:25) and Lm (80 μg/ml) in 1% BSA, 0.1% Tween 20 in PBS. After 3 washes in PBS, slides were stained with secondary antibodies (donkey anti-rabbit AlexaFluor 488™ and donkey anti-mouse AlexaFluor 647™ 1:1000) for 1 h at RT. Samples were counterstained with DAPI and mounted and imaged by fluorescence microscopy. To quantify the distribution of Lm-infected cell types or percentage of each cell type that were infected, EVT were identified as HLA-G+CDH1+ cells in the tips of villi with large nuclei, CT were CDH-1+ cells with smaller nuclei located under ST or EVT and ST were SDC-1+ cells with very small nuclei forming a uniform layer on the outside of the villi. Cells were counted in 10 imaging fields (217x magnification).
Imaging of NK (Figures 1D, S1C) and dNK interacting with Lm-infected JEG-3/HFF/HeLa/pMɸ (Figure S3A–D) was performed using a Zeiss LSM 700 point scanning confocal (Carl Zeiss) with a 63x (1.4NA) oil immersion objective. Lasers were excited at 405, 488, 640 nm with emission filter ranges of 430/90, 500/30, and 650 long-pass, respectively. Images were processed using Zen Blue Lite 2.0. For imaging nanotube connections, some slides (Figure S4A) were imaged in an Olympus FV1000 4-channel Confocal Imaging system coupled to an Olympus IX 81 inverted microscope using a 60x (1.2 NA) water immersion objective. Lasers were 405 nm, 488 nm, 559 nm and 635 nm with emission filters of 425–475 nm, 500–545 nm, 575–620 nm and 655–755 nm, respectively. Images were processed using FV10-ASW software version 03.00.01.15. Nanotube images were obtained using an ELYRA super-resolution microscope (Carl Zeiss) (Figures 5, 6) with laser lines SIM/PALM/STORM of 405, 488, 561, and 642 nm and a 63x (1.4 NA) oil immersion objective. Super-resolution images were processed using structured illumination to enhance image detail using Zen Blue 2.0. Figures S4F and G were obtained with a ZEISS 880 FAST AIRYSCAN laser scanning confocal with laser lines of 405, 488, 561 and 633nm (emission filters of 450, 516, 595 and 654, respectively) and a 63× 1.4NA oil immersion objective. Images were processed using Airyscan processing to enhance image detail with Zen Blue 2.0.
To quantify contacts and nanotube connections (Figures 6A,C,E (bar plots), S4B–E, S5B, E) and image villous cryosections (Figure 3D), slides were imaged using an inverted, fully motorized Axio Observer spinning disk confocal microscope (Carl Zeiss Microimaging, Inc., Thornwood, NY) equipped with a cooled electron multiplication charge-coupled device (CCD) camera with 512 × 512 resolution (QuantEM, Photometics, Tucson, AZ) and a CSU-X1 spinning disc (Yokogawa Electric, Tokyo, Japan) with lasers that were excited at 405, 488, 561 and 640 nm (Coherent, Santa Clara, CA) and emission filter ranges of 452/45, 525/50, 607/36 and 680 long-pass, respectively (Semrock, Rochester, NY). Images were processed using SlideBook V5.0.
Videomicroscopy of dNK-JEG-3 interactions
JEG-3 were cultured in Delta T dishes (Bioptechs) coated with fibronectin (20 μg/ml), which were adapted to an Olympus FV1000 4-channel Confocal Imaging system. dNK were pre-labeled with Vybrant DiO at 1:1000 for 30 min in serum-free RPMI and then washed 3 times. After temperature calibration (37°C), the JEG-3 Delta dish was placed in the stage, and dNK were added at T=0. Cells were imaged with the 60x objective with transmitted light and 488 nm laser with emission filter of 500–545 nm, and images were taken every minute for up to 20 minutes. Images were processed using FV10-ASW software version 03.00.01.15.
Mouse in vivo experiments
On g.d. 6, mice were intraperitoneally infected with exponential phase Lm (103) in 0.2 ml PBS. Liver, spleen, placenta and fetus were harvested 3 d post-infection, weighed and homogenized in water with 0.2% Triton X-100 for plating on BHI agar plates to assess CFU. Other groups of infected pregnant mice were monitored to term and viable pups were counted. In some experiments, WT or GNLY-Tg BALB/c mice were injected intraperitoneally daily for 3 d beginning 3 d before infection (g.d. 3) and weekly thereafter with antibodies to deplete CD4 T cells (0.5 mg/mouse), CD8 T cells (0.5 mg/mouse) or NK cells (0.2 mg/mouse). Control mice received rat IgG2b. Cell depletion was verified by flow cytometry on g.d. 6: blood was collected from the orbital plex before sacrifice. Spleens were mechanically dissociated and passed through a 70 μm sieve. Livers and uteri were minced and digested with 2mg/ml collagenase D (plus 0.1 mg/ml DNase I) for 45 min. or 0.25mg/ml collagenase IV (plus 0.025 mg/ml DNase I) for 75 min., respectively, before passing through a 100 μm sieve. Blood and tissues were subjected to red blood cell lysis before staining for flow cytometry.
QUANTIFICATION AND STATISTICAL ANALYSES
Values presented are the mean ± s.e.m or median ± interquartile range, as indicated. Statistical analysis was performed using Prism 6.0c (GraphPad). For normal distributions, paired or unpaired ANOVA followed by Tukey post-tests (for multiple comparisons) or paired/unpaired t-tests were used. For non-normal distributions, unpaired or paired non-parametric one-way analysis of variance (Kruskal-Wallis test or Friedman’s test followed by Dunn’s post-test) were used in experiments for which multiple comparisons were made. To compare 2 groups in experiments with human samples/animals, Mann-Whitney or Kolmogorov-Smirnov tests were used for unpaired groups with equal or unequal variances, respectively. Equality of variances was tested by Levene’s test. For paired comparisons of 2 groups, Wilcoxon rank sum test was used. χ2 test was used to analyze the data where indicated. Non-parametric tests were used in most experiments with human or animal samples because these data were not normally distributed. The statistical method applied to each panel is specified in the legends. p<0.05 was considered significant. None of the experiments were blinded.
Supplementary Material
Supplemental Figure S1. Related to Figures 1 and 2.
dNK highly express GNLY, PFN and Gzms.
(A) Mean fluorescence intensity (MFI) of GzmA, GzmB and PFN staining of human dNK and pNK by flow cytometry.
(B) GzmA, GzmB and PFN in 12 h culture supernatants of human dNK and pNK measured by Luminex.
(C) Lack of background staining for GNLY and PFN in Fig. 1D using isotype control antibodies Representative images of dNK and pNK stained with the isotype controls for GNLY RB1 AF488 and PFN dG9 AF647, respectively. Images were acquired with a Zeiss LSM 700 microscope. Scale bars, 5 μm.
(D) Representative raw images from imaging flow cytometry of dNK (left) and pNK (right) stained for total GNLY (RB1) and PFN and GzmB (top) or MitoTracker (bottom). dNK “GNLY granules” images were edited to remove cytoplasmic brightness to enhance the granules. Scale bars, 7 μm.
(E) Log of Pearson correlation of GNLY/PFN granule staining, and GNLY granule/Mitotracker staining. 400 cells from one dNK donor and one pNK donor were analyzed using the Bright Detail Similarity Feature from IDEAS software, comparing GNLY granules with PFN granules and GNLY granules with mitochondria.
(F) JEG-3 and dNK take up GNLY antibody from the medium when incubated at 37° C. Representative flow cytometry plots showing the uptake of AF647-labeled isotype control or GNLY blocking antibody (clone DH10) by JEG-3 (left) or dNK (right) after 1 h or overnight incubation (o.n.) at 37° C. The histograms are representative of 3 donors.
Bars represent median ± interquartile range (A, B) and mean ± s.e.m. (E). ** p<0.01, ***p<0.001 by Mann-Whitney rank test or Kolmogorov-Smirnov test (A,B) or paired t-test (E).
Supplemental Figure S2. GNLY transfer from dNK to JEG-3 is detected within 5 min of co-culture and is independent of infection. dNK transfer small dyes to JEG-3 unidirectionally. Related to Figure 4.
(A) Representative flow cytometry histograms (left) of NK and JEG-3 with or without co-culture with dNK for the indicated times. Shown in the graph (right) is GNLY MFI in JEG-3 after subtracting background staining without added dNK.
(B) Representative flow cytometry histograms (left) and change in GNLY MFI (right) in NK and JEG-3 after co-culture with dNK or pNK for 3 h.
(C) Representative flow cytometry histograms of intracellular GNLY staining in uninfected or Lm-infected JEG-3 that were cultured with or without dNK for 3 h.
(D) Representative flow cytometry histograms of CFSE fluorescence in NK or JEG-3 (top) after culture with or without CFSE-labeled dNK (left), freshly isolated pNK (middle) or pNK activated with cytokines for 6 days (right) for the indicated times. Graphs (bottom) shown median CFSE MFI transferred from each type of CSFE-labeled NK over 45 min.
(E) Representative flow cytometry histograms (top) and DiO MFI (bottom) in DiO-labeled NK and JEG-3 cultured for 3 h with or without labeled NK.
(F) Representative flow cytometry histogram (left) of JEG-3 and dNK that were cultured with or without CFSE-labeled JEG-3 for 1 h (NK:JEG-3 ratio 3:1) and median CFSE MFI in the cells from 2 co-cultures (right) ~
(G) Representative flow cytometry histograms (left) and DiO MFI in DiO-labeled JEG-3 and NK cultured for 3 h with or without labeled JEG-3.
Graphs show median ± interquartile range. p<0.05; ** p< 0.01 by paired non-parametric one-way ANOVA (Friedman’s test followed by Dunn’s post-test compared to time 0 (A, D)), unpaired non-parametric one-way ANOVA (Kruskal-Wallis test followed by Dunn’s post-test of each NK type compared to control (B, E)), and Wilcoxon rank sum test (F, G).
Supplemental Figure S3. GNLY transferred from dNK co-localizes with Listeria in JEG-3 and macrophages. Related to Figure 4.
(A-D) Representative confocal microscopy images showing colocalization of GNLY (green – clone RB1) with Lm (red) in JEG-3 (A), pMɸ (B), HeLa (C) and HFF (D) before (top) and after (bottom) 1 h co-culture with dNK. The rightmost images show 3D representations of the inserts. Images were obtained with a Zeiss LSM 700 microscope. Scale bars: left, 20 μm; right (insert): 1 μm.
(E) Percentage of Lm showing GNLY stain in indicated target cells, observed in 10 fields (each dot represents one field). Graph shows median ± interquartile range (E). *p<0.05 by unpaired non-parametric one-way ANOVA (Kruskall-Wallis test) followed by Dunn’s post-test, comparing each cell target with each other.
Supplemental Figure S4. NK contacts with target cells. Related to Figure 5.
(A) Representative confocal images of dNK and pNK contacts with Lm-infected JEG-3 stained for GNLY (clone RF10) (green), PFN (red), LFA-1 (blue) and actin (magenta). Scale bars: 5 μm. Images with uninfected JEG-3 were similar (not shown). Co-culture lasted 45 min. Images were obtained with an Olympus FV1000 microscope.
(B) Percentage of dNK and pNK in contact with Lm-infected JEG-3 displaying cytoplasmic connections. For each condition, at least 44 dNK and pNK contacts from one donor each were analyzed, and the percentage of these contacts where membrane projections were observed was calculated.
(C) Representative fluorescence microscopy images of dNK and pNK contacts with 721.221. dNK and pNK contacts with 721.221 without granule polarization to the immune synapse are shown on the left, while contacts with granule polarization are shown on the right. Images were acquired with the Axio Observer spinning disk confocal microscope. Scale bars, 5 μm. Co-culture lasted 45 min.
(D, E) Percentage of dNK and pNK contacts with indicated target cell that show LFA-1 capping (D) or granule polarization to the area of intercellular contact (E). χ2 test compared NK interactions with uninfected and infected JEG-3 and 721.221 from the same representative donor. 45 NK-target contacts were counted for each target.
(F) Representative single channel and merged images of JEG-3 cultured alone and stained for actin (magenta), GNLY (green) and LFA-1 (red). JEG-3 membrane is delineated. Scale bars: 20 μm.
(G) Representative single channel images (obtained using a ZEISS Airyscan 880) showing GNLY (RB1 - green) in the target cells and in the cytoplasmic connections (actin, magenta) and between dNK and JEG-3 or 1° EVT co-cultured for 60 min. LFA-1 (red) is only expressed in dNK. JEG-3 and EVT cell membranes are outlined in white. GNLY is visible within target cells. Scale bars, 5 μm. ***p˂0.001 by χ2 test (B, D, E).
Supplemental Figure S5. GNLY transfer, nanotube formation and Lm suppression by NK depend on sialylation of target cell ligands, but not on microtubules. Related to Figure 6.
(A) Representative flow cytometry histograms of intracellular GNLY staining (left) and GNLY MFI (right) in JEG-3 cultured with dNK (E:T ratio 3:1) for 15 min or 3 h, in the presence or absence of nocodazole. Shown at right are median ± interquartile range of 3 donors.
(B) Effect of nocodazole on the proportion of dNK:JEG-3 contacts with visible nanotube connections (left) and on the proportion of NK in contact with JEG-3 (right) after 15 min co-culture. Shown is fold change compared to no nocodazole (mean ± s.e.m). For each condition, at least 24 dNK:JEG-3 contacts using dNK from 2 donors were analyzed.
(C) Effect of nocodazole on NK suppression of intracellular Lm CFU in JEG-3 after 3 h. Shown are mean ± s.e.m fold change relative to co-culture with NK without nocodazole in 5 donors.
(D-G) Effect of neuraminidase (NA) pre-treatment of dNK or JEG-3 on GNLY transfer from dNK to JEG-3 (D), percentage of dNK:JEG-3 cell contacts with visible nanotube connections (left) and percentage of dNK in contact with JEG-3 (right) (E), and on change in bacterial CFU (mean ± s.e.m). after incubation with dNK (F) or pNK (G) in 2 donors each. (D) shows representative flow cytometry histograms (left) and median ± interquartile range of fold change in GNLY MFI (right) in JEG-3 co-cultured with dNK. In (E), at least 30 dNK:JEG-3 contacts in one donor were analyzed for each condition. *p<0.05, **p˂0.01, Wilcoxon rank sum test (A, C), χ2 test (B, E) and paired non-parametric one-way ANOVA (Friedman’s test followed by Dunn’s post-test), comparing each treatment with no inhibitor control (D, F, G).
Supplemental Figure S6. GNLY-Tg mouse NK kill intracellular Lm independently of PFN and are the first line of defense against Lm. Related to Figure 7.
(A-C) Viability of YAC-1 (A) and infected SM9–1 (B) and intracellular Lm CFU in SM9–1 (C) after co-culture for 3 h with uNK from pregnant WT, Prf1−/−, GNLY-Tg or Prf1−/−GNLY-Tg mice (3 mice/group). Shown are mean ± s.e.m.
(D) NK and T lymphocyte depletion in pregnant mice. Values show percentages of the different subsets after each antibody depletion. Blood and tissue were obtained on g.d. 6 (1 WT mouse per condition).
(E) Bacterial CFU on g.d. 9 in WT and GNLY-Tg mice that were depleted of lymphocyte subsets using control antibody (Ctrl) or NK, CD4 or CD8 depleting antibodies on g.d. 3 and then infected with Lm on g.d. 6 (n=3–8 mice/group) Red lines represent the median. * p<0.05, ** p<0.01; by unpaired non-parametric one-way ANOVA (Kruskal-Wallis test (A-C) followed by Dunn’s post test comparing each transgenic mice group with WT (A) and area under the curve (B,C)); and non-parametric unpaired one-way ANOVA (Kruskal-Wallis followed by Dunn’s post-test), comparing each group with respective control (E)).
Highlights.
Decidual NK kill Listeria in trophoblasts without killing fetal cells
Decidual NK selectively transfer granulysin to trophoblasts without degranulating
Granulysin transfer occurs through nanotube connections
A GNLY transgene protects Listeria-infected mice from spontaneous abortion
Acknowledgements
We thank Harry Leung (PCMM Microscopy Core) for help with live imaging, Strominger lab members for help processing placental tissues, and Ana Gadish-Linares for designing the graphical abstract. This work was supported by NIH HD87689 and AI45862 (JS and JL).
Footnotes
Declaration of Interests: The authors declare no competing interests.
Publisher's Disclaimer: This is a PDF file of an unedited manuscript that has been accepted for publication. As a service to our customers we are providing this early version of the manuscript. The manuscript will undergo copyediting, typesetting, and review of the resulting proof before it is published in its final form. Please note that during the production process errors may be discovered which could affect the content, and all legal disclaimers that apply to the journal pertain.
References
- Apps R, Murphy SP, Fernando R, and Ahad T (2009). Human leucocyte antigen (HLA) expression of primary trophoblast cells and placental cell lines, determined using single antigen beads to characterize allotype specificities of anti-HLA antibodies. Immunology 127, 26–39. [DOI] [PMC free article] [PubMed] [Google Scholar]
- Berges C, Naujokat C, Tinapp S, Wieczorek H, Ho A, Sadeghi M, Opelz G, and Daniel V (2005). A cell line model for the differentiation of human dendritic cells. Biochem. Biophys. Res. Commun 333, 896–907. [DOI] [PubMed] [Google Scholar]
- Błaszkowska J, and Góralska K (2014). Parasites and fungi as a threat for prenatal and postnatal human development. Ann. Parasitol 60, 225–234. [PubMed] [Google Scholar]
- Cao B, and Mysorekar IU (2014). Intracellular bacteria in placental basal plate localize to extravillous trophoblasts. Placenta 35, 139–142. [DOI] [PubMed] [Google Scholar]
- Chauveau A, Aucher A, Eissmann P, Vivier E, and Davis DM (2010). Membrane nanotubes facilitate long-distance interactions between natural killer cells and target cells. Proc. Natl. Acad. Sci. U. S. A 107, 5545–5550. [DOI] [PMC free article] [PubMed] [Google Scholar]
- Chun FZ, Ling LM, Jones GJ, Gill MJ, Krensky AM, Kubes P, and Mody CH (2007). Cytotoxic CD4+ T cells use granulysin to kill Cryptococcus neoformans, and activation of this pathway is defective in HIV patients. Blood 109, 2049–2057. [DOI] [PubMed] [Google Scholar]
- Crespo ÂC, Strominger JL, and Tilburgs T (2016). Expression of KIR2DS1 by decidual natural killer cells increases their ability to control placental HCMV infection. Proc. Natl. Acad. Sci 113, 15072–15077. [DOI] [PMC free article] [PubMed] [Google Scholar]
- Crespo ÂC, van der Zwan A, Ramalho-Santos J, Strominger JL, and Tilburgs T (2017). Cytotoxic potential of decidual NK cells and CD8+ T cells awakened by infections. J. Reprod. Immunol 119, 85–90. [DOI] [PMC free article] [PubMed] [Google Scholar]
- Crocker PR, Paulson JC, and Varki A (2007). Siglecs and their roles in the immune system. Nat. Rev. Immunol 7, 255–266. [DOI] [PubMed] [Google Scholar]
- Davis DM, and Sowinski S (2008). Membrane nanotubes: Dynamic long-distance connections between animal cells. Nat. Rev. Mol. Cell Biol 9, 431–436. [DOI] [PubMed] [Google Scholar]
- Dotiwala F, and Lieberman J (2019). Granulysin: killer lymphocyte safeguard against microbes. Curr. Opin. Immunol 60, 19–29. [DOI] [PMC free article] [PubMed] [Google Scholar]
- Dotiwala F, Mulik S, Polidoro RB, Ansara JA, Burleigh BA, Walch M, Gazzinelli RT, and Lieberman J (2016). Killer lymphocytes use granulysin, perforin and granzymes to kill intracellular parasites. Nat. Med 22, 210–216. [DOI] [PMC free article] [PubMed] [Google Scholar]
- Dotiwala F, Sen Santara S, Binker-Cosen AA, Li B, Chandrasekaran S, and Lieberman J (2017). Granzyme B Disrupts Central Metabolism and Protein Synthesis in Bacteria to Promote an Immune Article Granzyme B Disrupts Central Metabolism and Protein Synthesis in Bacteria to Promote an Immune Cell Death Program. Cell 171, 1125–1137. [DOI] [PMC free article] [PubMed] [Google Scholar]
- Erlebacher A (2013). Immunology of the maternal-fetal interface. Annu. Rev. Immunol 31, 387–411. [DOI] [PubMed] [Google Scholar]
- Hanna J, Goldman-Wohl D, Hamani Y, Avraham I, Greenfield C, Natanson-Yaron S, Prus D, Cohen-Daniel L, Arnon TI, Manaster I, et al. (2006). Decidual NK cells regulate key developmental processes at the human fetal-maternal interface. Nat. Med 12, 1065–1074. [DOI] [PubMed] [Google Scholar]
- Huang LP, Lyu S, Clayberger C, Krensky M, and Krensky AM (2007). Granulysin-Mediated Tumor Rejection in Transgenic Mice. J. Immunol 178, 77–84. [DOI] [PMC free article] [PubMed] [Google Scholar]
- Kimura S, Hase K, and Ohno H (2012). Tunneling nanotubes: Emerging view of their molecular components and formation mechanisms. Exp. Cell Res 318, 1699–1706. [DOI] [PubMed] [Google Scholar]
- King A, Wooding P, and Gardner L (1993). Expression of perforin, granzyme A and TIA-1 by human uterine CD56 + NK cells implies they are activated and capable of effector functions. Hum. Reprod 8, 2061–2067. [DOI] [PubMed] [Google Scholar]
- Koopman L, Kopcow H, Rybalov B, Boyson J, Orange J, Schatz F, Masch R, Lockwood C, Schachter A, Park P, et al. (2003). Human decidual natural killer cells are a unique NK cell subset with immunomodulatory potential. J. Exp. Med 198, 1201–1212. [DOI] [PMC free article] [PubMed] [Google Scholar]
- Kopcow HD, Allan DSJ, Chen X, Rybalov B, Andzelm MM, Ge B, and Strominger JL (2005). Human decidual NK cells form immature activating synapses and are not cytotoxic. Proc. Natl. Acad. Sci. U. S. A 102, 15563–15568. [DOI] [PMC free article] [PubMed] [Google Scholar]
- Manaster I, and Mandelboim O (2010). The unique properties of uterine NK cells. Am. J. Reprod. Immunol 63, 434–444. [DOI] [PubMed] [Google Scholar]
- Moffett-King A (2002). Natural killer cells and pregnancy. Nat. Rev. Immunol 2, 656–663. [DOI] [PubMed] [Google Scholar]
- Nagler-Anderson C, Lichtenheld M, Eisen HN, and Podack E (1989). Perforin mRNA in primary peritoneal exudate cytotoxic T lymphocytes. J. Immunol 143, 3440–3443. [PubMed] [Google Scholar]
- Önfelt B, Nedvetzki S, Yanagi K, and Davis DM (2004). Cutting Edge: Membrane Nanotubes Connect Immune Cells. J. Immunol 173, 1511–1513. [DOI] [PubMed] [Google Scholar]
- Paffaro VA, Bizinotto MC, Joazeiro PP, and Yamada AT (2003). Subset classification of mouse uterine natural killer cells by DBA lectin reactivity. Placenta 24, 479–488. [DOI] [PubMed] [Google Scholar]
- Rasmussen CA, Pace JL, Banerjee S, Phillips TA, and Hunt JS (1999). Trophoblastic Cell Lines Generated from Tumour Necrosis Factor Receptor-deficient Mice Reveal Specific Functions for the Two. Placenta 20, 213–222. [DOI] [PubMed] [Google Scholar]
- Rizzuto GA, Kapidzic M, Gormley M, and Bakardjiev AI (2016). Human Placental and Decidual Organ Cultures to Study Infections at the Maternal-fetal Interface. JoVE 113, e54237. [DOI] [PubMed] [Google Scholar]
- Robbins JR, Skrzypczynska KM, Zeldovich VB, Kapidzic M, and Bakardjiev AI (2010). Placental syncytiotrophoblast constitutes a major barrier to vertical transmission of Listeria monocytogenes. PLoS Pathog. 6, e1000732. doi: 10.1371/journal.ppat.1000732. [DOI] [PMC free article] [PubMed] [Google Scholar]
- Schneider CA, Rasband WS, and Eliceiri KW (2012). NIH Image to ImageJ: 25 years of image analysis. Nat. Methods 9, 671–675. [DOI] [PMC free article] [PubMed] [Google Scholar]
- Siewiera J, El Costa H, Tabiasco J, Berrebi A, Cartron G, Le Bouteiller P, Bouteiller P, and Jabrane-Ferrat N (2013). Human cytomegalovirus infection elicits new decidual natural killer cell effector functions. PLoS Pathog. 9, e1003257. doi: 10.1371/journal.ppat.1003257. [DOI] [PMC free article] [PubMed] [Google Scholar]
- Sowinski S, Jolly C, Berninghausen O, Purbhoo MA, Chauveau A, Köhler K, Oddos S, Eissmann P, Brodsky FM, Hopkins C, et al. (2008). Membrane nanotubes physically connect T cells over long distances presenting a novel route for HIV-1 transmission. Nat. Cell Biol 10, 211–219. [DOI] [PubMed] [Google Scholar]
- Stenger S, Hanson DA, Teitelbaum R, Dewan P, Niazi KR, Froelich CJ, Ganz T, Thoma-Uszynski S, Melián A, Bogdan C, et al. (1998). An antimicrobial activity of cytolytic T cells mediated by granulysin. Science 282, 121–125. [DOI] [PubMed] [Google Scholar]
- Thiery J, Walch M, Jensen DK, Martinvalet D, and Lieberman J (2010). Isolation of cytotoxic T cell and NK granules and purification of their effector proteins. In Current Protocols in Cell Biology, pp. 3.37.1–3.37.29. [DOI] [PubMed] [Google Scholar]
- Tilburgs T, Evans JH, Crespo ÂC, and Strominger JL (2015a). The HLA-G cycle provides for both NK tolerance and immunity at the maternal-fetal interface. Proc. Natl. Acad. Sci 112, 13312–13317. [DOI] [PMC free article] [PubMed] [Google Scholar]
- Tilburgs T, Crespo ÂC, van der Zwan A, Rybalov B, Raj T, Stranger B, Gardner L, Moffett A, and Strominger JL (2015b). Human HLA-G+ extravillous trophoblasts: Immune-activating cells that interact with decidual leukocytes. Proc. Natl. Acad. Sci. U. S. A 112, 7219–7224. [DOI] [PMC free article] [PubMed] [Google Scholar]
- Vujaklija DV, Gulic T, Sucic S, Nagata K, Ogawa K, Laskarin G, Saito S, Haller H, and Rukavina D (2011). First trimester pregnancy decidual natural killer cells contain and spontaneously release high quantities of granulysin. Am. J. Reprod. Immunol 66, 363–372. [DOI] [PubMed] [Google Scholar]
- Walch M, Eppler E, Dumrese C, Barman H, Groscurth P, and Ziegler U (2005). Uptake of Granulysin via Lipid Rafts Leads to Lysis of Intracellular Listeria innocua. J. Immunol 174, 4220–4227. [DOI] [PubMed] [Google Scholar]
- Walch M, Dotiwala F, Mulik S, Thiery J, Kirchhausen T, Clayberger C, Krensky AM, Martinvalet D, and Lieberman J (2014). Cytotoxic cells kill intracellular bacteria through granulysin-mediated delivery of granzymes. Cell 157, 1309–1323. [DOI] [PMC free article] [PubMed] [Google Scholar]
- Zeldovich VB, and Bakardjiev AI (2012). Host Defense and Tolerance: Unique Challenges in the Placenta. PLoS Pathog. 8, e1002804. doi: 10.1371/journal.ppat.1002804. [DOI] [PMC free article] [PubMed] [Google Scholar]
- Zhang J, Dong Z, Zhou R, Luo D, Wei H, and Tian Z (2005). Isolation of lymphocytes and their innate immune characterizations from liver, intestine, lung and uterus. Cell. Mol. Immunol 2, 271–280. [PubMed] [Google Scholar]
Associated Data
This section collects any data citations, data availability statements, or supplementary materials included in this article.
Supplementary Materials
Supplemental Figure S1. Related to Figures 1 and 2.
dNK highly express GNLY, PFN and Gzms.
(A) Mean fluorescence intensity (MFI) of GzmA, GzmB and PFN staining of human dNK and pNK by flow cytometry.
(B) GzmA, GzmB and PFN in 12 h culture supernatants of human dNK and pNK measured by Luminex.
(C) Lack of background staining for GNLY and PFN in Fig. 1D using isotype control antibodies Representative images of dNK and pNK stained with the isotype controls for GNLY RB1 AF488 and PFN dG9 AF647, respectively. Images were acquired with a Zeiss LSM 700 microscope. Scale bars, 5 μm.
(D) Representative raw images from imaging flow cytometry of dNK (left) and pNK (right) stained for total GNLY (RB1) and PFN and GzmB (top) or MitoTracker (bottom). dNK “GNLY granules” images were edited to remove cytoplasmic brightness to enhance the granules. Scale bars, 7 μm.
(E) Log of Pearson correlation of GNLY/PFN granule staining, and GNLY granule/Mitotracker staining. 400 cells from one dNK donor and one pNK donor were analyzed using the Bright Detail Similarity Feature from IDEAS software, comparing GNLY granules with PFN granules and GNLY granules with mitochondria.
(F) JEG-3 and dNK take up GNLY antibody from the medium when incubated at 37° C. Representative flow cytometry plots showing the uptake of AF647-labeled isotype control or GNLY blocking antibody (clone DH10) by JEG-3 (left) or dNK (right) after 1 h or overnight incubation (o.n.) at 37° C. The histograms are representative of 3 donors.
Bars represent median ± interquartile range (A, B) and mean ± s.e.m. (E). ** p<0.01, ***p<0.001 by Mann-Whitney rank test or Kolmogorov-Smirnov test (A,B) or paired t-test (E).
Supplemental Figure S2. GNLY transfer from dNK to JEG-3 is detected within 5 min of co-culture and is independent of infection. dNK transfer small dyes to JEG-3 unidirectionally. Related to Figure 4.
(A) Representative flow cytometry histograms (left) of NK and JEG-3 with or without co-culture with dNK for the indicated times. Shown in the graph (right) is GNLY MFI in JEG-3 after subtracting background staining without added dNK.
(B) Representative flow cytometry histograms (left) and change in GNLY MFI (right) in NK and JEG-3 after co-culture with dNK or pNK for 3 h.
(C) Representative flow cytometry histograms of intracellular GNLY staining in uninfected or Lm-infected JEG-3 that were cultured with or without dNK for 3 h.
(D) Representative flow cytometry histograms of CFSE fluorescence in NK or JEG-3 (top) after culture with or without CFSE-labeled dNK (left), freshly isolated pNK (middle) or pNK activated with cytokines for 6 days (right) for the indicated times. Graphs (bottom) shown median CFSE MFI transferred from each type of CSFE-labeled NK over 45 min.
(E) Representative flow cytometry histograms (top) and DiO MFI (bottom) in DiO-labeled NK and JEG-3 cultured for 3 h with or without labeled NK.
(F) Representative flow cytometry histogram (left) of JEG-3 and dNK that were cultured with or without CFSE-labeled JEG-3 for 1 h (NK:JEG-3 ratio 3:1) and median CFSE MFI in the cells from 2 co-cultures (right) ~
(G) Representative flow cytometry histograms (left) and DiO MFI in DiO-labeled JEG-3 and NK cultured for 3 h with or without labeled JEG-3.
Graphs show median ± interquartile range. p<0.05; ** p< 0.01 by paired non-parametric one-way ANOVA (Friedman’s test followed by Dunn’s post-test compared to time 0 (A, D)), unpaired non-parametric one-way ANOVA (Kruskal-Wallis test followed by Dunn’s post-test of each NK type compared to control (B, E)), and Wilcoxon rank sum test (F, G).
Supplemental Figure S3. GNLY transferred from dNK co-localizes with Listeria in JEG-3 and macrophages. Related to Figure 4.
(A-D) Representative confocal microscopy images showing colocalization of GNLY (green – clone RB1) with Lm (red) in JEG-3 (A), pMɸ (B), HeLa (C) and HFF (D) before (top) and after (bottom) 1 h co-culture with dNK. The rightmost images show 3D representations of the inserts. Images were obtained with a Zeiss LSM 700 microscope. Scale bars: left, 20 μm; right (insert): 1 μm.
(E) Percentage of Lm showing GNLY stain in indicated target cells, observed in 10 fields (each dot represents one field). Graph shows median ± interquartile range (E). *p<0.05 by unpaired non-parametric one-way ANOVA (Kruskall-Wallis test) followed by Dunn’s post-test, comparing each cell target with each other.
Supplemental Figure S4. NK contacts with target cells. Related to Figure 5.
(A) Representative confocal images of dNK and pNK contacts with Lm-infected JEG-3 stained for GNLY (clone RF10) (green), PFN (red), LFA-1 (blue) and actin (magenta). Scale bars: 5 μm. Images with uninfected JEG-3 were similar (not shown). Co-culture lasted 45 min. Images were obtained with an Olympus FV1000 microscope.
(B) Percentage of dNK and pNK in contact with Lm-infected JEG-3 displaying cytoplasmic connections. For each condition, at least 44 dNK and pNK contacts from one donor each were analyzed, and the percentage of these contacts where membrane projections were observed was calculated.
(C) Representative fluorescence microscopy images of dNK and pNK contacts with 721.221. dNK and pNK contacts with 721.221 without granule polarization to the immune synapse are shown on the left, while contacts with granule polarization are shown on the right. Images were acquired with the Axio Observer spinning disk confocal microscope. Scale bars, 5 μm. Co-culture lasted 45 min.
(D, E) Percentage of dNK and pNK contacts with indicated target cell that show LFA-1 capping (D) or granule polarization to the area of intercellular contact (E). χ2 test compared NK interactions with uninfected and infected JEG-3 and 721.221 from the same representative donor. 45 NK-target contacts were counted for each target.
(F) Representative single channel and merged images of JEG-3 cultured alone and stained for actin (magenta), GNLY (green) and LFA-1 (red). JEG-3 membrane is delineated. Scale bars: 20 μm.
(G) Representative single channel images (obtained using a ZEISS Airyscan 880) showing GNLY (RB1 - green) in the target cells and in the cytoplasmic connections (actin, magenta) and between dNK and JEG-3 or 1° EVT co-cultured for 60 min. LFA-1 (red) is only expressed in dNK. JEG-3 and EVT cell membranes are outlined in white. GNLY is visible within target cells. Scale bars, 5 μm. ***p˂0.001 by χ2 test (B, D, E).
Supplemental Figure S5. GNLY transfer, nanotube formation and Lm suppression by NK depend on sialylation of target cell ligands, but not on microtubules. Related to Figure 6.
(A) Representative flow cytometry histograms of intracellular GNLY staining (left) and GNLY MFI (right) in JEG-3 cultured with dNK (E:T ratio 3:1) for 15 min or 3 h, in the presence or absence of nocodazole. Shown at right are median ± interquartile range of 3 donors.
(B) Effect of nocodazole on the proportion of dNK:JEG-3 contacts with visible nanotube connections (left) and on the proportion of NK in contact with JEG-3 (right) after 15 min co-culture. Shown is fold change compared to no nocodazole (mean ± s.e.m). For each condition, at least 24 dNK:JEG-3 contacts using dNK from 2 donors were analyzed.
(C) Effect of nocodazole on NK suppression of intracellular Lm CFU in JEG-3 after 3 h. Shown are mean ± s.e.m fold change relative to co-culture with NK without nocodazole in 5 donors.
(D-G) Effect of neuraminidase (NA) pre-treatment of dNK or JEG-3 on GNLY transfer from dNK to JEG-3 (D), percentage of dNK:JEG-3 cell contacts with visible nanotube connections (left) and percentage of dNK in contact with JEG-3 (right) (E), and on change in bacterial CFU (mean ± s.e.m). after incubation with dNK (F) or pNK (G) in 2 donors each. (D) shows representative flow cytometry histograms (left) and median ± interquartile range of fold change in GNLY MFI (right) in JEG-3 co-cultured with dNK. In (E), at least 30 dNK:JEG-3 contacts in one donor were analyzed for each condition. *p<0.05, **p˂0.01, Wilcoxon rank sum test (A, C), χ2 test (B, E) and paired non-parametric one-way ANOVA (Friedman’s test followed by Dunn’s post-test), comparing each treatment with no inhibitor control (D, F, G).
Supplemental Figure S6. GNLY-Tg mouse NK kill intracellular Lm independently of PFN and are the first line of defense against Lm. Related to Figure 7.
(A-C) Viability of YAC-1 (A) and infected SM9–1 (B) and intracellular Lm CFU in SM9–1 (C) after co-culture for 3 h with uNK from pregnant WT, Prf1−/−, GNLY-Tg or Prf1−/−GNLY-Tg mice (3 mice/group). Shown are mean ± s.e.m.
(D) NK and T lymphocyte depletion in pregnant mice. Values show percentages of the different subsets after each antibody depletion. Blood and tissue were obtained on g.d. 6 (1 WT mouse per condition).
(E) Bacterial CFU on g.d. 9 in WT and GNLY-Tg mice that were depleted of lymphocyte subsets using control antibody (Ctrl) or NK, CD4 or CD8 depleting antibodies on g.d. 3 and then infected with Lm on g.d. 6 (n=3–8 mice/group) Red lines represent the median. * p<0.05, ** p<0.01; by unpaired non-parametric one-way ANOVA (Kruskal-Wallis test (A-C) followed by Dunn’s post test comparing each transgenic mice group with WT (A) and area under the curve (B,C)); and non-parametric unpaired one-way ANOVA (Kruskal-Wallis followed by Dunn’s post-test), comparing each group with respective control (E)).
Data Availability Statement
This study did not generate datasets or code.