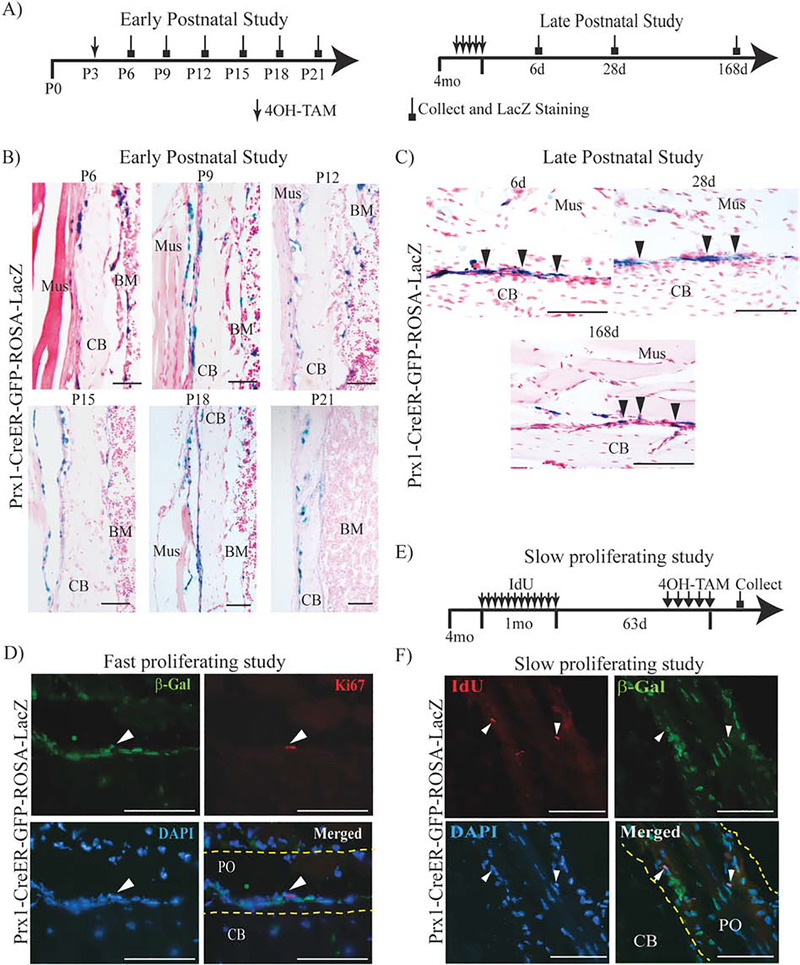
Figure 3.
Lineage tracing studies of Prx1-expressing cells in intact tibias.
(A) Schematic representation of 4OH-TAM injections in postnatal development studies in Prx1-CreER-GFP-ROSA-LacZ mice. (B) Representative histological LacZ/Safranin O staining of early postnatal study. For all pictures, periosteal surface is facing the right side of the images. (C) Representative histological LacZ/Safranin O staining of late postnatal study. For all pictures, periosteal surface is facing the top of the images. (D) Representative IF images in periosteum of Prx1-CreER-GFP-ROSA-LacZ mice, immunostained respectively with β-Gal (green) and Ki67 (red) antibodies, counterstained with DAPI (blue). (E) Schematic representation of slow-proliferating study in Prx1-CreER-GFP-ROSA-LacZ mice. (F) Representative IF images in Prx1-CreER-GFP-ROA-LacZ mice, immunostained respectively with β-Gal (green) and IdU (red) antibody, counterstained with DAPI (blue). White arrows indicate the Prx1-CreER-βGal+/IdU+ cells. Mus=muscle; CB= cortical bone; BM= bone marrow; PO= periosteum. Scale bars = 100μm.

