Abstract
Chromothripsis and kataegis are frequently observed in cancer and may arise from telomere crisis, a period of genome instability during tumorigenesis when depletion of the telomere reserve generates unstable dicentric chromosomes1–5. Here we examine the mechanism underlying chromothripsis and kataegis using an in vitro telomere crisis model. We show that the cytoplasmic exonuclease TREX1, which promotes the resolution of dicentric chromosomes4, plays a prominent role in chromothriptic fragmentation. In absence of TREX1, the genome alterations induced by telomere crisis primarily involve Breakage-Fusion-Bridge cycles and simple genome rearrangements rather than chromothripsis. Furthermore, we show that the kataegis observed at chromothriptic breakpoints is the consequence of cytosine deamination by APOBEC3B. These data reveal that chromothripsis and kataegis arise from a combination of nucleolytic processing by TREX1 and cytosine editing by APOBEC3B.
Keywords: telomere crisis, chromothripsis, kataegis, TREX1, APOBEC3B, dicentric chromosome
To model telomere crisis, we used a previously established model system based on RPE-1 cells in which the Rb and p53 pathways are disabled with shRNAs and telomere fusions are generated with a doxycycline-inducible dominant negative allele of the shelterin protein TRF24,6. The resulting dicentric chromosomes persist through mitosis to form long (50–200 μm) DNA bridges that are generally resolved before the connected daughter cells enter the next S phase. Bridge resolution is accelerated by the exonucleolytic activity of TREX1, which accumulates on the DNA bridge after nuclear envelope rupture and generates RPA-coated single-stranded (ss) DNA4,7–9. Rearranged clonal cell lines isolated after progression through this in-vitro telomere crisis showed frequent chromothripsis in a pattern similar to cancer: the chromothripsis events were limited to (parts of) chromosome arms rather than involving whole chromosomes4,10. Furthermore, as is the case for chromothripsis in cancer, the breakpoints showed kataegis with the hallmarks of APOBEC3 editing4,11,12.
To determine whether TREX1 contributes to chromothripsis after telomere crisis, TREX1-deficient cell lines generated by CRISPR/Cas9 editing (hereafter TREX1 KOs) were subjected to telomere crisis alongside the TREX1-proficient T2p1 cell line and clonal post-crisis descendants were isolated for Whole Genome Sequencing (WGS). Since only some clones are expected to have experienced telomere crisis4, initial identification of clones with genomic alterations was necessary. To determine whether low-pass whole genome sequencing (WGS) can identify relevant copy number changes evident at higher coverages, 17 post-crisis clones derived from T2p1 were analyzed at both 1x and 30x sequence coverage (Fig. 1a–d)13,14. Among chromosomes showing no copy number (CN) changes in 1x WGS analysis, 67% also did not show CN changes in high coverage WGS and 30% showed 1–3 CN changes (hereafter referred to as simple events) (Fig. 1b). Only 3% of chromosomes lacking evidence for CN changes in 1x WGS were found to contain ≥4 CN changes (hereafter referred to as complex events) in 30x WGS (Fig. 1b). Of 37 chromosomes showing 1–3 CN changes in 1x WGS, 19 were found to contain more than 3 CN changes in 30x WGS (Fig. 1b). The discrepancy in the segments missed by 1x WGS but reported in the 30x data is likely due to the conservative thresholds for calling gains and losses in low coverage data. Overall, the 1x analysis had an acceptable false negative rate of <10% (32 of 391 chromosomes) with regard to identifying chromosomes with complex events. Similarly, the false positive rate of the 1x coverage analysis was well below 10%, since only 1 out of 19 chromosomes with complex events detected in 1x WGS did not show ≥4 CN in 30x coverage. These data indicated that 1x WGS allows identification of informative post-crisis clones.
Figure 1. The effect of TREX1 on telomere crisis induced rearrangements.
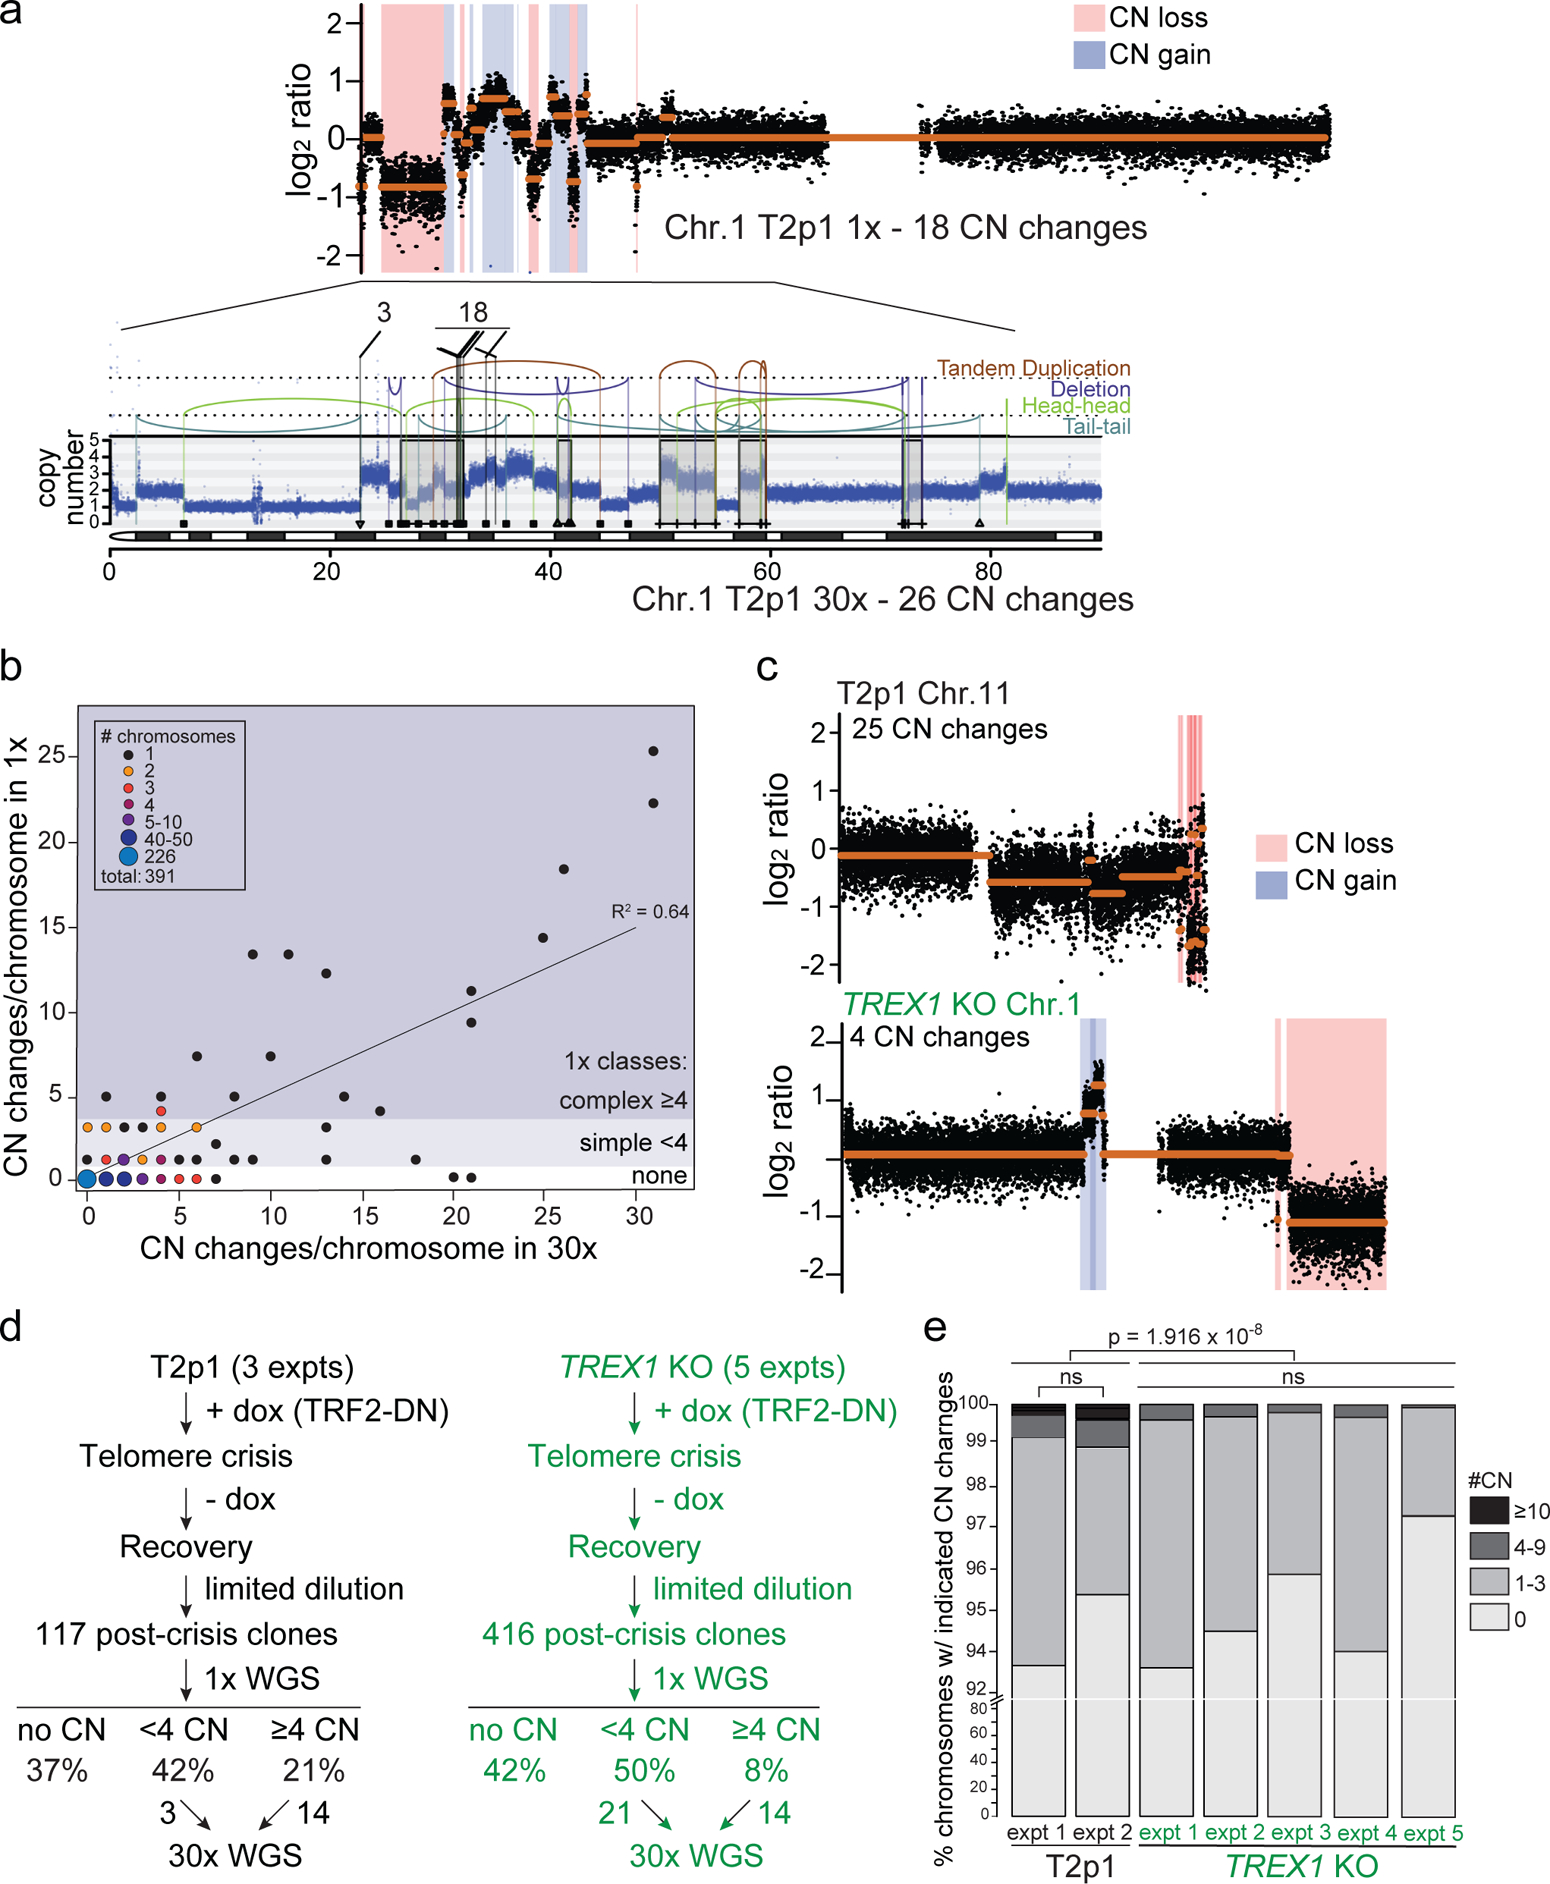
a, Example of comparison of 1x and 30x WGS analysis of part of chromosome 1 in a clone derived from T2p1 cells induced to undergo telomere crisis. Top: QDNAseq analysis of 1x target coverage genomic sequencing data. Regions of CN loss (pink highlight) and CN gain (blue highlight) are indicated. CN profiles are log2-transformed. Bottom: DNA CN profile (estimated copy number over genomic windows) and rearrangement joins obtained from Battenberg analysis of 30x target coverage genomic sequencing data. Colored arcs represent joins with the type of rearrangement and orientation as identified on the right. Rearrangement joins are further classified into discrete events as indicated by triangles, squares, and plus symbols (see methods). Interchromosomal rearrangements junctions linking to chromosomes 3 and 18 are indicated. b, Comparison of detection of DNA CN changes per chromosome in 1x and 30x WGS of 391 chromosomes from post-crisis T2p1 clones. Size and color of the dots highlight the approximate number of chromosomes with the indicated CN changes detected in 1x and 30x WGS. No events, simple events, and complex events are defined on the right. c, Examples of DNA copy number profiles (1x (QDNAseq)) of a T2p1 and a TREX1 KO post-crisis clone. d, Analysis pipeline and summary of the number of post-crisis T2p1 and TREX1 KO clones isolated from n = 5 independent telomere crisis experiments, the frequency of simple and complex CN changes detected (1x) and the number of clones selected for 30x WGS. e, Stacked bar plot of chromosomes from T2p1 and TREX1 KO post-crisis clones. Data derived from 1x (WGS of 117 subclones (2,691 chromosomes) and 301 subclones (6,923 chromosomes) from T2p1 and TREX1 KO clones, respectively. P values derived from Chi-squared test for trend in proportions (ns: not significant).
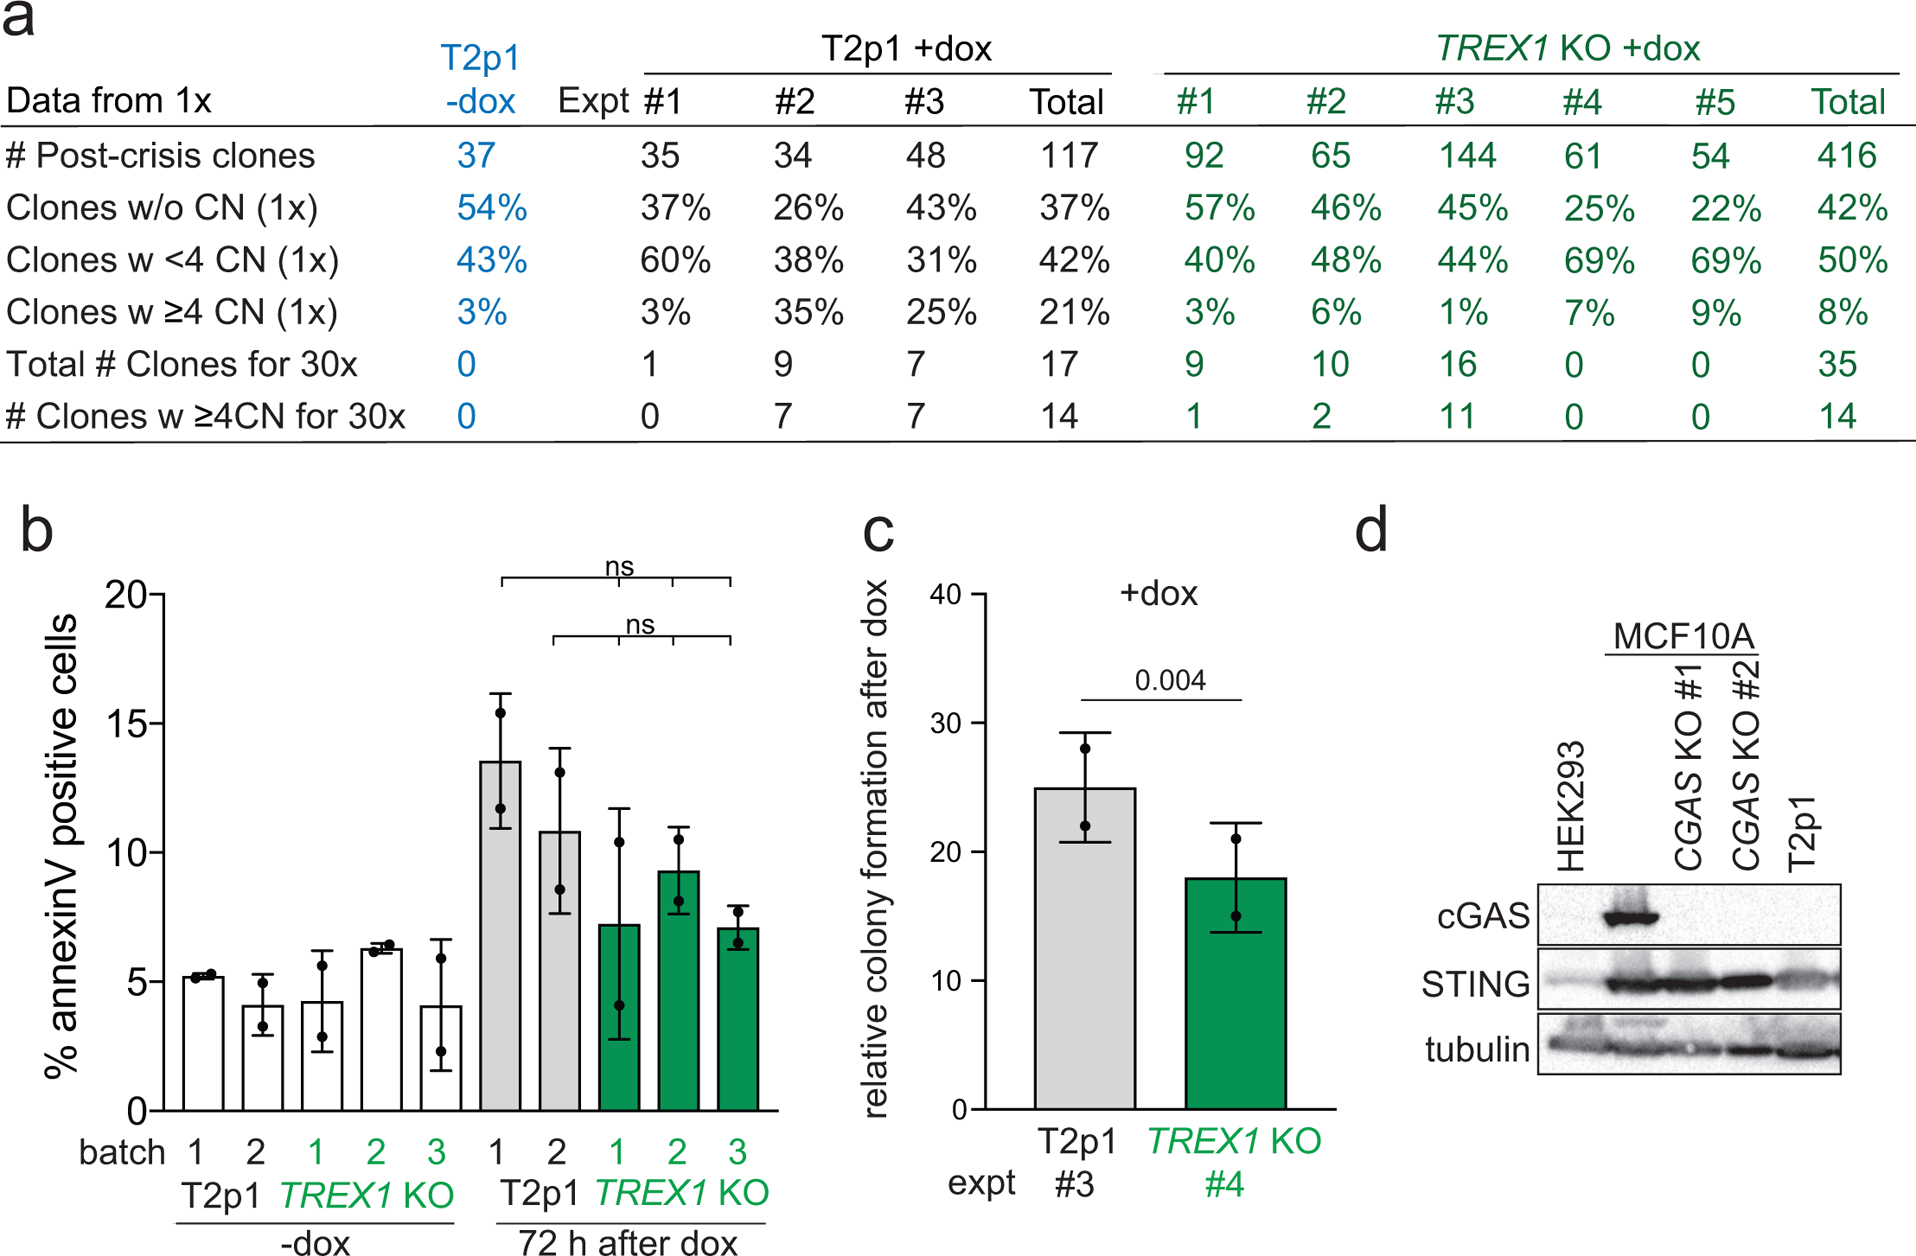
Comparison of the 1x WGS data obtained from 417 TREX1 KO post-crisis clones with 117 T2p1 clones showed that among clones with CN changes, the frequency of complex events was lower in the TREX1 KO setting both with regards to clones containing complex events and the proportion of chromosomes showing complex events (Fig. 1c–e; Ext. Data Fig. 1a). Furthermore, the number of CN changes associated with complex events was lower in the TREX1 KO setting (Fig. 1e). These results indicate that cells progressing through telomere crisis without TREX1 sustain fewer complex chromosome rearrangements. We considered that the diminished incidence of complex rearrangements in the TREX1 KO clones might be due to altered survival after telomere crisis, creating a bias in the analysis. However, TREX1 KO cells treated with doxycycline showed the same frequency of cell death (5–10%) as doxycycline-treated cells with TREX1 (Ext. Data Fig. 1b). Furthermore, in one telomere crisis induction experiment, we compared the plating efficiency of the TREX1 KO and T2p1 cells and found that the TREX1 KO cells formed colonies at ~25% lower frequency than the T2p1 cells (Ext. Data Fig. 1c). In this experiment, the frequency of complex rearrangements in the resulting TREX1 KO clones was 7% whereas the T2p1 clones showed a frequency of 25% (Ext. Data Fig. 1a). We also note that T2p1 and derivative cell lines are unlikely to perish due to cGAS/STING signaling in response to genome instability, since their cGAS expression level is too low to be detected by Western blotting (Ext. Data Fig. 1d)15. Additionally, DNA bridges were not found to elicit significant cGAS/STING signaling in an analogous model of telomere crisis in cGAS-positive MCF10A cells16. Nonetheless, we cannot fully rule out a difference in the survival of the TREX1 KO clones that may affect the frequency of observed rearrangements.
Post-crisis clones were screened for copy number changes at 1x and those with a minimum of 4 CN changes (complex) on at least one chromosome qualified as candidates for sequencing at high coverage (Fig. 1d; Ext. Data Fig. 1a). From these candidate clones, an equal number (14) of T2p1 and TREX1 KO clones were selected for 30x WGS analysis. In addition, some clones with simple events were selected for sequencing at 30x resulting in a total of 17 and 35 clones for T2p1 and TREX1 KO, respectively (Fig. 1d; Ext. Data Fig. 1a).
The genomic alterations observed using 30x analysis in these clones were grouped in four categories (Fig. 2a): chromothripsis (as defined previously17); chromothripsis-like which we define here as a chromothripsis pattern with <10 SVs (see Methods); Breakage-Fusion-Bridge (BFB) cycles (as defined previously18,19); and a fourth category referred to as Local Jumps. Local Jumps comprise two broad patterns: a cluster of 2–5 local rearrangements, often with low-amplitude copy number gains and breakpoints in an inverted orientation, thought to arise from replication-based mechanisms; and unbalanced translocations or large deletions with a locally-derived fragment inserted at the breakpoint20.
Figure 2. TREX1 promotes chromothripsis.
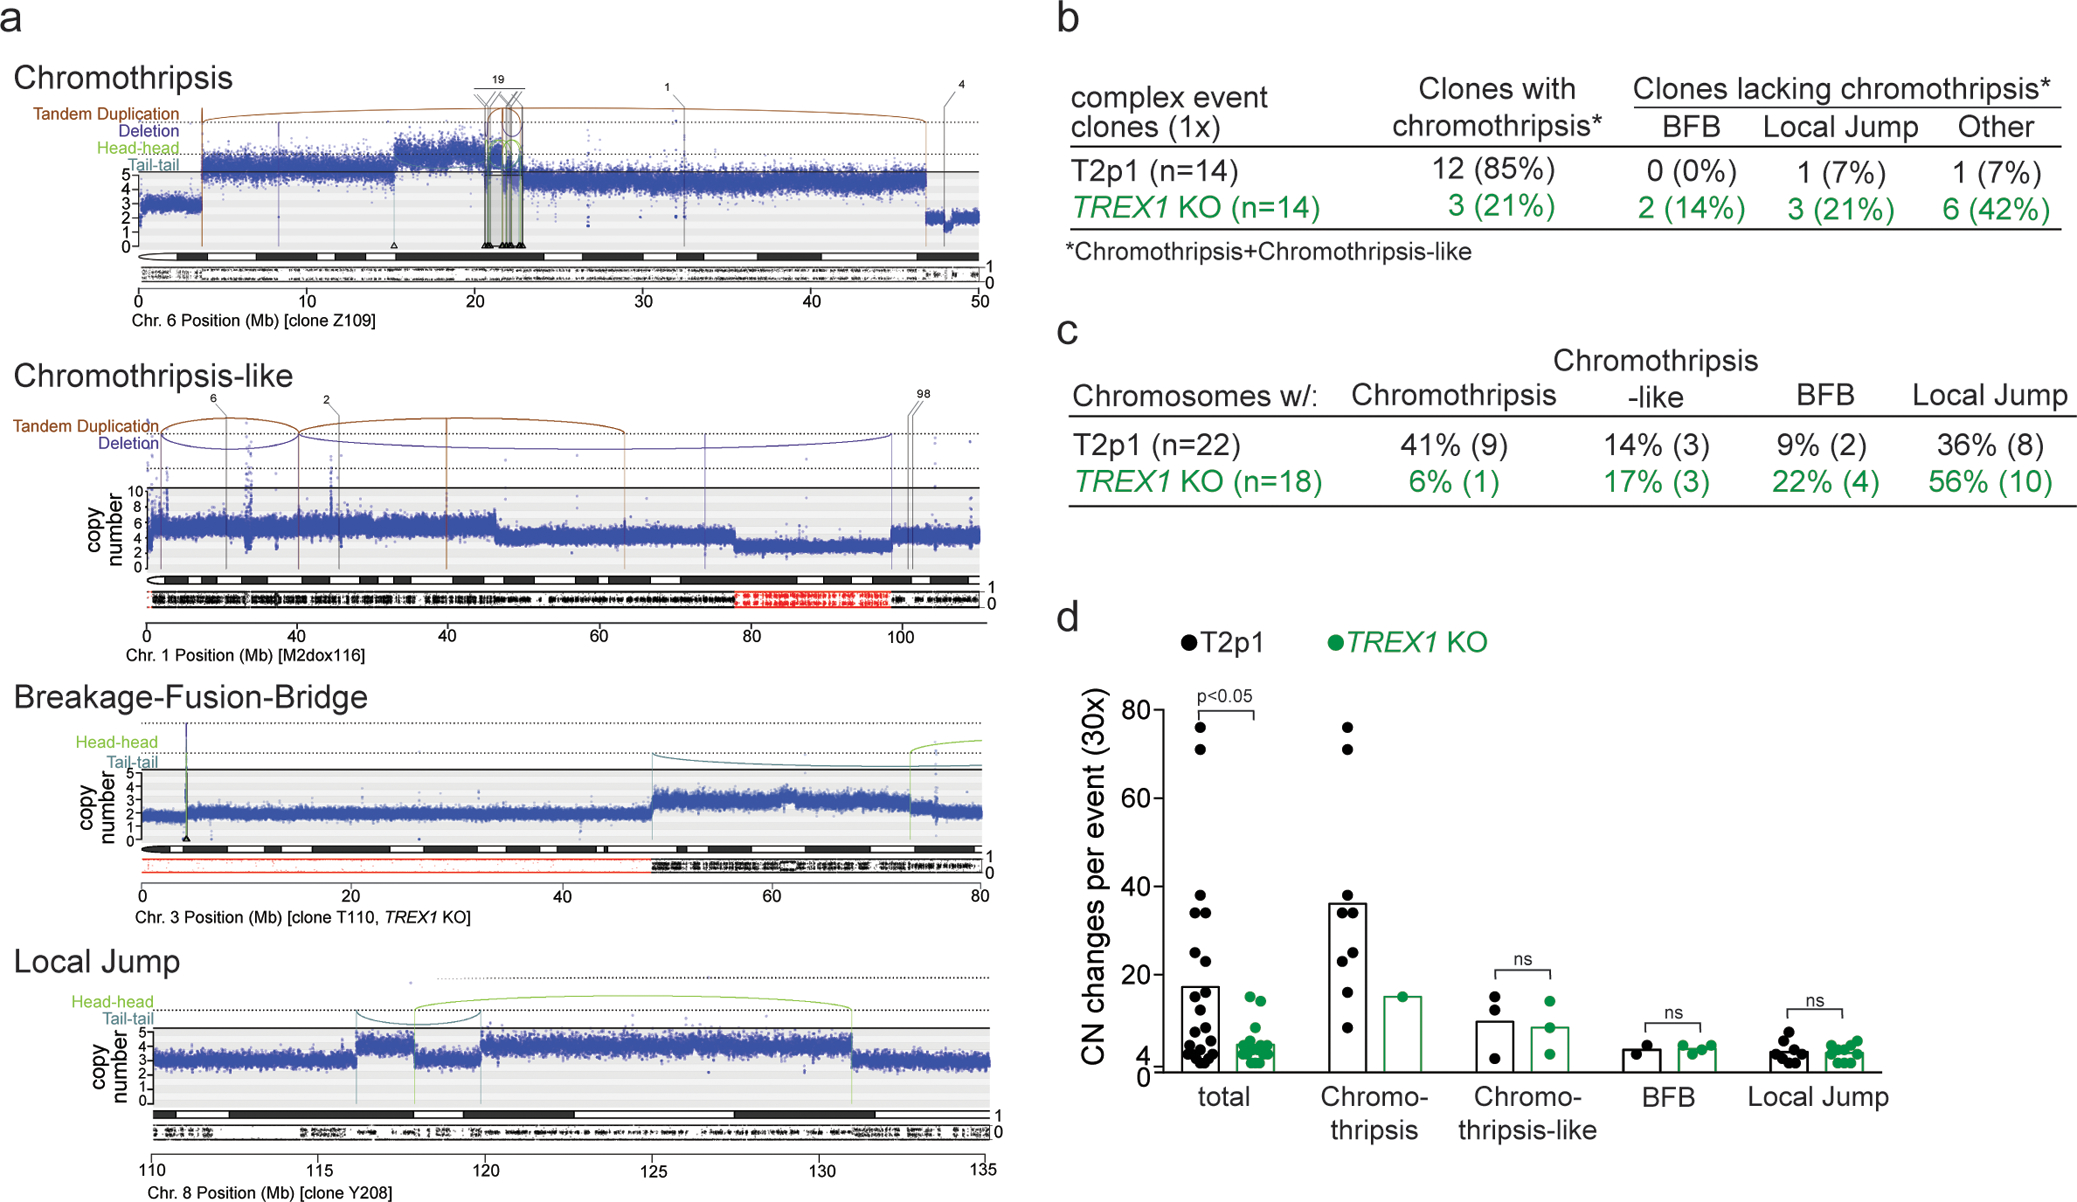
a, Examples of chromothripsis (see also Fig. 1a and Fig. 3h,I below), chromothripsis-like, Breakage-Fusion-Bridge, and Local Jump patterns in post-crisis clones derived from T2p1 and TREX1 KO cells. DNA CN profiles and rearrangement joins were obtained from 30x target coverage WGS. Annotation as in Fig. 1a. Variant allele frequency tracks are shown below the chromosome ideograms. b, Summary of number of clones that displayed the types of rearrangements shown in (a) as determined by 30x WGS of 14 T2p1 and TREX1 KO post-crisis clones with complex events observed in 1x WGS. c, Summary of the number of chromosomes in post-crisis T2p1 and TREX1 KO clones examined in (b) that display the indicated rearrangements. d, Plot of the number of CN changes associated with the complex events indicated in post-crisis T2p1 and TREX1 KO clones described in (b). P values derived from ANOVA (ns: not significant). Statistical testing of copy number differences in chromothripsis events between T2p1 and TREX1 KOs was not possible because the data set only includes one chromothripsis event in the TREX1 KOs.
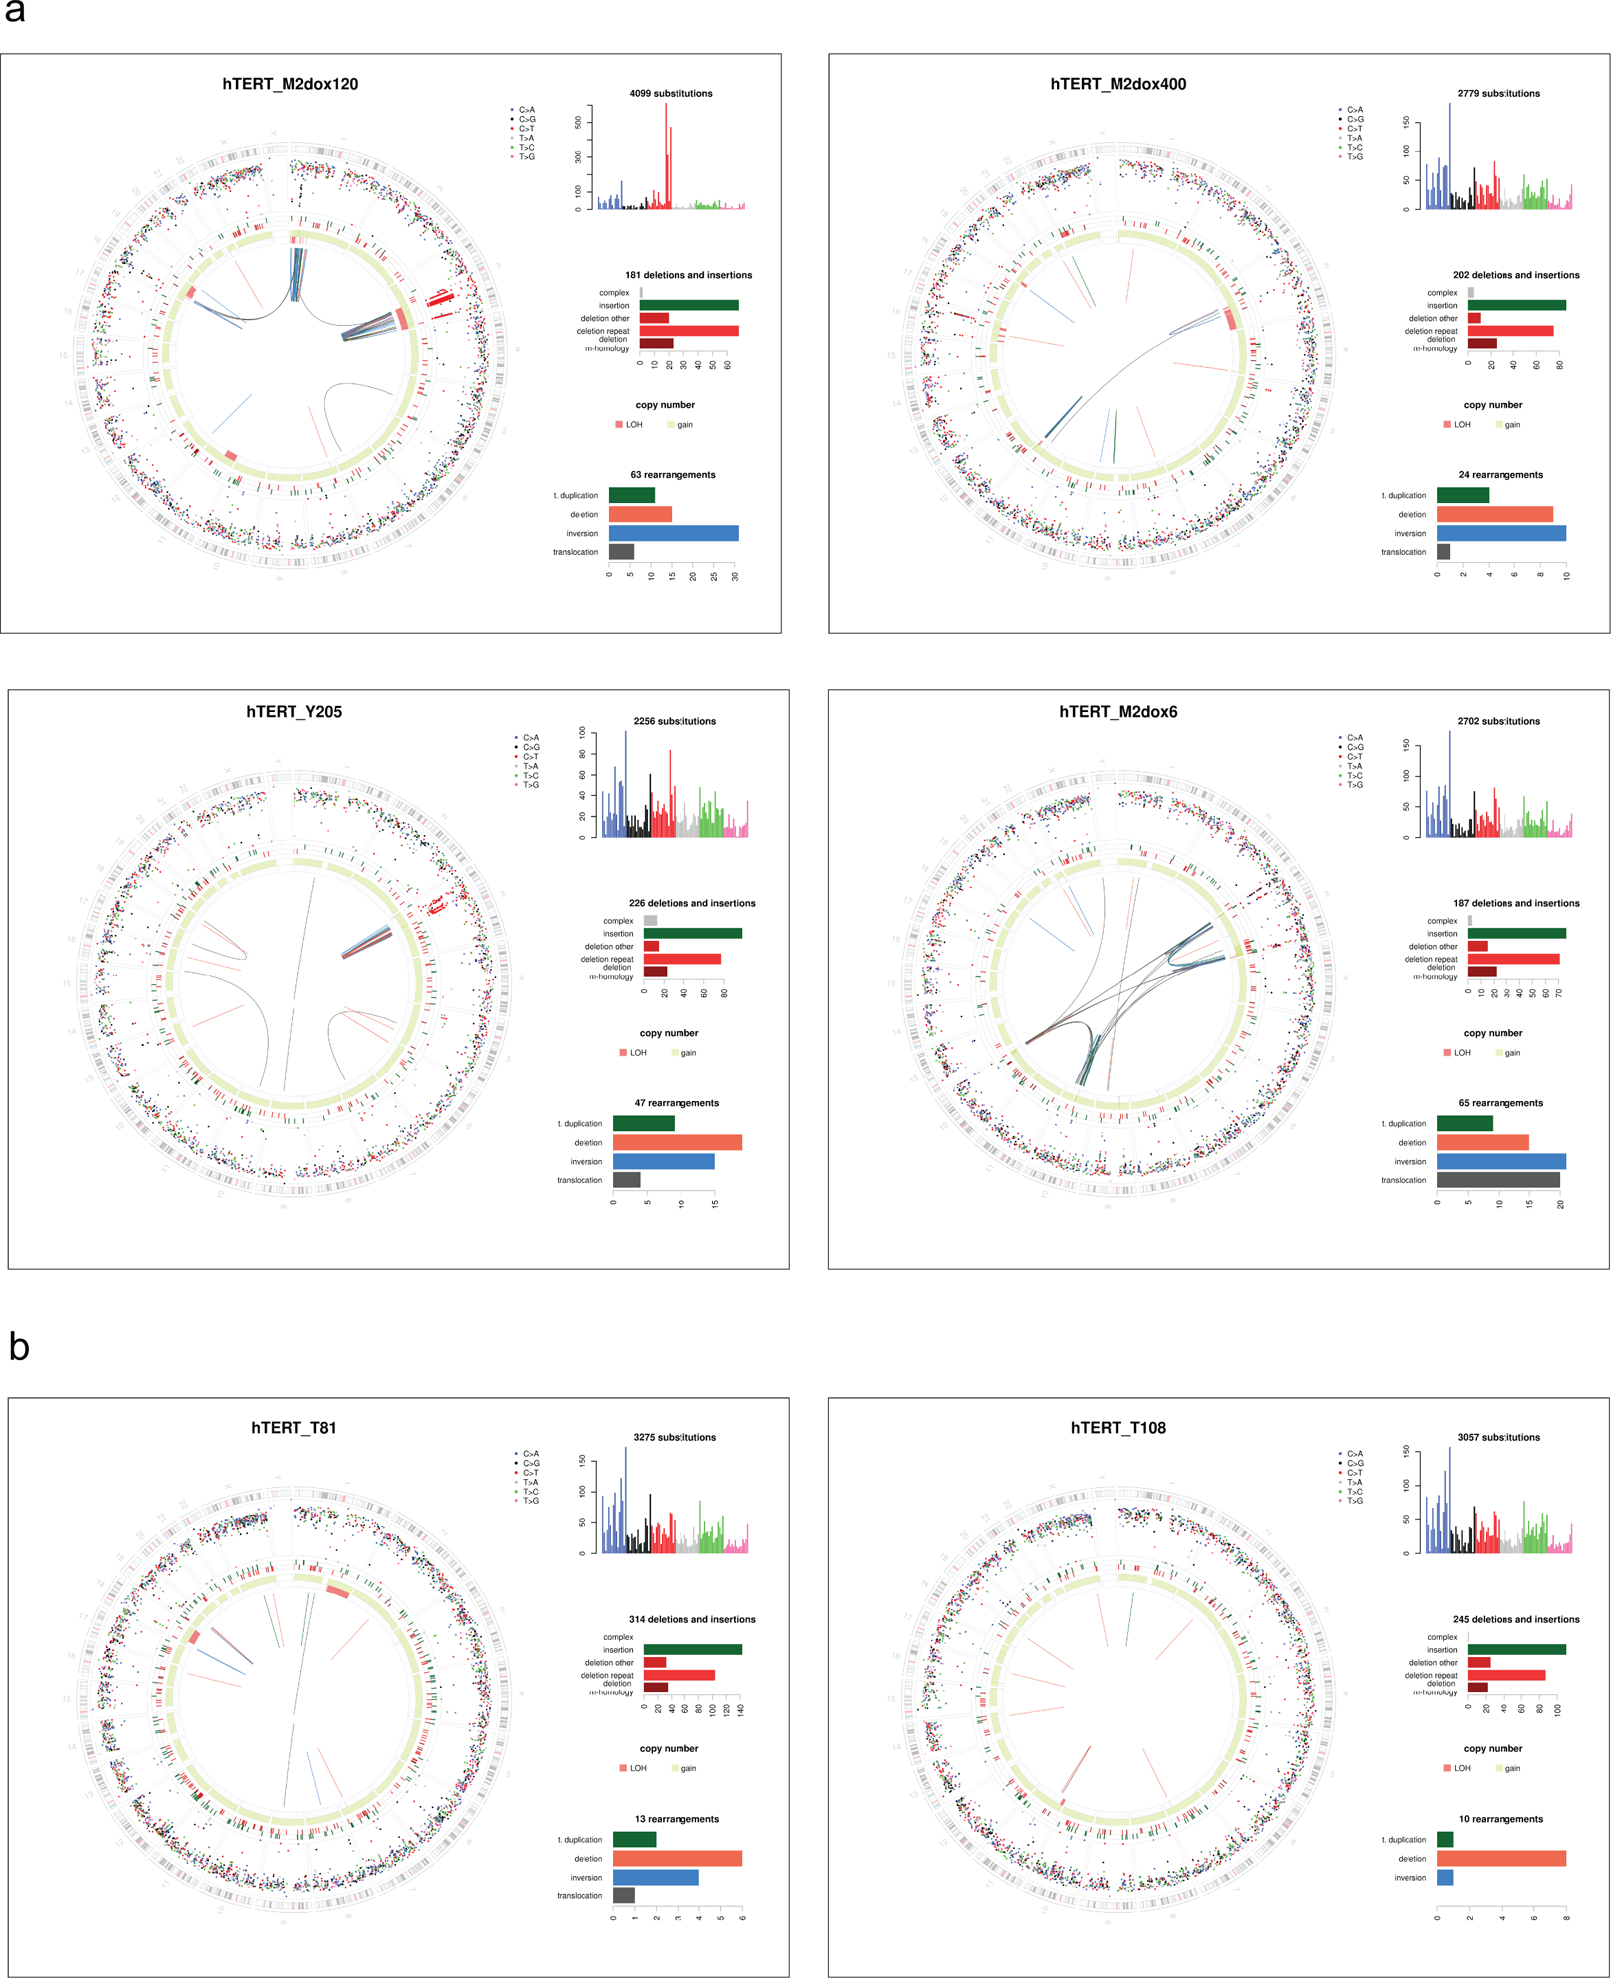
Of the 14 selected T2p1 post-crisis clones with ≥4 CN changes in 1x coverage analysis (Fig. 1e; Ext. Data Fig. 1a), 12 (86%) had either chromothripsis or a chromothripsis-like pattern on 30x WGS (Fig. 2b,c). Consistent with telomere dysfunction derived events, chromothripsis was often localized to distal parts of chromosome arms (Ext. Data Fig. 2). In contrast, among the 14 TREX1 KO clones with complex events analyzed by 30x WGS, only three (21%) showed chromothripsis or chromothripsis-like patterns (Fig. 2b,c). Taken together with the low-coverage data, these data indicate that chromothripsis is more frequent when cells experience telomere crisis in the presence of TREX1.
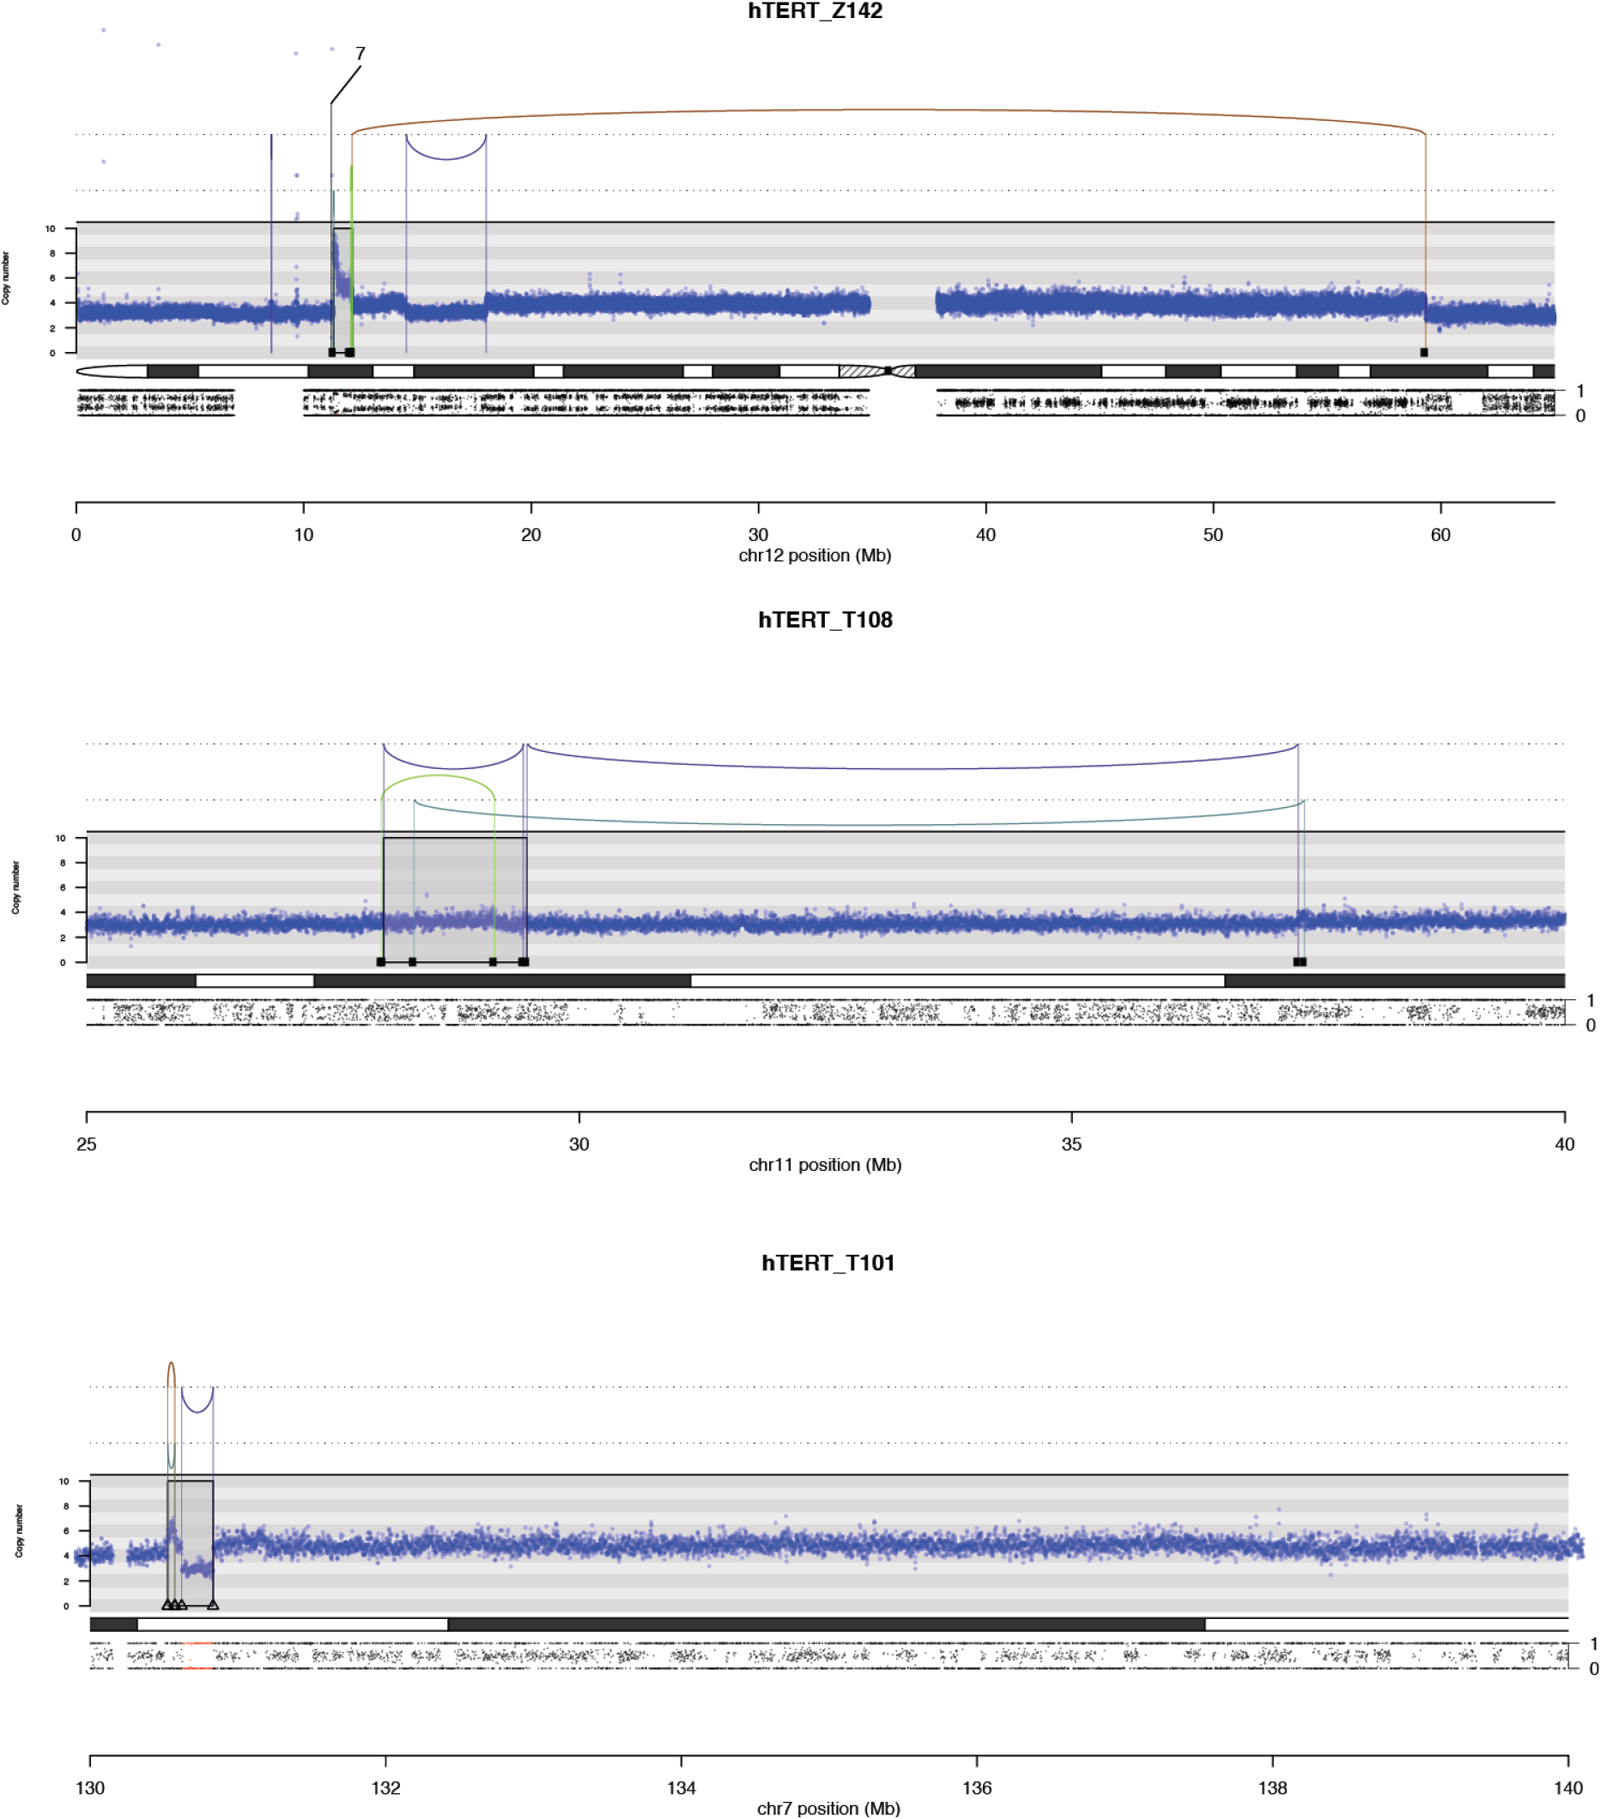
The patterns of structural variation in the post-crisis TREX1 KO clones showed that other abnormalities emerge instead of chromothripsis (Fig. 2c). Whereas the majority (57%) of CN changes in the T2p1 clones are classified as chromothripsis or chromothripsis-like, TREX1 KO clones predominantly showed BFB and Local Jump signatures (Fig. 2c,d; Ext. Data Fig. 3). Commensurate with this, the number of CN changes per event was lower in the TREX1 KO clones than T2p1 clones (Fig. 2d). The implication of these data is that TREX1 KO cells resolve DNA bridges formed in telomere crisis through simple structural events rather than chromothripsis.
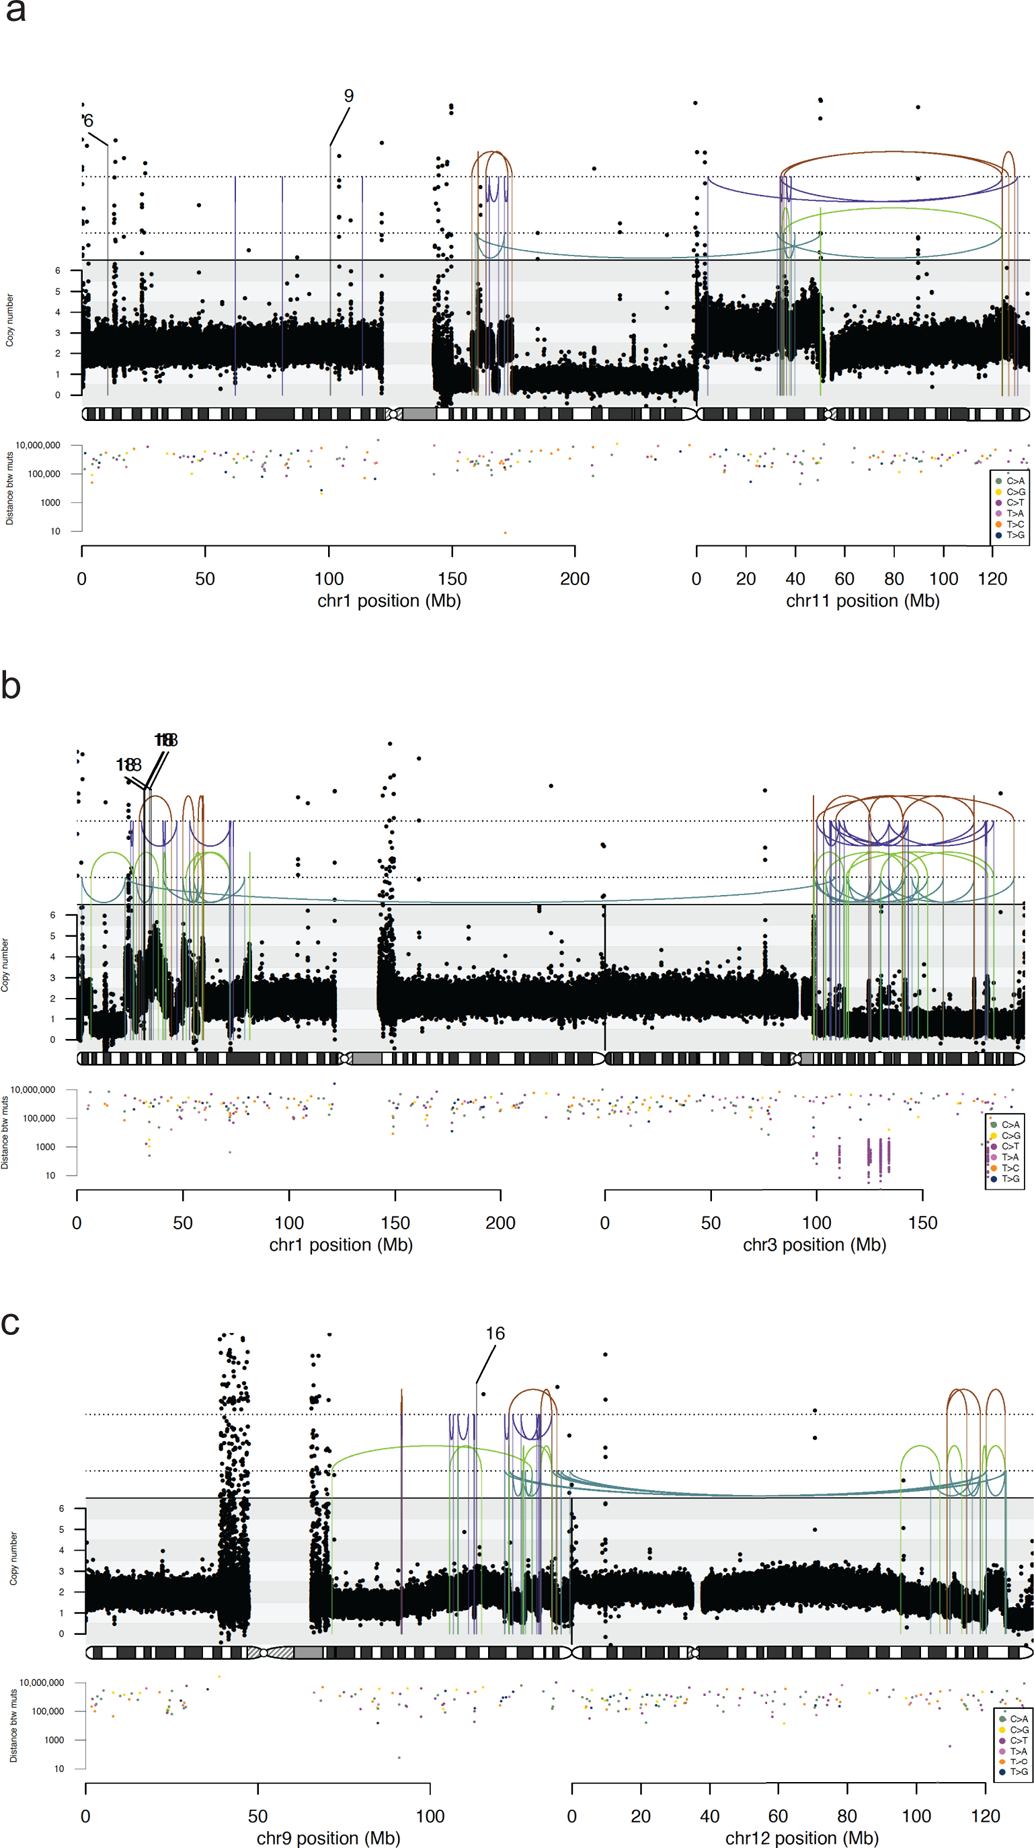
Some of the clones showed evidence of parallel or sequential telomere crises with chromothripsis. Parallel crises manifested as chromothripsis affecting two separate regions where virtually all the rearrangements were confined to within each region, suggesting that the damage and repair were isolated from one another, either in time or in space. Sometimes the two regions were linked by a single translocation, which presumably occurred after the chromothripsis resolved, stabilizing the two derivative chromosomes (Ext. Data Fig. 4). In other clones, we found evidence for sequential events affecting the same derivative chromosome – these manifested as separate clusters of breakpoints, one of which demarcated clonal copy number changes, and one subclonal copy number changes (Ext. Data Fig. 4). These occasional clones suggest that telomere crisis and chromothripsis are not always resolved in a single cell cycle.
Chromothripsis after telomere crisis is accompanied by kataegis with the hallmark of APOBEC3 cytosine deaminase editing: clustered and strand-coordinated mutations in cytosine residues in TCA or TCT triplets4,21. The ssDNA substrate of APOBEC3 enzymes is formed by TREX1-dependent nucleolytic degradation of the DNA bridges formed in telomere crisis. Based on imaging of Turquoise-tagged RPA70 after TRF2-DN induced telomere fusions (Fig. 3a–c), the ssDNA remnant of resolved DNA bridges appeared to either join the primary nucleus or remain outside the nucleus during interphase. In the next mitosis, RPA foci were still detectable and often became incorporated into one of the daughter nuclei. In the vast majority of cases (47 out of 49 nuclei analyzed), large RPA foci remained detectable for at least 19 h, suggesting that the ssDNA APOBEC3 substrate persists for a long period after DNA bridge resolution.
Figure 3. APOBEC3B induces kataegis during telomere crisis.
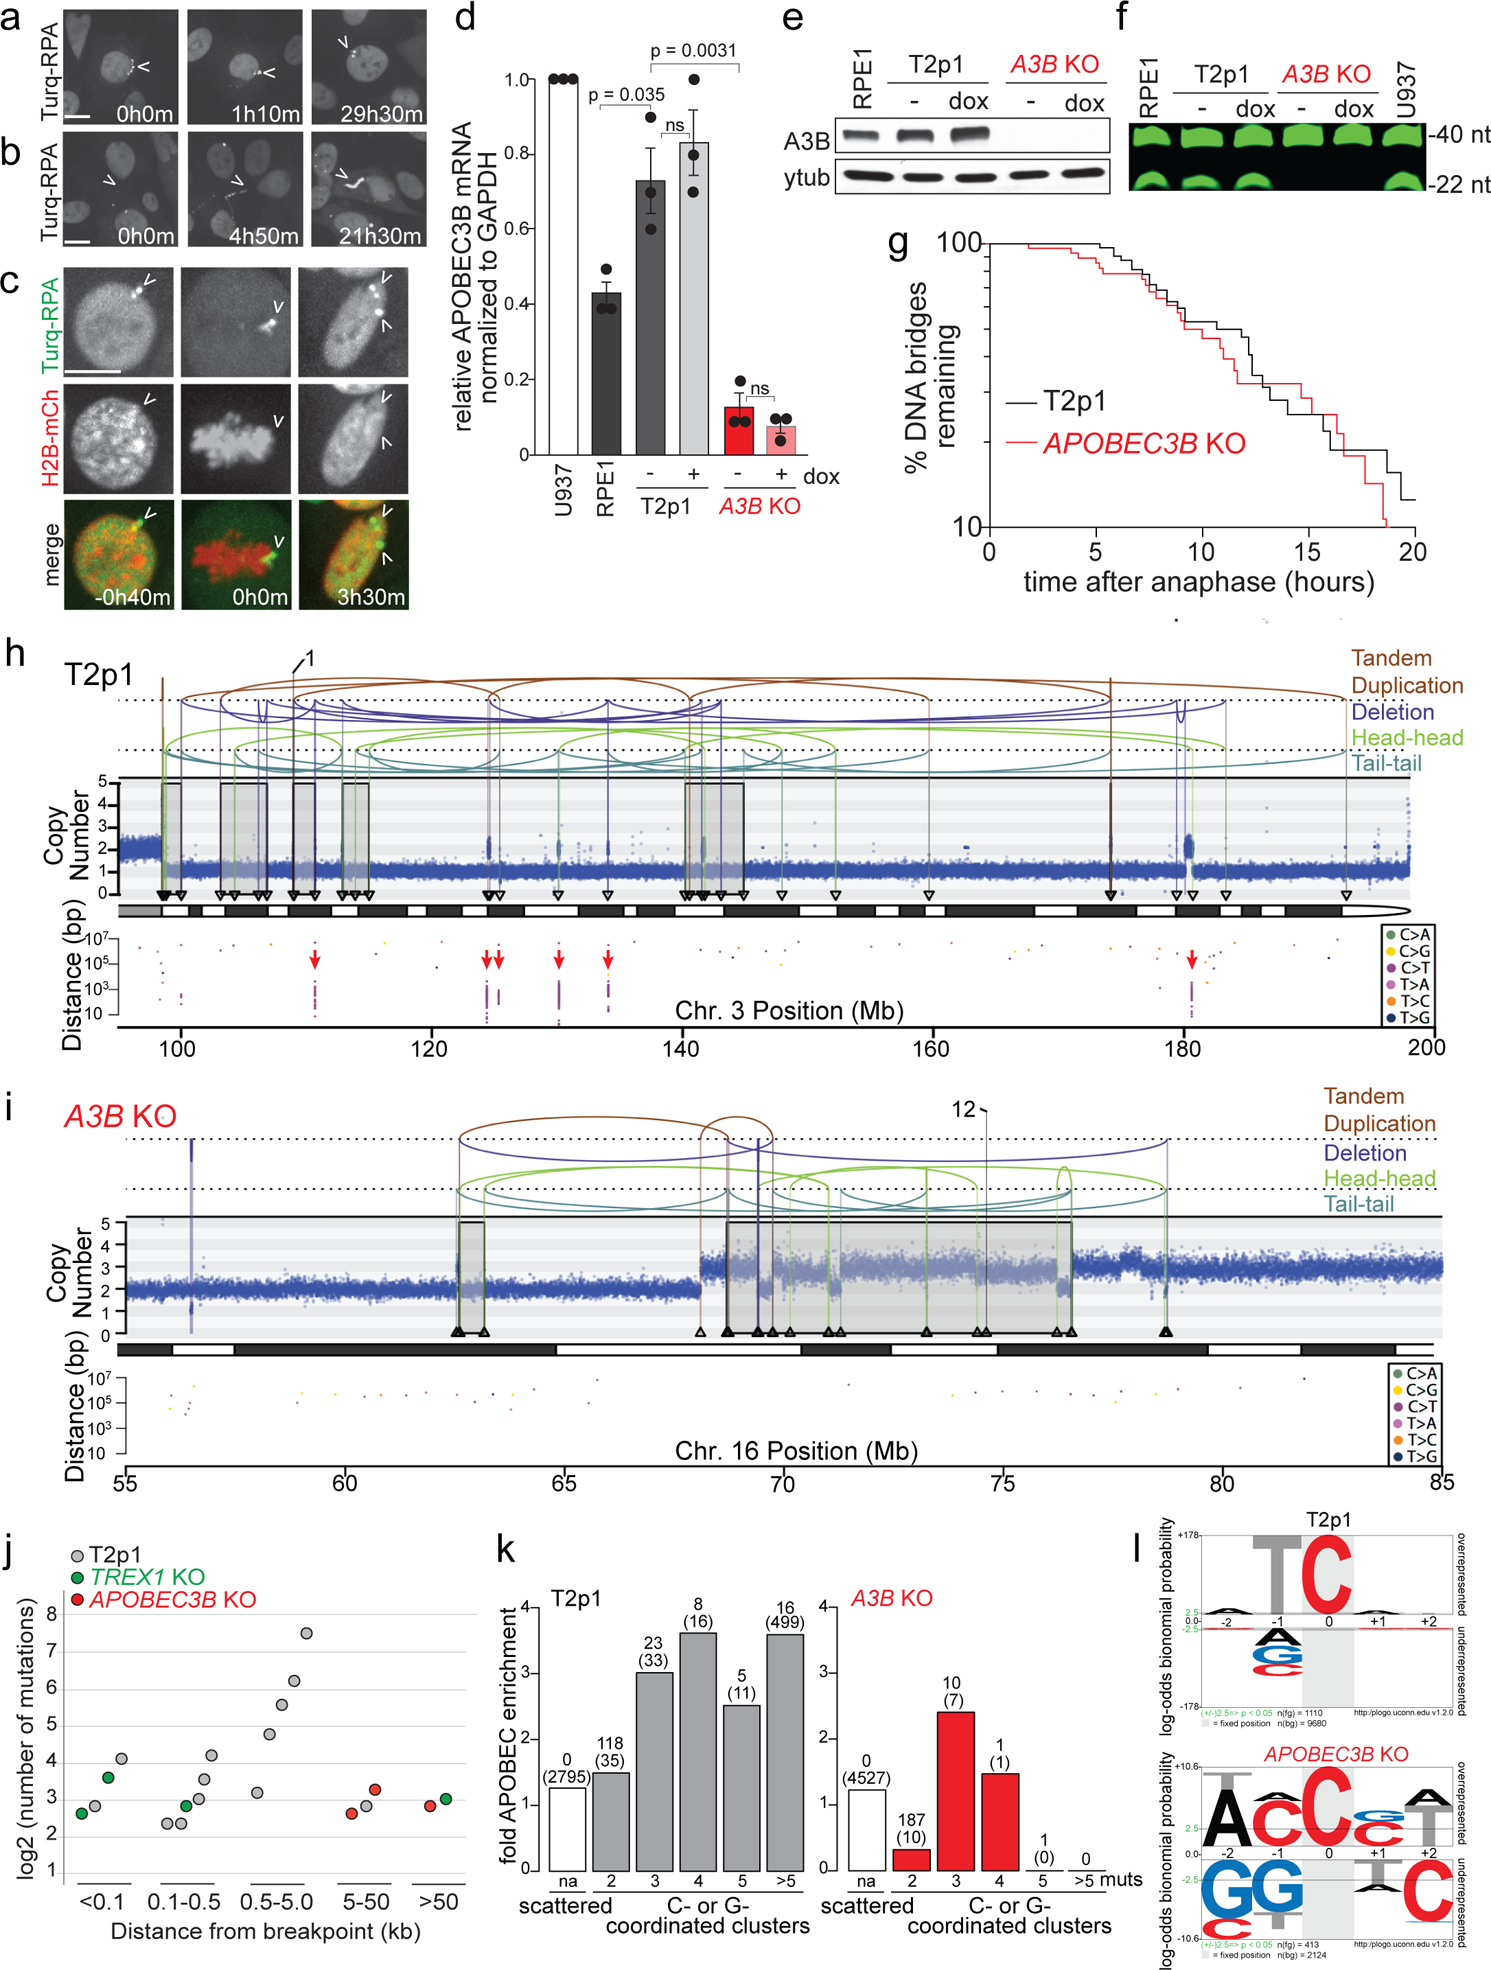
a, Still photographs from live-cell imaging of T2p1 cells expressing mTurquoise2-RPA70 at the indicated time points after doxycycline treatment showing ssDNA joining the primary nucleus. b, As in (a) but showing an example of ssDNA remaining outside the nucleus. c, As in (a) but showing both H2B-mCherry and mTurquoise2-RPA70 and representing an example of ssDNA joining a daughter nucleus during mitosis (times before and after mitosis are given). Images are representative of n = 3 independent experiments. d, Normalized APOBEC3B mRNA levels in the indicated cell lines based on qRT-PCR and represented relative to U937 cells. Mean and s.d. of n = 3 independent experiments are shown. P values derived from Student’s t test. (ns: not significant). e, Immunoblotting for endogenous APOBEC3B before or after 48 hours of dox treatment in the indicated cell lines. f, Cytidine deaminase activity assay in the indicated cell lines. Expected DNA fragment sizes are indicated. Gel is representative of n = 3 independent experiments. g, Timing of DNA bridge resolution after anaphase in T2p1 and APOBEC3B KO cells expressing H2B-mCherry and mTurquoise2-RPA70 and induced with dox. Data were obtained from two independent experiments (T2p1 = 53, 55; APOBEC3B KO = 65, 67 DNA bridges). h and i, Examples of DNA CN profile and rearrangement joins of T2p1 (h) and APOBEC3B KO (i) post-telomere crisis clones with chromothripsis obtained from 30x WGS. Annotation as in Fig. 1a. Red arrows: kataegis clusters. j, Plot of distance of cytosine mutation clusters (regardless of strand-coordination) indicating the number of mutations and the distance to the nearest rearrangement breakpoint in post-crisis wild T2p1 clones (grey), TREX1 KO clones (green), and APOBEC3B KO clones (red). k, APOBEC signature motif enrichment in C- or G-coordinated clusters of the indicated sizes and intermutational distances < 10 kb (as described in the Methods ref. 32) in post-crisis T2p1 and APOBEC3B KO clones. Above each bar: number of clusters and (number of tCw motifs). l, Statistical evaluation of nucleotide prevalence around cytosines mutated in C- or G-coordinated clusters based on data as in (k). All scale bars = 5 μm.
Transcript analysis showed that RPE1 cells express APOBEC3B but not ABOBEC3A (Fig. 3d; Ext. Data Fig. 5a). The APOBEC3B mRNA levels in T2p1 cells were slightly increased compared to the parental RPE1 cell line but not further induced by telomere damage (Fig. 3d). The APOBEC3B locus was targeted by CRISPR/Cas9 editing (Ext. Data Fig. 5) and loss of APOBEC3B expression was verified by immunoblotting (Fig. 3e; Ext. Data Fig. 5f). Cytosine deaminase activity in cell extracts became undetectable in APOBEC3B KO cells (Fig. 3f), indicating the APOBEC3B is the major cytosine deaminase in the telomere crisis cell line. The absence of APOBEC3B did not affect the resolution of the DNA bridges formed by dicentric chromosomes (Fig. 3g).
The pipeline of 1x and 30x WGS analysis described above was applied to 375 clones derived from four independent experiments performed with two independent APOBEC3B KO cell lines (Ext. Data Fig. 6a–c). The percentage of post-crisis clones showing CN changes detectable by 1x WGS and the frequency of clones with either simple or complex events was similar in the absence and presence of APOBEC3B (Ext. Data Fig. 6a). Furthermore, 30x WGS of 23 selected clones showed that the prevalence of chromothripsis and chromothripsis-like events was not affected by the absence of APOBEC3B (Fig. 3h,i; Ext. Data Fig. 6b,c).
As expected, a substantial number of kataegis events involving primarily C to T changes in TCA triplets were observed in the post-crisis wild-type T2p1 clones (Fig. 3h–k). Kataegis was associated with chromothripsis, and, as expected, most events were located within 5 kb of the nearest breakpoint and many clusters contained more than 10 mutations (ranging from 12–181) (Fig. 3j). The spectrum of changes and the nucleotide context of the kataegis events were consistent with APOBEC3 editing (Fig. 3k, l). Interestingly, kataegis in the T2p1 clones never occurred at the simple BFB and Local Jump breakpoints. Since these simple rearrangements do not require TREX1 (Fig. 2), they may not involve generation of the ssDNA substrate for APOBEC3 editing. Importantly, despite their frequent chromothripsis(-like) events, the APOBEC3B KO post-crisis clones, showed only three kataegis events and these events had relatively few (6, 7, and 10) mutations (Fig. 3j). Furthermore, the cytosine mutations observed in the APOBEC3B KO clones showed minimal enrichment for APOBEC3 motifs (Fig. 3k, l). Collectively, the data provide experimental evidence for the link between APOBEC3 activity and the generation of Signatures 2 and 13 in the cancer genomes22.
The overall frequency of chromothripsis in the APOBEC3B KO and T2p1 clones was similar and distinct from the lower frequency observed in the TREX1 KO clones (Fig. 4a; Ext. Data Fig. 6b,c). However, complex events in the APOBEC3B KO generally showed fewer CN changes per complex event, although this fell just short of statistical significance (Fig. 4b,c). Therefore, cytosine deamination may potentially lead to strand breakage and thereby increase DNA fragmentation underlying chromothripsis (Fig. 4e) although this strand breakage is not required for DNA bridge resolution (Fig. 3g). Following uracil glycosylation (e.g. by UNG2), the abasic site in the ssDNA may be cleaved by abasic endonucleases such as APE123, despite its preference for dsDNA. The idea that APOBEC3B could function as a cytidine specific initiator of DNA fragmentation is consistent with the finding that APOBEC3B overexpression can induce DNA damage22.
Figure 4. TREX1 and APOBEC3B Determine Genome Instability During Telomere Crisis.
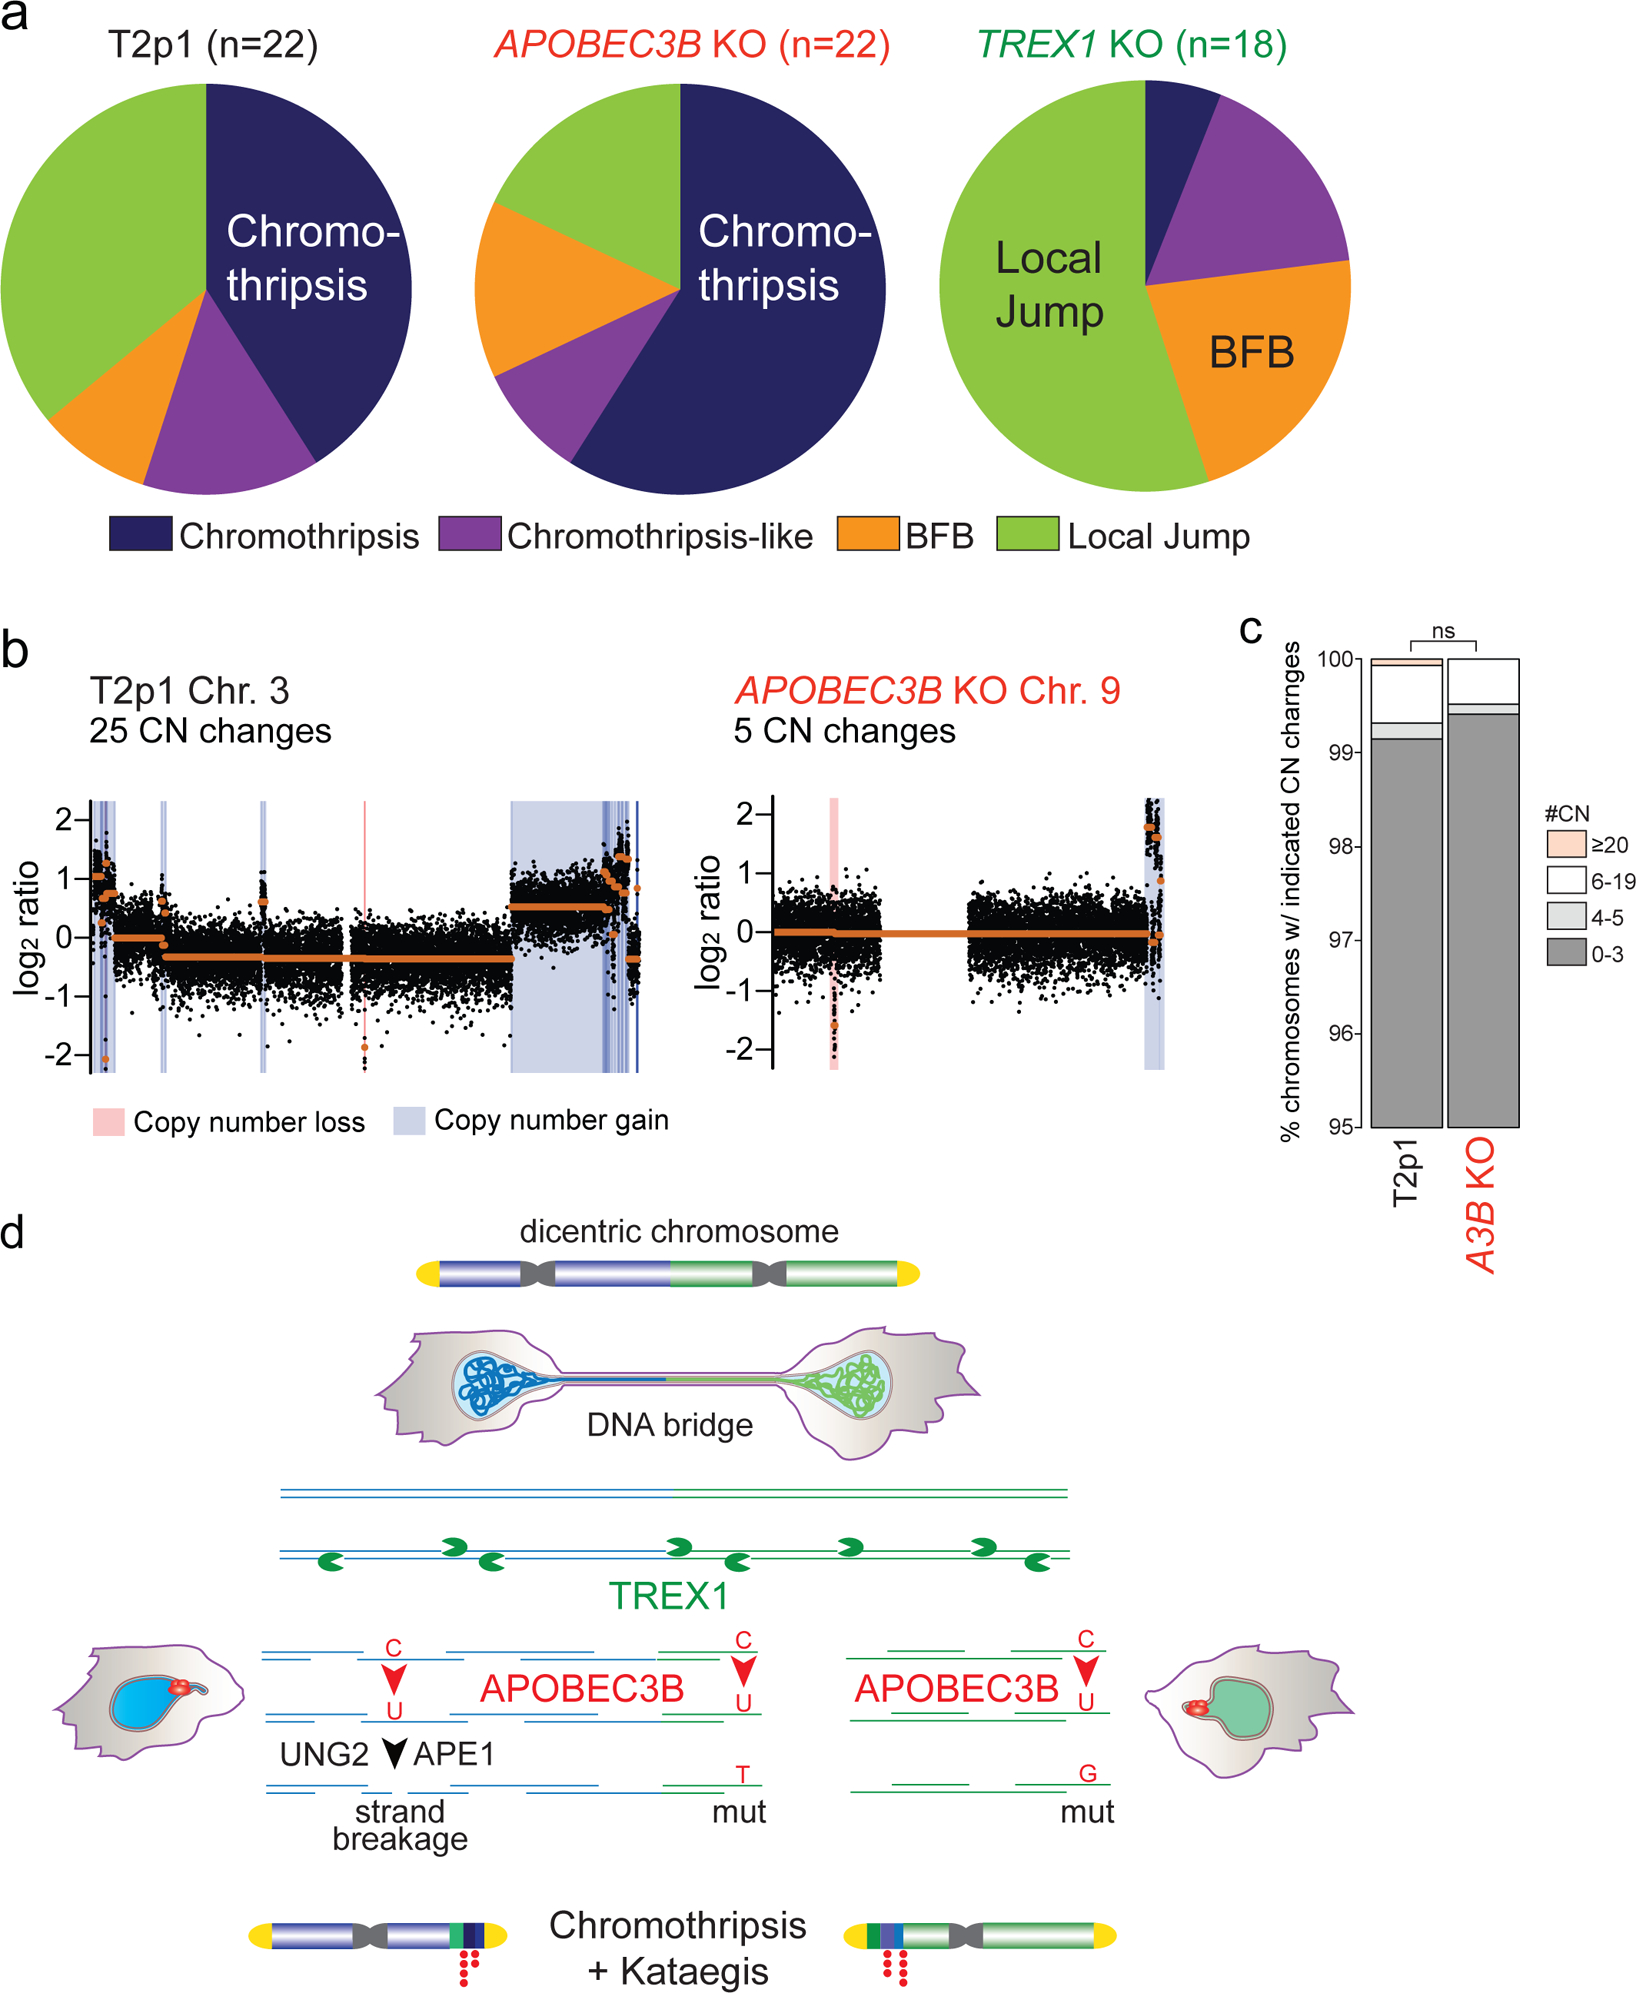
a, Pie-charts summarizing detected events in the indicated cell lines. Data obtained from 30x WGS. n: Total number of chromosomes with either of the four types of events. b, Example of DNA copy number profiles of T2p1 and APOBEC3B KO post-telomere crisis clones from 1x WGS. c, Stacked bar plot of chromosomes from T2p1 and APOBEC3B KO post-crisis clones. Data derived from 1x (WGS of 117 subclones (2,691 chromosomes) and 375 subclones (8,675 chromosomes) from T2p1 and APOBEC3B KO clones, respectively. P value derived from Chi-squared test for trend in proportions (ns: not significant).
d, Schematic displaying the inferred TREX1- and APOBEC3B-dependent events leading to chromothripsis and kataegis during telomere crisis.
These data establish that TREX1, previously shown to promote the resolution of DNA bridges formed by dicentric chromosomes in our experimental system4, plays a critical role in the chromothripsis resulting from bridge resolution. Furthermore, the data presented here show that the kataegis accompanying this chromothripsis is largely due to cytosine deamination by APOBEC3B. While this manuscript was under review, Umbreit et al. reported that TREX1 does not contribute to the resolution of bridges formed through telomere fusion in our T2p1 cell line26. One difference between their experimental set-up and ours is the much shorter induction of TRF2-DN (12 h v 72 h). A 12 h induction is expected to generate very few telomere fusion events and will create bridges containing a single chromatid rather than multiple fused chromatids. It is conceivable that bridges containing a single chromatid can be broken mechanically (as suggested by Umbreit et al.) whereas bridges containing multiple chromatids require TREX1 for their resolution. Since TREX1 localizes to DNA bridges, is responsible for the formation of ssDNA, and promotes bridge resolution4, we consider it likely that the generation of ssDNA by TREX1 underlies most chromothripsis events in this system. Furthermore, the finding of APOBEC3 editing at chromothriptic breakpoints in this and other studies11,25 is consistent with TREX1-induced ssDNA as an intermediate in the process of chromothripsis. We do not know the nature and the frequency of the nicks that provide TREX1 with a starting point for 3’ resection. In addition, it is not yet clear how this 3’ exonuclease leads to resolution of the DNA bridges. One possibility is that the bridge breaks when two TREX1 nucleases meet on opposite strands (Fig. 4e). Alternatively, DNA helicases could inadvertently stimulate the dissociation of ssDNA fragments or ssDNA could undergo breakage due to physical force. We also do not know how the ssDNA fragments are converted into the dsDNA fragments that eventually are combined into the chromothripsis region. Ultimately, it will be critical to establish whether cancers with chromothripsis and kataegis actually evolved through telomere crisis.
Online Methods
Data reporting
No statistical methods were used to predetermine sample size. The experiments were not randomized and the investigators were not blinded to allocation during experiments and outcome assessment.
Cell Culture Procedures and Plasmids
RPE1-hTERT and U937 cells were obtained from the American Type Culture Collection (ATCC). RPE1-hTERT cells were cultured in a 1:1 mixture of Dulbecco’s Modified Eagle Medium (DMEM) and Ham’s F-12 medium (Gibco) (DMEM/F12). Phoenix virus packaging cells were grown in DMEM. U937 cells were grown in RPMI-1640 medium. All media were supplemented with 10% fetal bovine serum (Gibco), 100 U/ml penicillin/streptomycin (Life Technologies), and 2.5 mM L-glutamine (Life Technologies). T2p1 cells and its TREX1 KO derivatives were described previously4. Doxycycline was used at 1 μg/ml.
Target sequence for CRISPR/Cas9 mediated gene knockouts identified by ZiFit (http://zifit.partners.org) (see sgAPOBEC3B #1 and #2 in Supplemental Table 2). Plasmids containing sgRNAs (Addgene 41824) and a human codon-optimized Cas9 (Addgene 41815) were co-nucleofected into target cells by nucleofection (Lonza apparatus). 700,000 cells were mixed with electroporation buffer (freshly mixed 125 mM Na2HPO4, 12.5 mM KCl, 55 mM MgCl2 pH 7.75), 5 μg Cas9 plasmid, and 5 μg gRNA plasmid, transferred to an electroporation cuvette (BTX), and electroporated with program T23 for T2p1 cells. Cells were then allowed to recover for 48 h before a second round of electroporation. Successful CRISPR/Cas9 editing was confirmed at the polyclonal stage by mutation detection with the SURVEYOR nuclease assay (Transgenomic). The regions surrounding the Cas9 cut sites were PCR amplified (using JM661, JM662, JM657, JM658 listed in Supplemental Table 2), melted, and reannealed. Reannealed PCR products were incubated with the SURVEYOR nuclease for one hour at 42°C and analyzed on a 2% agarose gel with ethidium bromide. Clones were isolated by limiting dilution and screened for APOBEC3B deletion by PCR. Inversions resulting from successful sgA3B #1 and sgA3B #2 cutting were identified using primers JM662 and JM680 (Supplemental Table 2). Deletion of the wt APOBEC3B allele was confirmed using primers JM679 and JM680 (Supplemental Table 2). Biallelic targeting was verified by Western blotting and sequencing of TOPO-cloned PCR products.
Annexin V staining was performed using annexin V Apoptosis detection kit (BD) according to the manufacturer’s instructions.
Immunoblotting
For immunoblotting, cells were harvested by trypsinization and lysed in 1x Laemmli buffer (50 mM Tris, 10% glycerol, 2% SDS, 0.01% bromophenol blue, 2.5% β-mercaptoethanol) at 107 cells/ml. Lysates were denatured at 100°C and DNA was sheared with a 28 1/2 gauge insulin needle. Lysate equivalent to 105 cells was resolved on 8% or 10% SDS/PAGE (Life Technologies) and transferred to nitrocellulose membranes. Membranes were blocked in 5% milk in TBS with 0.1% Tween-20 (TBS-T) and incubated with primary antibody overnight at 4°C, washed 3 times in TBS-T, and incubated for 1 h at room temperature with horseradish-peroxidase-conjugated sheep anti-mouse or donkey anti-rabbit secondary antibodies. After three washes in TBS-T, membranes were rinsed in TBS and proteins were developed using enhanced chemiluminescence (Amersham).
The following primary antibodies were used: anti-APOBEC3B (rabbit monoclonal, Abcam, ab184990, 1:1000), anti-γ-tubulin (mouse monoclonal, Abcam, ab11316, 1:1000), anti-cGAS (Cell Signaling Technology, #15102; 1:1000), anti-STING (Cell Signaling Technology, #13647, 1:1000).
Live-cell Imaging and quantitation
Live-cell imaging of mCherry-H2B marked cells was performed as described previously4. Chromatin bridge resolution was determined by manually tracking pairs of daughter cells. Bridge resolution was inferred to take place when the base of the bridge became slack and/or recoiled. RPA and APOBEC3B were tracked based on mTurquoise2-RPA70 and APOBEC3B-mTurquoise2.
Quantitative PCR
Random hexameric primers, avian myeloblastosis virus reverse transcriptase (AMV RT; Roche) were used to synthesize cDNA from total RNA (2.5 μg) template. cDNA levels were quantified by PCR using a Roche Lightcycler 480 instrument as described27. In brief, reactions were performed in 384-well plates with each well containing 7.5 μl 2x probe master mix (Roche), 1.25 μl H2O), 1.05 μl primers (5 μm each), 0.2 μl UPL probe (Roche) and 5 μl cDNA. Reactions were incubated at 95°C for 10 min, then 40 cycles of 95°C for 10 s, 58°C for 15 s, then 72°C for 2s. APOBEC3A and APOBEC3B qPCRs were performed using the primer listed in the Table. Ct values were calculated using the Lightcycler 480 software. cDNA was synthesized and qPCR was performed in triplicate for each sample.
In vitro deamination assay
Cells were lysed in 25 mM HEPES, 5 mM EDTA, 10% glycerol, 1 mM DTT, and protease inhibitor. Protein concentrations were equalized by cell counting prior to lysis. Deamination reactions were performed at 37° C using the APOBEC3B probe (5’ IRDYE800- ATTATTATTATTATTATTATTTCATTTATTTATTTATTTA 3’) in a 10x UDG reaction buffer consisting of 1.25 μl RNase A (0.125 mg/ml), 1 μl probe (0.2 pmol/μl), 16.5 μl cleared lysate and uracil DNA glycosylase (UDG; NEB, 1.25 units). Abasic site cleavage was induced by the addition of 100 mM NaOH and incubation at 95° C. Reaction products were migrated on 15% urea-TBE gels and imaged on an Odyssey CLx Imaging System (Licor).
X-ten Sequencing and Mapping
Genomic DNA sequencing libraries were synthesized on robots and cluster generation and sequencing were performed using the manufacturer pipelines. Average sequence coverage across the samples was 37.3x (range, 23.5 – 47.8x). Sequencing reads were aligned to the NCBI build 37 human genome using the BWA mem algorithm (version 0.7.15;28) to create a BAM file with Smith-Waterman correction with PCR duplicates removed [http://broadinstitute.github.io/picard/].
Mutation Calling
Point mutations were called using CaVEMan version 1.11.229 with RPE-1 as reference. A simple tandem repeat filter was applied first to remove variants observed less than five times or were seen in less than 10% of the reads. Also, a variant was considered only if observed in both forward and reverse strands. To enrich for high-confidence somatic variants, variants were further filtered by removing: known constitutional polymorphisms using human variation databases: Ensembl GRCh37, 1000 genomes release 2.2.2, ESP6500 and ExAC 0.3.1.
Raw mutations were filtered using a homopolymer filter. Mutations which had a homopolymer repeat of at least six bases on either side of the mutation and where the mutated base was same as the base of the homopolymer repeat(s) were removed. A soft-clip filter was used in a similar way, mutations where more than half of the supporting reads were softclipped were removed.
Copy number analysis
We detected DNA copy number aberrations by shallow WGS at 1x (average 1.3x) using QDNAseq13. The genome was divided into bins of 15kb and the method used for the callBins was “cutoffs” for deletion = 0.5, loss = 1.2, gain = 2.5, amplification = 10. A blacklist of copy number changes repeated in the same regions in at least 10% of the samples was reported and removed from the final copy number data at 1x.
All clones were initially sequenced at low coverage (1x) and copy number changes were assessed by the QDNAseq algorithm. Clones were selected for deeper sequencing using one of the chromothripsis criteria15 namely the density of copy number changes (or breakpoints for the 30x data) set to 4. According to this, samples with more than four copy number changes (complex) per chromosome were good candidates for higher coverage sequencing. These samples were ranked for the highest number of chromosomes with more than 4 copy number changes and approximately the top 10% was sequenced at 30x.
We used both Ascat30 and Battenberg (https://github.com/cancerit/cgpBattenberg) to extract copy number data from 30x WGS. Ascat was used assuming ploidy of 4 for subclonal event identification and to overall enhance aberrations for easier data manipulation. Battenberg analysis was performed using ploidy of 2 which was consistent with the QDNAseq settings for direct comparison of the data from the two algorithms.
Event identification
Events were defined through regions with high density rearrangement breakpoints. A minimum of 4 breakpoints spaced 2Mb apart was identified as an event. The rest of the rules applied for the identification of the events were related to the propagation of the rearrangements. When one breakpoint of a rearrangement was part of an event while the second wasn’t because of the distance rules (above) applied, the two breakpoints were merged into the same event. When the breakpoints of the same rearrangement belonged to different events, they were merged into one event. To graphically distinguish between different events on our plots we annotated breakpoints of events using different shapes at the bottom tips of their breakpoints (Fig. 3e,f).
Rearrangement Calling and Chromothripsis
To call rearrangements we applied the BRASS (breakpoint via assembly) algorithm, which identifies rearrangements by grouping discordant read pairs that point to the same breakpoint event (github.com/cancerit/BRASS). Post-processing filters were applied to the output to improve specificity (blacklisted recurrent breakpoints in 10% of samples). Complex chromothripsis clusters were called according to the criteria from15. 1. A minimum of 4 breakpoints spaced 2Mb apart was considered an event of high density. 2. Oscillating copy number stages were mostly detected but non-conventional chromothripsis was also seen. 3. Multiple chromosomes retained loss of heterozygosity across chromosomes. 4. 1x WGS data analysis confirms prevalence of rearrangements. 5. The type of fragment joins in chromothripsis should be uniformly distributed. However, the chromothripsis events involve fairly low numbers of intra-chromosomal rearrangements, which would decrease power in a uniform multinomial distribution. 6. Ability to walk the derivative chromosome was not an applicable rule, as chromothripsis takes place on chromosomes with preceding duplication through BFBs31.
Another category of events identified during this study was the chromothripsis-like events, here as having <10 SVs but patterns consistent with chromothripsis. The original description of chromothripsis relied on statistical arguments to argue that the structural variants seen in such cases must have occurred in a single catastrophic event rather than by sequential rearrangements10 – these statistical arguments were later formalized into criteria for identifying chromothripsis15. Essentially, the key observation is that with simulations of sequential simple rearrangements, the overall number of observed copy number states in the chromosome tends to increase roughly in a logarithmic shape as the number of rearrangements increases. When we observe only 2 or 3 copy number states for a chromosome containing many tens of rearrangements, this is clearly well below the expected distribution of copy number states, and we have strong statistical evidence that at least some of the rearrangements were generated in a single catastrophic shattering event. The extent of breakage and relegation during a chromothripsis event clearly exists on a spectrum. While our statistical argument above satisfactorily handles the more extreme numbers of rearrangements (e.g., >8–10 breakpoints in a localized region with 2–3 copy number states), we do observe events with ~4–8 rearrangements that share the general patterns of chromothripsis – namely, 2–3 oscillating copy number states; alternating retention and loss of heterozygosity; balance of inverted and non-inverted rearrangements; and a solution that phases all rearrangements to a single derivative chromosome. However, due to the smaller number of rearrangements, it is possible to construct theoretical sequences of simple rearrangement types such as deletions, tandem duplications and reciprocal inversions that generate the observed data18. While we believe the sequential model of rearrangement is unlikely to have generated the events seen in the current study, largely because the frequency of simple structural variants in the rest of the genome of these clones is so low, we cannot formally exclude this with our usual statistical reasoning. We have therefore termed these events ‘chromothripsis like’.
Finally, local jumps seen mainly in TREX1 KO clones are defined according to a prior report18. Local jumps consist of an unbalanced translocation or large deletion with a locally-derived fragment inserted at the breakpoint. Local-distant jumps, deletions with a distant fragment from a different chromosome inserted. Both types of rearrangement were observed and grouped under the term “local jump.”
Kataegis
Kataegis mutation clusters were detected according to32 with modifications. Similar to the identification of events, mutations spaced ≤2 kb apart were treated as a single mutagenic event. Groups of closely spaced mutations (at least four mutations) were identified, such that any pair of adjacent mutations within each group was separated by less than 2 kb. To identify clusters that were unlikely to have formed by the random distribution of mutations within a genome, we computed a P value for each group. Each group with P ≤ 1. 10−4 was considered a bona fide mutation cluster. A recursive approach was applied, i.e., all clusters passing P-value filtering were identified, even if a cluster represented a subset within a larger group that did not pass the P-value filter.
A3A → CTCA or TTCA
A3B → ATCA or GTCA
TCA enrichment was calculated and significance was assessed using Fisher’s exact test
The enrichment of YTCA and RTCA was calculated and significance was assessed using chi-squared test based on the expected YTCA and RTCA.
Where ConTCA = TCA occurrences.
Enrichment of C→G and C→T mutations in the TCA context compared to other contexts and normalized it by how many times the motif occurs in the genome.
Statistical model for kataegis association with genotype
We found a statistically significant relationship when comparing APOBEC3B KO to T2p1 kataegis clusters by applying the negative binomial distribution to test how kataegis clusters are related to rearrangements across genotypes. Our Poisson regression model showed that APOBEC3B KO samples contain a high enough number of breakpoints expected to detect kataegis clusters. The same is not true for TREX1 KO samples.
Statistical analysis and reproducibility
Statistical analyses were performed using GraphPad Prism version 7.0d software. Descriptions of statistical tests are provided in the Figure legends.
Extended Data
Ext. Data Fig. 1.
Ext. Data Fig. 2.
Ext. Data Fig. 3.
Ext. Data Fig. 4.
Ext. Data Fig. 5.
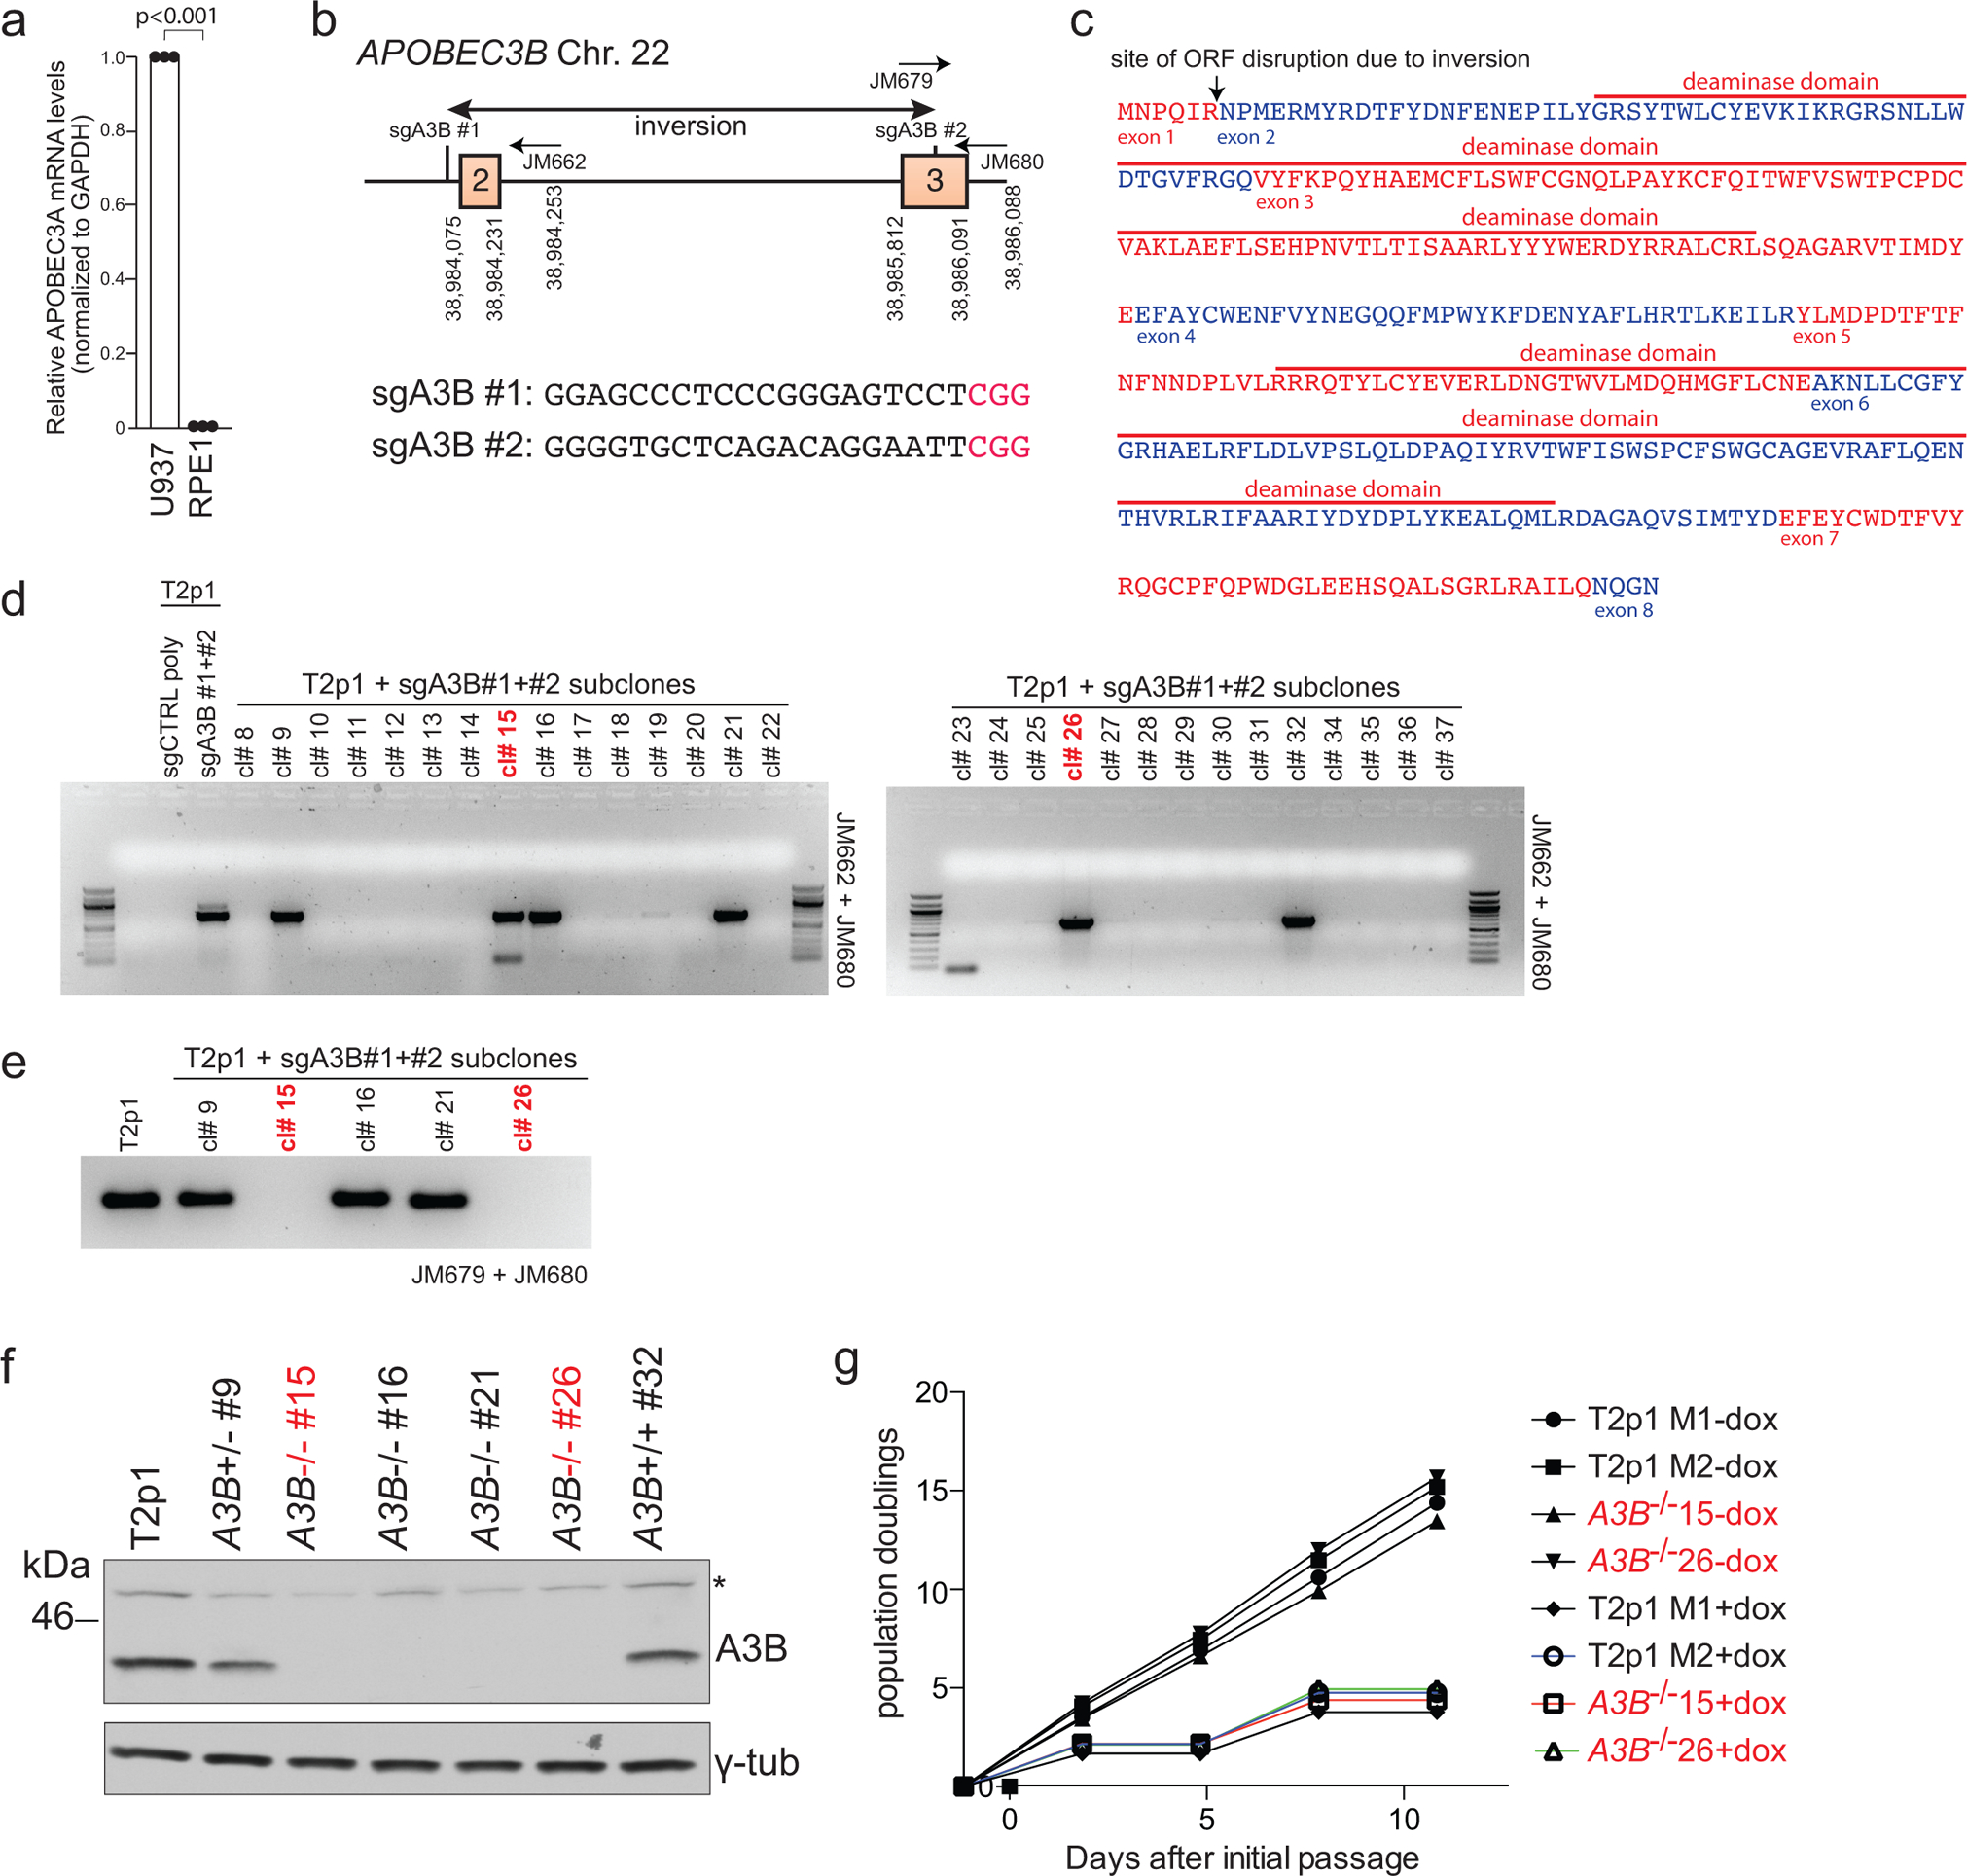
Ext. Data Fig. 6.
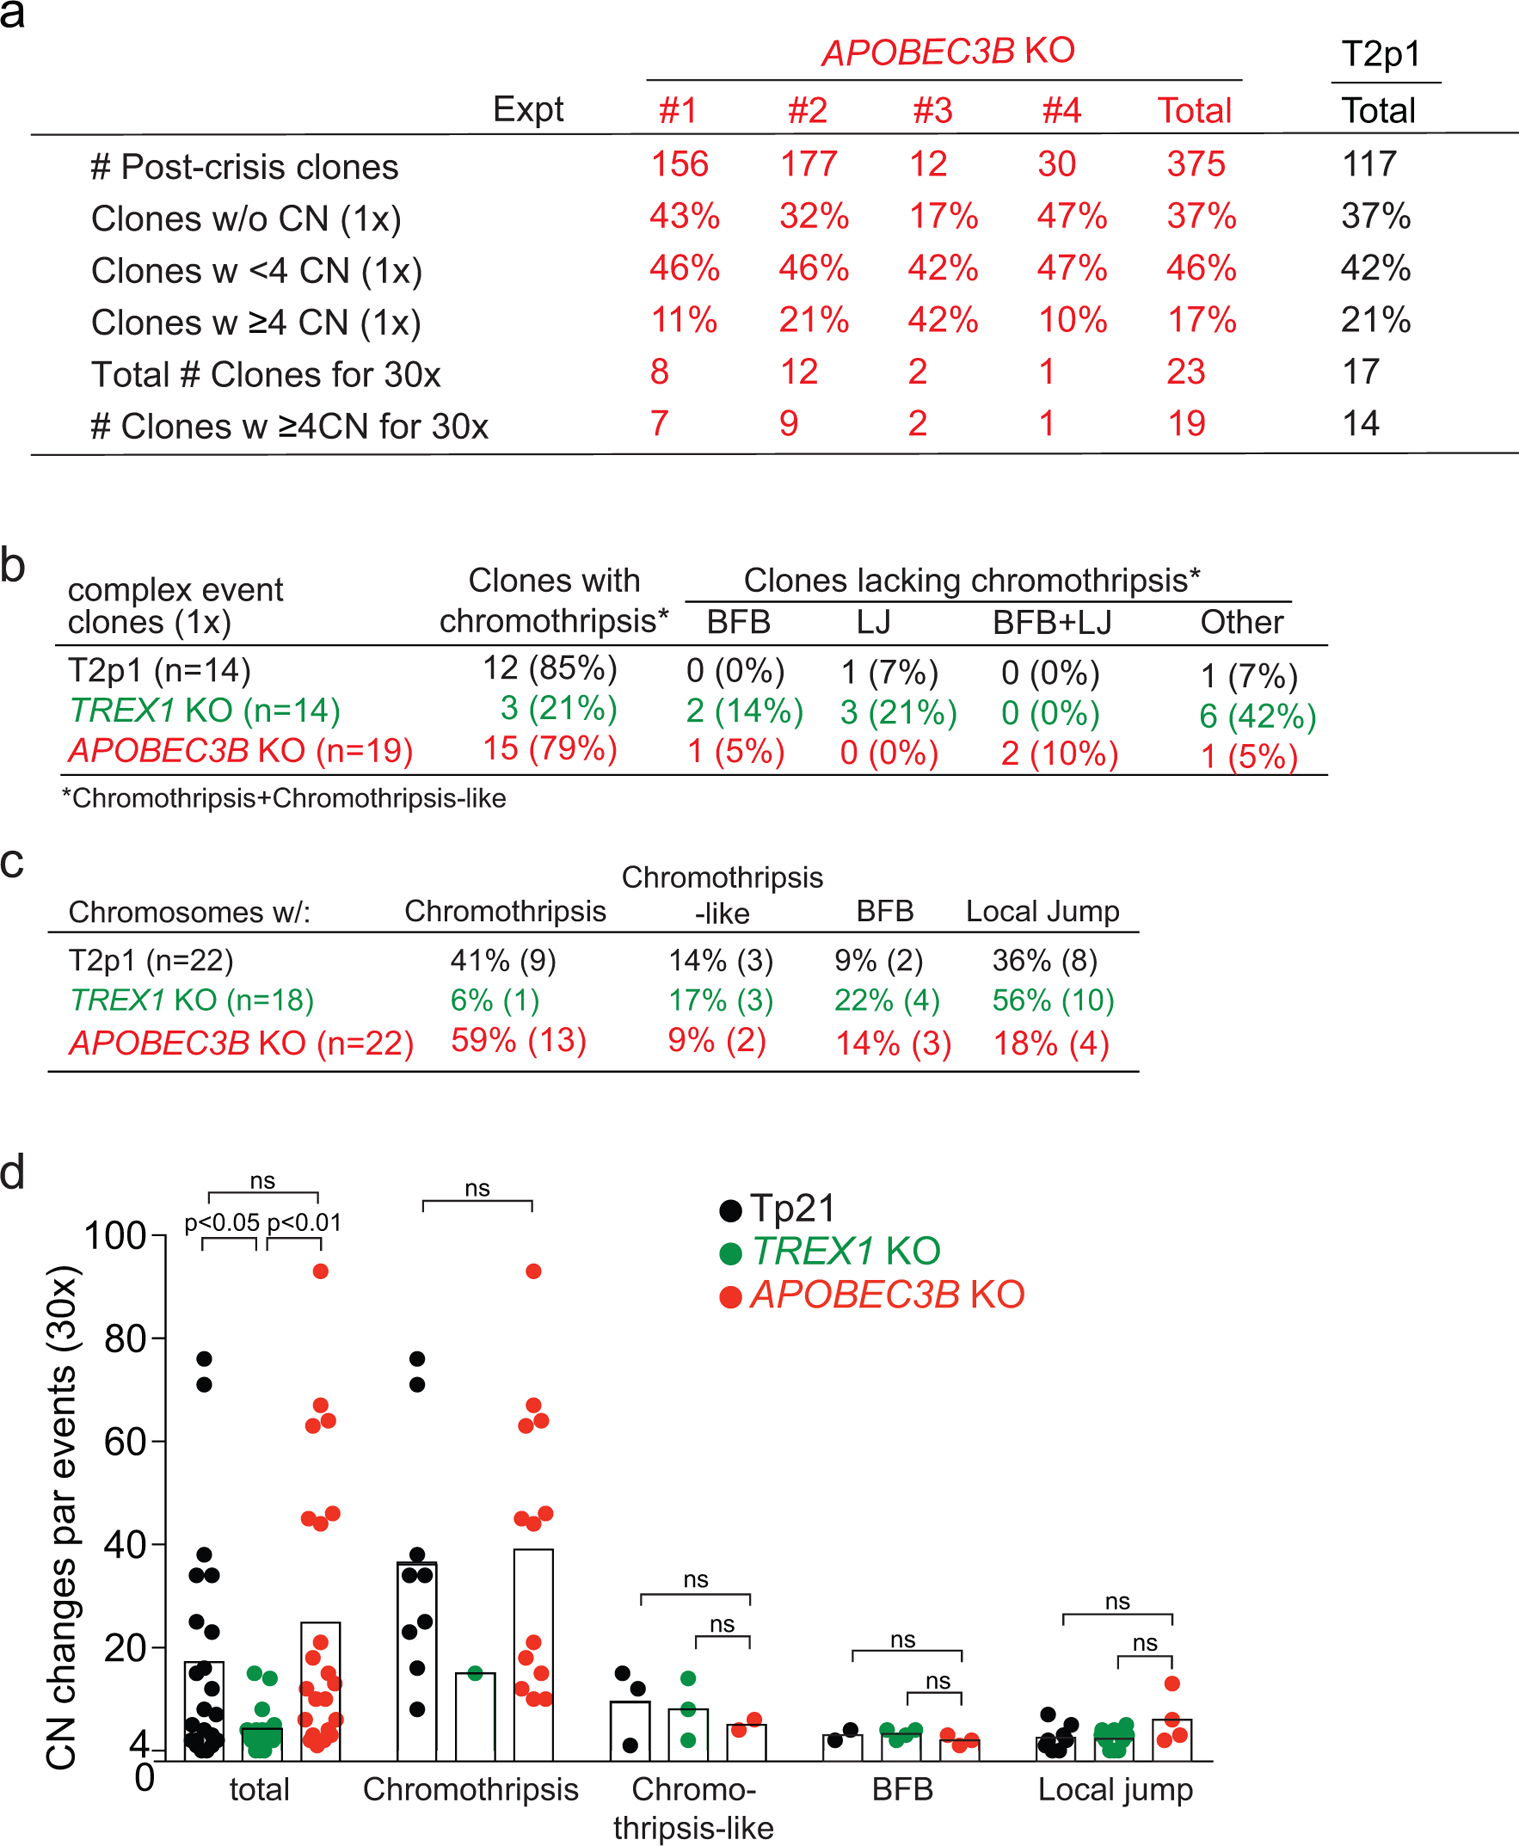
Supplementary Material
Acknowledgements
We thank Sally Dewhurst for insightful comments on this manuscript and Natalie Saini for generating the logo data. Research reported in this publication was supported by grants from the National Cancer Institute (R35CA210036), the Starr Cancer Consortium grant (I9-A9-047), and from the Breast Cancer Research Foundation to T.d.L. T.d.L. is an American Cancer Society Rose Zarucki Trust Research Professor. D.A.G. is supported by the NIH Intramural Research Program Project Z1AES103266. J.M. is supported by grants from the National Cancer Institute (R00CA212290), an MSK Cancer Center Support Grant/Core Grant (P30 CA008748), the Starr Cancer Consortium (I12-0030), the V Foundation for Cancer Research, and a Pew Biomedical Scholar Fellowship.
Footnotes
Data availability
All sequencing data pertaining to this project have been deposited in the European Nucleotide Archive database with the primary accession number PRJEB23723 [https://www.ebi.ac.uk/ena/data/search?query=PRJEB23723] and secondary accession number ERP105494 [https://www.ebi.ac.uk/ena/data/search?query=ERP105494]. All the other data supporting the findings of this study are available within the article and its supplementary information files and from the corresponding author upon reasonable request. Source data are provided with this paper.
Code availability
All code used in this study is available at the Wellcome Sanger Institute GitHub page (https://github.com/cancerit) or by request to the authors (A.C., P.J.C.).
Competing interests
T.d.L. is a member of the Scientific Advisory Board of Calico Life Sciences LLC (San Francisco, CA, USA). The other authors declare no competing interests.
Reporting summary
Further information on research design is available in the Nature Research Reporting Summary linked to this article.
References
- 1.Campbell PJ Telomeres and Cancer: From Crisis to Stability to Crisis to Stability. Cell 148, 633–635 (2012). [DOI] [PMC free article] [PubMed] [Google Scholar]
- 2.Mardin BR et al. A cell‐based model system links chromothripsis with hyperploidy. Mol Syst Biol 11, 828–828 (2015). [DOI] [PMC free article] [PubMed] [Google Scholar]
- 3.Maciejowski J & de Lange T Telomeres in cancer: tumour suppression and genome instability. Nat Rev Mol Cell Bio 18, 175–186 (2017). [DOI] [PMC free article] [PubMed] [Google Scholar]
- 4.Maciejowski J, Li Y, Bosco N, Campbell PJ & de Lange, T. Chromothripsis and Kataegis Induced by Telomere Crisis. Cell 163, 1641–1654 (2015). [DOI] [PMC free article] [PubMed] [Google Scholar]
- 5.Cleal K, Jones RE, Grimstead JW, Hendrickson EA & Baird DM Chromothripsis during telomere crisis is independent of NHEJ and consistent with a replicative origin. Genome Res 29, 737–749 (2019). [DOI] [PMC free article] [PubMed] [Google Scholar]
- 6.van Steensel B, Smogorzewska A & de Lange T TRF2 Protects Human Telomeres from End-to-End Fusions. Cell 92, 401–413 (1998). [DOI] [PubMed] [Google Scholar]
- 7.Fouquerel E et al. Targeted and Persistent 8-Oxoguanine Base Damage at Telomeres Promotes Telomere Loss and Crisis. Mol Cell 75, 117–130 (2019). [DOI] [PMC free article] [PubMed] [Google Scholar]
- 8.Xia Y et al. Rescue of DNA damage in cells after constricted migration reveals bimodal mechano-regulation of cell cycle. J. Cell Biol 218: 2545–2563 (2019) [DOI] [PMC free article] [PubMed] [Google Scholar]
- 9.Vietri M et al. Unrestrained ESCRT-III drives chromosome fragmentation and micronuclear catastrophe. Biorxiv 517011 (2019). doi: 10.1101/517011 [DOI] [PubMed] [Google Scholar]
- 10.Stephens PJ et al. Massive Genomic Rearrangement Acquired in a Single Catastrophic Event during Cancer Development. Cell 144, 27–40 (2011). [DOI] [PMC free article] [PubMed] [Google Scholar]
- 11.Nik-Zainal S et al. Mutational Processes Molding the Genomes of 21 Breast Cancers. Cell 149, 979–993 (2012). [DOI] [PMC free article] [PubMed] [Google Scholar]
- 12.Roberts SA et al. Clustered Mutations in Yeast and in Human Cancers Can Arise from Damaged Long Single-Strand DNA Regions. Mol Cell 46, 424–435 (2012). [DOI] [PMC free article] [PubMed] [Google Scholar]
- 13.Scheinin I et al. DNA copy number analysis of fresh and formalin-fixed specimens by shallow whole-genome sequencing with identification and exclusion of problematic regions in the genome assembly. Genome Res 24, 2022–2032 (2014). [DOI] [PMC free article] [PubMed] [Google Scholar]
- 14.Nik-Zainal S et al. The Life History of 21 Breast Cancers. Cell 162, 994–1007 (2015). [DOI] [PMC free article] [PubMed] [Google Scholar]
- 15.Nader GP et al. Compromised nuclear envelope integrity drivers tumor cell invasion. Biorxiv 110122 (2020). doi: 10.1101/2020.05.22.110122 [DOI] [PubMed] [Google Scholar]
- 16.Mohr L et al. ER-directed TREX1 limits cGAS recognition of micronuclei. Biorxiv 102103 (2020). Doi: 10.1101/2020.05.18.102103 [DOI] [Google Scholar]
- 17.Korbel JO & Campbell PJ Criteria for Inference of Chromothripsis in Cancer Genomes. Cell 152, 1226–1236 (2013). [DOI] [PubMed] [Google Scholar]
- 18.Bignell GR et al. Architectures of somatic genomic rearrangement in human cancer amplicons at sequence-level resolution. Genome Res 17, 1296–1303 (2007). [DOI] [PMC free article] [PubMed] [Google Scholar]
- 19.Rudolph K, Millard M, Bosenberg MW & DePinho RA Telomere dysfunction and evolution of intestinal carcinoma in mice and humans. Nat Genet 28, 155–159 (2001). [DOI] [PubMed] [Google Scholar]
- 20.Li Y et al. Patterns of structural variation in human cancer. Nature 578, 112–121 (2020). [DOI] [PMC free article] [PubMed] [Google Scholar]
- 21.Roberts SA et al. An APOBEC cytidine deaminase mutagenesis pattern is widespread in human cancers. Nat Genet 45, 970–976 (2013). [DOI] [PMC free article] [PubMed] [Google Scholar]
- 22.Alexandrov L et al. Signatures of mutational processes in human cancer. Nature 500, 415–421 (2013). [DOI] [PMC free article] [PubMed] [Google Scholar]
- 23.Kavli B, Otterlei M, Slupphaug G & Krokan HE Uracil in DNA—General mutagen, but normal intermediate in acquired immunity. DNA Repair 6, 505–516 (2007). [DOI] [PubMed] [Google Scholar]
- 24.Burns MB et al. APOBEC3B is an enzymatic source of mutation in breast cancer. Nature 494, 366–370 (2013). [DOI] [PMC free article] [PubMed] [Google Scholar]
- 25.Yousif F et al. The Origins and Consequences of Localized and Global Somatic Hypermutation. Biorxiv 287839 (2018). doi: 10.1101/287839 [DOI] [Google Scholar]
- 26.Umbreit NT et al. Mechanisms generating cancer genome complexity from a single cell division error. Science April 17;368(6488) (2020). [DOI] [PMC free article] [PubMed] [Google Scholar]
- 27.Refsland EW et al. Quantitative profiling of the full APOBEC3 mRNA repertoire in lymphocytes and tissues: implications for HIV-1 restriction. Nucleic Acids Res 38, 4274–4284 (2010). [DOI] [PMC free article] [PubMed] [Google Scholar]
- 28.Li H & Durbin R Fast and accurate long-read alignment with Burrows–Wheeler transform. Bioinformatics 26, 589–595 (2010). [DOI] [PMC free article] [PubMed] [Google Scholar]
- 29.Jones D et al. cgpCaVEManWrapper: Simple Execution of CaVEMan in Order to Detect Somatic Single Nucleotide Variants in NGS Data. Curr Protoc Bioinform 56, 15.10.1–15.10.18 (2016). [DOI] [PMC free article] [PubMed] [Google Scholar]
- 30.Loo P et al. Allele-specific copy number analysis of tumors. Proc National Acad Sci 107, 16910–16915 (2010). [DOI] [PMC free article] [PubMed] [Google Scholar]
- 31.Li Y et al. Constitutional and somatic rearrangement of chromosome 21 in acute lymphoblastic leukaemia. Nature 508, 98–102 (2014). [DOI] [PMC free article] [PubMed] [Google Scholar]
- 32.Chan K et al. An APOBEC3A hypermutation signature is distinguishable from the signature of background mutagenesis by APOBEC3B in human cancers. Nat Genet 47, 1067–1072 (2015). [DOI] [PMC free article] [PubMed] [Google Scholar]
Associated Data
This section collects any data citations, data availability statements, or supplementary materials included in this article.


