

Abstract
Background:
Identifying separate dimensions of concussion symptoms may inform a precision medicine approach to treatment. It was previously reported that a bifactor model identified distinct acute post-concussion symptom dimensions.
Purpose:
Replicate prior findings of a bifactor structure of concussion symptoms in the Concussion Assessment Research and Education (CARE) Consortium sample, examine measurement invariance from pre- to post-injury, and evaluate whether factors are associated with other clinical and biomarker measures.
Study Design:
Prospective, cross-sectional
Methods:
Collegiate athletes were prospectively evaluated with the Sport Concussion Assessment Tool −3 (SCAT-3) during pre-season (N=31,557); 2,789 were followed at <6hr and/or 24-48hrs post-concussion. Item-level SCAT-3 ratings were analyzed through exploratory and confirmatory factor analyses. Bifactor and higher-order models were compared based on their fit and interpretability. Measurement invariance tested the stability of the identified factor structure across time. The association between factors and criterion measures (clinical and blood-based markers of concussion severity, symptom duration) were evaluated.
Results:
The optimal structure for each timepoint was a seven-factor bifactor model, with a General factor on which all items loaded and six specific factors reflecting Vestibulo-ocular, Headache, Sensory, Fatigue, and Emotional symptoms. The model manifested strict invariance across the two post-injury timepoints but only configural invariance from baseline to post-injury. From <6 to 24-48 hours, some dimensions increased in severity (Sensory, Fatigue, Emotional) while others decreased (General, Headache, Vestibulo-ocular). The factors correlated with differing clinical and biomarker criterion measures and showed differing patterns of association with symptom duration at different timepoints.
Conclusions:
Bifactor modeling supported the predominant unidimensionality of concussion symptoms, while also revealing multidimensional properties, including a large dominant General factor and six independent specific factors comprising Headache, Vestibulo-ocular, Sensory, Cognitive, Fatigue, and Emotional symptoms. Unlike the widely used SCAT-3 symptom severity score, which declines gradually after injury, the bifactor model revealed separable symptom dimensions that have distinct trajectories in the acute post-injury period and different patterns of association with other markers of injury severity and outcome.
Clinical Relevance:
The SCAT-3 total score remains a valuable, robust index of overall concussion symptom severity, and the specific factors identified may also inform management strategies. Because some symptom dimensions continue to worsen in the first 24-48 hours post-injury (i.e., Sensory, Fatigue, Emotional), routine follow-up in this timeframe may be valuable to ensure that symptoms are managed effectively.
Keywords: Clinical phenotypes, Invariance modeling, Sport-related concussion, CARE Consortium, Bifactor model, Blood biomarkers
Social Media Summary:
Study from the Care Consortium shows concussion symptom phenotypes correlate with symptom recovery and objective measures of balance, cognition, and serum biomarkers.
Introduction
Athletes’ experiences of post-concussive symptoms often consist of diverse symptoms that can range in severity. Clinical presentations often comprise nebulous combinations of cognitive, emotional, somatic, and other types of symptoms. There has been increasing interest in identifying separable dimensions or features of concussion symptoms (i.e., clinical phenotypes) that might inform mechanistic and treatment research.2, 25, 27, 36, 37, 39, 44, 45, 50, 53, 54 For example, identifying distinct symptom dimensions could allow for better understanding of acute injury presentations,6, 15 recovery trajectories (i.e., prolonged recovery),44, 45,49 and outcomes,21 or could lead to the validation of targeted precision medicine treatment management approaches (e.g., for athletes presenting with relatively more cognitive versus emotional symptoms).14
Prior attempts to identify symptom dimensions, however, have not yielded highly interpretable or replicable results. Specifically, efforts to model the symptom dimensions using factor analysis and related analytic techniques have yielded models with poor fit and dimensions that were not statistically or conceptually distinguishable. In particular, symptom dimensions (factors) identified have been highly correlated, contained items that loaded on multiple factors, or showed other evidence of a dominant primary factor,2, 25, 27, 37, 39, 44, 45, 50, 53, 54 conflicting with the hypothesis that concussion symptoms are multidimensional in nature.
We recently posited that prior findings may suggest a novel bifactor structure that simultaneously accounts for a prominent general factor in concert with multidimensional features of concussion symptoms. Specifically, in a sample of 219 high school and collegiate athletes tested with the Sport Concussion Assessment Tool—3 (SCAT-3) symptom checklist at 24–48 hours of concussion, a bifactor model best accounted for the relationships between acute concussion symptoms while also providing strong preliminary evidence of clinical utility (i.e., differing patterns of association between factors and clinical criterion measures).42
Bifactor models differ from conventional correlated-factor models in that, in a bifactor model, a general factor directly influences ratings on each item (symptom), while independent specific factors account for residual covariance among items unrelated to the general factor. In other words, symptom endorsement may be influenced by both a dominant severity dimension (“general concussion symptoms”) and more specific, independent factors. In this previous sample, the strong general factor accounted for 96% of reliable variance in observed symptom severity scores, while four specific factors characterized by emotional, torpor (e.g., fatigue), sensory sensitivity, and headache symptoms also helped explain the multidimensional symptom structure. The presence of a strong general factor is consistent with the notion that the SCAT-3 is largely unidimensional, implying that the common clinical practice to compute and interpret the symptom severity score is appropriate. Additionally, multidimensionality represented in the subfactors indicated that, although accounting for smaller proportions of variance in symptom ratings, distinct dimensions may incrementally improve upon the characterization of concussion symptom expression such that taking each into account may inform clinical management in the future.
A strength of the aforementioned study was the development and formal comparison of a variety of structural models, including more typical correlated-factor models and lesser-used bifactor models. However, given the prior study’s relatively small, homogenous sample (mostly male football players) and focus on one post-injury timepoint (24–48 hours), this model should be cross-validated in a larger, more diverse sample and extended to other times in the pre- and post-injury period. Testing the applicability of a factor model across time or groups can be done with factorial invariance modeling. Measurement invariance (equivalence in model parameters such as loadings and intercepts) indicates that a scale measures the same constructs across time/groups and that interpretation of differences in the underlying factors may be direct and are appropriate.29 Test users who compare total scores from pre- to post-injury make the implicit assumption that the test measures the same thing across time, yet this assumption can be formally tested through invariance modeling.
In order to establish measurement invariance, one tests four increasingly stringent assumptions about the equivalence of factor model parameters across time. Violations of each level of invariance have different implications and can yield important insights into the nature of constructs and their measurement. Readers are encouraged to review other published works for detailed discussion of violations of these types of invariance and their implications.46 As an example, Galenkamp et.19 found that the 12-item Short Form Survey (SF)-12 of health-related quality of life met criteria for strict invariance across age, sex, and education level groups, indicating that the constructs assessed by the SF-12 are sufficiently comparable to support valid interpretation of group mean differences for these variables as reflecting differences in these constructs as opposed to reflecting biased model parameters (e.g., across sex). However, the SF-12 manifested only configural invariance across various ethnic groups. For example, the loading of an item about feeling calm and peaceful differed across ethnicities, suggesting that feeling calm and peaceful does not have the same relationship to mental functioning across ethnic groups and, therefore, using this item to measure the construct of mental functioning could conflate the degree to which group differences in mental functioning scores are due to mental functioning versus other cultural factors.
The objective of this study was to leverage the recent availability of a large prospective sample of athletes with sport-related concussion (derived from the Concussion Assessment, Research, and Education [CARE] Consortium) to (1) cross-validate the bifactor model of the SCAT-3 within a national, prospective sample of collegiate athletes, (2) determine the degree to which the model is invariant from pre-injury to acutely post-injury, and (3) to investigate the association between factors in the established model with criterion indices of concussion severity and outcome. Based on the fact that a discrete event (concussion) is likely to alter the causes of symptom ratings from pre- to post-injury, alongside prior findings of discrepant factor structures across time,2, 27 we hypothesized that the SCAT-3 would not show invariance from pre- to post-injury. Across post-injury timepoints, we predicted strong or strict invariance of the model. Exploratory analyses of the model’s associations with clinical measures aimed to provide preliminary findings regarding the symptom dimensions’ validity and clinical utility.
Method
Participants
This project used data from the CARE Consortium study (CARE 1.0; starting in January 2014 with enrollment ending in May 2018). Participants provided informed consent following approval by the Medical College of Wisconsin institutional review board (IRB) and the Human Research Protection Office (HRPO). Study methodology has been described in a prior publication.7 To summarize, CARE prospectively recruits collegiate athletes from 26 National Collegiate Athletic Association Division I-III schools and four service academies, enrolling and baseline testing participants in the pre-season and following concussed participants serially post-injury. This study included data on all athletes with available baseline exam data from CARE 1.0 (N = 31, 557) and those athletes who subsequently sustained a diagnosed concussion (n = 2,789; Table 1). (Data were retrieved March, 2019.) The baseline sample was 63.1% male and 71.9% white (12.4% black, 7.2% biracial), with age M = 19.20 (SD = 1.43) years. Participants represented a wide variety of sports, most commonly football (14.0%), cross-country/track (8.3%), soccer (7.1%), baseball (4.7%), rowing/crew (4.6%), and basketball (4.2%). The post-injury sample was comparable in demographics: 60.8% male, predominantly white (66.9%; 16.7% black, 8.8% biracial), and age M = 18.95 (SD = 1.25) years.
Table 1.
Demographics and medical history reported at pre-season baseline exams for the sample evaluated at baseline and subsample evaluated after concussion
| Baseline (N=31,557) | Post-injury (n=2,789) | |
|---|---|---|
| Age | 19.22 (1.44) | 18.95 (1.25) |
| Sex (female) | 11,583 (36.7%) | 1,134 (40.7%) |
| Race | ||
| White | 22,839 (73.4%) | 2021 (67.1%) |
| African American | 3,806 (12.1%) | 509 (16.9%) |
| Biracial | 2,238 (7.1%) | 256 (8.5%) |
| Asian | 1,351 (4.3%) | 95 (3.2%) |
| Unknown/Left blank | 687 (2.2%) | 94 (3.1%) |
| Other (listed at <1%) | 636 (2.0%) | 35 (1.2%) |
| Previous concussion | ||
| 0 | 2,4152 (78.0%) | 1665 (61.0%) |
| 1 | 5,222 (16.9%) | 749 (27.4%) |
| 2+ | 1,594 (5.1%) | 317 (11.6%) |
| Attention deficit/hyperactivity disorder | 1,617 (5.1%) | 200 (7.2%) |
| Learning disability | 649 (2.1%) | 93 (3.3%) |
| Psychiatric disorder | 738 (2.3%) | 78 (2.8%) |
| Sport | ||
| Football | 4,183 (13.3%) | |
| Cross-country/track | 2,758 (8.7%) | |
| Soccer | 2,122 (6.7%) | |
| Swimming | 1,571 (5.0%) | |
| Rowing/Crew | 1,540 (4.9%) | |
| Baseball | 1,510 (4.8%) | |
| Basketball | 1,264 (4.0%) | |
Mean (SD)
Measures
The SCAT35 symptom checklist was developed through consensus by the Concussion in Sport Group (CISG) to standardize the assessment of sports-related concussion. The SCAT-3 symptom checklist (referred to herein as the SCAT/SCAT-3) comprises 22 items for self-report of common concussive symptoms. Each item is rated on a seven-point scale from 0 = none to 6 = severe (total score range 0–132).33–35 Evidence is fairly limited regarding the psychometric properties of the SCAT3.13, 47 In the current sample, the SCAT-3 was administered at four time points: Baseline (T1), Immediate Post-Injury (< 6 hours, T2), 24-48 hours Post-Injury (T3), and when the return to play protocol was initiated (T4). The return to play protocol broadly involved a graded exertion progression put forth by the CISG (mild variability across provided in terms of clinical practice), and was initiated based on initiated based upon the individual athlete’s needs.5, 33
Other concussion-related assessment tools administered included the Standardized Assessment of Concussion (SAC),32 the Balance Error Scoring System (BESS),20 the 18-item Brief Symptom Inventory (BSI-18),16 12-item Short Form Health Survey (SF-12), and the Immediate Post-Concussion and Cognitive Testing (ImPACT)23 neurocognitive battery. Select blood biomarkers that have been previously linked to neurobiological effects of head injury were collected at T2 and T3 in a smaller group of subjects involved in the Advanced Research Core of CARE. Glial fibrillary acidic protein (GFAP), neurofilament light chain (NF-L), total tau, and ubiquitin carboxy-terminal hydrolase L1 (UCH-L1) have been observed as being associated with the presence of concussion and clinical signs of more severe. As such, finding associations between symptom dimensions and objective markers of concussion was considered informative for two reasons: (a) it would support any symptom dimensions identified as reflecting concussion sequelae (vs. method variance as can occur in bifactor modeling), (b) it would provide preliminary insight into the clinical and pathophysiological underpinnings of unique symptom dimensions.4 Blood biomarker analysis is described elsewhere.31 Only the SCAT-3 symptom checklist, SAC, and BESS were administered at T2, while all measures were administered at T1, T3, and T4. Duration of self-reported symptoms (in days) was collected as the primary index of clinical recovery (i.e., post-injury to T4).
Analytic Approach
Factor analyses.
Analyses were performed in Mplus (version 8)41 and IBM SPSS Statistics (version 24; Armonk, NY). We first tested the fit of a previously reported bifactor model of acute mTBI symptoms42 using confirmatory factor analyses (CFA) at each timepoint. Because the model did not meet acceptable fit criteria in cross-sectional analyses at timepoints other than T3, we then performed, on a random half of the sample, exploratory factor analyses (EFAs) and exploratory bifactor analyses (bi-EFA) of SCAT-3 item ratings at each time point separately for T1–T4. Models were specified using robust maximum likelihood (MLR) estimation and Geomin rotation, an oblique rotation method. On the second random half the sample, CFAs were conducted for models suggested by EFA at each point, balancing EFA fit indices and interpretability. As described below, modeling of the T4 data was abandoned, because no models evaluated at T4 achieved reasonable fit (likely due to limited endorsement of symptoms at this timepoint). To provide comparable absolute fit statistics across model types, higher-order models were also developed that were nested within each bifactor model. In accordance with commonly used conventions, we considered fit to be good if the root mean square error of approximation (RMSEA) was < .06 (and acceptable if < .08) and both the comparative fit index (CFI) and Tucker-Lewis index (TLI) were > .95.22 Models were preferred that evinced lower magnitude information-theoretic fit criteria (i.e. Bayesian information criterion [BIC], Akaike information criterion [AIC]) while retaining acceptable absolute and relative fit. In order to assess degree of unidimensionality of the SCAT-3 (i.e., variance in observed total scores attributable to individual differences on the general factor), Omega Hierarchal (OmegaH) estimates were calculated at each time point for the best fitting model. The previously established cutoff of OmegaH (>.80) was used to declare essential unidimensionality.48
Measurement invariance analyses.
Longitudinal measurement invariance analyses were used to determine the level of invariance of the best fitting model across time. Measurement invariance testing involves testing several models, each imposing increasing constraints on the equivalence of various model parameters. In a configural invariance model, each indicator is specified as loading on the same respective factor over time. The means of the latent variables (i.e., factors) are fixed to zero in order to identify the model, and factors cannot be interpreted in the same way over time because they account for different proportions of variance in each of the item indicators. The weak invariance model adds to the configural model constraints that the loadings of items on the factors are equivalent over time. Here, the same proportions of variance in each of the items are accounted for by each of the factors over time, but, because their endorsement parameters are allowed to vary, weak invariance does not allow for direct interpretation of factor changes. The strong invariance model adds to the weak invariance model the constraint of equivalent item thresholds between each item response option across time. The strong invariance model implies that changes in item responses over time are accounted for by changes at the factor level of those respective indicators. Finally, strict invariance model further specifies that item residual variances are equivalent across time. If supported by the data, strict invariance indicates that differences in item parameters (i.e., means, variance, covariance) are entirely attributable to changes in the factor means over time while remaining variance unaccounted for by factors are also equal across time points.
If imposing more stringent constraints increasing levels of invariance does not substantially reduce model fit, one may conclude that these constraints have been appropriately applied. Evaluation of decrements in model fit included a priori consideration of invariance models’ change in CFI and RMSEA with increasing constraints. Decreases in model fit by more than 0.01 in CFI12 or 0.015 in RMSEA11 were deemed evidence that the parameter constraints could not be imposed. If strong or strict invariance was obtained, then model-estimated latent factor means across time points could be compared in terms of standardized (z-score) units. If only configural or weak invariance was demonstrated, the factors would not be interpreted the same way over time and would therefore not be directly comparable.
Factors, Clinical Measure Correlations, and Symptom Duration
Where appropriate based on longitudinal invariance modeling findings, model-estimated factor levels from the best fitting model were correlated with criterion clinical measures. To account for measurement error in the SCAT-3 symptom dimensions, these were run in a structural equation modeling (SEM) latent variable modeling framework, with each external correlate as the dependent variable in a separate linear regression model (stratified by timepoint), and the seven factors for that timepoint entered simultaneously as independent variables. Blood biomarkers were natural log-transformed to reduce skew. Because of the significant right skew in the outcome variable (symptom duration in days), the predictive value of the factor scores on this outcome were assessed using negative binomial regression models (one per timepoint) where estimated factor scores for all factors were entered simultaneously as independent variables. Cox proportional hazards modeling of this time-to-event outcome was considered but not used because of substantial violations of the proportional hazards assumption.
Results
Cross-Validation of the Bifactor Model of SCAT-3 Symptoms
EFA and bi-EFA were performed on a random half of the sample at each time point. Absolute and relative fit statistics indicated that a 6-factor higher-order and 7-factor bifactor model best fit the SCAT’s structure cross-sectionally for T1, and T2 and T3, respectively. Adequate fit was not established for T4 (at best, CFI=.887 and TLI=.726), possibly due to low symptom endorsement at this time point; SCAT-3 symptom severity M (SD) T1=4.88 (8.62), T2=25.06 (21.31), T3=23.90 (21.85), T4=2.01 (5.43). Therefore, all subsequent analyses focused only on T1–T3.
Fit statistics for higher-order and bifactor CFA models are presented in Table 2. The 7-factor bifactor models were the best fitting according to BIC and retained good absolute fit (e.g., RMSEA ≤ 0.05). At T1, EFA suggested a 7-factor bifactor model that slightly varied from that indicated for T2 and T3 (i.e., “nausea” loaded on the Vestibulo-ocular factor at T1 but not other time points; “confusion” did not load on Cognitive at T1). In an attempt to achieve at least configural invariance across T1-T3, the 7-factor bifactor model with the greatest consistency across T1-T3 (i.e., the T2-T3 model) was selected for invariance modeling (Figure 1).
Table 2.
Fit statistics for confirmatory factor (CFA) models suggested by exploratory factor (EFA) models of each time point
| Model | −2LL | k | AIC | BIC | RMSEA | CFI | TLI |
|---|---|---|---|---|---|---|---|
| T1: Pre-injury baseline | |||||||
| 1-factor model | −257839 | 66 | 555809 | 556320 | .051 (.050-.052) | .734 | .706 |
| 6-factor correlated factor | −264269 | 81 | 528700 | 529327 | .030 (.029-.031) | .915 | .898 |
| 6-factor correlated factor HO | − 257794 | 72 | 529619 | 530176 | .030 (.029-.031) | .909 | .897 |
| 7-factor bifactor | −262792 | 78 | 525740 | 526343 | .026 (.025-.027) | .934 | .923 |
| 7-factor bifactor (T2/T3 model) | − 257794 | 77 | 532876 | 533471 | .034 (.034-.035) | .886 | .867 |
| 6-factor correlated factor (nested within T2/T3 bifactor) | −264087 | 69 | 528313 | 528847 | .029 (.028-.030) | .918 | .908 |
| T2: Immediate post-injury | |||||||
| 1-factor model | −34301 | 68 | 68739 | 69265 | .019 (.018-.020) | .770 | .748 |
| 6-factor correlated factor | − 25768 | 77 | 52754 | 53112 | .060 (.056-.065) | .908 | .893 |
| 6-factor correlated factor HO | − 25768 | 72 | 52857 | 53191 | .063 (.059-.068) | .896 | .882 |
| 7-factor bifactor (T2/T3 model) | − 25767 | 79 | 52465 | 52832 | .048 (.043-.053) | .942 | .932 |
| 7-factor bifactor (T1 model) | − 25768 | 78 | 52667 | 53030 | .057 (.052-.062) | .918 | .904 |
| 6-factor correlated factor (nested within T2/T3 bifactor) | −26246 | 69 | 52630 | 52950 | .054 (.050-.059) | .922 | .913 |
| T3: 24–48 hours post-injury | |||||||
| 1-factor model | −44986 | 68 | 90108 | 90634 | .023 (.023-.024) | .788 | .767 |
| 6-factor correlated factor | − 35750 | 80 | 73032 | 73436 | .055 (.051-.059) | .931 | .919 |
| 6-factor correlated factor HO | − 35750 | 71 | 73151 | 73510 | .057 (.053-.060) | .924 | .914 |
| 7-factor bifactor (T2/T3 model) | −36344 | 79 | 72846 | 73245 | .050 (.046-.054) | .943 | .933 |
| 7-factor bifactor (T1 model) | − 35750 | 78 | 73035 | 73428 | .055 (.051-.059) | .931 | .919 |
| 6-factor correlated factor (nested within T2/T3 bifactor) | −36482 | 69 | 73103 | 73451 | .055 (.052-.059) | .927 | .918 |
Note. HO, higher-order model (where lower-order correlated factors are subsumed under a second-order general factor). CFA models were run on a separate half of the dataset from those used to establish EFA models. AIC = Akaike information criterion; BIC = Bayesian information criterion; CFI = comparative fit index; k = number of free model parameters; LL = loglikelihood; RMSEA = root mean square error of approximation; TLI = Tucker-Lewis index
Figure 1.
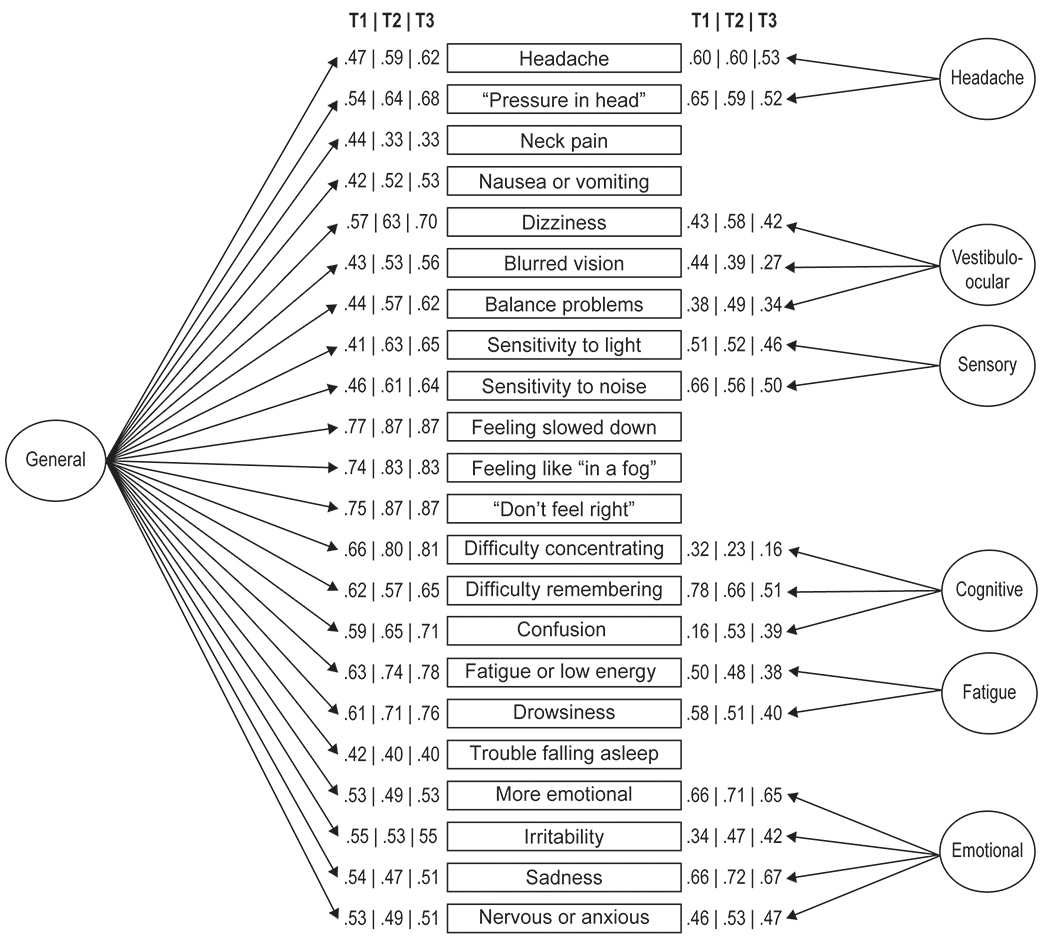
7-factor bifactor model submitted for invariance testing derived from the Sport Concussion Assessment Tool-3 symptom ratings. Factor loadings for the bifactor model at T1, T2, and T3 are represented.
Measurement Invariance Analyses
Table 3 depicts the absolute and relative fit statistics for invariance models run on the T1–T3 data, using the model depicted in Figure 1. Configural invariance was achieved for the 7-factor bifactor model across T1–T3, as suggested by the absolute fit of the configural invariance model, RMSEA = .015, CFI = .937, TLI = .926. However, weak invariance was not supported for T1–T3 due to reduced CFI of .025 and higher BIC relative to the configural model. Consequently, we explored the possibility of a partial invariance model with configural invariance from T1 to T2 and weak, strong, and strict invariance across T2–T3. T1 model parameters were freely estimated while equivalence of loadings, thresholds, and residual variances for items was tested across the latter two time points. The 7-factor bifactor model met criteria for strict invariance across T2 and T3. Absolute fit of this partial strict invariance model was very good (RMSEA = .016; CFI = .932, TLI = .923). This indicates that the General and specific SCAT-3 factors fully account for changes in SCAT-3 ratings from T2–T3 and therefore that mean differences are interpretable as reflecting changes in what is represented by each factor for these acute post-injury points.
Table 3.
Fit statistics for measurement invariance of the 7-factor bifactor model of the Sport Concussion Assessment Tool—across baseline (T1), immediate post-injury (T2), and 24–48-hours post-injury (T3) time points
| −2LL | k | BIC | RMSEA | ΔRMSEA | CFI | ΔCFI | TLI | |
|---|---|---|---|---|---|---|---|---|
| T1-T3 Configural | −649122 | 449 | 1302931 | .015 | -- | .937 | -- | .926 |
| T1-T3 Weak | −652797 | 387 | 1309633 | .017 | .002 | .917 | −.025 | .906 |
| T1 Config., T2-T3 Weak | −649275 | 421 | 1302944 | .015 | .000 | .936 | −.001 | .926 |
| T1 Config., T2-T3 Strong | −649562 | 406 | 1303361 | .015 | .000 | .934 | −.002 | .925 |
| T1 Config., T2-T3 Strict | −650044 | 384 | 1304097 | .016 | .001 | .932 | −.002 | .923 |
Note. Invariance models were run on the full sample. Partial invariance models included T1 for configural invariance (“T1 Config.”) across all 3 timepoints but only equated loadings, thresholds, and residual variances for T2 and T3. BIC = Bayesian information criterion; CFI = comparative fit index; k = number of free model parameters; LL = loglikelihood; RMSEA = root mean square error of approximation; TLI = Tucker-Lewis index
Figure 2 depicts estimated latent mean change over time in factors from T2–T3 (T1 factor means cannot be directly compared to other timepoints given the lack of at least strong invariance for T1 versus other timepoints). In Mplus, mean change over time is reflected as factor standard deviation units for T3 relative to the reference category (“0”), T2. Higher factor scores are indicative of greater difficulty within that domain (e.g., higher cognitive factor indicates greater difficulty with cognitive functioning). As expected, the General factor (which most directly aligns with observed SCAT-3 symptom severity scores) significantly decreased in magnitude from Immediate Post-Injury to 24–48 Hours Post-Injury (p < .001). The following specific factors also significantly decreased in magnitude across this time interval: Headache (p < .001) and Vestibulo-ocular (p < .001). Interestingly, the Cognitive factor showed no significant change across this time interval (p = .382), while the other three symptom dimensions increased in magnitude: Sensory (p < .001), Fatigue (p < .001), and Emotion (p = .001). OmegaH for the General factor ranged from ΩH = .86 - .89 across T1-T3.
Figure 2.
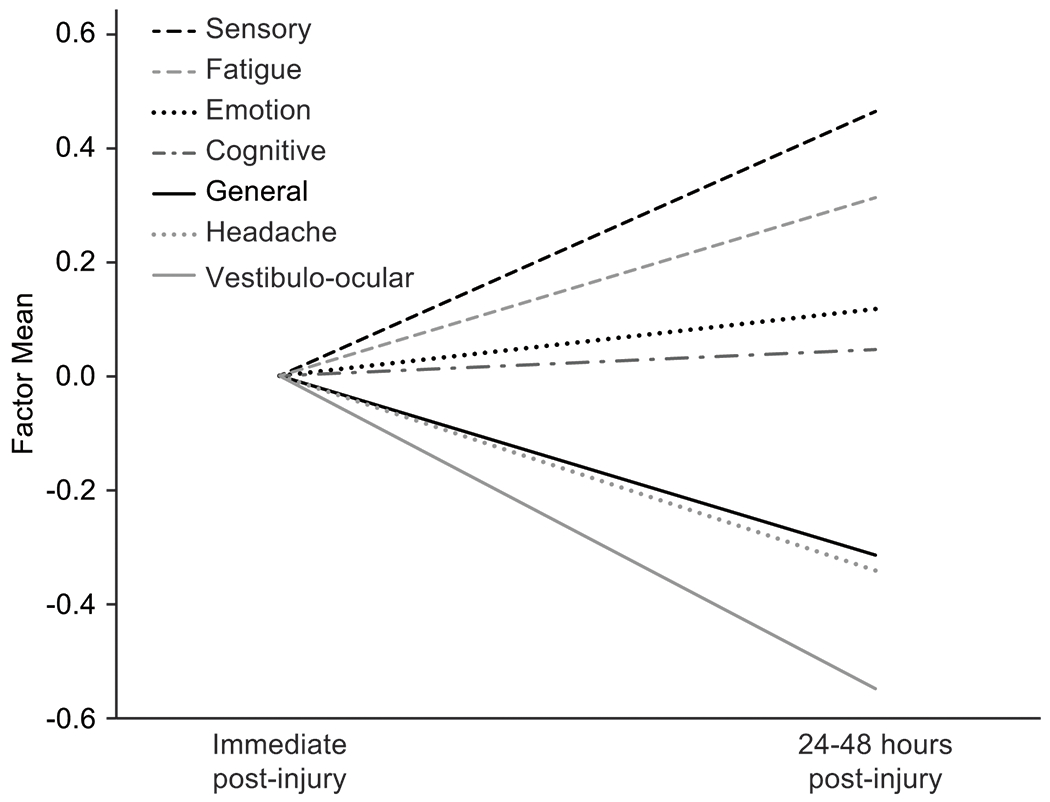
Changes in factor means from immediate post-injury (T2) to 24-48 hours post-injury (T3). T2 factor means are arbitrarily set to 0; T3 units reflect factor standard deviation units relative to T2.
External Correlates of Bifactor Model Dimensions
Table 4 presents correlations between SCAT-3 factors and criterion measures (assessed concurrently) at each wave of assessment. The Emotional subfactor demonstrated significant associations with analogous measures of psychological symptoms/function: BSI-18 Global Severity Index (r = .35 to .39) and the SF-12 Mental Component Score (r = −.43 to −.44). The SAC showed consistent significant associations with the cognitive subfactor (r = −.07 to − .25), at T2 and T3, with the strongest association observed at the most acute post-injury timepoint.
Table 4.
Correlations of factor scores and clinical outcome measures assessed cross-sectionally
| General | Headache | Vestibulo-ocular | Sensory | Cognitive | Fatigue | Emotion | |
|---|---|---|---|---|---|---|---|
| Baseline | |||||||
| BSI GSI | .62** | .02 | −0.04 | −0.02 | .05* | .04 | .35** |
| SF-12 PCS | .04 | −.06 | −0.08 | 0.06 | −.01 | .04 | 0.12 |
| SF-12 MCS | −.54** | .03 | 0.03 | 0.02 | −.06 | .07 | −.44** |
| SAC Total Score | .02 | −.04 | <.01 | <.01 | −.06** | .08** | 0.02 |
| BESS Total Score | .08** | −.05* | 0.04 | −0.01 | −.01 | .10** | −0.04 |
| ImPACT Verbal Memory | .03 | <−.01 | 0.01 | −0.01 | −.07** | .04 | 0.01 |
| ImPACT Visual Memory | .03 | <−.01 | 0.03 | −0.01 | −.07** | .06** | −0.01 |
| ImPACT VMS | −.04 | −.01 | −0.01 | <.01 | −.04 | .02 | 0.01 |
| ImPACT Reaction Time | .03 | −.02 | 0.01 | 0.03 | .04 | −.01 | −0.02 |
| Immediate post-injury | |||||||
| SAC Total Score | −.32** | −.02 | −0.04 | −.10** | −.25** | .04 | .08** |
| BESS Total Score | .32** | .11** | .12** | 0.07 | .08* | −.03 | −0.04 |
| 24-48 hours post-injury | |||||||
| BSI GSI | .65** | .04* | .16** | −0.04 | .06* | .05* | .39** |
| SF-12 PCS | −.48** | .08 | −0.14 | 0.01 | .17 | .03 | −0.11 |
| SF-12 MCS | −.24 | −.08 | −0.12 | 0.06 | .04 | −.07 | −.43** |
| SAC Total Score | −.34** | −.03 | −.09** | 0.01 | −.06 | .02 | .07** |
| BESS Total Score | .30** | .11** | .13** | 0.05 | .08** | .02 | −0.02 |
| ImPACT Verbal Memory | −.41** | −.06 | −.09* | −0.01 | −.11** | −.02 | 0.04 |
| ImPACT Visual Memory | −.39** | −.10** | −.07* | −0.06 | −.07 | −.04 | <.01 |
| ImPACT VMS | −.35** | −.05 | −.13** | −.07* | −.06 | −.03 | 0.01 |
| ImPACT Reaction Time | .34** | .05 | .11** | 0.07 | .08* | .03 | −0.02 |
Note.
p < 0.01 (2-tailed)
p < 0.05 (2-tailed).
SCAT-3 = Sport Concussion Assessment Tool 3; BSI GSI = 18-item Brief Symptom Inventory Global Severity Index; SAC = Standardized Assessment of Concussion; BESS = Balance Error Scoring System; ImPACT = Immediate Postconcussion and Cognitive Testing; VMS = visual motor speed
At T1, the four ImPACT composite scores were not associated with the General factor, and two ImPACT composites (Verbal and Visual memory) correlated significantly but weakly with the Cognitive symptom dimension (r = −.07). At T3 the relationship between the General factor and all four ImPACT composite scores were more robust and significant (r = −.34 to −.41), and select composite scores correlated significantly but more weakly with the Vestibulo-ocular, Cognitive, and other factors. (r = −.07 to −.13). A trend was observed with the BESS, in which selective weak correlations were observed across factors at T1, with these associations stronger at post-injury, particularly with the General factor (r =.30 to .32).
There were select significant (but small magnitude) associations between blood biomarkers and subfactor scores (Table 5), which diverged in their patterns across time. At T2, GFAP (r = −.23) was inversely correlated with fatigue factor, and NF-L was inversely correlated with the emotion subfactor, r = −.15. At T3, GFAP was associated with the Headache factor, r = .19 and tau was positively associated with the Vestibulo-ocular subfactor, r = .29. At T3, tau and UCH-L1 were inversely associated with the Sensory factor (rs = −.20 to −.29) and NF-L was inversely associated with the General and Emotion factors (r = −.14).
Table 5.
Correlations of factor scores and blood biomarkers evaluated cross-sectionally
| General | Headache | Vestibulo-ocular | Sensory | Cognitive | Fatigue | Emotion | |
|---|---|---|---|---|---|---|---|
| Immediate post-injury | |||||||
| GFAP | .10 | .15 | −0.12 | −0.05 | .17 | −.23* | −0.1 |
| NF-L | .04 | .03 | −0.04 | −0.11 | .01 | −.17 | −.15* |
| Tau | −.04 | .08 | 0.12 | −0.17 | .14 | .01 | 0.02 |
| UCH-L1 | .13 | .11 | <.01 | 0.04 | .16 | −.05 | −0.13 |
| 24-48 hours post-injury | |||||||
| GFAP | −.03 | .19* | −0.11 | −0.14 | .10 | .13 | −0.04 |
| NF-L | −.14* | .08 | 0.06 | −0.02 | .06 | .03 | −.14* |
| Tau | −.04 | −.01 | .29** | −.20* | .05 | −<.01 | 0.01 |
| UCH-L1 | −.01 | .08 | 0.09 | −.29** | −.04 | .15 | −0.06 |
Note.
p < .05,
p < .01 (2-tailed).
GFAP=glial fibrillary acidic protein’ NF-L= neurofilament light chain; UCH-LI=ubiquitin carboxy-terminal hydrolase L1
Multivariable negative binomial regression models were performed in order to investigate the association between symptom dimensions and symptom duration, separately by timepoint. At T1 (Baseline), the General, X2(1) = 7.34, p = .007, and Headache, X2(1) = 12.46, p < .001, factors significantly positively predicted symptom duration. At T2 (acute post-injury), duration of symptoms was significantly positively predicted by six factors: General, X2(1) = 58.67, p < .001, Headache, X2(1) = 6.13, p = .013, Sensory, X2(1) = 5.72, p = .017, Emotional, X2(1) = 4.59, p < .032, and Vestibulo-ocular, X2(1) = 29.97, p < .001, factors. Similar to T1, at T3, duration of symptoms was significantly positively predicted by scores on the General factor, X2(1) = 153.83, p < .001, as well as the Headache factor, X2(1) = 35.11, p < .001.
Discussion
To our knowledge, the latent structure of sport-related concussion symptomatology over time has yet to be evaluated using formal factorial measurement invariance modeling approaches. We identified a bifactor model of the SCAT-3 checklist, with one General and six independent subfactors: Headache, Vestibulo-ocular (imbalance, dizziness, blurred vision), Sensory sensitivity, Cognitive, Emotional, and Fatigue, which fit well immediately (< 6h; T2) and at 24-48h post-injury (T3). While the model only fit configurally at Baseline (T1), factorial measurement invariance models demonstrated strict invariance only for Immediate Post-Injury (T2) and 24-48h (T3) intervals. This implies, reasonably so, that these SCAT-3 factors can be directly compared acutely after injury up to 48h into recovery, but cannot necessarily be interpreted as reflecting the same constructs from between pre-injury and acute phases of assessment. Select factor scores at T2 and T3 tended to correlate with traditional measures of constructs similar to the factors, providing preliminary data on the clinical validity and potential utility of the specific factors. Similarly, select factors were significantly associated with a common metric of clinical outcomes (i.e., symptom duration), providing support for the prognostic utility of these novel symptom dimensions.
SCAT-3 Factor Structure and Model Invariance
The findings expand upon evidence that the structure of concussion symptoms is best delineated using a bifactor modeling approach. Specifically, the bifactor model yielded the best fit at baseline, immediately post-injury, and at 24-48 hours post-injury. Compared to our previously reported 5-factor bifactor model of concussion symptoms acutely post-injury,41 the current 7-factor bifactor model contained many similarities (i.e., comparable headache, sensory, fatigue-related, and emotional factors with similar or equivalent item content on each), while extending the model with two additional subfactors (i.e., Cognitive and Vestibulo-ocular). Differences between the factor structures elucidated in the two studies may owe to the smaller, more homogeneous sample in the prior study (predominantly male football players at the 24-48h time point) as compared to the much larger, more diverse CARE Consortium sample. Notably, despite a large sample at a fourth time point (start of return-to-play protocol), the factor structure of concussion symptoms was not comparable. A prior study within the same sample has reported on significantly lower concussion symptom endorsement at this time point, even as compared to baseline, which could be due to a number of factors such as anchoring bias52 or underreporting due to a desire to return to play faster.
The current study advances efforts to identify separable dimensions or features of concussion symptoms (i.e., clinical phenotypes) that might inform mechanistic and treatment research. The different factors identified in the current study are somewhat comparable to the set of clinical profiles proposed by expert working groups.30 Specifically, proposed clinical profiles have included cognitive, headache/migraine, vestibulo-ocular/vestibular (similar core characteristics), and emotion/mood-related phenotypes. That we also observed these dimensions is notable in light of substantial methodological differences between the current and prior works, with the current study leveraging latent variable models to identify common symptom dimensions that underlie high correlations among symptoms, versus the prior aforementioned work that leveraged clinical expert consensus and literature reviews of the prevalence of symptom profiles.28, 30 The high correlation among concussion symptoms (i.e., high level of unidimensionality of the SCAT3 as indicated by the current study model) explains why purportedly distinct clinical “profiles” of concussion are highly comorbid, with patients often presenting with multiple profiles. A novel finding emerging from the current work was the emergence of a fatigue subfactor, which has been widely recognized as occurring in the context of concussion by the aforementioned clinical expert consensus groups, but described as a common correlate of symptoms, and not necessarily a distinct phenotype.30 An additional discrepancy is also observed in which the current study identified a sensory subfactor, whereas others have proposed an ocular-motor profile (both of which share photophobia as a feature). The discrepancies across the two classification methods could be due to a host of factors, such as the fact that the bifactor modeling approach used in the current study sought symptom dimensions independent of those account for by total symptom severity (i.e., the General factor), or that other prior work was able to consider a comprehensive battery comprising assessment tools beyond self-reported symptom ratings (e.g., Vestibular Ocular Motor Screening; VOMS). Nevertheless, the alignment of the current and prior results provides supports for continuing to pursue evidence-based assessment and treatment protocols around these symptom domains.
The full utility of factors is unclear, and we can only speculate how these factors may be used in order to improve the detection and management of concussion at this time. Given clinicians’ conventional practice of summing symptom ratings into a single total score as a method to track injury recovery has been challenged in recent consensus reviews,17, 33 the bifactor model would provide a means for assessing both overall symptom severity and more specific expressions of symptoms reflected in the model’s subfactors. The fact that a high degree of variance recorded for the SCAT-3 (i.e., OmegaH of the General factor >.80) is accounted for by a single General factor, it is reasonable to continue to regard the SCAT-3 as an essentially unidimensional instrument and to continue to quantify overall symptom severity scores. However, these data also indicate that there are indeed distinct dimensions underlying SCAT-3 ratings, which may have distinct diagnostic/phenotyping and prognostic value beyond the General factor.
Notably, the General and subfactors of the bifactor model are independent, which indicates that (after attributing a portion of a given item’s variance to the General factor) the remaining variance in item responses are not influenced by individuals’ standings on the latent General factor (where the General factor can be considered analogous to observed SCAT-3 total scores). Put another way, a person may be elevated within one specific subfactor, but low on total scores of the General factor. As such, assessing subfactors of the model may improve detection sensitivity of more subtle injury-related sequelae. Use of the current model could allow for assessment of patient needs with greater precision, allowing for more targeted, individualized intervention through selection of specific treatment modalities for each elevated subfactor.
The best-fitting strict invariance model across T2 and T3 indicates that the factors can be interpreted the same way between time points (i.e., the same thing is being measured in the same way) and by extension, can be directly compared to evaluate changes in symptoms over this initial recovery period recovery. In contrast, we observed only configural variance from pre-injury baseline to the subacute post-injury period (T1-T3). This finding is consistent with reports by others, based on cross-sectional structural modeling alone, that indicated a different factor structure may be present in concussion symptoms pre- to post-injury.2, 27 These findings imply that it may be problematic, as prior studies have done, to interpret changes over time in symptom factors identified solely within a baseline sample in the absence of formal support for strong or strict longitudinal invariance of those dimensions.37 However, as highlighted above, there may be some utility in continuing to quantify overall symptom severity scores across timepoints due to the fact that a high degree of variance recorded for the SCAT-3 (i.e., OmegaH of the General factor >.80) is accounted for by a single General factor. Given this, while interpretation of change in different symptom factors across timepoints was not supported, the notion that the SCAT-3 as an essentially unidimensional instrument (i.e., large variance accounted for by general factor) suggests that there may be some utility in considering total symptom scores from baseline, particularly on the individual level.
Distinct Longitudinal Trajectories of Symptom Dimensions
Interestingly, the factors displayed discrete trajectories from acute to the subacute time points post injury. Specifically, levels of Sensory, Fatigue, and Emotion factors increased across these two time points. As would be expected further out from injury, the General, Headache, and Vestibulo-ocular factor means decreased from acute to subacute time points. The Cognitive subfactor remained stable. That some of these symptom dimensions evolve in a direction opposite to the SCAT-3 symptom severity score is a key finding that supports the potential clinical utility of this bifactor model. An immediate implication of this finding is that clinicians may consider routinely following up with concussed athletes in the first 24-48 hours postinjury to ensure that new/worsening symptoms (more likely of a Sensory, Fatigue, and Emotional nature per these data) are identified and treated.
External Correlates of Symptom Dimensions
A number of subfactors were correlated in the expected direction with conventional clinical outcome measures across the three time points of assessment in the current study. Select subfactors tended to correlate most strongly and consistently with clinical measures purported to measure similar underlying constructs. For example, the Emotional subfactor yielded medium to large correlations with two well-established measures of emotional symptoms, the SF-12 Mental Component Score and the BSI-18 Global Severity Index, across all three time points (i.e., pre-injury baseline to 48h postinjury stage). Additionally, a small-to-medium-sized association between the Cognitive subfactor and the SAC acutely post-injury was observed. Interestingly, at T1, the General factor mainly correlated strongly with measures of general distress. At post-injury time points, the General factor correlated with various measures known to be influenced by the effects of concussion (cognitive performance and postural stability). This plausibly suggests that symptom endorsement on the SCAT-3 at baseline is more likely to represent general distress, as compared to post-injury, in which is more likely to reflect self-reported sequelae of concussion. The fact that the symptom endorsement on the SCAT-3 represents distinct constructs from pre- and post-injury is empirically supported by the finding of only configural factorial invariance across these timepoints.
Significant, but trivial correlations between objective and subjective (symptom report/subfactor scores) measures of postural stability and cognitive functioning were observed. This is consistent with a prior study that reported weak correlations (r <.10) between symptom endorsement (“dizziness” and “balance problems”) and an objective measure of postural stability (NeuroCom Sensory Organization Test) at pre- and post-injury.8 The same study, as well as others, have also reported weak to no correlations between subjective cognitive symptom endorsement (e.g., difficulty remembering) and indices of the ImPACT test (e.g., Verbal Memory scores) acutely or remotely post-injury.8, 9
Similar significant, but small, correlations were observed between serum blood-based biomarkers measured acutely and subacutely post-injury. GFAP, a protein purportedly produced by astrocytic damage in response to brain injury,43 was positively correlated with the Cognitive symptom dimension and inversely associated with Fatigue immediately post-injury. A similar inverse correlation was observed between NF-L levels and Fatigue subfactor levels acutely post-injury. At 24-48 hours post-injury, GFAP was inversely associated with the General factor, and tau was positively correlated with Vestibulo-ocular factor scores. It is noteworthy that subfactors of the model, but not the General factor, were associated with various biomarkers, given that biomarkers and the General factor are thought to both reflect total injury and symptom severity. Future work is needed to understand if the subfactor symptoms truly represent distinct processes more closely linked to the pathways represented by these serum blood biomarkers.
Elevations in General and Headache subfactors at T1 and T3 were associated with longer recovery (i.e., symptom duration). At T2, all factor scores, with the exception of the Cognitive subfactor, were independently positively associated with recovery duration. These findings are noteworthy given that the most consistent and robust predictor of clinical recovery is acute symptom burden.24 In particular, these findings clarify and suggest that distinct aspects of concussion symptoms have differential prognostic utility at different timepoints. Investigation into the association between individual symptoms or factors/clusters and clinical recovery has been limited, with select studies primarily examining the influence of acute headache or dizziness on symptom duration. Consistent with the current study, a number of studies have shown that endorsement of acute headache was associated with greater length of clinical recovery.1, 3, 26, 38, 40, 55 These findings, while consistent, imply that in the early acute post-injury period numerous other symptoms dimensions also independently contribute to recovery prediction, whereas continued headache 24-48 hours post-injury appears more uniquely predictive of the continuation of symptoms.
Limitations
There are several notable limitations for the current study. Firstly, generalizability of the current findings beyond collegiate athletes or the timepoints assessed in this study is limited. Although the study protocol standardized the concussion assessment and symptom recording process across the 30 sites, within and between site variability may have been present in symptom query. The fact that symptom endorsement is not an objective measure of the effects of concussion could be considered a limitation; however, prior research has reliably shown that the largest and longest effects of SRC are associated with measures of symptom endorsement and this metric is one of the most regularly utilized means in the diagnosis and management of sport-related concussion.41
Future Directions
The identification of this bifactor model and strict measurement invariance during post-injury time points presents numerous opportunities for their use in future research. Firstly, future research should examine the relationship between pre-injury demographic (e.g., age, race, ethnicity and sex) and medical history variables and likelihood of endorsing particular subfactors in the acute injury phase. Intuitively, those with a treatment history for headaches or psychiatric disorders may be more likely to endorse elevated levels of Headache and Emotional subfactors, respectively; the degree to which specific factors are associated with corresponding conditions, particularly at baseline, is warranted. Investigation into whether subfactors are associated with injury-related variables such as loss of consciousness, post-traumatic amnesia, or mechanism of injury is also warranted. Furthermore, future work should examine the presence of the bifactor structure across a wider spectrum of recovery (beyond 48 hours, but prior to the initiation of the return to play protocol). In the current study, we observed a challenge with modeling the SCAT’s structure after athletes reported concussion symptom recovery and were about to initiate graduated return-to-play protocols. Thus, the factor structure of the SCAT-3 between 48 hours post-injury and the point of symptom recovery has yet to be determined. Additionally, future work should examine the SCAT’s factorial invariance across other groups of interest, such as age and gender groups, which have been reported to have relationships with concussion symptom reporting. 10, 18, 51
Conclusion
The present study leveraged the large national CARE Consortium sample to advance understanding of the degree to which distinct clinical phenotypes (operationalized as symptom dimensions) underlie symptom endorsement of the SCAT-3 symptom checklist. We demonstrated, through modern latent variable modeling, that the SCAT-3 structure is best represented through a bifactor model, with a large dominant General factor and six independent specific factors comprising Headache, Vestibulo-ocular, Sensory, Cognitive, Fatigue, and Emotional symptoms. The model was strictly invariant across the acute post-injury period but only configurally invariant pre- to post-injury, implying that different underlying constructs influence symptom ratings across these timepoints. The identified dimensions manifested distinct trajectories (with some rising in the first 48 hours post-concussion) and demonstrated differing patterns of association with other clinical and blood biomarker indices associated with injury severity and outcome, implying that these dimensions have the potential to inform the development of more evidence-based, precision medicine stratification and treatment approaches for athletes with concussion.
What is known about the subject:
The possibility that distinct phenotypes or clinical profiles manifest following concussion is a popular notion that has not been thoroughly investigated.
A bifactor model has been shown to appropriately represent the structure of acute concussion symptoms, allowing for a dominant general factor encompassing all items, as well as distinct subfactors. However, the degree to which this applies to other samples and across pre- to post-injury assessment is unknown.
Identifying separable phenotypes will inform precision medicine clinical management approaches to treating distinct clinical presentations. Understanding how separable dimensions of concussion symptoms are related to traditional measures of concussion severity (i.e., cognitive assessment, postural stability, blood biomarkers) and outcomes (i.e., symptom duration) is essential to advancing evidence-based clinical management of concussion.
What this study adds to existing knowledge:
Distinctions between separate aspects of concussion symptoms were identified that could inform development of targeted, individualized treatment plans for recovery.
A bifactor model with one General factor and six subfactors (Headache, Vestibulo-ocular, Sensory sensitivity, Cognitive, Emotionality, and Fatigue) was identified across three pre- to post-injury timepoints.
That model parameters were different at pre-injury than they were post-injury is consistent with different underlying causes of “concussion” symptoms reported pre- and post-injury.
Unlike the overall symptom severity score, which decreases over time after concussion, we found that specific symptom dimensions (sensory, fatigue, and emotional) increase in severity in the first 24-48 hours post-injury. This might warrant routine follow-up of concussed athletes in this timeframe to ensure that symptoms not identified immediately post-injury are managed effectively. That symptom dimensions showed distinct longitudinal trajectories and clinical correlates provides preliminary support for this model as potentially informing precision medicine clinical care for concussion.
Acknowledgements
This secondary analysis project was funded by the National Institutes of Health grants R03NS100691 and R01NS110856. The Grand Alliance Concussion Assessment, Research, and Education (CARE) Consortium study was funded by the Department of Defense and National Collegiate Athletic Association (NCAA). The U.S. Army Medical Research Acquisition Activity, 820 Chandler Street, Fort Detrick MD 21702-5014 is the awarding and administering acquisition office. This work was supported by the Office of the Assistant Secretary of Defense for Health Affairs through the Psychological Health and Traumatic Brain Injury Program under Award NO W81XWH-14-2-0151 and BLB acknowledges support from the National Institute of Neurological Disorders and Stroke (NINDS) under the National Institutes of Health under the award NO L301L30NS113158-01. Opinions, interpretations, conclusions and recommendations are those of the author and are not necessarily endorsed by the Department of Defense (Defense Health Program funds) or the NIH.
CARE Consortium Investigators are listed alphabetically by institution:
Joseph B Hazzard Jr, EdD, ATC (Bloomsburg University, Bloomsburg, PA); Louise A Kelly, PhD (California Lutheran University, Thousand Oaks, CA); Justus Ortega, PhD (Humboldt State University, Arcata, CA); Nicholas Port, PhD (Indiana University, Bloomington, IN); Paul F Pasquina, MD (Uniformed Services University of Health Sciences, Bethesda, MD); Jonathan Jackson, MD (US Air Force Academy, Colorado Springs, CO); Kenneth L Cameron, PhD and Megan N Houston, PhD (US Military Academy, West Point, NY); Joshua T Goldman, Christopher Giza, MD (University of California-Los Angeles, Los Angeles, CA); Thomas Buckley, EdD, ATC (University of Delaware, Newark, DE); James R Clugston, MD, MS (University of Florida, Gainsville, FL); Julianne D Schmidt, PhD, ATC (University of Georgia, ], Athens, GA); Luis A Feigenbaum, PT, DPT, ATC, LAT (University of Miam, Coral Gables, FL i); James T Eckner, MD, MS (University of Michigan, Ann Arbor, MI); Christina L Master, MD (University of Pennsylvania, Philadelphia, PA); Michael W Collins, PhD and Anthony P Kontos, PhD (University of Pittsburgh, Pittsburgh, PA); Sara PD Chrisman, MD, MPH (University of Washington, Seattle, WA); Stefan M Duma, PhD (Virginia Tech, Blacksburg, VA); Christopher M Miles, MD (Wake Forest University, Raleigh, NC); Adam Susmarski, DO (US Naval Academy, Annapolis, MD)
References:
- 1.Asplund CA, McKeag DB, Olsen CH. Sport-related concussion: factors associated with prolonged return to play. Clin J Sport Med. 2004;14(6):339–343. [DOI] [PubMed] [Google Scholar]
- 2.Ayr LK, Yeates KO, Taylor HG, Browne M. Dimensions of postconcussive symptoms in children with mild traumatic brain injuries. J Int Neuropsychol Soc. 2009;15(1):19–30. [DOI] [PMC free article] [PubMed] [Google Scholar]
- 3.Benson BW, Meeuwisse WH, Rizos J, Kang J, Burke CJ. A prospective study of concussions among National Hockey League players during regular season games: the NHL-NHLPA Concussion Program. CMAJ. 2011;183(8):905–911. [DOI] [PMC free article] [PubMed] [Google Scholar]
- 4.Biderman MD, Nguyen NT, Cunningham CJ, Ghorbani N. The ubiquity of common method variance: The case of the Big Five. Journal of Research in Personality. 2011;45(5):417–429. [Google Scholar]
- 5.Brett BL, Breedlove K, McAllister TW, et al. Investigating the Range of Symptom Endorsement at Initiation of a Graduated Return-to-Play Protocol After Concussion and Duration of the Protocol: A Study From the National Collegiate Athletic Association-Department of Defense Concussion, Assessment, Research, and Education (CARE) Consortium. Am J Sports Med. 2020:363546520913252. [DOI] [PubMed] [Google Scholar]
- 6.Brett BL, Kuhn AW, Yengo-Kahn AM, Jeckell AS, Solomon GS, Zuckerman SL. On-Field Signs Predict Future Acute Symptoms After Sport-Related Concussion: A Structural Equation Modeling Study. J Int Neuropsychol Soc. 2018;24(5):476–485. [DOI] [PubMed] [Google Scholar]
- 7.Broglio SP, McCrea M, McAllister T, et al. A National Study on the Effects of Concussion in Collegiate Athletes and US Military Service Academy Members: The NCAA-DoD Concussion Assessment, Research and Education (CARE) Consortium Structure and Methods. Sports Med. 2017;47(7):1437–1451. [DOI] [PMC free article] [PubMed] [Google Scholar]
- 8.Broglio SP, Sosnoff JJ, Ferrara MS. The relationship of athlete-reported concussion symptoms and objective measures of neurocognitive function and postural control. Clin J Sport Med. 2009;19(5):377–382. [DOI] [PubMed] [Google Scholar]
- 9.Brooks BL, McKay CD, Mrazik M, Barlow KM, Meeuwisse WH, Emery CA. Subjective, but not objective, lingering effects of multiple past concussions in adolescents. J Neurotrauma. 2013;30(17):1469–1475. [DOI] [PMC free article] [PubMed] [Google Scholar]
- 10.Brooks MA, Snedden TR, Mixis B, Hetzel S, McGuine TA. Establishing Baseline Normative Values for the Child Sport Concussion Assessment Tool. JAMA Pediatr. 2017;171(7):670–677. [DOI] [PMC free article] [PubMed] [Google Scholar]
- 11.Chen FF. Sensitivity of goodness of fit indexes to lack of measurement invariance. Structural Equation Modeling. 2007;14(3):464–504. [Google Scholar]
- 12.Cheung GW, Rensvold RB. Evaluating Goodness-of-Fit Indexes for Testing Measurement Invariance. Structural Equation Modeling. 2002;9(2):233–255. [Google Scholar]
- 13.Chin EY, Nelson LD, Barr WB, McCrory P, McCrea MA. Reliability and Validity of the Sport Concussion Assessment Tool-3 (SCAT3) in High School and Collegiate Athletes. Am J Sports Med. 2016;44(9):2276–2285. [DOI] [PubMed] [Google Scholar]
- 14.Collins MW, Kontos AP, Reynolds E, Murawski CD, Fu FH. A comprehensive, targeted approach to the clinical care of athletes following sport-related concussion. Knee Surg Sports Traumatol Arthrosc. 2014;22(2):235–246. [DOI] [PubMed] [Google Scholar]
- 15.Covassin T, Moran R, Wilhelm K. Concussion symptoms and neurocognitive performance of high school and college athletes who incur multiple concussions. Am J Sports Med. 2013;41(12):2885–2889. [DOI] [PubMed] [Google Scholar]
- 16.Derogatis. Brief Symptom Inventory 18 (BSI-18): Administration, scoring, and procedures manual. Bloomington, MN: Pearson; 2001. [Google Scholar]
- 17.Feddermann-Demont N, Echemendia R, Schneider K. What domains of clinical function should be assessed after sport-related concussion?: A systematic review. Br J of Sport Med. 2017. [DOI] [PubMed] [Google Scholar]
- 18.Frommer LJ, Gurka KK, Cross KM, Ingersoll CD, Comstock RD, Saliba SA. Sex differences in concussion symptoms of high school athletes. J Athl Train. 2011;46(1):76–84. [DOI] [PMC free article] [PubMed] [Google Scholar]
- 19.Galenkamp H, Stronks K, Mokkink LB, Derks EM. Measurement invariance of the SF-12 among different demographic groups: The HELIUS study. PLoS One. 2018;13(9):e0203483. [DOI] [PMC free article] [PubMed] [Google Scholar]
- 20.Guskiewicz KM, Ross SE, Marshall SW. Postural Stability and Neuropsychological Deficits After Concussion in Collegiate Athletes. J Athl Train. 2001;36(3):263–273. [PMC free article] [PubMed] [Google Scholar]
- 21.Guty E, Arnett P. Post-concussion Symptom Factors and Neuropsychological Outcomes in Collegiate Athletes. J Int Neuropsychol Soc. 2018;24(7):684–692. [DOI] [PubMed] [Google Scholar]
- 22.Hu L-t, Bentler PM. Cutoff criteria for fit indexes in covariance structure analysis: Conventional criteria versus new alternatives. Structural Equation Modeling. 1999;6:1–55. [Google Scholar]
- 23.Immediate. Immediate post-concussion assessment testing (ImPACT) test: Technical manual. . Available at: https://www.impacttest.com/pdf/ImPACTTechnicalManual.pdf. Accessed April 6, 2013.
- 24.Iverson GL, Gardner AJ, Terry DP, et al. Predictors of clinical recovery from concussion: a systematic review. Br J Sports Med. 2017;51(12):941–948. [DOI] [PMC free article] [PubMed] [Google Scholar]
- 25.Joyce AS, Labella CR, Carl RL, Lai JS, Zelko FA. The Postconcussion Symptom Scale: utility of a three-factor structure. Med Sci Sports Exerc. 2015;47(6):1119–1123. [DOI] [PubMed] [Google Scholar]
- 26.Kontos AP, Elbin RJ, Lau B, et al. Posttraumatic migraine as a predictor of recovery and cognitive impairment after sport-related concussion. Am J Sports Med. 2013;41(7):1497–1504. [DOI] [PubMed] [Google Scholar]
- 27.Kontos AP, Elbin RJ, Schatz P, et al. A revised factor structure for the post-concussion symptom scale: baseline and postconcussion factors. Am J Sports Med. 2012;40(10):2375–2384. [DOI] [PubMed] [Google Scholar]
- 28.Kontos AP, Sufrinko A, Sandel N, Emami K, Collins MW. Sport-related Concussion Clinical Profiles: Clinical Characteristics, Targeted Treatments, and Preliminary Evidence. Curr Sports Med Rep. 2019;18(3):82–92. [DOI] [PubMed] [Google Scholar]
- 29.Liu Y, Millsap RE, West SG, Tein J, Tanaka R, Grimm KJ. Testing measurement invariance in longitudinal data with ordered-categorical measures. Psychological Methods. 2017;22(3):486–506. [DOI] [PMC free article] [PubMed] [Google Scholar]
- 30.Lumba-Brown A, Teramoto M, Bloom OJ, et al. Concussion Guidelines Step 2: Evidence for Subtype Classification. Neurosurgery. 2020;86(1):2–13. [DOI] [PMC free article] [PubMed] [Google Scholar]
- 31.McCrea M, Broglio SP, McAllister TW, et al. Association of Blood Biomarkers With Acute Sport-Related Concussion in Collegiate Athletes: Findings From the NCAA and Department of Defense CARE Consortium. JAMA Netw Open. 2020;3(1):e1919771. [DOI] [PMC free article] [PubMed] [Google Scholar]
- 32.McCrea M, Kelly JP, Randolph C, et al. Standardized assessment of concussion (SAC): on-site mental status evaluation of the athlete. J Head Trauma Rehabil. 1998;13(2):27–35. [DOI] [PubMed] [Google Scholar]
- 33.McCrory P, Meeuwisse W, Dvorak J, et al. Consensus statement on concussion in sport-the 5(th) international conference on concussion in sport held in Berlin, October 2016. Br J Sports Med. 2017. [DOI] [PubMed] [Google Scholar]
- 34.McCrory P, Meeuwisse W, Johnston K, et al. Consensus Statement on Concussion in Sport: the 3rd International Conference on Concussion in Sport held in Zurich, November 2008. Br J Sports Med. 2009;43 Suppl 1:i76–90. [DOI] [PubMed] [Google Scholar]
- 35.McCrory P, Meeuwisse WH, Aubry M, et al. Consensus statement on concussion in sport: the 4th International Conference on Concussion in Sport held in Zurich, November 2012. Br J Sports Med. 2013;47(5):250–258. [DOI] [PubMed] [Google Scholar]
- 36.Merritt VC, Arnett PA. Premorbid predictors of postconcussion symptoms in collegiate athletes. J Clin Exp Neuropsychol. 2014;36(10):1098–1111. [DOI] [PubMed] [Google Scholar]
- 37.Merritt VC, Meyer JE, Arnett PA. A novel approach to classifying postconcussion symptoms: The application of a new framework to the Post-Concussion Symptom Scale. J Clin Exp Neuropsychol. 2015;37(7):764–775. [DOI] [PubMed] [Google Scholar]
- 38.Merritt VC, Rabinowitz AR, Arnett PA. Injury-related predictors of symptom severity following sports-related concussion. J Clin Exp Neuropsychol. 2015;37(3):265–275. [DOI] [PubMed] [Google Scholar]
- 39.Meterko M, Baker E, Stolzmann KL, Hendricks AM, Cicerone KD, Lew HL. Psychometric assessment of the Neurobehavioral Symptom Inventory-22: the structure of persistent postconcussive symptoms following deployment-related mild traumatic brain injury among veterans. J Head Trauma Rehabil. 2012;27(1):55–62. [DOI] [PubMed] [Google Scholar]
- 40.Mihalik JP, Register-Mihalik J, Kerr ZY, Marshall SW, McCrea MC, Guskiewicz KM. Recovery of posttraumatic migraine characteristics in patients after mild traumatic brain injury. Am J Sports Med. 2013;41(7):1490–1496. [DOI] [PubMed] [Google Scholar]
- 41.Muthén LK, Muthén BO. Mplus User’s Guide 7th ed. ed. Los Angeles, CA: Muthén & Muthén; 1998-2015. [Google Scholar]
- 42.Nelson LD, Kramer MD, Patrick CJ, McCrea MA. Modeling the Structure of Acute Sport-Related Concussion Symptoms: A Bifactor Approach. J Int Neuropsychol Soc. 2018;24(8):793–804. [DOI] [PMC free article] [PubMed] [Google Scholar]
- 43.Pekny M, Pekna M. Astrocyte intermediate filaments in CNS pathologies and regeneration. J Pathol. 2004;204(4):428–437. [DOI] [PubMed] [Google Scholar]
- 44.Piland SG, Motl RW, Ferrara MS, Peterson CL. Evidence for the Factorial and Construct Validity of a Self-Report Concussion Symptoms Scale. J Athl Train. 2003;38(2):104–112. [PMC free article] [PubMed] [Google Scholar]
- 45.Potter S, Leigh E, Wade D, Fleminger S. The Rivermead Post Concussion Symptoms Questionnaire: a confirmatory factor analysis. J Neurol. 2006;253(12):1603–1614. [DOI] [PubMed] [Google Scholar]
- 46.Putnick DL, Bornstein MH. Measurement Invariance Conventions and Reporting: The State of the Art and Future Directions for Psychological Research. Dev Rev. 2016;41:71–90. [DOI] [PMC free article] [PubMed] [Google Scholar]
- 47.Putukian M, Echemendia R, Dettwiler-Danspeckgruber A, et al. Prospective clinical assessment using Sideline Concussion Assessment Tool-2 testing in the evaluation of sport-related concussion in college athletes. Clin J Sport Med. 2015;25(1):36–42. [DOI] [PubMed] [Google Scholar]
- 48.Reise SP, Bonifay WE, Haviland MG. Scoring and modeling psychological measures in the presence of multidimensionality. J Pers Assess. 2013;95(2):129–140. [DOI] [PubMed] [Google Scholar]
- 49.Resch JE, Brown CN, Macciocchi SN, Cullum CM, Blueitt D, Ferrara MS. A Preliminary Formula to Predict Timing of Symptom Resolution for Collegiate Athletes Diagnosed With Sport Concussion. J Athl Train. 2015;50(12):1292–1298. [DOI] [PMC free article] [PubMed] [Google Scholar]
- 50.Sady MD, Vaughan CG, Gioia GA. Psychometric characteristics of the postconcussion symptom inventory in children and adolescents. Arch Clin Neuropsychol. 2014;29(4):348–363. [DOI] [PMC free article] [PubMed] [Google Scholar]
- 51.Snedden TR, Brooks MA, Hetzel S, McGuine T. Normative Values of the Sport Concussion Assessment Tool 3 (SCAT3) in High School Athletes. Clin J Sport Med. 2017;27(5):462–467. [DOI] [PubMed] [Google Scholar]
- 52.Tversky A, Kahneman D. Judgment under Uncertainty: Heuristics and Biases. Science. 1974;185(4157):1124–1131. [DOI] [PubMed] [Google Scholar]
- 53.Vanderploeg RD, Silva MA, Soble JR, et al. The structure of postconcussion symptoms on the Neurobehavioral Symptom Inventory: a comparison of alternative models. J Head Trauma Rehabil. 2015;30(1):1–11. [DOI] [PubMed] [Google Scholar]
- 54.Waljas M, Iverson GL, Hartikainen KM, et al. Reliability, validity and clinical usefulness of the BNI fatigue scale in mild traumatic brain injury. Brain Inj. 2012;26(7–8):972–978. [DOI] [PubMed] [Google Scholar]
- 55.Zemek R, Barrowman N, Freedman SB, et al. Clinical Risk Score for Persistent Postconcussion Symptoms Among Children With Acute Concussion in the ED. JAMA. 2016;315(10):1014–1025. [DOI] [PubMed] [Google Scholar]