

Abstract
Epilepsy affects all ages, races, genders, and socioeconomic groups. In about one third of patients, epilepsy is uncontrolled with current medications, leaving a vast need for improved therapies. The causes of epilepsy are diverse and not always known but one gene mutated in a small subpopulation of patients is phosphatase and tensin homolog (PTEN). Moreover, focal cortical dysplasia, which constitutes a large fraction of refractory epilepsies, has been associated with signaling defects downstream of PTEN. So far, most preclinical attempts to reverse PTEN deficiency-associated neurological deficits have focused on mTOR, a signaling hub several steps downstream of PTEN. Phosphoinositide 3-kinases (PI3Ks), by contrast, are the direct enzymatic counteractors of PTEN, and thus may be alternative treatment targets. PI3K activity is mediated by four different PI3K catalytic isoforms. Studies in cancer, where PTEN is commonly mutated, have demonstrated that inhibition of only one isoform, p110β, reduces progression of PTEN-deficient tumors. Importantly, inhibition of a single PI3K isoform leaves critical functions of general PI3K signaling throughout the body intact. Here, we show that this disease mechanism-targeted strategy borrowed from cancer research rescues or ameliorates neuronal phenotypes in male and female mice with neuron-specific PTEN deficiency. These phenotypes include cell signaling defects, protein synthesis aberrations, seizures, and cortical dysplasia. Of note, p110β is also dysregulated and a promising treatment target in the intellectual disability Fragile X syndrome, pointing towards a shared biological mechanism that is therapeutically targetable in neurodevelopmental disorders of different etiologies. Overall, this work advocates for further assessment of p110β inhibition not only in PTEN deficiency-associated neurodevelopmental diseases but also other brain disorders characterized by defects in the PI3K/mTOR pathway.
Keywords: PTEN deficiency, PI3K, epilepsy, seizure, protein synthesis, signal transduction, p110β, neurodevelopmental disorder, mouse model
Introduction
Several studies have identified an association between mutations in the phosphatase and tensin homologue (PTEN) gene and neurodevelopmental disorders, in particular in individuals with macrocephaly (Butler et al., 2005; Goffin et al., 2001; Kwon et al., 2001; Pinto et al., 2014). A causal relationship between impaired PTEN expression and epilepsy, autistic-like behavior and brain structural abnormalities was confirmed in mouse models with neuronal subset-selective knockout of Pten (Backman et al., 2001; Kwon et al., 2006; Kwon et al., 2001; Pun et al., 2012). These studies, which used different promoters and approaches to delete Pten in subsets of neurons in the brain have shown that in mice, neuron-specific deletion of Pten consistently leads to spontaneous seizures. Patients with germline mutations of PTEN rarely develop refractory epilepsy (Rademacher and Eickholt, 2019), but somatic mutations in the PTEN/phosphoinositide 3-kinase (PI3K)/mechanistic target of rapamycin (mTOR) pathway, which better reflect the brain-specific mouse models, have often been found in patients with focal cortical dysplasia (FCD) (Lim et al., 2015; Lim and Crino, 2013). In addition, increased PI3K/mTOR signaling has been observed in FCDs (Schick et al., 2006). FCDs are a frequent cause of refractory epilepsy, and thus novel treatments targeting the PTEN/PI3K/mTOR pathway to reduce seizure burden in these disorders are urgently needed.
PTEN’s lipid phosphatase function counteracts the class I PI3K pathway by catalyzing the dephosphorylation of phosphatidylinositol (3, 4, 5)-trisphosphate (PIP3) at the 3’ phosphate of the inositol ring to phosphatidylinositol (4,5)-bisphosphate (PIP2) (Maehama and Dixon, 1998). PTEN, through the regulation of PIP2/PIP3 ratios, can affect cell signaling downstream of PI3K, including protein kinase B (AKT) and mTOR (Switon et al., 2017). Through the negative control of PI3K, PTEN regulates many cellular functions, such as metabolism, growth, and mitosis (Carnero et al., 2008).
mTOR inhibition has been preclinically assessed as a therapy for autism and epilepsy in PTEN-deficient mice. The mTOR-inhibitor rapamycin rescues many aberrations seen in neuron-specific PTEN-deficient mice including changes in neuronal structure, brain morphology, and behavioral deficits (Kwon et al., 2003; Zhou et al., 2009). Additionally, long-term treatment with rapamycin decreases the progressive epilepsy in these mice (Sunnen et al., 2011). A recent study has shown that, likewise, mTORC2 inhibition rescues neurological phenotypes in neuron-specific PTEN-deficient mice (Chen et al., 2019), and an mTOR inhibitor is currently being evaluated to treat cognitive deficits in individuals with PTEN mutations (clinicaltrials.gov). However, mTOR is several molecular steps downstream of PI3K, thus PIP3 accumulation is still expected to occur in the membrane even if mTOR is blocked. PIP3 plays an important role in neuronal polarization as well as axon formation, and thus is central for neuronal function (Menager et al., 2004). This suggests that therapeutic strategies that target further upstream components of this pathway could be beneficial for neurodevelopmental disorders caused by PTEN mutations. To test this hypothesis, we investigated an alternative strategy targeting PI3K activity to correct neuronal deficits associated with PTEN deficiency, which could be applicable to other neurodevelopmental disorders with mutations in the PI3K/mTOR pathway.
PTEN mutations also occur frequently in a multitude of cancers, and drug discovery in PTEN-associated neurological disorders may thus benefit from advances in cancer research. Studies in PTEN-deficient cancers have demonstrated that inhibition of one of the four class I PI3K isoforms, p110β, will stop or significantly reduce tumorigenesis (Jia et al., 2008; Wee et al., 2008). This strategy may prove favorable compared with other mTOR or PI3K-modifying strategies, as it targets the direct source of dysregulation, reduces potential side effects of pan PI3K inhibition, and lessens the chances of reactivation of PI3K signaling in a feedback loop (Wee et al., 2008). Class 1 PI3K isoforms can have distinct and overlapping functions, and previous research suggests that they signal downstream of specific membrane receptors (Gross and Bassell, 2014; Vanhaesebroeck et al., 2010), but so far, the specific PI3K isoforms and receptors that drive PI3K signaling in PTEN-deficient brain disorders are unknown.
p110β is expressed in the brain with a nearly uniform distribution pattern (Lein et al., 2007). Apart from p110β dysregulation in PTEN-deficient tumors, the inherited intellectual disability Fragile X syndrome (FXS) is associated with overactive p110β (Gross and Bassell, 2012; Gross et al., 2010), and copy number variants in the PIK3CB gene (coding for p110β) were found in patients with autism (Cusco et al., 2009). These studies suggest that p110β dysregulation is a shared molecular defect and treatment target in neurodevelopmental disorders of different etiologies. Our lab has demonstrated that genetic and pharmacologic inhibition of p110β rescue molecular, cellular and behavioral phenotypes in mice with a deletion of Fragile X Mental Retardation Gene 1 (Fmr1), which is silenced in individuals with FXS (Gross et al., 2019; Gross et al., 2015). Most recently, we have used a p110β-selective inhibitor which penetrates the blood-brain barrier, GSK2702926A (GSK6A) and has a similar chemotype as one currently in clinical trials for PTEN-associated cancer (Gross et al., 2019; Mateo et al., 2017). Based on our promising findings in FXS and published results in PTEN-deficient cancer, we hypothesized that p110β inhibition may ameliorate phenotypes in PTEN mutation-associated neurodevelopmental disorders.
Using mice in which Pten is deleted postnatally in excitatory forebrain neurons (CamKIIα-cre; Ptenfl/fl) (Chen et al., 2019; McMahon et al., 2012; Sperow et al., 2012), we show that pharmacological inhibition of p110β with GSK6A reduces enhanced PI3K/AKT signaling and protein synthesis rates, and reduces seizure frequency. We also show that in another neuron-specific PTEN-deficient mouse model (Gfap-Cre; Ptenfl/fl) (Kwon et al., 2006; Kwon et al., 2001), p110β inhibition ameliorates signaling defects and cortical dysplasia, and reduces the size of CA1 neuron somata and dentate granule cell somata. This work supports the potential utility of repurposing a therapy developed for PTEN-deficient cancer for a subset of individuals with neurodevelopmental disorders.
Methods and Materials
Mice
Floxed Pten mice and CamK2α-Cre mice were obtained from Jackson Laboratory (B6;129S4-Ptentm1Hwu/J, JAX Mice stock number 006440, RRID:IMSR_JAX:006440; and B6.Cg-Tg(Camk2a-cre)T29-1Stl/J, JAX Mice stock number 005359, RRID:IMSR_JAX:005359). Pten; CamKdel (deletion) mice and their littermate controls were generated by crossing male Ptenfl/+; CamK Cre+ with either female Pten floxed heterozygous or Ren floxed homozygous mice. Pten; Gfapdel (deletion) mice were generated by breeding Ptenfl/+; Gfap+ (kind gift from Dr. Matthew C. Weston at the University of Vermont) (Backman et al., 2001; Kwon et al., 2001). Mice were genotyped via polymerase chain reaction. Littermate controls were either Ptenfl/fl CamK Cre- or Pten+/+; CamK Cre+. For macrocephaly assessment, controls were Pten+/+; Gfap+. Mice were housed at a 14:10 hour light/dark cycle in standard cages with up to 4 animals with food and water ad libitum. The animal protocol was approved by the Institutional Animal Care and Use Committee of CCHMC and complied with the Guide for the Care and Use of Laboratory Animals.
Dose escalation and protein synthesis studies were performed with mice at the age of 6 to 7 weeks. A total of 25 mice (including 15 females and 10 males) were designated for dose escalation studies. A total of 31 mice were designated for protein synthesis assays, including 16 females and 15 males. Cortical analysis was added after the initial hippocampal data collection resulting in a higher number of mice than n reflected in the figure. Daily intraperitoneal (i.p.) injection experiments were performed on mice at 6 weeks of age. A total of 9 mice (including 4 females and 5 males) were designated for these experiments. Ten male and 17 female mice at the age of 7 weeks were used for nesting assays and analysis of signal transduction. All seizure analysis studies were started when mice were approximately 8 weeks. For EEG experiments, a total of 16 Ptenfl/fl CamK Cre+ mice completed the entire experiment. Five mice were designated for EEG experiments but died prior to surgery. Thirteen mice underwent EEG electrode implantation but died prior to receiving treatment. Three mice died during the treatment portion of the experiment. A total of 12 littermate controls completed the experiment. One littermate control died during the experiment due to unknown causes. No seizures were noted in any of the control mice, including the one mortality. Two mice from the same litter were excluded due to excessively high seizure burden (>100 seizures per day). A total of 21 female mice and 28 males were used for the completion of EEG experiments. In assessing mortality, there were no differences in sex distribution (data not shown). Long-term dosing for histological analysis was started when mice were 4 weeks of age. A total of 21 mice were designated for histological analysis, including 10 females and 11 males.
Primary Neuronal Culture
Embryonic cortical and hippocampal neurons were prepared and cultured in 12-well plates as previously described (Muddashetty et al., 2007). Ren and scrambled siRNA were transfected by magnetofection using Neuromag Transfection Reagent (Oz Biosciences, San Diego, CA) according to the manufacturer’s protocol. Briefly, 1 μg siRNA and 3.5 μl Neuromag beads were added to each well of a 12-well plate 8 days after plating. After 15 minutes of incubation on the magnetic plate, neurons were cultured for 3 days prior to drug treatment and lysis.
Antibodies and siRNAs
The following primary antibodies were utilized from Cell Signaling Technology (Danvers, MA, USA) for Western blotting and immunoprecipitations: CRKL (Cat: 38710, RRID:AB_2799138), IgG (Cat: 2729, RRID: AB_1031062), AKT (Cat: 2920, RRID: AB_1147620), pAKT (T308) (Cat: 4056, RRID: AB_331163), pAKT(S473) (Cat: 4060, RRID: AB_329825), pS6 (S240/244) (Cat: 5364, RRID: AB_10694233), S6 (Cat:2317, RRID: AB_2238583), Phospho-p70 S6 Kinase (Cat: 9204, RRID: AB_2265913), pPDK1(Cat:3438, RRID: AB_2161134), PDK1 (Cat: 5662, RRID: AB_10839264) and PTEN (Cat: 9559, RRID: AB_390810). The following additional antibodies were used: Tubulin β-3 (BioLegend, San Diego, CA, Cat: USA-802001, RRID: AB_2564645) and puromycin (The University of Iowa, Iowa City, Iowa, Cat: USA-PMY2A4-S, RRID: AB_2619605).
SiRNAs were obtained as custom stealth RNAi siRNA from Invitrogen Life Technologies, Thermo Scientific (Carlsbad, CA, USA), with the following sequences: PTEN siRNA (5’ to 3’): CAG CCA UCA UCA AAG AGA UCG UUA G, (5’ to 3’): CUA ACG AUC UCU UUG AUG AUG GCU G, Control (5’ to 3’): CAG ACU AAA CUG AGA GCU AUC CUA G, Control (5’ to 3’) CUA GGA UAG CUC UCA GUU UAG UCU G.
Immunoprecipitations
Primary cortical neurons, PC3 cells (ATCC, Manassas, VA, USA, Cat: ATCC CRL-1435, RRID:CVCL_0035) and frozen wild type mouse cortex were lysed and fresh lysates were split at 600 μl between IgG (3 μl) and CRKL (12 μl) antibodies. The lysis buffer was composed of 150 mM NaCl, 1 mM ethylenediaminetetraacetic acid (EDTA), 1% Triton x-100, 50 mM Tris HCI (pH=7.4), 50 mM NaF, 10 mM Na pyrophosphate, and 10 mM Na beta-glycerol phosphate. The samples were rotated at 4°C for 2 hours. Protein A sepharose beads (General Electric Healthcare, Chicago, IL, USA, Cat: GE17-0780-01) were washed with lysis buffer for a total of 3 times. After the 2-hour incubation, 50 μl of beads were added to each sample condition and rotated overnight at 4°C. The following day, each set of beads were washed 3 times with 250 μl of lysis buffer and samples were subjected to western blotting.
Protein Synthesis Assay and GSK Dose Escalation
Serial brain slices were prepared in oxygenated cutting solution (75mM sucrose, 25mM glucose, 87mM NaCI, 25mM NaHCO3, 2.48mM KCl, 1.42mM NaH2PO4, 14.96mM NaH2PO4, 14.96mM MgCl2, 511mM Ascorbate). Hippocampus and somatosensory cortex were dissected and incubated in oxygenated artificial cerebrospinal fluid (25mM glucose, 125mM NaCl, 25mM NaHCO3, 2.5mM KCl, 1.42mM NaH2PO4, and 2.15mM MgCl2) in a 12-well plate for 30 minutes at 31°C.
For dose escalation studies, increasing doses of GSK6A (0 to 10 μM) were added to the wells and incubated for 30 minutes. Samples were then collected in 1.5 milliliter vials and immediately frozen on dry ice.
For protein synthesis assays, GSK6A (1 μM) or vehicle was added to the wells and incubated for 30 minutes. Puromycin (Life Technology, Waltham, MA, Cat: USA-A1113803) (10 mg/ml) was next added to each well of the plate, except for the “no puromycin” control. Samples were then incubated for 40 minutes and immediately frozen on dry ice.
SDS-PAGE and Western Blot Analysis
Protein concentration was determined using Bio-Rad Protein Assay Dye (Hercules, California, USA; Cat: 5000006). Samples were mixed with SDS sample buffer and equal amounts of proteins were loaded in duplicate on SDS-PAGE, and transferred to PVDF Transfer Membrane (Millipore Sigma, Darmstadt, Germany). Membranes were blocked using 5% milk for 1 hour. Antibodies were diluted to the desired concentration in 1% Tween in PBS and incubated overnight at 4°C. Membranes were then washed and incubated with secondary antibody, either Rabbit IgG HRP Linked Whole Antibody (Millipore Sigma, Darmstadt, Germany; Cat: GENA934) or Mouse IgG HRP Linked Whole Antibody (Millipore Sigma, Darmstadt, Germany; Cat: NXA931V). Signals were detected with enhanced chemiluminescence using Pierce ECL Blotting Substrate (Thermo Scientific, Carlsbad, CA, USA, Cat: 32106). If a second detection was needed, blots were stripped using Restore Western Blot Stripping Buffer (Thermo Scientific, Carlsbad, CA, USA, Cat: 21059), blocked again in 5% milk, and incubated overnight with the desired antibody.
Western Blot Quantification
Specific signals on western blots were quantified densitometrically using NIH ImageJ software (Bethesda, Maryland, USA). Signal intensities of phospho-AKT, phospho-S6K, PTEN, and Puromycin were normalized to AKT or β-Tubulin signal on the same blot. Phospho-PDK1 and phospho-S6 signal intensities were normalized to the signal intensities of total PDK1 and S6 on the same blot, respectively. The average of the duplicates was counted as one data point.
Drug Formulation and Administration
GSK2702926A was synthesized at GlaxoSmithKline as previously described by Rivero et al (2014). For intraperitoneal (i.p.) dosing, a dose of 5 mg/kg (0.01 g/ml in 10% dimethyl sulfoxide (DMSO) (BioWorld, Dublin, OH, USA)) was formulated fresh daily from frozen stock in DMSO. Vehicle control was 10% DMSO. For oral dosing, GSK6A was formulated at a dose of 5 mg/kg in Jif® peanut butter. Mouse weights were averaged, and peanut butter pellets were formulated and frozen for an average mouse weight of 23 grams. The average of weight for the mice used in this study was 22.28 grams with an SEM of 0.5988. Mice were observed to ensure ingestion of the pellet, which typically occurred within 5 minutes. 10 μM GSK6A stock in DMSO was formulated to a concentration of 1 μM prior to use. BYL719 (Alpelisib) (VWR International, Radnor, PA, USA) was formulated to a 5 mM stock in DMSO and diluted to 0.05 μM. 2 mM IC87 (IC87114, Millipore Sigma, Darmstadt, Germany) stock was likewise prepared in DMSO and diluted to 2 μM for use.
Nest Building Behavior
Nesting behavior was assessed as previously described (Deacon, 2006) with mice between 7 and 10 weeks of age. Briefly, nestlets were weighed at 0 and 2 hours after addition to a cage with a single-housed mouse. Some mice were subjected to two nesting behavior assays, one prior to the treatment regimen and one at the end of treatment. Both naive and mice with electrode implants were utilized.
Surgical Implantation of Electrodes
Cortical surface electrodes were surgically implanted as previously described (Castro et al., 2012; Tiwari et al., 2019). Briefly, mice were anesthetized in a chamber with 3% isoflurane. Once the mice were confirmed to be at the proper level of anesthesia, the mice were placed on the stereotaxic frame and received maintenance anesthesia at 1% to 2% isoflurane. Two drill holes were created without penetrating the dura for the placement of surface transmitter electrodes (relative to bregma AP= −2.5 mm, L: 2 mm for both sides). The right electrode was used for signal and the left was used for reference. The transmitter device (TA11ETAF-10, Data Sciences International (DSI), Saint Paul, MN, USA) was placed in the subcutaneous pocket spanning from the neck to the left flank. The transmitter electrodes were inserted into the burr holes on the dura without injuring it and fixed into place with Ortho Jet Liquid Powder Kit, (Patterson Dental, Saint Paul, MN, USA). The incision was closed with suture (Coviden, Dublin, Ireland), GLUture (Zoetis Inc., Kalamazoo, Ml, USA) and treated with antibiotic ointment (RARO, Hawthorne, NY, USA).
Seizure Assessment
Approximately five days after cortical surface electrode implant, seizure presence was assessed through EEG recordings using a wireless EEG system from Data Sciences International. NeuroScore™ DSI (St. Paul, MN) software was used for seizure assessment. A seizure was defined as sudden onset of high frequency and amplitude activity (>2x baseline) and a duration greater than ten seconds. Five days of EEG were recorded after seizures had been confirmed to establish baseline seizure frequency before treatment started. The seizures of this model are well-defined, but video monitoring was available if additional confirmation was needed.
EEG Spike and Power Analysis
EEG spikes and power were analyzed during interictal times, at least one hour before or after the last seizure. EEG spikes were detected with a spike detector module in NeuroScore™ using the built-in dynamic threshold protocol to accommodate variations in EEG signal between mice. A spike was defined as having a duration of 5-80ms, with a dynamic threshold ratio of 3-6 and a minimum amplitude of 100 μV. Spikes were analyzed for 2-hour periods during the day (12-6pm) and the night (12-6am), and grooming and other signal artifacts were removed. For power analysis, the raw EEG signal was exported into 10s epochs to generate accumulative power bands from 2 hours of recording during the day (12-6pm) and night (12-6am) and subjected to Fast Fourier Transformation to generate power bands. The EEG signal was split into power bands of various frequencies (shown here: gamma, 24-80 Hz) and normalized to total power to account for baseline differences in EEG signal.
Brain Morphology Assessment
Gfap-Cre; Ptenfl/fl (henceforth, Pten; Gfapdel) mice and littermate controls (Pten+/+; Gfap Cre+) were dosed intraperitoneally daily with either GSK6A or vehicle for four weeks. After the final dose, the brain was dissected and preserved in 4% paraformaldehyde. A few brains were cut in half along the midline. One half was preserved in 4% paraformaldehyde for morphology analyses, whereas hippocampus and cortex were dissected from the other half and flash-frozen for western blot analyses. Brains were embedded in Tissue-Tek OCT compound and sectioned at 16 pm. Brains were then stained via Nissl staining, imaged and measurements of the hippocampus and cortex were obtained via Nikon Elements (Tokyo, Japan, RRID: SCR_014329) software and assessed individually (Gittins and Harrison, 2004) (Cresyl Violet Acetate, Chem-Impex International, Wood Dale, IL). For consistency, slides were numbered during sectioning, medial to lateral. Slide numbers used for each mouse were approximately the same number but bregma levels were confirmed using a brain atlas. Three serial sections per brain were assessed for each mouse at the approximate bregma level of −2 mm. The cortex was assessed using three measurements directly superior to the hippocampus. The position of the three hippocampal measurements are indicated in the figure. In total, nine data points were averaged for each mouse, and each dot on the bar graphs represents this average of one mouse. Contrast and brightness were adjusted for visualization.
Cell Soma Size Assessment
20x magnification images of the CA1 and dentate gyrus were taken for each mouse used for the previously described morphology assessments. The same bregma level and location of regions of interest in the CA1 and the dentate gyrus was chosen for each mouse to minimize variance. Twenty cells were measured for each mouse using ImageJ by measuring both height and width and averaging these measurements. These averages were used as one data point for statistical analyses and visualization. Cells were randomly selected by measuring approximately every third cell counted.
Experimental Design and Statistical Analyses
Statistical analysis was performed with GraphPad Prism 8. Tests were chosen based on the study design for each experiment. Significance is defined as a p value of 0.05 or less. Data was tested for normality with the Shapiro-Wilk test and appropriate parametric or nonparametric tests were performed. For western blot analyses, outliers were identified using the Rout method (Motulsky and Brown, 2006). The majority of data did not have any outliers. If outliers were identified and removed, this is indicated in the figure legend. Comparisons of nest building between untreated Pten; Camkdel mice and wild type littermates were analyzed with Mann-Whitney test. In vitro assays in neuronal cultures were analyzed by two-way ANOVA followed by Sidak’s post hoc tests. Dose escalation studies, seizure frequency, seizure duration and total time seizing were analyzed by two-way ANOVA with repeated measures followed by Sidak’s post hoc tests, daily changes in seizure frequency, EEG power and EEG spike and spike train frequency were analyzed by mixed effect analysis followed by Sidak’s post hoc tests. Effects of drug and treatment on body weight were analyzed using three-way ANOVA with repeated measures followed by Sidak’s post hoc tests. All other assays that involved two genotypes and two different treatments were analyzed by two-way ANOVA with Tukey’s post hoc tests. Sample sizes for molecular studies were determined by power analyses on pilot data using SAS ® v9.4. Sample sizes for seizure and macrocephaly analyses were based on published sample sizes. For all EEG, nesting and morphology studies, the treatment was blinded for the individual administering the drug and analyzing the data until analysis was completed. Each datapoint represents an independent neuronal culture or animal, respectively.
Results
Selective inhibition of p110β rescues increased signal transduction in the context of PTEN deficiency
In PTEN-deficient cancer cells, exaggerated PI3K signaling and tumorigenesis is mainly driven by the class 1a PI3K isoform p110β, but it is unknown if PTEN-deficient neurons have the same isoform-specificity. To answer this question, we assessed the effects of isoform-selective class 1a PI3K inhibitors on cell signaling in PTEN-deficient cultured primary neurons. We chose inhibitors that are highly specific towards one p110 isoform (IC50 at least 40-fold lower than the next lowest IC50) (Table 1), and concentrations were determined based on previous publications and our own pilot experiments ensuring that signaling in wild type neurons was minimally affected as observed with the p110β inhibitor (data not shown). We transfected primary embryonic cortical or hippocampal neurons from wild type mice with a Pten-specific small interfering ribonucleic acid (siRNA) or a scrambled control. The Pfen-selective siRNA significantly reduced PTEN in hippocampal and cortical neurons (Fig. S1A–D). Three days after transfection, cells were exposed for one hour to either vehicle, a p110β-selective inhibitor GSK2702926A (GSK6A) (Lin et al., 2012), or, in two separate experiments, either the p110δ-selective inhibitor IC-87114 (IC87) (Sadhu et al., 2003; Werzowa et al., 2011) (Fig. 1A,B) or the p110α inhibitor Alpelisib (BYL719) (Nehme et al., 2014; Wong et al., 2015) (Fig. 1C,D). Western blot analysis of phosphorylation of AKT at threonine 308, which is a downstream target of the class I PI3K pathway, was used as a readout of the pathway.
Table 1: Isoform-selectivity of GSK2702926A, IC87114, and BYL-719.
IC50 for each compound is listed, showing the high selectivity of each compound to only one class 1A isoform. Data for GSK2702926A were taken from (Gross et al., 2019), data for IC87114 are from (Sadhu et al., 2003), and data for BYL719 are from (Furet et al., 2013).
| GSK2702926A | IC87114 | BYL719 | |
|---|---|---|---|
| P110α | 794 nM | >100 μM | 5 nM |
| p110β | 0.2 nM | 75 μM | 1200 nM |
| P110γ | 1000 nM | 29 μM | 250 nM |
| p110δ | 7.9 nM | 0.5 μM | 290 nM |
Figure 1: Elevated AKT phosphorylation in PTEN-deficient neuronal cultures is reduced to control levels with selective p110β inhibition.

(A, B) Pten siRNA significantly increases AKT phosphorylation at threonine 308 three days after transfection in both primary cortical (A) and hippocampal neurons (B). The p110β inhibitor GSK6A (1μM) reduces AKT phosphorylation to levels comparable to those of control (scramble siRNA-transfected) neurons, whereas the p110δ inhibitor IC87 (2μM) does not reduce AKT phosphorylation (two-way ANOVA with Sidak’s post hoc tests: A, p(interaction)=0.046, F(2,54)=3.26; p(treatment)=0.027, F(2,54)=3.87; p(siRNA)=0.001, F(1,54)=11.98; **p=0.007, *p=0.017, p(GSK)>0.999; n=10; B, p(interaction)=0.084, F(2,52)=2.60; p(treatment)=0.071, F(2,52)=2.78; p(siRNA)<0.0001, F(1,52)=17.47; **p=0.002, *p=0.011, p(GSK)=0.921; n(scr GSK6A)=9, all others n=10). (C, D) In contrast to GSK6A, the p110α inhibitor BYL719 (0.05μM) does not reduce AKT phosphorylation in primary cortical neurons (C). Both GSK6A (1μM) and BYL719 (0.05μM) reduce AKT phosphorylation in primary hippocampal neurons (D) (two-way ANOVA with Sidak’s post hoc tests: C, p(interaction)=0.349, F(2,60)=1.07; p(treatment)=0.001, F(2,60)=7.84; p(siRNA)<0.001, F(1,60)=16.66; *p(vehicle)=0.012, *p(BYL719)=0.016, p(GSK6A)=0.677; n=11; D, p(interaction)=0.476, F(2,60)=0.76; p(treatment)=0.269, F(2,60)=1.34; p(siRNA)=0.001, F(1,60)=11.67; *p(vehicle)=0.014, p(GSK)=0.498, p(BYL)=0.262; n=11). One statistical outlier was removed from B (scr GSK6A); ns: not significant. N are independent neuronal cultures. Error bars represent SEM. Example western blots are shown at the top in each panel.
AKT phosphorylation was significantly elevated in cortical neurons after Pten siRNA transfection compared to scrambled control when treated with vehicle. Increased AKT phosphorylation was reduced to control levels with GSK6A but not with IC87 (Fig. 1A). A similar pattern was observed in primary hippocampal neurons (Fig. 1B). Likewise, the p110α-selective inhibitor BYL719 did not significantly reduce increased signaling in cortical neurons after Pten siRNA transfection under conditions where GSK6A rescued elevated AKT phosphorylation (Fig. 1C). In hippocampal neurons, however, both GSK6A and BYL719 normalized elevated AKT phosphorylation after Pten siRNA transfection (Fig. 1D). Overall, these results suggest that, similar to dividing cancer cells, increased PI3K signaling is mainly mediated by the PI3K isoform p110β, and to a lesser extent by p110α in PTEN-deficient postmitotic neurons.
To assess if the selectivity for p110β is due to changes in expression levels of class 1a PI3K isoforms in PTEN-deficient primary neurons, we next quantified protein and mRNA expression of p110α, β, and δ in cortical and hippocampal primary neurons after transfection with Pten siRNA or scrambled siRNA. Using western blot analyses, we found no significant differences in protein expression for any of the three isoforms (Fig. S1A,B,E,F). qRT-PCR specific for the three isoforms also revealed no significant difference in mRNA levels (Fig. S1G,H).
A direct comparison of expression levels of the three isoforms, which may explain differences in drug sensitivity, is not possible with the methods used here. Apart from differential expression levels, differences in posttranslational regulation by protein binding partners in PTEN-deficient background could provide insight into the mechanisms underlying the differential responses to p110 isoform inhibitors. A recent study in cancer cell lines attributed the mechanism of how p110β drives excessive PI3K signaling when PTEN function is impaired to dysregulation of a protein complex including p110β and the adaptor protein, CRK-like (CRKL). In cancer cells lacking PTEN, CRKL recruits p110β into this protein complex which activates RAC signaling. RAC signaling potentially induces a positive feedback loop after activating p110β (Zhang et al., 2017). To test whether a similar mechanism occurs in neurons, we performed immunoprecipitation studies in PTEN-deficient cancer cells (PC3) and primary neurons that were treated with either scrambled or Pten-specific siRNA. We confirmed an interaction between CRKL and p110β in PC3 cells but did not detect an association in primary neurons (Fig. S2A,B). These results suggest that the mechanisms underlying p110β-selectivity in the context of PTEN deficiency are different in dividing cancer cells and postmitotic neurons. We speculate that other proteins and protein complexes affecting 110β activity, such as p85 or so far unknown protein binding partners may be altered in PTEN-deficient neurons contributing to the heightened sensitivity to p110β-selective inhibition in PTEN-deficient neurons. This hypothesis could be further tested with immunoprecipitations and mass spectrometry in the context of PTEN deficiency in the future.
Selective inhibition of p110β reduces aberrant PI3K signaling and protein synthesis in neuron-specific Pten mutant mice
After confirming that p110β-selective inhibition rescues aberrant AKT phosphorylation in PTEN-deficient primary cortical and hippocampal neurons, we assessed cell signaling and protein synthesis in vivo in CamKIIα-Cre;Ptenfl/fl (henceforth Pten; CamKdel) mice. The CaMKIIα promoter targets forebrain excitatory neurons starting around postnatal day 14 (Tsien et al., 1996). Pten; CamKdel mice have impairments in spatial memory and synaptic plasticity (Sperow et al., 2012), as well as spontaneous recurrent seizures reported to start at 5-6 weeks of age (McMahon et al., 2012).
Acute sections of either somatosensory cortex or hippocampus were exposed to increasing doses of GSK6A in oxygenated artificial cerebrospinal fluid for 30 minutes. Pten; CamKdel mice have increased AKT phosphorylation compared with littermate controls in both cortical and hippocampal slices (Fig. 2A,B). As the concentration of GSK6A increases, AKT phosphorylation decreases proportionately in Pten; CamKdel mice. Although there is a decrease in AKT phosphorylation in the littermate controls, the decrease is smaller and not proportionate to the dose of GSK6A (Fig. 2A,B). This suggests p110β is driving or partially driving aberrant PI3K signaling in PTEN-deficient cortex and hippocampus.
Figure 2: Selective p110β inhibition normalizes aberrant cell signaling and protein synthesis associated with PTEN deficiency in acute cortical and hippocampal mouse brain slices.

(A,B) A dose-response curve assessing the effect of 30 minute treatment with GSK6A on AKT phosphorylation in acute cortical (A) and hippocampal (B) slices from Pten; CamKdel mice and their littermate controls illustrates that the p110β inhibitor GSK6A reduces AKT phosphorylation in a dose-dependent manner in Pten; CamKdel mice. This dose-dependent decrease is less pronounced in control littermates (repeated measures two-way ANOVA with Sidak’s post hoc tests: A, p(interaction)=0.022, F(5,60)=2.85; p(treatment)<0.0001, F(5,60)=8.37; p(genotype)=0.894, F(1,12)=0.02; p(subject)=0.605, F(12,60)=0.85; *p=0.025; n=8 (Pten; CamKdel) and 6 (control); B, p(interaction)=0.008, F(5,50)=3.56; p(treatment)<0.001, F(5,50)=6.83; p(genotype)=0.149, F(1,10)=2.49; p(subject)=0.998, F(10,50)=0.16; *p=0.030; n=7 (Ren] CamKdel) and 5 (control)). (C,D) 1μM GSK6A significantly reduces elevated protein synthesis rates in cortical (C) and hippocampal (D) slices from Pten; CamKdel mice after 30 minutes of exposure (two-way ANOVA with Tukey’s post hoc tests: C, p(interaction)=0.188, F(1,26)=1.83; p(treatment)=0.066, F(1,26)=3.68; p(genotype)=0.001, F(1, 26)=13.62; **p=0.007; n=8 (Pten; CamKdel) and 7(control); D, p(interaction)<0.001, F(1,23)=14.82; p(treatment)=0.031, F(1,23)=5.28; p(genotype)<0.0001, F(1,23)=44.3; ****p<0.0001, **p=0.002; *p=0.022; n(Pten; CamKdel vehicle)=6, all others n=7). Puromycin-specific signal was normalized to AKT. V=vehicle, G=GSK6A, No=no Puromycin. (E,F) 1μM GSK6A reduces elevated AKT phosphorylation in cortical (E) and hippocampal (F) slices from Pten; CamKdel mice after 70 minutes of exposure (two-way ANOVA with Tukey’s post hoc tests: E, p(interaction)=0.064, F(1,26)=3.75; p(treatment)=0.095, F(1,26)=3.00; p(genotype)=0.002, F(1,26)=11.88; **p=0.004; n=8 (Pten; CamKdel) and 7 (control); F, p(interaction)=0.022, F(1,20)=6.21; p(drug)=0.014, F(1,20)=7.27; p(genotype)=0.027, F(1,20)=5.67; *p=0.013, **p=0.008; n=6). One statistical outlier was removed from D (vehicle Pten; CamKdel). N denotes individual animals. Error bars represent SEM. Representative western blots shown at top in each panel.
Next, we assessed protein synthesis, which is regulated by PI3K/mTOR signaling, in acute cortical and hippocampal slices using puromycin labeling of newly synthesized proteins (Gross et al., 2019; Schmidt et al., 2009). There was a significant increase in protein synthesis rates in Pten; CamKdel cortical slices compared with cortical slices from littermate controls (Fig. 2C). The addition of GSK6A to Pten; CamKdel cortical slices reduced protein synthesis to levels comparable to littermate controls (Fig. 2C). In hippocampal slices, there also was a significant increase in protein synthesis in Pten, CamKdel slices, which was significantly decreased with GSK6A but remained increased compared to vehicle control (Fig. 2D).
We next assessed AKT phosphorylation in the slices used for protein synthesis assays. In both hippocampal and cortical Pten; CamKdel slices, AKT phosphorylation was increased compared with littermate slices, and GSK6A reduced AKT phosphorylation to levels comparable to littermate controls (Fig. 2E,F).
P110 isoform protein expression is unchanged in Pten; CamKdel mice
Western blot analyses confirmed a decrease in PTEN in cortex and hippocampus of Pten; CamKdel mice compared with littermate controls (Fig. S3A–D). Similar as in cultured neurons, western blot assessment of p110α, β, or δ revealed no significant differences in protein expression between Pten, CamKdel mice and controls (Fig. S3A,B,E,F).
One acute dose of GSK6A in vivo reduces aberrant AKT phosphorylation in Pten; CamKdel mice
To test if GSK6A could be used to assess the effect of p110β-selective inhibition on seizure and behavioral phenotypes in PTEN-deficient mice, we next administered GSK6A in vivo to Pten; CamKdel mice. This dose was based on recommendations from the manufacturer and our previous results in a mouse model for FXS (Gross et al., 2019). AKT phosphorylation was increased in the cortex of Pten; CamKdel mice and one dose of GSK6A (5 mg/kg) administered intraperitoneally (i.p.) significantly reduced AKT phosphorylation to littermate control levels after one hour (Fig. 3A,B). Similarly, elevated AKT phosphorylation in the hippocampus of Pten; CamKdel mice was significantly reduced to littermate control levels after one dose of GSK6A (Fig. 3C,D).
Figure 3: Administration of GSK6A reduces elevated AKT phosphorylation and increases survival in Pten; CamKdel mice.

(A-D) Intraperitoneal injection of 5mg/kg GSK6A reduces elevated AKT phosphorylation in Pten; CamKdel mice to levels comparable to littermate controls in both cortical (A,B) and hippocampal lysates (C,D) one hour after dose administration (two-way ANOVA with Tukey’s post hoc test: B, p(interaction)=0.020, F(1,8)=8.35; p(treatment)=0.045, F(1,8)=5.62; p(genotype)=0.009, F(1,8)=11.63; *p=0.024; **p=0.009; D, p(interaction)=0.033, F(1,8)=6.61; p(treatment)=0.069, F(1,8)=4.43; p(genotype)=0.036, F(1,8)=6.36; *p(Pten; CamKdel vehicle - control vehicle)=0.029; *p(Pten; CamKdel vehicle - Pten; CamKdel GSK6A)=0.043). Representative western blots are shown in A and C. (E) Daily intraperitoneal injections of GSK6A significantly increase survival of Pten; CamKdel mice compared to daily injections of vehicle (Kaplan-Meier survival curve comparison, Mantel-Cox test: **p=0.005; n=4 (vehicle) and 5 (GSK6A)). Error bars represent SEM.
Daily administration of GSK6A extends life span in Pten; CamKdel mice
We then started dosing mice daily, as we speculated that chronic treatment may be necessary to elicit effects on seizures. Daily i.p. injections of GSK6A significantly increased survival in Pten; CamKdel mice compared with vehicle (Fig. 3E).
We noticed that daily handling and i.p. injections of the mice during chronic drug treatment led to premature death in Pten; CamKdel mice compared with mice of the same genotype which were not subjected to daily handling (data not shown). One mouse was observed having a seizure and died directly after the injection; however, we are still investigating additional causes to this mortality. In order to successfully deliver GSK6A to Pten; CamKdel mice over long administration periods without increasing mortality, we next took advantage of the oral availability of GSK6A (Gross et al., 2019) by providing the drug in small, single-serve portions of peanut butter. All mice, regardless of genotype, were highly receptive to this dosing technique. No increased lethality was observed with this dosing strategy. Based on recommendations from the manufacturer, two different doses were initially tested (2.5 mg/kg and 5 mg/kg). The higher dose was chosen due to increased efficacy to reduce AKT phosphorylation to control levels in these pilot studies and based on recommendations by GlaxoSmithKline (Fig. S4).
Daily oral administration of GSK6A improves nest building behavior and reduces aberrant PI3K signaling in Pten; CamKdel mice
We next assessed how chronic oral treatment with GSK6A affects nest building behavior in Pten; CamKdel mice. Nest building has been shown to be altered in mouse models of neurodevelopmental disorders (Gross et al., 2015), but to our knowledge, has not been assessed in mice with neuronal PTEN deficiency yet. Here, we show that Pten; CamKdel mice shred on average less nest building material compared with littermate controls (Fig. 4A). One week of daily oral administration of GSK6A significantly increases nest building behavior in Pten; CamKdel mice compared with vehicle-treated Pten; CamKdel mice without affecting littermate controls (Fig. 4B). Note that some of the mice had EEG electrodes implanted during nesting.
Figure 4: GSK6A improves nest building behavior and reduces aberrant PI3K signaling in Pten; CamKdel mice.

(A) Pten; CamKdel mice shred significantly less nesting material than their littermate controls during a 2-hour period (Mann-Whitney test, **p=0.002, n(Pten; CamKdel)=16, n(control)=8). (B) Daily oral administration of GSK6A in peanut butter for one week significantly improves nesting behavior in Pten, CamKdel mice compared with vehicle-treated Pten; CamKdel mice but not in littermate controls (two-way ANOVA with Tukey’s post hoc tests: p(interaction)=0.030, F(1,42)=5.05; p(treatment)=0.017, F(1,42)=6.2; p(genotype)=0.471, F(1,42)=0.53; **p=0.004; n=14 (Pten; CamKdel-Vehicle), 13 (Pten; CamKdel-GSK6A), 9 (Control-Vehicle), 10 (Control-GSK6A)). (C,D) Representative western blots from the cortex (C) and hippocampus (D) collected from mice after one week of daily oral GSK6A or vehicle administration. (E) GSK6A reduces elevated PDK1 phosphorylation in Pten; CamKdel cortex to littermate control levels (two-way ANOVA with Tukey’s post hoc tests: p(interaction)=0.173, F(1,24)=1.98; p(treatment)=0.038, F(1,24)=4.84; p(genotype)=0.003, F(1,24)=11.03; *p=0.014; n=7). (F) One week of GSK6A treatment reduces elevated AKT phosphorylation at threonine 308 in Pten;, CamKdel cortex, but phosphorylation levels are still increased compared with vehicle control (two-way ANOVA with Tukey’s post hoc tests: p(interaction)=0.091, F(1,24)=3.11; p(treatment)=0.073, F(1,24)=3.53; p(genotype)<0.0001, F(1,24)=34.01; ****p<0.0001, *p=0.046; n=7). (G) Daily administration of GSK6A for one week significantly reduces elevated AKT phosphorylation at serine 473 in Pten, CamKdel cortex to littermate control levels (two-way ANOVA with Tukey’s post hoc tests: p(interaction)=0.024, F(1,23)=5.84; p(treatment)=0.068, F(1,23)=3.66; p(genotype)=0.010, F(1,23)=7.89; **p=0.007; *p=0.030; n(Pten; CamKdel vehicle)=6, n=7 all other groups). (H) PDK1 phosphorylation is increased in Pten; CamKdel hippocampus compared to littermate controls, which is not corrected by GSK6A (two-way ANOVA with Tukey’s post hoc tests: p(interaction)=0.737, F(1,24)=0.12; p(treatment)=0.134, F(1,24)=2.40; p(genotype)=0.003, F(1,24)=10.99; n=7). (I) GSK6A reduces elevated AKT phosphorylation at threonine 308 in Pten; CamKdel hippocampus to littermate control levels (two-way ANOVA with Tukey’s post hoc tests: p(interaction)=0.044, F(1,24)=4.52; p(treatment)=0.214, F(1,24)=1.63; p(genotype)=0.002, F(1,24)=12.40; **p=0.0028; n=7). (J) GSK6A reduces elevated AKT phosphorylation at serine 473 in Pten; CamKdel hippocampus to littermate control levels (two-way ANOVA with Tukey’s post hoc tests: p(interaction)=0.232, F(1,24)=1.50; p(treatment)=0.065, F(1,24)=3.74; p(genotype)<0.0001, F(1,24)=22.92; **p=0.002; n=7). One statistical outlier was removed in G (Pten; CamKdel vehicle). Error bars represent SEM.
After completion of nest building assays, mice were sacrificed and cortex and hippocampus were used for western blot analyses to quantify PI3K/mTOR signaling (Fig. 4C–J, S5). We first assessed phosphorylation of phosphoinositide-dependent protein kinase 1 (PDK1) as one of the most direct downstream targets of PI3K. We detected significantly increased PDK1 phosphorylation in Pten; CamKdel cortex, which was reduced to littermate control levels after one week of GSK6A administration (Fig. 4E). Interestingly, the effect was less pronounced in the hippocampus, showing a significant effect of genotype on PDK1 phosphorylation and an interaction between genotype and treatment, but no significant differences in pairwise comparisons (Fig. 4H). To distinguish between effects on signaling activity of mTORC1 and mTORC2, we assessed phosphorylation of AKT at threonine 308 (mTORC1) and serine 473 (mTORC2). Both were significantly increased in Pten; CamKdel cortex and hippocampus compared with littermate controls and normalized to vehicle-treated control levels after GSK6A administration, except for pAKT (T308), which was still significantly higher in Pten; CamKdel after GSK6A treatment compared with littermate controls (Fig. 4F,G,I,J). The effect of the drug was more pronounced in cortex (4F,G) compared to hippocampus (4I,J). To further analyze mTORC1 downstream signaling, we quantified phosphorylation of p70 S6 Kinase (S6K) and S6 Ribosomal Protein (S6). We detected significant effects of genotype on phosphorylation of S6K in cortex and hippocampus, with on average increased S6K phosphorylation in PTEN-deficient mice (Fig. S5A–D). We also detected a significant effect of treatment in hippocampus (Fig. S5D, reduction of S6K phosphorylation) but not in cortex (Fig. S5C), and no differences in pairwise comparisons in either tissue. In contrast to previous reports (Chen et al., 2019), we did not detect consistent differences in S6 phosphorylation in either cortex or hippocampus (Fig. S5A,B,E,F). S6 is regulated by many different signaling pathways and can be altered through handling or environment (Biever et al., 2015), which may underlie the lack of baseline differences or drug effects in this study. Of note, Chen et al. (2019) showed that normalization of S6 phosphorylation may not be needed to reduce seizure frequency, justifying our approach to test the effect of p110β inhibition on seizure frequency.
GSK6A reduces seizure frequency in Pten; CamKdel mice
We next assessed how chronic treatment with GSK6A affects seizure activity in Pten; CamKdel mice. A previous study has reported that Pten; CamKdel develop spontaneous recurrent seizures between 5 and 6 weeks of age (McMahon et al., 2012). We first confirmed the seizure phenotype in Pten; CamKdel mice by 24/7 cortical electroencephalography (EEG) and video recording. In our hands, Pten; CamKdel mice started to exhibit class 4-5 tonic-clonic seizures at approximately 8 weeks, but the timing was highly variable (data not shown). To test the effect of GSK6A on seizure frequency, we implanted Pten; CamKdel and littermate controls at 7-8 weeks of age with cortical surface electrodes using a wireless transmitter system. After occurrence of seizures was confirmed by 24/7 video-EEG recording, seizures were recorded for 5 consecutive days to assess baseline seizure frequency. Starting at day 6 after detection of the first seizure, mice were administered once daily with either GSK6A or vehicle for 7 days (in peanut butter, timeline shown in Fig. 5A, example seizure shown in Fig. 5B). A total of 13 control litter mates were subjected to cortical surface electrode implants. No seizures were detected in any of these animals (Table 2).
Figure 5: GSK6A administration reduces seizure frequency in Pten; CamKdel mice.

(A) Timeline depicting experimental design for GSK6A treatment of Pten; CamKdel mice and subsequent seizure assessment. (B) A representative EEG trace showing a spontaneous seizure in a Pten; CamKdel mouse. (C) There is no significant difference in average number of seizures per day for 5 days prior to treatment in the two treatment groups. During the 7 days of treatment, GSK6A significantly reduces average seizure frequency per day compared to vehicle (repeated measures two-way ANOVA with Sidak’s post hoc tests: p(interaction)=0.023, F(1,14)=6.52; p(time)=0.351, F(1,14)=0.93; p(treatment)=0.141, F(1,14)=2.44; p(subject)=0.010, F(1,14)=3.66, *p=0.032; n=8). (D) No difference in seizure frequency at baseline (days 1-5) is detected when comparing the two treatment groups. During treatment, seizure frequency is reduced in GSK6A-treated mice compared to vehicle-treated mice with a significant difference in seizure frequency between groups on the final day of drug administration (day 12) (mixed-effects analysis with Sidak’s post hoc tests: p(time)=0.195, F(11,170)=1.36; p(treatment)=0.087, F(1,16)=3.32; p(time x treatment)=0.036, F(11, 170)=1.95; **p=0.002; vehicle: n=9 for days 1-11, n=8 for day 12; GSK6A: n=9 for days 1-9, n=8 for days 10-11, n=7 for day 12). Treatment days are depicted by a box. Note that mice that were excluded from analysis in C due to premature death at days 10-12 are included in mixed-effects analysis in D. (E) Individual mouse analysis of average seizure frequency per day before and during treatment. (F) Seizure frequency was similar in untreated female and male mice (unpaired t-test: p=0.592, t(18)=0.55; n=9 female; n=11 male). (G) The average duration of seizures per animal was not significantly different between genotype and treatment groups (repeated measures two-way ANOVA with Sidak’s post hoc tests: p(interaction)=0.969, F(1,14)=0.002; p(time)=0.460, F(1, 14)=0.58; p(treatment)=0.423, F(1, 14)=0.68; n=8). (H) Total time of seizure activity during the 5 days of assessment was not significantly different between genotype and treatment groups (repeated measures two-way ANOVA with Sidak’s post hoc tests: p(interaction)=0.754, F(1,14)=0.10; p(time)=0.283, F(1, 14)=1.25; p(treatment)=0.582, F(1,28)=0.32; n=8). Error bars in D represent SEM. Box-and-whisker plots show minimum to maximum (whiskers), 25th to 75th percentile (boxes) and median (line).
Table 2: Mortality throughout EEG studies in Pten; CamKdel mice.
Shown are number of Pten; CamKdel mice (top 4 rows) and control mice (bottom two rows) that completed the study as well as those who died during various stages of the study.
| Mouse Allocation | N |
|---|---|
| Complete | 16 |
| Death Prior to Surgery | 5 |
| Death Prior to Treatment | 13 |
| Death During Treatment | 3 |
| Controls (Survive) | 12 |
| Controls (Fatal) | 1 |
During the 5 days of assessment prior to GSK6A administration, there was no significant difference in the frequency of seizures observed between GSK6A- or vehicle-treatment groups. By contrast, there were significantly fewer seizures in GSK6A-treated mice compared with vehicle-treated mice during the final 5 days of dosing (Fig. 5C). Daily assessment of average seizure frequency showed that the two treatment groups were equal prior to treatment and began to separate after daily treatment started (Fig. 5D, box).
In order to evaluate if the differences seen in response to treatment were due to model variability, we assessed the average seizure frequency for each individual mouse prior to and during the dose administration period. All mice that received vehicle showed an increase in seizures during the treatment period; however, 7 of 8 GSK6A-treated mice showed a decrease in seizure frequency (Fig. 5E). Post hoc, seizure quantity was assessed for the first 5 days of the study and mice were grouped by sex. There was no significant difference in the average frequency of seizures between females and males (Fig. 5F).
Seizure duration was assessed and compared for each treatment group before and after treatment started. There was no significant difference in the average duration of seizures between the two treatment groups before and after treatment (Fig. 5G). The total time spent seizing during the 5 days of assessment was also not significantly different (Fig. 5H).
To further assess the effects of GSK6A on brain activity in Pten; CamKdel mice we analyzed EEG power, spikes and spike trains during interictal phases. The GSK6A-treated mice had overall lower gamma EEG power, and reduced spike and spike train frequency during the last days of treatment compared with vehicle-treated mice (Fig. S6). Due to confounding factors such as cardiac signals (heartbeat) or EEG readings with excessive artifacts and excessive seizures, many mice had to be excluded from this analysis. Although the data supported the excitability-suppressing effect of GSK6A, the low sample number (3 per group) combined with the inherent variability of EEG signal made data interpretation difficult.
Chronic treatment with GSK6A reduces increased AKT phosphorylation and brain weight in Pten; Gfapdel mice
In humans, PTEN mutations have been associated with macrocephaly (Frazier et al., 2015; McBride et al., 2010). The Pten; CamKdel mouse model was originally reported to not have a macrocephaly phenotype (Sperow et al., 2012); therefore, we used a different Pten mouse model for this assessment, Gfap-Cre; Ptenfl/fl (henceforth, Pten; Gfapdel), which has a macrocephaly and neuronal hypertrophy phenotype (Backman et al., 2001; Kwon et al., 2001). Pten; Gfapdel mice and their littermate controls were treated with either GSK6A or vehicle, administered intraperitoneally, for four weeks, beginning at P28. To confirm the effectiveness of the drug to reduce signaling and exclude compensation effects after chronic treatment, we performed western blot analyses of cortical and hippocampal lysates of some of these mice. These analyses showed that Pten; Gfapdel mice have a similar decrease in PTEN and increase in AKT phosphorylation as seen in Pten; CamKdel mice, which was reduced to or below control levels after daily dosing with GSK6A for four weeks (Fig. 6A–F).
Figure 6: Chronic GSK6A administration reduces enhanced AKT phosphorylation and normalizes brain weight in Pten; Gfapdel mice.
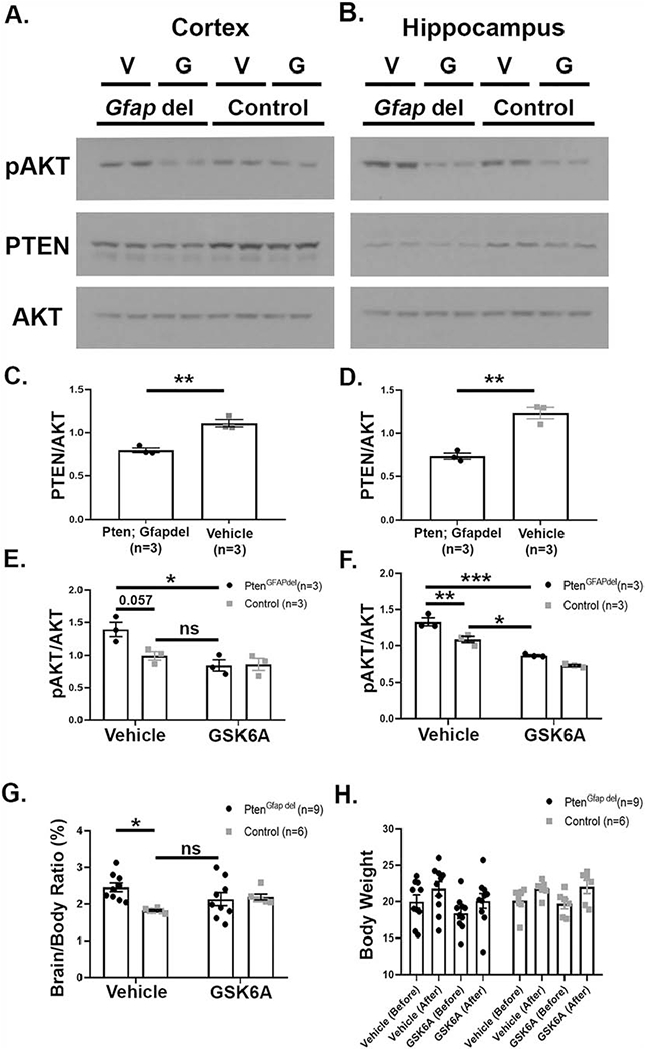
(A-F) PTEN expression is reduced (C,D) and AKT phosphorylation at threonine 308 increased (E,F) in cortex (A,C,E) and hippocampus (B,D,F) of Pten; Gfapdel mice. Four weeks of daily i.p. injections with 5mg/kg GSK6A significantly reduces increased AKT phosphorylation in cortex and hippocampus in Pten; Gfapdel mice (E,F). Representative western blots shown in A (cortex) and B (hippocampus); V=Vehicle, G=GSK6A (C,D unpaired t-tests: C, **p=0.004, t(4)=6.13; D, **p=0.003, t(4)=6.63; n=3; E,F two-way ANOVA with Tukey’s post hoc tests: E, p(interaction)=0.052, F(1,8)=5.23; p(treatment)=0.006, F(1,8)=13.97; p(genotype)=0.068, F(1,8)=4.44; *p=0.012; n=3; F, p(interaction)=0.188, F(1,8)=2.07; p(treatment)<0.0001, F(1,8)=120.9; p(genotype)=0.0008, F(1,8)=27.75; **p=0.006, ***p=0.0001; *p=0.016, n=3). (G) Brain to body weight ratios (expressed in percent) are significantly increased in Pten; Gfapdel mice compared with littermate controls. Chronic GSK6A treatment for 4 weeks reduces ratios to levels comparable to littermate controls (two-way ANOVA with Tukey’s post hoc tests: p(interaction)=0.017, F(1,26)=3.82; p(treatment)=0.254, F(1,26)=1.36; p(genotype)=0.044, F(1,26)=1.36; *p=0.014; n=9 (Pten; Gfapdel) and 6 (control)). (H) Body weight was not significantly altered by genotype or treatment, and all mice gained weight over the 4-week treatment period (repeated measures three-way ANOVA with Sidak’s post hoc tests: p(time)<0.0001, F(1,29)=99.32; p(genotype)=0.343, F(1,29)=0.93; p(treatment)=0.328, F(1,29)=0.99; p(time x genotype)=0.480, F(1,29)=0.51; p(time x treatment)=0.428, F(1,29)=0.65; p(genotype x treatment)=0.395, F(1,29)=0.75; p(time x genotype x treatment)=0.305, F(1,29)=1.09; all pairwise comparisons before-after p<0.003; all pairwise comparisons veh-GSK6A or ctr-PTEN p>0.83, n=7 (Veh Ctr), 6 (GSK6A Ctr), 10 (Veh Pten), 10 (GSK6A Pten)). Error bars represent SEM.
Next, we assessed the brain weight to body weight ratios for Pten; Gfapdel mice as an initial assessment of macrocephaly. The brain-to-body ratio was significantly increased in Pten; Gfapdel mice treated with vehicle compared with littermate controls, which was normalized to littermate control levels with GSK6A (Fig. 6G). Importantly, overall body weight was not affected by genotype or treatment, and all mice gained weight over the 4-week treatment period (Fig. 6H).
GSK6A reduces cortical dysplasia and hippocampal neuronal hypertrophy in Pten; Gfapdel mice
We next analyzed the effects of chronic GSK6A treatment on abnormal morphology of the cortex and hippocampus in Pten; Gfapdel mice. The thickness of the cortical plate of Pten; Gfapdel mice was significantly increased after 4 weeks of vehicle administration compared with littermate controls and reduced to control levels after 4 weeks of GSK6A treatment (Fig. 7A–E). Similar as the cortical plate, the hippocampi of Pten; Gfapdel mice were significantly enlarged in Pten; Gfapdel that received vehicle for four weeks compared with littermate controls. Although there was an overall decrease in hippocampal size after GSK6A treatment in Pten; Gfapdel mice, hippocampi of Pten; Gfapdel mice were still significantly larger than those of vehicle-treated controls (Fig. 7F–K). To test if GSK6A reduced neuronal hypertrophy in the hippocampus, we assessed average soma size of dentate gyrus granule cells and of CA1 pyramidal cells. The average soma size of granule cells of the dentate gyrus, which was significantly enlarged in Pten; Gfapdel mice compared with littermate controls as reported previously (Kwon et al., 2001), was reduced to littermate control levels after GSK6A treatment (Fig. 7L). There were also overall effects of genotype and drug treatment on soma size of CA1 pyramidal neurons, indicating that soma size is increased in the CA1 of PTEN-deficient mice and reduced with GSK6A treatment, but no significant differences in a pairwise comparisons were detected (Fig. 7M).
Figure 7: Intraperitoneal GSK6A administration reduces cortical enlargement and hippocampal soma size to control levels in Pten; Gfapdel mice.

(A-E) The cortices of vehicle-treated Pten; Gfapdel mice are enlarged compared with littermate controls. GSK6A administered at 5mg/kg daily (i.p.) for four weeks reduces cortical enlargement to control levels (E, two-way ANOVA with Tukey’s post hoc tests: p(interaction)=0.062, F(1,26)=3.81; p(drug)=0.254, F(1,26)=1.36; p(genotype)=0.054, F(1,26)=4.08; *p=0.043; n=9 (Pten; Gfapdel), n=6 (control)). Assessments consisted of three measurements directly superior to the hippocampus at bregma level −2 mm in three serial sections per mouse. One data point represents the average of these nine measurements. Example images are shown in A-D, scale bar is 200 pm. (F-K) Hippocampal size is significantly increased in vehicle-treated Pten; Gfapdel mice compared with vehicle-treated control littermates. Chronic GSK6A treatment for 4 weeks shows a trend towards reducing hippocampal size; however, GSK6A-treated Pten; Gfapdel mice still have significantly larger hippocampi than vehicle-treated controls (J, two-way ANOVA withTukey’s post hoc tests: p(interaction)=0.016, F(1,25)=6.71; p(drug)=0.518, F(1,25)=0.43; p(genotype)<0.0001, F(1,25)=37.26; ****p<0.0001, **p=0.004; n=9, Pten; Gfapdel; 8, control). The location of measurements is represented by red lines in (K). Quantifications show averages of all three measurements in three consecutive sections, yielding nine measurements per data point. Example images are shown in F-l; scale bar is 200 pm. (L) Enlarged soma size of granule cells in the dentate gyrus of Pten; Gfapdel mice is reduced to vehicle control levels after chronic GSK6A treatment (two-way ANOVA with Tukey’s post hoc tests: p(interaction)=0.865, F(1,22)=0.03; p(drug)=0.109, F(1,22)=2.78; p(genotype)=0.0001, F(1,22)=21.26; **p=0.0095; n=6 (Veh Ctr), 7 (GSK Ctr), 8 (Veh, Pten), 5 (GSK, Pten)). (M) Soma size of pyramidal cells in the CA1 region is significantly increased in Pten; Gfapdel mice compared with littermate controls and significantly reduced in both groups after chronic GSK6A treatment. No significant differences in pairwise comparisons were detected (two-way ANOVA with Tukey’s post hoc tests: p(interaction)=0.521, F(1,22)=0.43; p(drug)=0.042, F(1,22)=4.65; p(genotype)=0.019, F(1,22)=6.37; n=6 (Veh Ctr), 7 (GSK Ctr), 8 (Veh Pten), 5 (GSK Pten)). The location of soma size measurements for L and M is depicted by the red boxes in I. Error bars represent SEM.
Discussion
In this work, we have demonstrated that inhibition of one of the four class 1 PI3K catalytic isoforms expressed in the brain, p110β, reduces molecular defects and seizures, and normalizes nesting behavior, cortical plate thickness and hippocampal neuronal hypertrophy in mice with neuron-specific PTEN deficiency. Our results create a compelling argument for investigation of p110β inhibition as potential treatment strategy in humans with PTEN mutations accompanied by macrocephaly and seizures. Together with our previous studies in FXS, they also provide strong evidence that p110β may be a key player and shared treatment target in different types of monogenic brain disorders.
PI3K is the enzymatic counteractor of PTEN’s lipid phosphatase activity. Inhibition of PI3K is thus expected to correct the core molecular defect caused by loss of PTEN in neurons; however, PI3K activity also plays roles in other processes that are essential for normal body function, such as cell proliferation, survival and migration. Here, we took advantage of the fact that there are three closely related class 1a isoforms expressed throughout the body including the brain, which have unique and overlapping functions (Vanhaesebroeck et al., 2010). A previous study has shown that these isoforms can compensate for loss or reduction of one isoform for essential cellular functions such as proliferation and survival (Foukas et al., 2010), suggesting that a single isoform-targeted strategy may not have severe side effects. In line with this assumption, we did not detect any detrimental effects on overall health in the mice as assessed by daily health monitoring and tri-weekly body weight recordings. Of note, chronic inhibition of the downstream target mTOR inhibitor, which is currently evaluated as treatment strategy for individuals with PTEN mutations in clinical trials, has been shown to significantly decrease body weight in PTEN-deficient mice (Sunnen et al., 2011; Zhou et al., 2009), whereas four weeks of daily GSK6A treatment did not affect body weight in mice. Longer term studies are needed to further evaluate the effect of chronic p110β inhibition on body weight and overall health, and whether it may have fewer side effects than mTOR inhibition.
Our results provide evidence that selectively inhibiting one specific PI3K isoform in PTEN-deficient brain disorders while leaving the others intact improves PTEN-associated neuronal phenotypes in mice. This suggests that the other isoforms, p110α, γ and δ, do not compensate for reduced p110β in the context of neuronal function, and that p110β may have a unique role in mediating dysregulated neuronal PI3K/AKT signaling defects in PTEN-associated neurodevelopmental brain disorders. This hypothesis is further supported by our in vitro studies indicating that, similar to dividing tumor cells, molecular defects associated with PTEN-deficiency in postmitotic neurons are largely mediated by p110β but not the other class 1a PI3K isoforms (Jia et al., 2008). Interestingly, p110α inhibition with BYL790 also reduced increased AKT phosphorylation in PTEN-deficient hippocampal neurons (but not in cortical neurons), suggesting that, similar to cancer, depending on the cell type and environment, p110α can mediate PTEN-associated defects (Berenjeno et al., 2012). In line with this assumption, our biochemical and brain morphological analyses show slight differences in the effect of GSK6A on cortical versus hippocampal signal transduction and dysplasia. Although phenotypes were reduced in both brain regions with the drug, the effects in the cortex were often more pronounced than in the hippocampus, suggesting that apart from p110β an additional PI3K isoform, most likely p110α, plays a role in altered signaling in PTEN-deficient hippocampal neurons. It is unclear whether the p110α inhibitor BYL790 crosses the blood brain barrier and whether the efficiency to cross it is comparable to GSK6A’s. To our knowledge, no other brain-permeable p110α inhibitor has been reported. We were thus not able to compare the efficacies of these two drugs in vivo. Concentrations used for in vitro studies were chosen based on previous publications and our pilot experiments. Limitations of this study are that we did not test higher concentrations of the other isoform-selective inhibitors in vitro and that we were not able to assess the effect of p110α inhibition in vivo. While our results support p110β as a potential treatment for PTEN-associated epilepsy, we cannot rule out that p110α or p110δ inhibition would be beneficial as well. Future studies are needed to further evaluate the efficacy of the other PI3K isoforms.
We showed that p110β inhibition over several days reduced the occurrence of spontaneous seizures in Pten; CamKdel mice. The treatment effects were consistent overall (all vehicle-treated mice had increased seizure frequency, whereas 7 out of 8 GSK6A-treated mice had reduced seizure frequency after treatment), but there was high variability in this model. For example, the age of seizure onset differed between mice. Although mice were implanted at the same age, in some mice, we detected seizures at the day after implantation, whereas in others it took up to 18 days until a first seizure was detected. While all mice had spontaneous seizures for at least five days until treatment started, we cannot exclude that the variability in time seizing before treatment influenced the effectiveness of the drug. Moreover, the mortality rate for this procedure was high (Table 2), and the quantity of seizures an individual mouse experienced was also highly variable. Although the study was blinded, these factors could potentially skew the results. Seizures were reduced but not eliminated with GSK6A, and future studies are needed to evaluate if prolonged treatment or a combinatorial approach targeting two different PI3K isoforms may further reduce or even stop seizures. A previous study has shown that inhibition of all class I PI3K isoforms (p110α,β,γ,δ) using a pan PI3K inhibitor suppresses seizures in epilepsy caused by mutations in the gene coding for p110α, PIK3CA (Roy et al., 2015). While broad inhibition of all PI3K activity is most likely not feasible as a clinical therapy because of detrimental side effects, this research, together with our results that a p110α-selective inhibitor reduces AKT phosphorylation in PTEN-deficient hippocampal neurons in vitro, suggests that p110α activity may contribute to the seizure phenotype and that a combination of p110β and p110α inhibitors could lead to a more comprehensive reduction of seizures. This strategy should be tested in the future, when brain-permeable p110α inhibitors become available.
Our experiments do not show whether p110β inhibition is merely anti-convulsant or has a disease-modifying effect. To address this question, additional assessments of seizure frequency after GSK6A treatment has ended are required. Due to the high mortality rate of the model, however, we were not able to assess longer time periods. The present study was designed to mimic a treatment in humans, which would start after the occurrence of seizure symptoms. Future studies could evaluate if an earlier, pre-symptomatic start of treatment has disease-modifying effects in these mice. Alternatively, a potential disease-modifying effect after treatment has ended could be tested in another, less severe mouse model of reduced neuronal PTEN expression.
A four-week treatment with GSK6A starting at P28 reduced cortical plate thickness, dentate granule cell and CA1 pyramidal cell soma size, as well as the brain to body weight ratio in a mouse model for PTEN-associated focal dysplasia to control levels; by contrast, GSK6A only partially reduced hippocampal size, which was still significantly larger than in vehicle-treated controls. The fact that p110β inhibition did normalize dentate granule cell soma size and had a moderate effect on CA1 pyramidal soma size and overall hippocampal size suggests that extended treatment may be required for a comprehensive rescue of hippocampal morphology. Alternatively, a combinatorial treatment approach using p110β and p110α inhibitors, as discussed above in the context of seizures, could be used. Of note, although the PTEN deletion in neurons of the dentate gyrus and the CA1 is extensive, not every cell is a Pten knockout cell. The detected effects might thus have been diluted with a small percentage of wild type cells. Several mouse models of neuronal PTEN deficiency have been subjected to mTOR inhibition with rescue of many phenotypes, including seizures and macrocephaly (Chen et al., 2019; Getz et al., 2016; Kwon et al., 2003; Ljungberg et al., 2009; Sunnen et al., 2011; Zhou et al., 2009). This work argues in favor of mTOR inhibition for individuals with brain disorders caused by PTEN mutations; however, mTOR is several steps downstream of PTEN. Notably, both inhibition of mTORCI or mTORC2 has been shown to be effective in mouse models (Chen et al., 2019; Nguyen et al., 2015). The approach of the present study is expected to restore deficits further upstream, reduces mTORCI- and mTORC2-mediated signaling, and may thus be used as an alternative or add-on strategy. It has been shown in PTEN-deficient neuronal cultures that AKT inhibition is more efficient at rescuing hypertrophy than mTOR inhibition, arguing in favor of inhibition upstream of mTOR (Nikolaeva et al., 2017). Future studies in mouse models are needed to directly compare the efficacy of both treatment strategies and to compare the potential negative side effects.
Our study may have impact beyond PTEN-associated epilepsy because it supports an important role of p110 isoforms in brain function and development. The PI3K/mTOR pathway is a hotspot of mutations and alterations in several neurodevelopmental disorders, including autism and epilepsy, and in most cases the molecular defect or mutation is upstream of mTOR (Crino, 2016; Gross and Bassell, 2014; Iffland et al., 2019; Poopal et al., 2016; Rademacher and Eickholt, 2019; Schick et al., 2006; Schick et al., 2007). Class I PI3K isoforms signal upstream of mTOR, play unique isoform-specific roles in the body, in particular in the brain and signal downstream of certain membrane receptors (Gross and Bassell, 2014; Vanhaesebroeck et al., 2010). These functions also tie p110 isoforms to specific neuronal disorders: p110α is associated with Alzheimer’s disease (Bosco et al., 2011), p110β is a molecular defect and promising treatment target in FXS (Gross et al., 2019) and possibly other forms of autism (Cusco et al., 2009), and p110δ is altered in schizophrenia (Law et al., 2012). Our work further advocates for the investigation of potential usage of PI3K isoform-specific inhibition to treat disease mechanisms in neurological disorders.
Supplementary Material
Highlights.
A strategy used in PTEN mutated cancer was tested in mice with PTEN-linked epilepsy.
PI3K isoform p110β inhibition normalized protein synthesis in PTEN-deficient brains.
p110β inhibition reduced seizures in mice with neuron-specific PTEN deletion.
Macrocephaly phenotypes were partially rescued with p110β inhibition.
PI3K isoform inhibition may be a treatment for several neurological disorders.
Acknowledgements
This research was supported by NIH grants 1R21HD093033 (CG), 1R01NS092705 (CG), and 2R01NS065020 (SCD), NIH NCATS Award UL1 TR001425, and a NARSAD Independent Investigator Award from the Brain and Behavior Research Foundation (CG). The authors would like to thank Andrea Shugar, Andrew Snider, Jeffrey Rymer, and Lindsay Carter for their technical assistance, Dr. Paul Horn for statistical power analyses performed for molecular studies, and Dr. Gary Bassell for helpful comments on an earlier version of this manuscript. The authors would like to acknowledge Jonah White for the idea of using peanut butter for delivery of oral compounds in an environment which does not evoke stress. We would also like to thank Dr. Matthew Weston for the donation of Pten; Gfapdel mice and Dr. Ralph Rivero for the contribution of GSK6A. GSK6A was obtained through a Material T ransfer Agreement from GlaxoSmithKline. All studies were conducted in accordance with the GSK Policy on the Care, Welfare and Treatment of Laboratory Animals and were approved by the Institutional Animal Care and Use Committee at CCHMC. GSK6A is covered by US patents 20130157977A1 and 8778937B2.
Footnotes
Publisher's Disclaimer: This is a PDF file of an unedited manuscript that has been accepted for publication. As a service to our customers we are providing this early version of the manuscript. The manuscript will undergo copyediting, typesetting, and review of the resulting proof before it is published in its final form. Please note that during the production process errors may be discovered which could affect the content, and all legal disclaimers that apply to the journal pertain.
Declarations of Interest: None
References
- Backman SA, Stambolic V, Suzuki A, Haight J, Elia A, Pretorius J, Tsao MS, Shannon P, Bolon B, Ivy GO, Mak TW, 2001. Deletion of Pten in mouse brain causes seizures, ataxia and defects in soma size resembling Lhermitte-Duclos disease. Nat Genet. 29, 396–403. 10.1038/ng782 [DOI] [PubMed] [Google Scholar]
- Berenjeno IM, Guillermet-Guibert J, Pearce W, Gray A, Fleming S, Vanhaesebroeck B, 2012. Both p110alpha and p110beta isoforms of PI3K can modulate the impact of loss-of-function of the PTEN tumour suppressor. Biochem J. 442, 151–9. 10.1042/BJ20111741 [DOI] [PMC free article] [PubMed] [Google Scholar]
- Biever A, Valjent E, Puighermanal E, 2015. Ribosomal Protein S6 Phosphorylation in the Nervous System: From Regulation to Function. Front Mol Neurosci. 8, 75 10.3389/fnmol.2015.00075 [DOI] [PMC free article] [PubMed] [Google Scholar]
- Bosco D, Fava A, Plastino M, Montalcini T, Pujia A, 2011. Possible implications of insulin resistance and glucose metabolism in Alzheimer’s disease pathogenesis. J Cell Mol Med. 15, 1807–21. 10.1111/j.1582-4934.2011.01318.x [DOI] [PMC free article] [PubMed] [Google Scholar]
- Butler MG, Dasouki MJ, Zhou XP, Talebizadeh Z, Brown M, Takahashi TN, Miles JH, Wang CH, Stratton R, Pilarski R, Eng C, 2005. Subset of individuals with autism spectrum disorders and extreme macrocephaly associated with germline PTEN tumour suppressor gene mutations. J Med Genet. 42, 318–21. 10.1136/jmg.2004.024646 [DOI] [PMC free article] [PubMed] [Google Scholar]
- Carnero A, Blanco-Aparicio C, Renner O, Link W, Leal JF, 2008. The PTEN/PI3K/AKT signalling pathway in cancer, therapeutic implications. Curr Cancer Drug Targets. 8, 187–98. [DOI] [PubMed] [Google Scholar]
- Castro OW, Santos VR, Pun RY, McKlveen JM, Batie M, Holland KD, Gardner M, Garcia-Cairasco N, Herman JP, Danzer SC, 2012. Impact of corticosterone treatment on spontaneous seizure frequency and epileptiform activity in mice with chronic epilepsy. PLoS One. 7, e46044 10.1371/journal.pone.0046044 [DOI] [PMC free article] [PubMed] [Google Scholar]
- Chen CJ, Sgritta M, Mays J, Zhou H, Lucero R, Park J, Wang IC, Park JH, Kaipparettu BA, Stoica L, Jafar-Nejad P, Rigo F, Chin J, Noebels JL, Costa-Mattioli M, 2019. Therapeutic inhibition of mTORC2 rescues the behavioral and neurophysiological abnormalities associated with Pten-deficiency. Nat Med. 25, 1684–1690. 10.1038/s41591-019-0608-y [DOI] [PMC free article] [PubMed] [Google Scholar]
- Crino PB, 2016. The mTOR signalling cascade: paving new roads to cure neurological disease. Nat Rev Neurol. 12, 379–92. 10.1038/nrneurol.2016.81 [DOI] [PubMed] [Google Scholar]
- Cusco I, Medrano A, Gener B, Vilardell M, Gallastegui F, Villa O, Gonzalez E, Rodriguez-Santiago B, Vilella E, Del Campo M, Perez-Jurado LA, 2009. Autism-specific copy number variants further implicate the phosphatidylinositol signaling pathway and the glutamatergic synapse in the etiology of the disorder. Hum Mol Genet. 18, 1795–804. 10.1093/hmg/ddp092 [DOI] [PMC free article] [PubMed] [Google Scholar]
- Deacon RM, 2006. Assessing nest building in mice. Nat Protoc. 1, 1117–9. 10.1038/nprot.2006.170 [DOI] [PubMed] [Google Scholar]
- Foukas LC, Berenjeno IM, Gray A, Khwaja A, Vanhaesebroeck B, 2010. Activity of any class IA PI3K isoform can sustain cell proliferation and survival. Proc Natl Acad Sci U S A 107, 11381–6. 10.1073/pnas.0906461107 [DOI] [PMC free article] [PubMed] [Google Scholar]
- Frazier TW, Embacher R, Tilot AK, Koenig K, Mester J, Eng C, 2015. Molecular and phenotypic abnormalities in individuals with germline heterozygous PTEN mutations and autism. Mol Psychiatry. 20, 1132–8. 10.1038/mp.2014.125 [DOI] [PMC free article] [PubMed] [Google Scholar]
- Furet P, Guagnano V, Fairhurst RA, Imbach-Weese P, Bruce I, Knapp M, Fritsch C, Blasco F, Blanz J, Aichholz R, Hamon J, Fabbro D, Caravatti G, 2013. Discovery of NVP-BYL719 a potent and selective phosphatidylinositol-3 kinase alpha inhibitor selected for clinical evaluation. Bioorganic & Medicinal Chemistry Letters. 23, 3741–3748. 10.1016/j.bmcl.2013.05.007 [DOI] [PubMed] [Google Scholar]
- Getz SA, DeSpenza T Jr., Li M, Luikart BW, 2016. Rapamycin prevents, but does not reverse, aberrant migration in Pten knockout neurons. Neurobiol Dis. 93, 12–20. 10.1016/j.nbd.2016.03.010 [DOI] [PMC free article] [PubMed] [Google Scholar]
- Gittins R, Harrison PJ, 2004. Neuronal density, size and shape in the human anterior cingulate cortex: a comparison of Nissl and NeuN staining. Brain Res Bull. 63, 155–60. 10.1016/j.brainresbull.2004.02.005 [DOI] [PubMed] [Google Scholar]
- Goffin A, Hoefsloot LH, Bosgoed E, Swillen A, Fryns JP, 2001. PTEN mutation in a family with Cowden syndrome and autism. Am J Med Genet. 105, 521–4. [DOI] [PubMed] [Google Scholar]
- Gross C, Banerjee A, Tiwari D, Longo F, White AR, Allen AG, Schroeder-Carter LM, Krzeski JC, Elsayed NA, Puckett R, Klann E, Rivero RA, Gourley SL, Bassell GJ, 2019. Isoform-selective phosphoinositide 3-kinase inhibition ameliorates a broad range of fragile X syndrome-associated deficits in a mouse model. Neuropsychopharmacology. 44, 324–333. 10.1038/s41386-018-0150-5 [DOI] [PMC free article] [PubMed] [Google Scholar]
- Gross C, Bassell GJ, 2012. Excess protein synthesis in FXS patient lymphoblastoid cells can be rescued with a p110beta-selective inhibitor. Mol Med. 18, 336–45. 10.2119/molmed.2011.00363 [DOI] [PMC free article] [PubMed] [Google Scholar]
- Gross C, Bassell GJ, 2014. Neuron-specific regulation of class I PI3K catalytic subunits and their dysfunction in brain disorders. Front Mol Neurosci. 7, 12 0.3389/fnmol.2014.00012 [DOI] [PMC free article] [PubMed] [Google Scholar]
- Gross C, Nakamoto M, Yao X, Chan CB, Yim SY, Ye K, Warren ST, Bassell GJ, 2010. Excess phosphoinositide 3-kinase subunit synthesis and activity as a novel therapeutic target in fragile X syndrome. J Neurosci. 30, 10624–38. 10.1523/jneurosci.0402-10.2010 [DOI] [PMC free article] [PubMed] [Google Scholar]
- Gross C, Raj N, Molinaro G, Allen AG, Whyte AJ, Gibson JR, Huber KM, Gourley SL, Bassell GJ, 2015. Selective Role of the Catalytic PI3K Subunit p110beta in Impaired Higher Order Cognition in Fragile X Syndrome. Cell Rep. 11, 681–8. 10.1016/j.celrep.2015.03.065 [DOI] [PMC free article] [PubMed] [Google Scholar]
- Iffland PH 2nd, Carson V, Bordey A, Crino PB, 2019. GATORopathies: The role of amino acid regulatory gene mutations in epilepsy and cortical malformations. Epilepsia. 60, 2163–2173. 10.1111/epi.16370 [DOI] [PMC free article] [PubMed] [Google Scholar]
- Jia S, Liu Z, Zhang S, Liu P, Zhang L, Lee SH, Zhang J, Signoretti S, Loda M, Roberts TM, Zhao JJ, 2008. Essential roles of PI(3)K-p110beta in cell growth, metabolism and tumorigenesis. Nature. 454, 776–9. nature07091 10.1038/nature07091 [DOI] [PMC free article] [PubMed] [Google Scholar]
- Kwon CH, Luikart BW, Powell CM, Zhou J, Matheny SA, Zhang W, Li Y, Baker SJ, Parada LF, 2006. Pten regulates neuronal arborization and social interaction in mice. Neuron. 50, 377–88. S0896-6273(06)00220-0 10.1016/j.neuron.2006.03.023 [DOI] [PMC free article] [PubMed] [Google Scholar]
- Kwon CH, Zhu X, Zhang J, Baker SJ, 2003. mTor is required for hypertrophy of Pten-deficient neuronal soma in vivo. Proc Natl Acad Sci U S A. 100, 12923–8. 10.1073/pnas.2132711100 [DOI] [PMC free article] [PubMed] [Google Scholar]
- Kwon CH, Zhu X, Zhang J, Knoop LL, Tharp R, Smeyne RJ, Eberhart CG, Burger PC, Baker SJ, 2001. Pten regulates neuronal soma size: a mouse model of Lhermitte-Duclos disease. Nat Genet. 29, 404–11. 10.1038/ng781 [DOI] [PubMed] [Google Scholar]
- Law AJ, Wang Y, Sei Y, O’Donnell P, Piantadosi P, Papaleo F, Straub RE, Huang W, Thomas CJ, Vakkalanka R, Besterman AD, Lipska BK, Hyde TM, Harrison PJ, Kleinman JE, Weinberger DR, 2012. Neuregulin 1-ErbB4-PI3K signaling in schizophrenia and phosphoinositide 3-kinase-p110delta inhibition as a potential therapeutic strategy. Proc Natl Acad Sci U S A. 109, 12165–70. 1206118109 10.1073/pnas.1206118109 [DOI] [PMC free article] [PubMed] [Google Scholar]
- Lein ES, Hawrylycz MJ, Ao N, Ayres M, Bensinger A, Bernard A, Boe AF, Boguski MS, Brockway KS, Byrnes EJ, Chen L, Chen L, Chen TM, Chin MC, Chong J, Crook BE, Czaplinska A, Dang CN, Datta S, Dee NR, Desaki AL, Desta T, Diep E, Dolbeare TA, Donelan MJ, Dong HW, Dougherty JG, Duncan BJ, Ebbert AJ, Eichele G, Estin LK, Faber C, Facer BA, Fields R, Fischer SR, Fliss TP, Frensley C, Gates SN, Glattfelder KJ, Halverson KR, Hart MR, Hohmann JG, Howell MP, Jeung DP, Johnson RA, Karr PT, Kawal R, Kidney JM, Knapik RH, Kuan CL, Lake JH, Laramee AR, Larsen KD, Lau C, Lemon TA, Liang AJ, Liu Y, Luong LT, Michaels J, Morgan JJ, Morgan RJ, Mortrud MT, Mosqueda NF, Ng LL, Ng R, Orta GJ, Overly CC, Pak TH, Parry SE, Pathak SD, Pearson OC, Puchalski RB, Riley ZL, Rockett HR, Rowland SA, Royall JJ, Ruiz MJ, Sarno NR, Schaffnit K, Shapovalova NV, Sivisay T, Slaughterbeck CR, Smith SC, Smith KA, Smith BI, Sodt AJ, Stewart NN, Stumpf KR, Sunkin SM, Sutram M, Tam A, Teemer CD, Thaller C, Thompson CL, Varnam LR, Visel A, Whitlock RM, Wohnoutka PE, Wolkey CK, Wong VY, Wood M, Yaylaoglu MB, Young RC, Youngstrom BL, Yuan XF, Zhang B, Zwingman TA, Jones AR, 2007. Genome-wide atlas of gene expression in the adult mouse brain. Nature. 445, 168–76. 10.1038/nature05453 [DOI] [PubMed] [Google Scholar]
- Lim JS, Kim WI, Kang HC, Kim SH, Park AH, Park EK, Cho YW, Kim S, Kim HM, Kim JA, Kim J, Rhee H, Kang SG, Kim HD, Kim D, Kim DS, Lee JH, 2015. Brain somatic mutations in MTOR cause focal cortical dysplasia type II leading to intractable epilepsy. Nat Med. 21, 395–400. 10.1038/nm.3824 [DOI] [PubMed] [Google Scholar]
- Lim KC, Crino PB, 2013. Focal malformations of cortical development: New vistas for molecular pathogenesis. Neuroscience. 252, 262–276. 10.1016/j.neuroscience.2013.07.037 [DOI] [PubMed] [Google Scholar]
- Lin H, Erhard K, Hardwicke MA, Luengo JI, Mack JF, McSurdy-Freed J, Plant R, Raha K, Rominger CM, Sanchez RM, Schaber MD, Schulz MJ, Spengler MD, Tedesco R, Xie R, Zeng JJ, Rivero RA, 2012. Synthesis and structure-activity relationships of imidazo[1,2-a]pyrimidin-5(1H)-ones as a novel series of beta isoform selective phosphatidylinositol 3-kinase inhibitors. Bioorg Med Chem Lett. 22, 2230–4. 10.1016/j.bmcl.2012.01.092 [DOI] [PubMed] [Google Scholar]
- Ljungberg MC, Sunnen CN, Lugo JN, Anderson AE, D’Arcangelo G, 2009. Rapamycin suppresses seizures and neuronal hypertrophy in a mouse model of cortical dysplasia. Dis Model Mech. 2, 389–98. 10.1242/dmm.002386 [DOI] [PMC free article] [PubMed] [Google Scholar]
- Maehama T, Dixon JE, 1998. The tumor suppressor, PTEN/MMAC1, dephosphorylates the lipid second messenger, phosphatidylinositol 3,4,5-trisphosphate. J Biol Chem. 273, 13375–8. [DOI] [PubMed] [Google Scholar]
- Mateo J, Ganji G, Lemech C, Burris HA, Han SW, Swales K, Decordova S, DeYoung MP, Smith DA, Kalyana-Sundaram S, Wu J, Motwani M, Kumar R, Tolson JM, Rha SY, Chung HC, Eder JP, Sharma S, Bang YJ, Infante JR, Yan L, de Bono JS, Arkenau HT, 2017. A First-Time-in-Human Study of GSK2636771, a Phosphoinositide 3 Kinase Beta-Selective Inhibitor, in Patients with Advanced Solid Tumors. Clin Cancer Res. 23, 5981–5992. 10.1158/1078-0432.Ccr-17-0725 [DOI] [PubMed] [Google Scholar]
- McBride KL, Varga EA, Pastore MT, Prior TW, Manickam K, Atkin JF, Herman GE, 2010. Confirmation study of PTEN mutations among individuals with autism or developmental delays/mental retardation and macrocephaly. Autism Res. 3, 137–41. 10.1002/aur.132 [DOI] [PubMed] [Google Scholar]
- McMahon J, Huang X, Yang J, Komatsu M, Yue Z, Qian J, Zhu X, Huang Y, 2012. Impaired autophagy in neurons after disinhibition of mammalian target of rapamycin and its contribution to epileptogenesis. J Neurosci. 32, 15704–14. 10.1523/jneurosci.2392-12.2012 [DOI] [PMC free article] [PubMed] [Google Scholar]
- Menager C, Arimura N, Fukata Y, Kaibuchi K, 2004. PIP3 is involved in neuronal polarization and axon formation. Journal of Neurochemistry. 89, 109–118. 10.1046/j.1471-4159.2004.02302.x [DOI] [PubMed] [Google Scholar]
- Motulsky HJ, Brown RE, 2006. Detecting outliers when fitting data with nonlinear regression - a new method based on robust nonlinear regression and the false discovery rate. BMC Bioinformatics. 7, 123 10.1186/1471-2105-7-123 [DOI] [PMC free article] [PubMed] [Google Scholar]
- Muddashetty RS, Kelic S, Gross C, Xu M, Bassell GJ, 2007. Dysregulated metabotropic glutamate receptor-dependent translation of AMPA receptor and postsynaptic density-95 mRNAs at synapses in a mouse model of fragile X syndrome. J Neurosci. 27, 5338–48. 10.1523/jneurosci.0937-07.2007 [DOI] [PMC free article] [PubMed] [Google Scholar]
- Nehme R, Nehme H, Saurat T, de-Tauzia ML, Buron F, Lafite P, Verrelle P, Chautard E, Morin P, Routier S, Benedetti H, 2014. New in-capillary electrophoretic kinase assays to evaluate inhibitors of the PI3k/AKT/mTOR signaling pathway. Anal Bioanal Chem. 406, 3743–54. 10.1007/s00216-014-7790-z [DOI] [PubMed] [Google Scholar]
- Nguyen LH, Brewster AL, Clark ME, Regnier-Golanov A, Sunnen CN, Patil VV, D’Arcangelo G, Anderson AE, 2015. mTOR inhibition suppresses established epilepsy in a mouse model of cortical dysplasia. Epilepsia. 56, 636–646. 10.1111/epi.12946 [DOI] [PMC free article] [PubMed] [Google Scholar]
- Nikolaeva I, Kazdoba TM, Crowell B, D’Arcangelo G, 2017. Differential roles for AKT and mTORCI in the hypertrophy of Pten mutant neurons, a cellular model of brain overgrowth disorders. Neuroscience. 354, 196–207. 10.1016/j.neuroscience.2017.04.026 [DOI] [PubMed] [Google Scholar]
- Pinto D, Delaby E, Merico D, Barbosa M, Merikangas A, Klei L, Thiruvahindrapuram B, Xu X, Ziman R, Wang Z, Vorstman JA, Thompson A, Regan R, Pilorge M, Pellecchia G, Pagnamenta AT, Oliveira B, Marshall CR, Magalhaes TR, Lowe JK, Howe JL, Griswold AJ, Gilbert J, Duketis E, Dombroski BA, De Jonge MV, Cuccaro M, Crawford EL, Correia CT, Conroy J, Conceicao IC, Chiocchetti AG, Casey JP, Cai G, Cabrol C, Bolshakova N, Bacchelli E, Anney R, Gallinger S, Cotterchio M, Casey G, Zwaigenbaum L, Wittemeyer K, Wing K, Wallace S, van Engeland H, Tryfon A, Thomson S, Soorya L, Roge B, Roberts W, Poustka F, Mouga S, Minshew N, McInnes LA, McGrew SG, Lord C, Leboyer M, Le Couteur AS, Kolevzon A, Jimenez Gonzalez P, Jacob S, Holt R, Guter S, Green J, Green A, Gillberg C, Fernandez BA, Duque F, Delorme R, Dawson G, Chaste P, Cafe C, Brennan S, Bourgeron T, Bolton PF, Bolte S, Bernier R, Baird G, Bailey AJ, Anagnostou E, Almeida J, Wijsman EM, Vieland VJ, Vicente AM, Schellenberg GD, Pericak-Vance M, Paterson AD, Parr JR, Oliveira G, Nurnberger JI, Monaco AP, Maestrini E, Klauck SM, Hakonarson H, Haines JL, Geschwind DH, Freitag CM, Folstein SE, Ennis S, Coon H, Battaglia A, Szatmari P, Sutcliffe JS, Hallmayer J, Gill M, Cook EH, Buxbaum JD, Devlin B, Gallagher L, Betancur C, Scherer SW, 2014. Convergence of genes and cellular pathways dysregulated in autism spectrum disorders. Am J Hum Genet. 94, 677–94. 10.1016/j.ajhg.2014.03.018 [DOI] [PMC free article] [PubMed] [Google Scholar]
- Poopal AC, Schroeder LM, Horn PS, Bassell GJ, Gross C, 2016. Increased expression of the PI3K catalytic subunit p110delta underlies elevated S6 phosphorylation and protein synthesis in an individual with autism from a multiplex family. Mol Autism. 7, 3 10.1186/s13229-015-0066-4 [DOI] [PMC free article] [PubMed] [Google Scholar]
- Pun RY, Rolle IJ, Lasarge CL, Hosford BE, Rosen JM, Uhl JD, Schmeltzer SN, Faulkner C, Bronson SL, Murphy BL, Richards DA, Holland KD, Danzer SC, 2012. Excessive activation of mTOR in postnatally generated granule cells is sufficient to cause epilepsy. Neuron. 75, 1022–34. 10.1016/j.neuron.2012.08.002 [DOI] [PMC free article] [PubMed] [Google Scholar]
- Rademacher S, Eickholt BJ, 2019. PTEN in Autism and Neurodevelopmental Disorders. Cold Spring Harbor Perspectives in Medicine. 9 10.1101/cshperspect.a036780 [DOI] [PMC free article] [PubMed] [Google Scholar]
- Roy A, Skibo J, Kalume F, Ni J, Rankin S, Lu YL, Dobyns WB, Mills GB, Zhao JJ, Baker SJ, Millen KJ, 2015. Mouse models of human PIK3CA-related brain overgrowth have acutely treatable epilepsy. Elife. 4 ARTN e12703 10.7554/eLife.12703 [DOI] [PMC free article] [PubMed] [Google Scholar]
- Sadhu C, Masinovsky B, Dick K, Sowell CG, Staunton DE, 2003. Essential role of phosphoinositide 3-kinase delta in neutrophil directional movement. J Immunol. 170, 2647–54. 10.4049/jimmunol.170.5.2647 [DOI] [PubMed] [Google Scholar]
- Schick V, Majores M, Engels G, Spitoni S, Koch A, Elger CE, Simon M, Knobbe C, Blumcke I, Becker AJ, 2006. Activation of AKT independent of PTEN and CTMP tumor-suppressor gene mutations in epilepsy-associated Taylor-type focal cortical dysplasias. Acta Neuropathol. 112, 715–25. 10.1007/s00401-006-0128-y [DOI] [PubMed] [Google Scholar]
- Schick V, Majores M, Koch A, Elger CE, Schramm J, Urbach H, Becker AJ, 2007. Alterations of phosphatidylinositol 3-kinase pathway components in epilepsy-associated glioneuronal lesions. Epilepsia. 48 Suppl 5, 65–73. 10.1111/j.1528-1167.2007.01291.x [DOI] [PubMed] [Google Scholar]
- Schmidt EK, Clavarino G, Ceppi M, Pierre P, 2009. SUnSET, a nonradioactive method to monitor protein synthesis. Nat Methods. 6, 275–7. 10.1038/nmeth.1314 [DOI] [PubMed] [Google Scholar]
- Sperow M, Berry RB, Bayazitov IT, Zhu G, Baker SJ, Zakharenko SS, 2012. Phosphatase and tensin homologue (PTEN) regulates synaptic plasticity independently of its effect on neuronal morphology and migration. J Physiol. 590, 777–92. 10.1113/jphysiol.2011.220236 [DOI] [PMC free article] [PubMed] [Google Scholar]
- Sunnen CN, Brewster AL, Lugo JN, Vanegas F, Turcios E, Mukhi S, Parghi D, D’Arcangelo G, Anderson AE, 2011. Inhibition of the mammalian target of rapamycin blocks epilepsy progression in NS-Pten conditional knockout mice. Epilepsia. 52, 2065–75. 10.1111/j.1528-1167.2011.03280.x [DOI] [PMC free article] [PubMed] [Google Scholar]
- Switon K, Kotulska K, Janusz-Kaminska A, Zmorzynska J, Jaworski J, 2017. Molecular neurobiology of mTOR. Neuroscience. 341, 112–153. 10.1016/j.neuroscience.2016.11.017 [DOI] [PubMed] [Google Scholar]
- Tiwari D, Brager DH, Rymer JK, Bunk AT, White AR, Elsayed NA, Krzeski JC, Snider A, Schroeder Carter LM, Danzer SC, Gross C, 2019. MicroRNA inhibition upregulates hippocampal A-type potassium current and reduces seizure frequency in a mouse model of epilepsy. Neurobiol Dis. 104508 10.1016/j.nbd.2019.104508 [DOI] [PMC free article] [PubMed] [Google Scholar]
- Tsien JZ, Chen DF, Gerber D, Tom C, Mercer EH, Anderson DJ, Mayford M, Kandel ER, Tonegawa S, 1996. Subregion- and cell type-restricted gene knockout in mouse brain. Cell. 87, 1317–26. [DOI] [PubMed] [Google Scholar]
- Vanhaesebroeck B, Guillermet-Guibert J, Graupera M, Bilanges B, 2010. The emerging mechanisms of isoform-specific PI3K signalling. Nat Rev Mol Cell Biol. 11, 329–41. 10.1038/nrm2882 [DOI] [PubMed] [Google Scholar]
- Wee S, Wiederschain D, Maira SM, Loo A, Miller C, deBeaumont R, Stegmeier F, Yao YM, Lengauer C, 2008. PTEN-deficient cancers depend on PIK3CB. Proc Natl Acad Sci U S A. 105, 13057–62. 10.1073/pnas.0802655105 [DOI] [PMC free article] [PubMed] [Google Scholar]
- Werzowa J, Koehrer S, Strommer S, Cejka D, Fuereder T, Zebedin E, Wacheck V, 2011. Vertical inhibition of the mTORC1/mTORC2/PI3K pathway shows synergistic effects against melanoma in vitro and in vivo. J Invest Dermatol. 131, 495–503. 10.1038/jid.2010.327 [DOI] [PubMed] [Google Scholar]
- Wong CH, Ma BB, Cheong HT, Hui CW, Hui EP, Chan AT, 2015. Preclinical evaluation of PI3K inhibitor BYL719 as a single agent and its synergism in combination with cisplatin or MEK inhibitor in nasopharyngeal carcinoma (NPC). Am J Cancer Res. 5, 1496–506. [PMC free article] [PubMed] [Google Scholar]
- Zhang J, Gao X, Schmit F, Adelmant G, Eck MJ, Marto JA, Zhao JJ, Roberts TM, 2017. CRKL Mediates p110beta-Dependent PI3K Signaling in PTEN-Deficient Cancer Cells. Cell Rep. 20, 549–557. 10.1016/j.celrep.2017.06.054 [DOI] [PMC free article] [PubMed] [Google Scholar]
- Zhou J, Blundell J, Ogawa S, Kwon CH, Zhang W, Sinton C, Powell CM, Parada LF, 2009. Pharmacological inhibition of mTORC1 suppresses anatomical, cellular, and behavioral abnormalities in neural-specific Pten knock-out mice. J Neurosci. 29, 1773–83. 10.1523/JNEUROSCI.5685-08.2009 [DOI] [PMC free article] [PubMed] [Google Scholar]
Associated Data
This section collects any data citations, data availability statements, or supplementary materials included in this article.