

Abstract
Objectives:
Recently, the definition of sepsis has changed from a physiologic derangement (Sepsis-1 and -2) to organ dysfunction (Sepsis-3) based. We sought to determine the concordance between the different sepsis phenotypes and how that affected mortality.
Design:
Retrospective, multicenter study.
Setting:
Three academic medical centers.
Patients:
29,459 patients who had suspected infection, defined as obtaining blood cultures and receiving antibiotics: 18,183 (62%) had either Sepsis-2 or Sepsis-3.
Measurements and Main Results:
Kappa was used to show agreement between phenotypes. Conditional logistic regression was used to create models of associations between factors and phenotypes and between factors and mortality. About 12,981 patients had Sepsis-2; 12,043 had Sepsis-3; and 6,841 patients had both Sepsis-2 and Sepsis-3. Fifty-three percent of Sepsis-2 patients also had Sepsis-3, whereas 57% of Sepsis-3 patients also had Sepsis-2. Agreement between the two phenotypes was poor: kappa = 0.213±0.006. Mortality was 6% in patients with only Sepsis-2, 10% with only Sepsis-3, and 18% in patients who had both phenotypes. Combining the variables in Sepsis-2 and Sepsis-3 improved the discrimination (C-statistic = 0.742±0.005, p < 0.001) of mortality.
Conclusions:
We found that Sepsis-2 and Sepsis-3-based sepsis diagnoses represent separate phenotypes with poor agreement. Patients who have both phenotypes are at increased risk of mortality compared with having either phenotype alone. Inclusion of both systemic inflammatory response syndrome and Sequential Organ Failure Assessment criteria in the same model improves the discrimination of mortality.
Keywords: mortality, prediction models, sepsis, septic shock, Systemic Inflammatory Response Syndrome, Sequential Organ Failure Assessment
Despite improvements in resuscitation, sepsis remains an important health problem worldwide with an increasing incidence (1–3). While many studies, both retrospective and prospective, have provided valuable insights, gaps remain in our understanding of this syndrome. Only a minority of patients show definitive evidence of infection with treatment remaining limited primarily to antibiotics and supportive therapy (3–5).
For more than 25 years, sepsis remained a syndrome based on the systemic inflammatory response syndrome (SIRS) defined by its physiologic derangements of vital signs and laboratory values suggestive of infection (Sepsis-1 and Sepsis-2) (6, 7). Recently, an international collaboration suggested a new definition based on end-organ dysfunction (Sepsis-3) (8, 9) (Supplemental Table 1, Supplemental Digital Content 1, http://links.lww.com/CCM/F589). While Sepsis-3 has similar or slightly better discrimination to predict mortality than Sepsis-2, its development raises important questions and concerns about to what extent the populations identified through the varying definitions overlap. If, for example, the populations are nearly identical, historical studies of Sepsis-2 patients are likely generalizable to Sepsis-3 patients. Additionally, in resource-poor areas where laboratory values are not easily available, hospitals may continue to use Sepsis-2. In which case, it is important to determine how generalizable data based on Sepsis-3 populations is to Sepsis-2 patients. We hypothesized that the different sepsis phenotypes would have different mortalities, specifically for the three groups: 1) Sepsis-2 and Sepsis-3 concordant sepsis, 2) Sepsis-2 only sepsis, and 3) Sepsis-3 only sepsis. Our secondary objective is to develop models of mortality based on both Sepsis-2 and Sepsis-3 criteria. Our tertiary objective is to determine the ability of Sepsis-2 components to identify Sepsis-3 and of Sepsis-3 components to identify Sepsis-2.
METHODS
This study was approved by the Institutional Review Board, which waived informed consent due to the retrospective nature of the study, at each of the three participating sites (Mayo Clinic, Rochester, MN; Vanderbilt University Medical Center, Nashville, TN; and University of Michigan Medical Center, Ann Arbor, MI) (Supplemental Table 2, Supplemental Digital Content 1, http://links.lww.com/CCM/F589). STROBE guidelines were followed. The electronic health record (EHR) at each institution was queried by computer programmers for patients 18 years old or older who had a blood culture obtained and antibiotics administered within the 24 hours preceding the culture to 72 hours following the culture. The onset of presumed infection was defined as the earlier of the culture or the antibiotic administration (9). Then, all data to calculate SIRS and SOFA scores (Table 1) were extracted from the EHR. Data fields from each institution were established with a common vocabulary and inspected for validity, accuracy, and consistency and then merged. SIRS scores were calculated as described by Bone et al (6) and range from 0 to 4. SOFA scores were calculated as described by Vincent et al. (10) and range from 0 to 24. Missing values were presumed to be normal and contributed zero points to the scores. To calculate SIRS and SOFA scores, we used a window from 48 hours before to 24 hours after the onset of suspected infection (9). Overlap between the populations was graphically displayed as Venn Diagrams and their agreement described by kappa. Correlation between point scores was done with Pearson’s correlation coefficient. As comparisons between Sepsis-2 and Sepsis-3 patients were not strictly independent (some patients had sepsis by both sets of criteria), we used overlapping t test for continuous variables and the overlapping test for proportions (11, 12). To determine if and how well the four SIRS components could identify Sepsis-3, we used conditional (on hospital) nonparsimonious logistic regressions. Similarly, to determine if and how well the six SOFA components could identify Sepsis-2, we used conditional (on hospital) nonparsimonious logistic regressions. We also used conditional (on hospital) nonparsimonious logistic regressions to determine the associations between SIRS, SOFA and death. Discriminations of the regression models were measured with the C-statistic and compared with the Hanley-McNeil test (13). Cochran-Armitage test of trend was used to determine if mortality increased as SIRS or SOFA points increased. A priori subgroup analyses were done on patients who had septic shock, defined as sepsis by either of the two scores and receiving vasopressors (Sepsis-2) or vasopressors and lactic acid >2 mmol/dL (Sepsis-3). p < 0.05 denoted statistical significance. All statistics were done with SPSS 25 (IBM, Chicago, IL). The funders had no role in the design or analysis of the study.
table 1.
Demographics for Patients With Sepsis and Septic Shock
| Factor | Any Sepsis, n = 18,183, n (%) | Sepsis-2, n = 12,981, n (%) | Sepsis-3, n = 12,043, n (%) | p* |
|---|---|---|---|---|
| Sex | ||||
| Men | 9,300 (51) | 6,691 (52) | 6,118 (51) | 0.359 |
| Women | 8,596 (47) | 6,046 (47) | 5,670 (47) | 0.497 |
| Missing | 337 (2) | 244 (2) | 255 (2) | 0.349 |
| Race | ||||
| White | 14,234 (78) | 10,169 (78) | 9,375 (78) | 0.529 |
| Black | 959 (5) | 721 (6) | 658 (5) | 0.711 |
| Others/missing | 2,990 (16) | 2,091 (16) | 2,010 (17) | 0.355 |
| Mean (sd) | Mean (sd) | Mean (sd) | ||
| Age (yr) | 56 (18) | 56 (18) | 56 (18) | 0.654 |
| Septic Shock, n = 1,894, n (%) | Sepsis-2, n = 1,758, n (%) | Sepsis-3, n = 676, n (%) | p* | |
| Sex | ||||
| Men | 977 (52) | 911 (52) | 386 (57) | 0.999 |
| Women | 829 (44) | 759 (43) | 290 (43) | 0.142 |
| Missing | 88 (5) | 88 (5) | 0 (0) | 0.003 |
| Race | ||||
| White | 1,413 (75) | 1,314 (75) | 519 (77) | 0.965 |
| Black | 143 (8) | 131 (7) | 72 (11) | 0.248 |
| Others/missing | 338 (18) | 313 (18) | 85 (13) | 0.599 |
| Mean (sd) | Mean (sd) | Mean (sd) | ||
| Age (yr) | 56 (18) | 56 (18) | 58 (17) | 0.046 |
p value compares patients meeting Sepsis-2 criteria to patients meeting Sepsis-3 criteria using the overlapping test for proportions and the overlapping t test for continuous variables.
No power analysis was done. Sample size was determined by the number of available records from each institution.
RESULTS
We had 29,459 patients with suspected infection, defined as obtaining blood cultures and receiving antibiotics: 18,183 (62%) had either Sepsis-2 or Sepsis-3. Patients were (mean ± sd) 56 ± 18 years old, 9,300 (51%) were men, and 14,234 (78%) were Caucasian (Table 1). Of these septic patients, 12,981 patients (44%) had Sepsis-2, 12,043 (41%) had Sepsis-3, and 6,841 patients (23%) had both Sepsis-2 and Sepsis-3. Fifty-three percent of Sepsis-2 patients also had Sepsis-3, whereas 57% of Sepsis-3 patients also had Sepsis-2 (Fig. 1). Agreement between the two phenotypes was poor: kappa = 0.213, (95% CI, 0.201–0.225). SIRS and SOFA points correlated poorly (r = 0.292, p < 0.001). The distribution of SIRS and SOFA points is shown in the bubble plot (Fig. 2).
Figure 1.
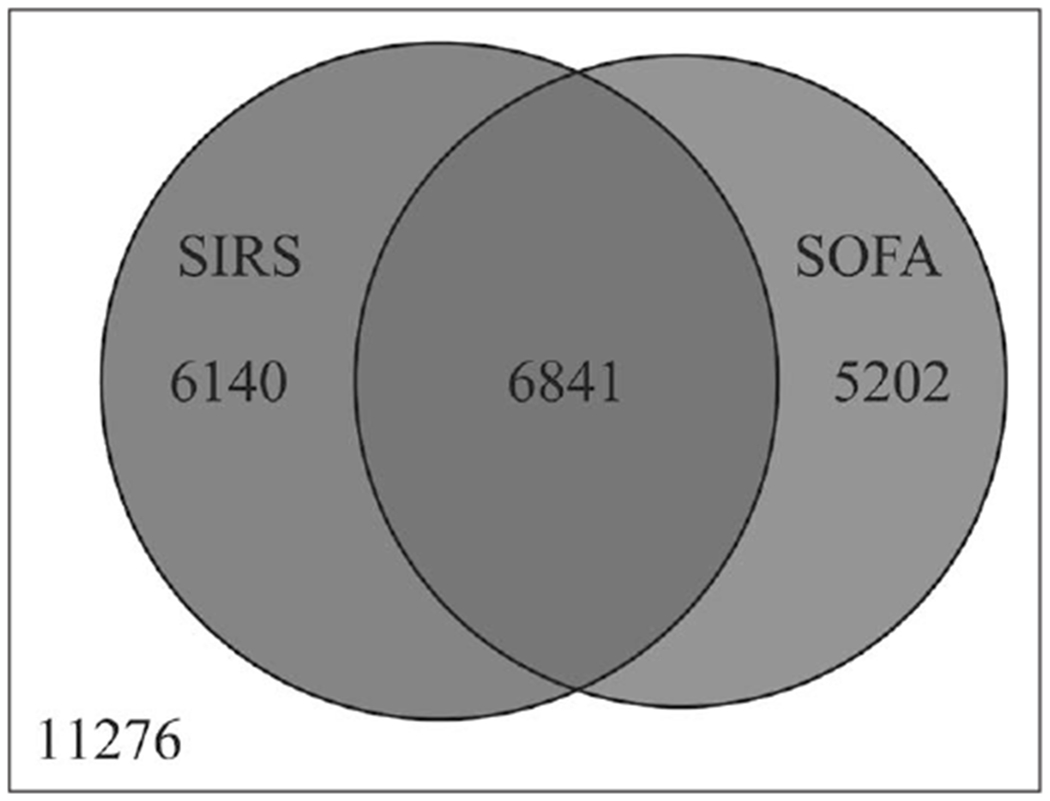
Venn diagram for patients with suspected sepsis. Neither Sepsis-2 nor Sepsis-3 sepsis–335 of 11,276 patients (3%) died. Sepsis-2 sepsis–1,594 of 12,981 patients (12%) died, Sepsis-3 sepsis–1,738 patients of 12,043 (14%) died, and both Sepsis-2- and Sepsis-3-sepsis 1,238 of 6,841 (18%) died. SIRS = systemic inflammatory response syndrome, SOFA = Sequential Organ Failure Assessment.
Figure 2.

Bubble plot of systemic inflammatory response syndrome (SIRS) and Sequential Organ Failure Assessment (SOFA) points in patients with suspected sepsis. Bubble area is proportional to the number of patients. Largest bubble (0 SOFA and 1 SIRS point) is 4.43 patients. SOFA score 12 is ≥12. Correlation between SIRS and SOFA points = 0.292, p < 0.001.
Two thousand four hundred twenty-nine (8%) patients died. Mortality increased as the number of SIRS or SOFA points increased, Cochran-Armitage p < 0.001 for both (Fig. 3), with overall mortality being 12% in Sepsis-2 and 14% in Sepsis-3. Separately, SIRS and SOFA were independently associated with hospital mortality. Each additional SIRS point was associated with an increased odds ratio (OR) for mortality (OR, 1.671; 95% CI, 1.605–1.739; p < 0.001; C-statistic = 0.649; 95% CI, 0.637–0.661), while each additional SOFA point was also associated with increased mortality (OR, 1.299; 95% CI, 1.283–1.316; C-statistic = 0.725; 95% CI, 0.713–0.737). Combined into one logistic regression model, both SIRS and SOFA points were independently associated with mortality with improved discrimination (C-statistic = 0.742; 95% CI, 0.732–0.752). All four SIRS components were associated with mortality (Supplemental Table 3, Supplemental Digital Content 1, http://links.lww.com/CCM/F589), while five of the six SOFA components (Supplemental Table 4, Supplemental Digital Content 1, http://links.lww.com/CCM/F589) were associated with mortality. When SIRS and SOFA components were combined into one model, all of their individual components, with the exception of Glasgow coma scale and WBC count, were independently associated with mortality (Supplemental Table 5, Supplemental Digital Content 1, http://links.lww.com/CCM/F589).
Figure 3.

A, Mortality (black bars) and number of patients (line) by number of systemic inflammatory response syndrome (SIRS) points. B, Mortality (black bars) and number of patients (line) by number of Sequential Organ Failure Assessment (SOFA) points.
To evaluate the ability of the Sepsis-3 subset of Sepsis-2 patients to represent all Sepsis-3 patients, we compared Sepsis-3 patients who also had Sepsis-2 to those who did not. Sepsis-3 patients who also had Sepsis-2 had higher overall SOFA scores (4.8 ± 2.7 vs. 3.7 ± 2.0, p < 0.001) than Sepsis-3 patients without Sepsis-2 (Supplemental Table 6, Supplemental Digital Content 1, http://links.lww.com/CCM/F589). They also had a near-doubling of hospital mortality (18% vs. 10%, p < 0.001). Sepsis-2 patients who also had Sepsis-3 had only slightly higher SIRS points (2.5 ± 0.6 vs. 2.3 ± 0.5, p < 0.001), but much higher mortality (18% vs. 6%, p < 0.001) than Sepsis-2 patients without Sepsis 3 (Supplemental Table 7, Supplemental Digital Content 1, http://links.lww.com/CCM/F589). Using logistic regression to determine the SIRS components associated with Sepsis-3, we found that all four factors were significantly associated with SOFA-sepsis; however, the discrimination was only 0.669; 95% CI, 0.657–0.681 (Supplemental Table 8, Supplemental Digital Content 1, http://links.lww.com/CCM/F589). Similarly, we found that five of the six SOFA factors, but not bilirubin, were associated with Sepsis-2. The model’s discrimination was 0.710; 95% CI, 0.698–0.722 (Supplemental Table 9, Supplemental Digital Content 1, http://links.lww.com/CCM/F589).
Of the 18,183 patients who had sepsis by either SIRS or SOFA criteria, 1,894 (10%) had septic shock by Sepsis-2 (n = 1,758, 93%) or Sepsis-3 criteria (n = 676, 36%), with 540 meeting both criteria (29%) (Supplemental Fig. 1, Supplemental Digital Content 2, http://links.lww.com/CCM/F590; legend, Supplemental Digital Content 4, http://links.lww.com/CCM/F592). Agreement between the diagnoses was fair (kappa = 0.412; se = 0.013; p < 0.001), however, correlation between SIRS points and SOFA points was poor (r = 0.091; p < 0.001) (Supplemental Fig. 2, Supplemental Digital Content 3, http://links.lww.com/CCM/F591; legend, Supplemental Digital Content 4, http://links.lww.com/CCM/F592). Of the 1,758 Sepsis-2 patients with shock, 595 (34%) died, while 349 of the 676 (52%) patients with Sepsis-3 shock died (Fig. 4). While increasing SIRS and SOFA points were associated with increased mortality (Cochran-Armitage p = 0.040 and < 0.001, respectively) in the Sepsis-2 patients, neither was associated with increased mortality in Sepsis-3 patients (Cochran-Armitage p = 0.103 and 0.710, respectively). SIRS components had poor ability to discriminate mortality in both Sepsis-2 shock (C-statistic = 0.563; 95% CI, 0.534–0.592) and Sepsis-3 shock patients (C-statistic = 0.560; 95% CI, 0.517–0.603) (Supplemental Tables 10 and 11, Supplemental Digital Content 1, http://links.lww.com/CCM/F589). SOFA components’ discrimination was 0.631; 95% CI, 0.607–0.655 to predict death in patients with Sepsis-3 shock (Supplemental Table 12, Supplemental Digital Content 1, http://links.lww.com/CCM/F589) and Sepsis-2 shock (C-statistic = 0.640; 95% CI, 0.613–0.667) (Supplemental Table 13, Supplemental Digital Content 1, http://links.lww.com/CCM/F589). Combining the SIRS and SOFA components into the same models improved the discrimination (C-statistic = 0.651; 95% CI, 0.627–0.675) for Sepsis-3 shock (Supplemental Table 14, Supplemental Digital Content 1, http://links.lww.com/CCM/F589) compared with SIRS only model, p < 0.001, but not the SOFA only model, p = 0.095. For Sepsis-2 shock the combined model (Supplemental Table 15, Supplemental Digital Content 1, http://links.lww.com/CCM/F589) had better discrimination (C-statistic = 0.653; 95% CI, 0. 626–0.680) compared with the SIRS only model, p < 0.001, but not compared with the SOFA only model, p = 0.352.
Figure 4.

A, Mortality (black bars) and number of patients with septic shock (line) by number of systemic inflammatory response syndrome (SIRS) points. B, Mortality (black bars) and number of patients with septic shock (line) by number of Sequential Organ Failure Assessment (SOFA) points.
Sepsis-3 shock patients who also had Sepsis-2 shock had slightly higher SOFA points (7.9 ± 2.8 vs. 7.1 ± 3.0; p < 0.001) than Sepsis-3 shock patients without Sepsis-2 shock (Supplemental Table 16, Supplemental Digital Content 1, http://links.lww.com/CCM/F589). Mortality was slightly higher in Sepsis-3 shock patients without than with Sepsis-2 shock (60% vs. 50%; p = 0.044). Mortality in Sepsis-2 shock patients also differed by Sepsis-3 shock status—268 of 540, 50%, if Sepsis-3 shock was present compared with 327 of 1,218, 27%, without Sepsis-3 shock. The ability of Sepsis-2 criteria to discriminate between patients with and without Sepsis-3 septic shock was 0.612; 95% CI, 0.589–0.636 (Supplemental Table 17, Supplemental Digital Content 1, http://links.lww.com/CCM/F589). SOFA points had similar discrimination between patients with and without SIRS (C-statistic = 0.639; 95% CI, 0.613–0.665) with only oxygenation and cardiovascular SOFA factors associated with Sepsis-2 septic shock (Supplemental Table 18, Supplemental Digital Content 1, http://links.lww.com/CCM/F589).
DISCUSSION
In this multi-institutional retrospective analysis of patients with suspected sepsis, we found similar incidences of Sepsis-2 and Sepsis-3, however, there was poor agreement between the Sepsis-2 and Sepsis-3 diagnoses, kappa = 0.213 ± 0.006. This finding suggests that they are, at least in part, different syndromes or phenotypes, with patients having both syndromes having the highest mortality (18% vs. 14% for only Sepsis-3 vs. 12% for only Sepsis-2). In support of this, we also found that including both Sepsis-2- and Sepsis-3-components in the same regression improved the discrimination of the model over using either Sepsis-2 or Sepsis-3 components separately (C-statistic = 0.757 ± 0.005 vs .730 ± 0.006 for Sepsis-3 only vs. 0.675 ± 0.006 for Sepsis-2 only components). We found similar agreement (kappa = 0.412 ± 0.013 between Sepsis-2 and Sepsis-3 shock diagnoses, with a higher mortality in Sepsis-3 shock patients (50%) than Sepsis-2 shock patients (34%). While mortality was higher in Sepsis-3 shock, its incidence was much lower (676 vs. 1,758).
An important finding of this study is the variation in mortality between those patients meeting criteria for concurrent Sepsis-2 and Sepsis-3 diagnosis. While there was no difference in mortality between Sepsis-3 shock with and without also meeting Sepsis-2 criteria, (50% vs. 50%), Sepsis-2 shock patients who did not meet Sepsis-3 shock criteria had a much lower mortality rate (27%) compared with those who met Sepsis-3 criteria (50%). We also found that combining Sepsis-2 and Sepsis-3 criteria into one mortality model improved prediction and suggest that a combined model might be better. Not all SIRS and SOFA components were in the combined model. In particular, SIRS-white cell count and SOFA Glasgow score were not in the model (Supplemental Table 3, Supplemental Digital Content 1, http://links.lww.com/CCM/F589). While further study is needed to explain this, it may be related to the collinearities between these variables and the other SIRS and SOFA components that remained in the model.
Another salient finding was that utilization of Sepsis-3 patients as a subset of Sepsis-2 population missed 43% of Sepsis-3 patients. While this may limit the utility of reanalyzing Sepsis-2 studies for the subset of patients with Sepsis-3, the missed patients have less organ dysfunction (SOFA scores 3.7 ± 2.0 vs. 4.8 ± 2.7; p < 0.001) and much less mortality (10% vs. 18%; p < 0.001). However, using Sepsis-3 shock patients derived from Sepsis-2 shock population misses only 20% of Sepsis-3 shock patients and the missed patients, whereas having slightly lower SOFA scores, have the same mortality (50%) as the included patients. This might be useful in applying information from studies that used Sepsis-2 criteria to patients with Sepsis-3 criteria.
While our study confirms other studies that found that Sepsis-3 is better than Sepsis-2 at mortality discrimination, we could find few studies that assessed the overlap between Sepsis-2 and Sepsis-3 (14–17). In Thailand, Khwannimit et al. (14) found that 95% of Sepsis-2 patients also had Sepsis-3, whereas we found only 53% also had Sepsis-3. They did not assess non-Sepsis-2 patients for the presence of Sepsis-3. In a small study of ICU admissions (n = 186), Cheng et al. (15) found that Sepsis-3 patients (n = 175) were a subset of the Sepsis-2 patients with high mortality in both groups (31% in Sepsis-2 and 33% in Sepsis-3). They found no patient who had Sepsis-3 without also having Sepsis-2. A third study using a Japanese registry of patients admitted to an ICU with severe sepsis or septic shock by Sepsis-2 criteria, found that only 43% of these patients had Sepsis-3 shock (17). However, this study was limited by using a nonstandard time window (7 days) for calculating SOFA score, by starting with Sepsis-2 patients, and did not evaluate Sepsis-3 patients who did not also have Sepsis-2. Our study differs from these three studies by using the EHR to include Sepsis-3 patients who did not also have Sepsis-2. We also differ by including non-ICU patients and having a lower mortality, 12%, compared with 44% and 33%, respectively, in the first two studies, but a higher mortality in septic shock than the third study. Future study is needed to investigate these international differences. In another small study (n = 241) of ICU patients with either Sepsis-2 or Sepsis-3, Fullerton et al. (16) found that more patients had Sepsis-3- than Sepsis-2 and that 28-day hospital mortality was similar between Sepsis-2 (21%) and Sepsis-3 (20%) sepsis patients. Our study extends their finding of poor agreement (kappa = 0.12 ± 0.05) between the two groups by showing how the criteria of each type of sepsis poorly discriminates the other type of sepsis. Specifically, our study demonstrates that patients who have both sepsis phenotypes have increased mortality and the inclusion of both SIRS and SOFA criteria improves model discrimination of mortality. Our study is similar to an English study that found overlap between Sepsis-2 shock and Sepsis-3 shock patients with higher mortality in the Sepsis-3 patients (18). However, that study was limited by only including patients who had sepsis on ICU admission or within 24 hours of admission. Our study extends the sepsis comparisons to patients who develop sepsis more than 24 hours after ICU admission and to patients treated in the emergency department or in the wards. We also created models that identify the components of Sepsis-2 that predict Sepsis-3 and the components for Sepsis-3 that predict Sepsis-2.
As there is only modest agreement (kappa = 0.213 ± 0.006) between Sepsis-2 and Sepsis-3 diagnoses (Fig. 1), the different phenotypes or syndromes may reflect different responses to different organisms. Further study is needed to determine if particular organisms are more likely to cause one syndrome or the other. Larger multicenter studies would be required to obtain sufficient power. Alternatively, the different phenotypes may be caused by different genes or different gene expression. Determining the genes associated with the different phenotypes may permit development of medicines that are efficacious in one or the other phenotype.
The 2016 edition of the Surviving Sepsis Campaign uses Sepsis-3 to define sepsis, but explicitly states that “Sepsis-3 clinical criteria (i.e., qSOFA) were not used in studies that informed the recommendations in this revision;” hence their recommendations are based on clinical studies that used Sepsis-1 and Sepsis-2 (SIRS) criteria to define sepsis and septic shock (19). Our study provides the first evidence of how sepsis and septic shock studied using Sepsis-1 and Sepsis-2 criteria may relate to the newer Sepsis-3 criteria.
Given the voluminous research on conducted on patients with Sepsis-1 and Sepsis-2, our study provides some evidence of how this may pertain to patients with Sepsis-3. It suggests that reanalysis of these Sepsis-1 and Sepsis-2 studies to focus on those who also had SOFA-sepsis would select a population of SOFA-sepsis patients with more organ dysfunction and greater mortality (18% vs. 10%; p < 0.001) than Sepsis-3 patients without Sepsis-2 and hence not included in those study.
In patients with septic shock, we found that only a few patients (31%) with Sepsis-2 shock also have Sepsis-3 shock. However, most (80%) of Sepsis-3 shock patients also had Sepsis-2. Dissimilar to the sepsis patients, the Sepsis-3 shock patients without Sepsis-2 had similar mortality (50%) as Sepsis-3 shock patients who also had Sepsis-2. These results suggest that reanalyzing Sepsis-2 shock to find Sepsis-3 shock patients would miss only a small minority of patients with the same mortality.
The main limitation of our study is that we included only three tertiary care American academic medical centers; thus, our data may be less generalizable to community or foreign hospitals. However, by including patients in the emergency department and the general wards, similar to the Sepsis-3 study (9), as well as ICU patients, our results may still be applicable to less referral-based hospitals. Further study needs to be done in other hospital settings. Another relevant limitation is that both SIRS and SOFA criteria depend on the recording of vital signs and obtaining laboratory values. In the absence of measured values, both criteria assume the value is normal and assign zero points for that item. Institutions that have different frequencies of obtaining these values may have different relationships between Sepsis-2 and Sepsis-3 sepsis than what we found. Finally, as patients were diagnosed and treated over several years, changes in clinical care may have affected our results.
The main strength of this study was that we leveraged the extensive informatics expertise at three hospitals to obtain the necessary vital sign, laboratory value, and outcomes data needed to calculate SOFA and SIRS scores in patients with suspected sepsis, based on blood cultures and antibiotics, and better characterize their respective outcomes.
CONCLUSIONS
We found that Sepsis-2 and Sepsis-3-based sepsis diagnoses represent separate phenotypes with poor agreement. Patients who have both phenotypes are at increased risk of mortality compared with having either phenotype alone. Inclusion of both SIRS and SOFA criteria in the same model improves the discrimination of mortality.
Supplementary Material
Acknowledgments
Dr. Freundlich was supported by NIH NCATS-KL2-TR002245-01. Dr. Seelhammer was supported by Mayo Clinic CTSA grant UL1TR002377 from the National Center for Advancing Translational Sciences (NCATS).
Dr. Engoren received funding from Aerogen. Dr. Freundlich's institution received funding from Medtronic. The remaining authors have disclosed that they do not have any potential conflicts of interest.
Footnotes
Supplemental digital content is available for this article. Direct URL citations appear in the printed text and are provided in the HTML and PDF versions of this article on the journal's website (http://journals.lww.com/ccmjournal).
The work was done at University of Michigan, Mayo Clinic, Vanderbilt University, and University of Massachusetts.
REFERENCES
- 1.Kaukonen KM, Bailey M, Suzuki S, et al. : Mortality related to severe sepsis and septic shock among critically ill patients in Australia and New Zealand, 2000-2012. JAMA 2014; 311:1308–1316 [DOI] [PubMed] [Google Scholar]
- 2.Kadri SS, Rhee C, Strich JR, et al. : Estimating ten-year trends in septic shock incidence and mortality in United States academic medical centers using clinical data. Chest 2017; 151:278–285 [DOI] [PMC free article] [PubMed] [Google Scholar]
- 3.Rhee C, Dantes R, Epstein L, et al. ; CDC Prevention Epicenter Program: Incidence and trends of sepsis in US hospitals using clinical vs claims data, 2009-2014. JAMA 2017; 318:1241–1249 [DOI] [PMC free article] [PubMed] [Google Scholar]
- 4.Sigakis MJG, Jewell E, Maile MD, et al. : Culture-negative and culture-positive sepsis: A comparison of characteristics and outcomes. Anesth Analg 2019; 129:1300–1309 [DOI] [PMC free article] [PubMed] [Google Scholar]
- 5.Rhodes A, Evans LE, Alhazzani W, et al. : Surviving sepsis campaign: International guidelines for management of sepsis and septic shock: 2016. Crit Care Med 2017; 45:486–552 [DOI] [PubMed] [Google Scholar]
- 6.Bone RC, Balk RA, Cerra FB, et al. : Definitions for sepsis and organ failure and guidelines for the use of innovative therapies in sepsis. The ACCP/SCCM Consensus Conference Committee. American College of Chest Physicians/Society of Critical Care Medicine. Chest 1992; 101:1644–1655 [DOI] [PubMed] [Google Scholar]
- 7.Levy MM, Fink MP, Marshall JC, et al. ; SCCM/ESICM/ACCP/ATS/SIS: 2001 SCCM/ESICM/ACCP/ATS/SIS International Sepsis Definitions Conference. Crit Care Med 2003; 31:1250–1256 [DOI] [PubMed] [Google Scholar]
- 8.Singer M, Deutschman CS, Seymour CW, et al. : The third International Consensus definitions for Sepsis and Septic Shock (Sepsis-3). JAMA 2016; 315:801–810 [DOI] [PMC free article] [PubMed] [Google Scholar]
- 9.Seymour CW, Liu VX, Iwashyna TJ, et al. : Assessment of clinical criteria for sepsis: For the third International Consensus definitions for Sepsis and Septic Shock (Sepsis-3). JAMA 2016; 315:762–774 [DOI] [PMC free article] [PubMed] [Google Scholar]
- 10.Vincent JL, Moreno R, Takala J, et al. : The SOFA (Sepsis-related Organ Failure Assessment) score to describe organ dysfunction/failure. On behalf of the Working Group on Sepsis-Related Problems of the European Society of Intensive Care Medicine. Intensive Care Med 1996; 22:707–710 [DOI] [PubMed] [Google Scholar]
- 11.Derrick B, Toher D, White P: How to compare the means of two samples that include paired observations and independent observations. Quant Meth Psych 2017; 13:120–126 [Google Scholar]
- 12.Bland JM, Butland BK: Comparing Proportions in Overlapping Samples. Available at: https://www-users.york.ac.uk/~mb55/overlap.pdf. Accessed March, 19, 2020
- 13.Hanley JA, McNeil BJ: A method of comparing the areas under receiver operating characteristic curves derived from the same cases. Radiology 1983; 148:839–843 [DOI] [PubMed] [Google Scholar]
- 14.Khwannimit B, Bhurayanontachai R, Vattanavanit V: Comparison of the performance of SOFA, qSOFA and SIRS for predicting mortality and organ failure among sepsis patients admitted to the intensive care unit in a middle-income country. J Crit Care 2018; 44:156–160 [DOI] [PubMed] [Google Scholar]
- 15.Cheng B, Li Z, Wang J, et al. : Comparison of the performance between Sepsis-1 and Sepsis-3 in ICUs in China: A retrospective multicenter study. Shock 2017; 48:301–306 [DOI] [PMC free article] [PubMed] [Google Scholar]
- 16.Fullerton JN, Thompson K, Shetty A, et al. ; The Australian and New Zealand Intensive Care Society Clinical Trials Group; The George Institute for Global Health: New sepsis definition changes incidence of sepsis in the intensive care unit. Crit Care Resusc 2017; 19:9–13 [PubMed] [Google Scholar]
- 17.Takauji S, Hayakawa M, Fujita S. A nationwide comparison between Sepsis-2 and Sepsis-3 definition in Japan. J Intensive Care Med 2019. January 13 [online ahead of print] [DOI] [PubMed] [Google Scholar]
- 18.Shankar-Hari M, Harrison DA, Rubenfeld GD, et al. : Epidemiology of sepsis and septic shock in critical care units: comparison between Sepsis-2 and Sepsis-3 populations using a national critical care database. Br J Anaesth 2017; 119:626–636 [DOI] [PubMed] [Google Scholar]
- 19.Overview of the Surviving Sepsis Campaign: The International Guidelines for Management of Sepsis and Septic Shock 2017: Available at: https://fdocuments.net/download/overview-of-the-surviving-sepsis-campaign-the-surviving-sepsis-campaign. Accessed June 9, 2020
Associated Data
This section collects any data citations, data availability statements, or supplementary materials included in this article.