

Abstract
Objectives:
Spinal cord stimulation (SCS) provides relief for patients suffering from chronic neuropathic pain although its mechanism may not be as dependent on electrical interference as classically considered. Recent evidence has been growing regarding molecular changes that are induced by SCS as being a key player in reversing the pain process. Here we observed the effect of SCS on altering protein expression in spinal cord tissue using a proteomic analysis approach.
Methods:
A microlead was epidurally implanted following induction of an animal neuropathic pain model. After injury baseline was established, stimulation was applied for 72 hours continuously followed by tissue collection and proteomic analysis via tandem mass spectroscopy. Identified proteins were run through online databases for protein identification and classification of biological processes.
Results:
A significant improvement in mechanical sensitivity was observed following 48hr SCS therapy. Proteomic analysis identified 5,840 proteins, of which 155 were significantly affected by SCS. Geno ontology databases indicated a significant number of proteins were associated to stress response, oxidation/reduction, or extracellular matrix pathways. Additionally, many of the proteins identified also play a role in neuron-glial interactions and are involved in nociception.
Conclusions:
The development of an injury unbalances the proteome of the local neural tissue, neurons and glial cells, and shifts the proteomic profile to a pain producing state. This study demonstrates the reversal of the injury-induced proteomic state by applying conventional SCS therapy. Additional studies looking at variations in electrical parameters are needed to optimize SCS.
Keywords: Spinal Cord Stimulation, Protein Expression, Neuropathic Pain, Spared Nerve Injury Model, Low Frequency Electrical Stimulation
INTRODUCTION
Like all processes within the body, neuropathic pain is governed by the activity of proteins and their level of expression, which is referred to as the proteome. Proteins are the effectors within the body that, when an injury occurs, promote the perception of pain and facilitate the healing process. At the level of the spinal cord where the afferent neurons synapse, pain signals promote the recruitment and activation of glial cells that initiate and maintain a chronic pain state, thus altering the proteomic profile of the neural tissue[1–3]. This shift of protein expression in both neurons and glial cells ultimately leads to central sensitization, causing any non-noxious stimuli within the affected region to be perceived as painful. Previous studies have shown differences in proteomes associated with pain originating from inflammation versus a peripheral injury, such as the spared nerve injury (SNI) model, with limited overlap in protein expression[4, 5]. Such sensitivity to differing pain sources implies that the neuron-glia proteome may also be sensitive to variations of therapeutic interventions used to provide analgesia.
Many proteomic pathways are affected during the development of a neuropathic pain state following an injury. A key element within neural tissue involved in the progression of chronic pain is the extracellular matrix (ECM). Inhibition of ECM signaling has been shown to disrupt the development of neuropathic pain[6]. The ECM is a three-dimensional network of macromolecules that facilitate and direct interactions between neurons and glial cells via signaling cascades and cell-cell interactions. Microglial cells are typically freely moving within the central nervous system (CNS) until an injury or foreign presence is detected, at which time they migrate to the source and stay localized until no longer needed. Neurons and glial cells have been shown to promote changes in the ECM, which enable microglial cells to stay localized to the injury-signaling neurons and upon arrival promote neuroinflammatory protein expression[7–9]. ECM proteins, such as integrins, have been shown to be involved in signaling pathways for both inflammatory and neuropathic pain[10, 11]. Conversely, the cleavage or modification of ECM proteins can trigger anti-inflammatory pathways and can provide analgesia[12].
Protein synthesis alone is not always a sufficient indicator of proteomic changes since catabolism or modification of proteins can have significant effects within a cell. Proteins involved in metabolism are significantly modulated in a chronic pain state as well as those modifying the activity of enzymes[13]. Protein activity is often controlled by adding, removing, or modifying head groups such as phosphates, hydroxyl groups, hydrogenates, amines, and methyl groups. In pain signaling, these modifications can activate or deactivate pathways that initiate and prolong neuropathic pain. Redox pathways have been shown to be directly involved in regulating pain as the elimination of reactive oxygen species (ROS) reduces pain and addition of ROS induced pain in a dose-dependent manner[14].
Spinal cord stimulation (SCS) is a proven therapy for the treatment of chronic and intractable neuropathic pain, utilizing electrical fields applied to the dorsal columns of the spinal cord to provide analgesia. Classically, the efficacy of SCS has been based on the Gate Control Theory which implies that the electric field created by SCS activates interneurons that modulate the pain-signaling pathway[15]. Recent literature has demonstrated that SCS can directly affect protein expression from neurons as well as glial cells [16–18]. Furthermore, it has been shown that electric fields can activate receptors independent of binding ligands[19], indicating a direct effect on proteomic profiles. These two factors demonstrate that SCS not only affects the electric signaling but also directly affects other vital elements involved in the development of chronic pain, including the proteome, and thus supports the concept of differentially targeting relevant biological processes.
To better understand the segmental mechanism by which SCS induces its analgesia based on protein changes, a proteomic analysis was performed following induction of a peripheral nerve injury and subsequent SCS therapy in an animal model of neuropathic pain.
MATERIALS AND METHODS
All animal procedures were approved by the Institutional Animal Care and Use Committee (IACUC) at Illinois State University. Ten adult male Sprague-Dawley rats weighing 280–310 g, representing a subset of a larger study[20], were allowed to acclimate for one week on a 12-hour light/dark schedule and given food and water ad libitum. Proteomic analysis was performed on two experimental groups (SCS-On and SCS-Off) in order to evaluate if SCS therapy would alter protein expression in a comparative fashion to the genomic changes reported previously by our group[20]. Animals underwent induction of the spared nerve injury (SNI) model and were implanted with a microlead to evaluate behavioral and proteomic changes following SCS therapy. Post-surgery, rats were allowed to recover and return to custom-made housing which allowed the stimulating microlead to be attached to an overhead swivel and counterweight device as previously reported[21]. This permitted unhindered mobility of the animal while preventing any interference with the assembly.
Surgical Preparation: SNI Model and Lead Implant
The full surgical preparation is reported in Vallejo et al[20]. Briefly, all surgical procedures were performed under 2–4% isoflurane anesthesia. The SNI model consisted of exposing the trifurcation of the sciatic nerve and removing a 1–2mm portion of the tibial and common peroneal nerves, leaving the sural branch undisturbed. After transection, the muscles were massaged back into place and the incision was closed using steel clips. While under anesthesia, a longitudinal incision was made, centered on the L4 spinous process. Musculature between the L3 and L4 processes was removed to expose the L3/L4 interlaminar space, which was enlarged using a drill such that the stimulating microlead could be inserted into the epidural space and advanced up to the L1 vertebral level where a large number of neurons corresponding to the sciatic nerve synapse. The microlead was internally anchored using 3–0 silk sutures around the musculature above the L5 spinous process, exited through the skin, and secured between steel clips used for wound closure. The cylindrical four-electrode microlead was provided by Boston Scientific (Marlborough, MA, USA) and manufactured to a diameter of 0.72 mm. The microlead was wound through a customized rat harness (Harvard Apparatus, Holliston, MA, USA), funneled through tygon tubing, and attached to an adapter circuit board and a Precision Plus (Boston Scientific) internal pulse generator (IPG). The IPG unit and circuit board were suspended by a counterweight system that was adjusted to keep the tubing up and out of the way while allowing free movement of the rat without excess tugging on the harness.
Behavioral Testing
Mechanical allodynia was measured using an electronic von Frey anesthesiometer (IITC, Woodland Hills, CA, USA) according to manufacturer’s specifications and previous literature[22]. Behavioral testing was performed two days prior to surgery for a baseline reading, and then three, four, five, and seven days post-surgery. Animals were placed in specialized cages and allowed to acclimate for 15 min. The cages were open at the top for the counterweight system which allowed for constant application of SCS. The blinded researcher performed testing using a #13 (20.0 g) filament. Force was electronically recorded and the average of five trials, spaced at least 2 minutes apart, was taken for both the ipsilateral and contralateral hindpaws.
Electrical Stimulation
After behavioral testing was performed on Day 4 post-surgery, the stimulator was turned on. Passively charge-balanced rectangular pulses were applied using a guarded cathode array of +50%, −50%, −50%, +50% across contacts 1–4, respectively. Stimulation was applied at a frequency of 10 Hz and 20 μs pulse width to establish the motor threshold (MT). Current was increased in 0.1 mA increments until reaching MT. The frequency was then increased to 50 Hz and stimulation was set to 70% of MT for the next 72 hours. Applied currents ranged from 0.3 mA to 1.4 mA.
Proteomic analysis
Following behavioral measurements on Day 7 post-surgery, animals were euthanized via CO2 inhalation. The ipsilateral dorsal quadrant of the spinal cord, where the electrodes were overlaid, was dissected and stored in RNAlater (Qiagen, Venlo, Netherlands) at −20 °C. Protein was extracted from the tissue homogenate using TRIzol (Fisher Scientific, Massachusetts) according to the manufacturer’s instructions. Protein was pelleted, dried, and then resuspended in 8 M urea, 0.1 M Tris buffer at pH 8. Cysteine residues were reduced and alkylated by addition of dithiothreitol and iodoacetamide, respectively. Then, samples were diluted with 0.1 M Tris buffer (pH 8) so that the concentration of urea was below 1 M, and trypsin (Promega Corporation, Madison, WI) was added to get a protein:enzyme ratio of 50:1 (wt/wt). The digestion was incubated at 37°C for 18 hours before quenching with trifluoroacetic acid.
Digest peptides were purified and desalted using Sep-Pak C18 cartridges (Waters). Next, peptides were labeled with ten-plex Tandem Mass Tags (TMT) to allow multiplexed quantification of 5 biological samples of each experimental group[23]. Labeled samples were then combined at a 1:1:1:1:1:1:1:1:1:1 total protein ratio and then fractionated via a polysulfoethyl A strong cation-exchange column (200 × 2.1 mm, 5 μm, 300 Å, PolyLC Inc., Columbia, MD, USA). Separation occurred over a 75-minute salt gradient. Fractions were collected every 1.5 min and re-combined into a total of 18 fractions per biological replicate. Each fraction was then desalted by C18 SPE Omix pipette tips (Agilent Technologies, Santa Clara, CA, USA) and reconstituted in 0.1% formic acid.
All LC-MS analyses were performed on a nanoAcquity HPLC (Waters, Milford, MA, USA) and an Orbitrap Elite mass spectrometer (Thermo Fisher Scientific, Waltham, MA, USA). Self-packed nano LC columns with integrated electrospray ionization (ESI) emitters were fabricated from 75 μm I.D. fused silica capillary tubes. Columns were packed with Waters BEH C18 beads (1.7 μm, 130 Å). Samples were separated over a 100 min acetonitrile gradient. Eluting peptides were electrosprayed into the mass spectrometer and sequenced via top 15 data-dependent tandem MS (MS/MS) cycles. Each HPLC fraction was individually analyzed by LC-MS, resulting in a total of 72 LC-MS runs.
All raw files were batched together and searched against the Uniprot genome-predicted proteome for Rattus Norvegicus. Peptides and proteins were identified using the Open Mass Spectrometry Search Algorithm (OMSSA)[24] in the COMPASS software suite[25]. TMT-based quantification of relative protein abundance was performed using TagQuant feature available in the COMPASS software[25]. Prior to protein ratio calculation, each TMT sample channel was median-normalized. P-values to determine significant differential regulation of proteins between experimental groups were calculated with a heteroscedastic T-test.
All proteins with a p-value < 0.05 from the mass spectrometry data were plotted using online software at String-db.org[26] to establish network mapping. All proteins were also entered into the online database Panther-db.org[27] to classify proteins and identify biological processes affected by SCS treatment based on the pairing of the quantified proteins and known curated processes. Panther assesses the total number of proteins input to form a prediction value based on the number of known proteins found in a pathway to assess a probability factor for how many proteins would be expected to randomly be found in the specific process based on the experimental protein list. This expected value in combination with the actual number of experimentally identified proteins associated with a biological process is used to calculate a p-value demonstrating confidence of the pathway identified. Additionally, a false discovery rate (FDR) p-value was also calculated from the p-value using iterative processes to predict if the study were repeated in numerous trials and the general error range were inflated thus giving a more stringent p-value for the proteins analyzed. Figure 1 shows a schematic of protein sample processing from the time the tissues were obtained through proteomic analysis and group identification.
Figure 1.
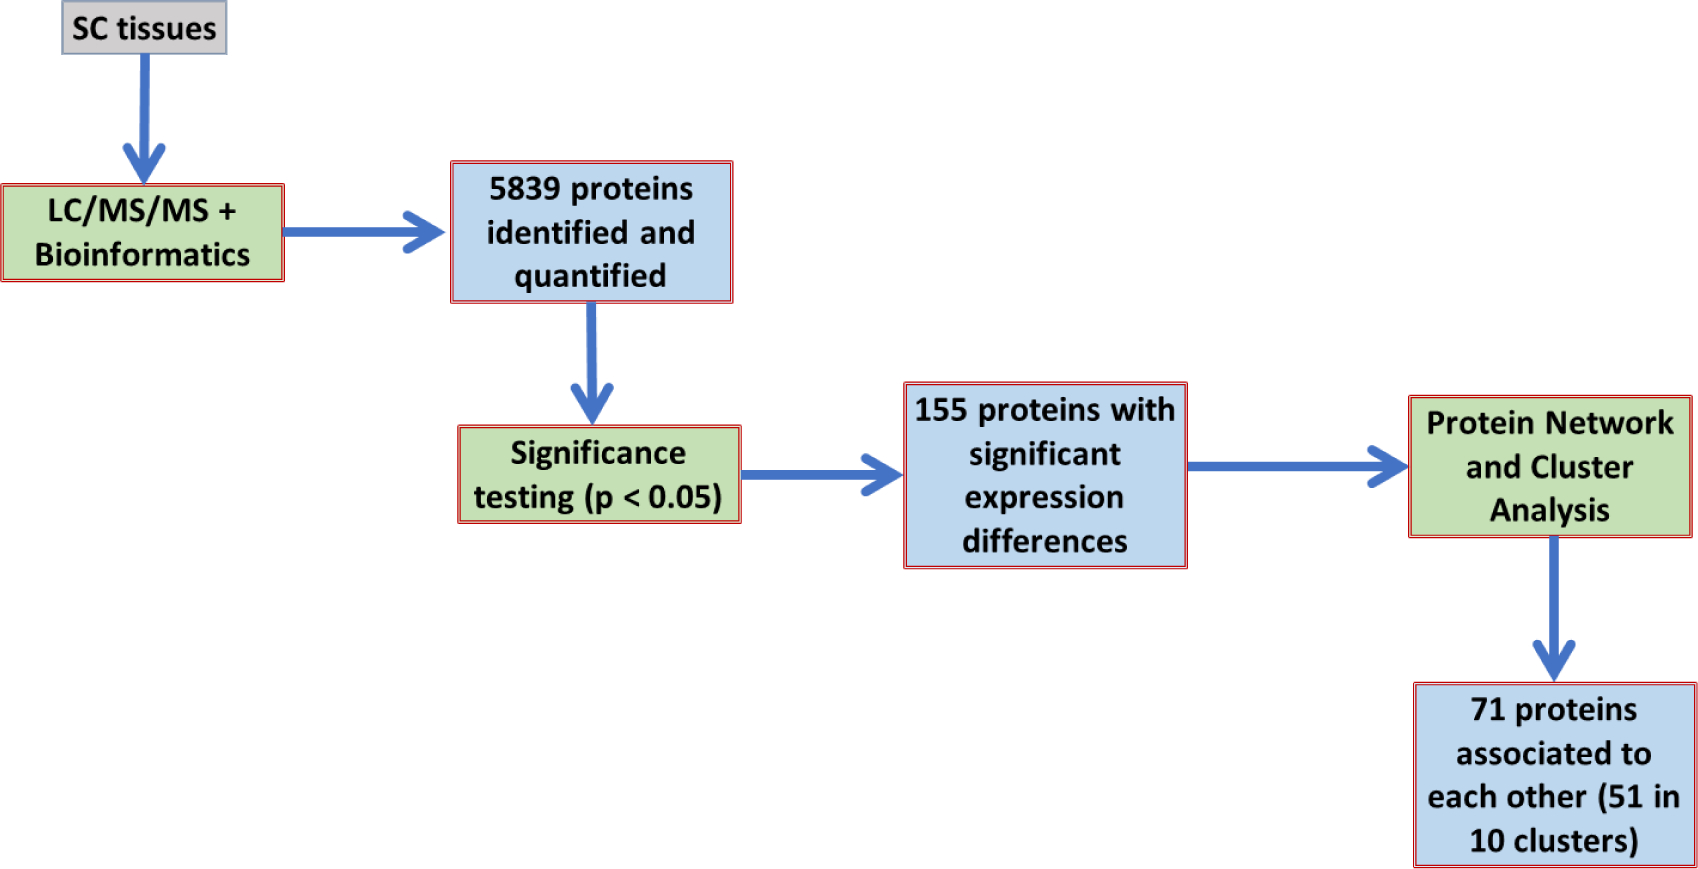
Flow chart for processing of samples through proteomic analysis. Following LC/MS/MS, there were 5,839 proteins identified and between the SCS On vs Off groups only 155 proteins demonstrated significant expression differences (p<0.05). The String Database (String-db.org)[26] was used to demonstrate protein connectivity and in combination with Panther databases (Panther-db.org)[27] to identify pathways that clusters of proteins may represent.
RESULTS
SCS reduces mechanical allodynia
The behavioral data has been previously reported [20]. Figure 2 highlights the two groups for which proteomic analyses were performed. In summary, both groups showed a significant reduction in paw withdrawal threshold following induction of the SNI model (p<0.05). Prior to applying SCS there were no statistical differences between SCS-Off and SCS-On groups (p>0.05). Following 24 hours of constant SCS stimulation (Day 5) the animals demonstrated a significant increase in percent withdrawal threshold relative to their (Day 3) pain baseline values (p=0.042) which was further enhanced after 72 hours of continuous stimulation (p=0.012).
Figure 2.
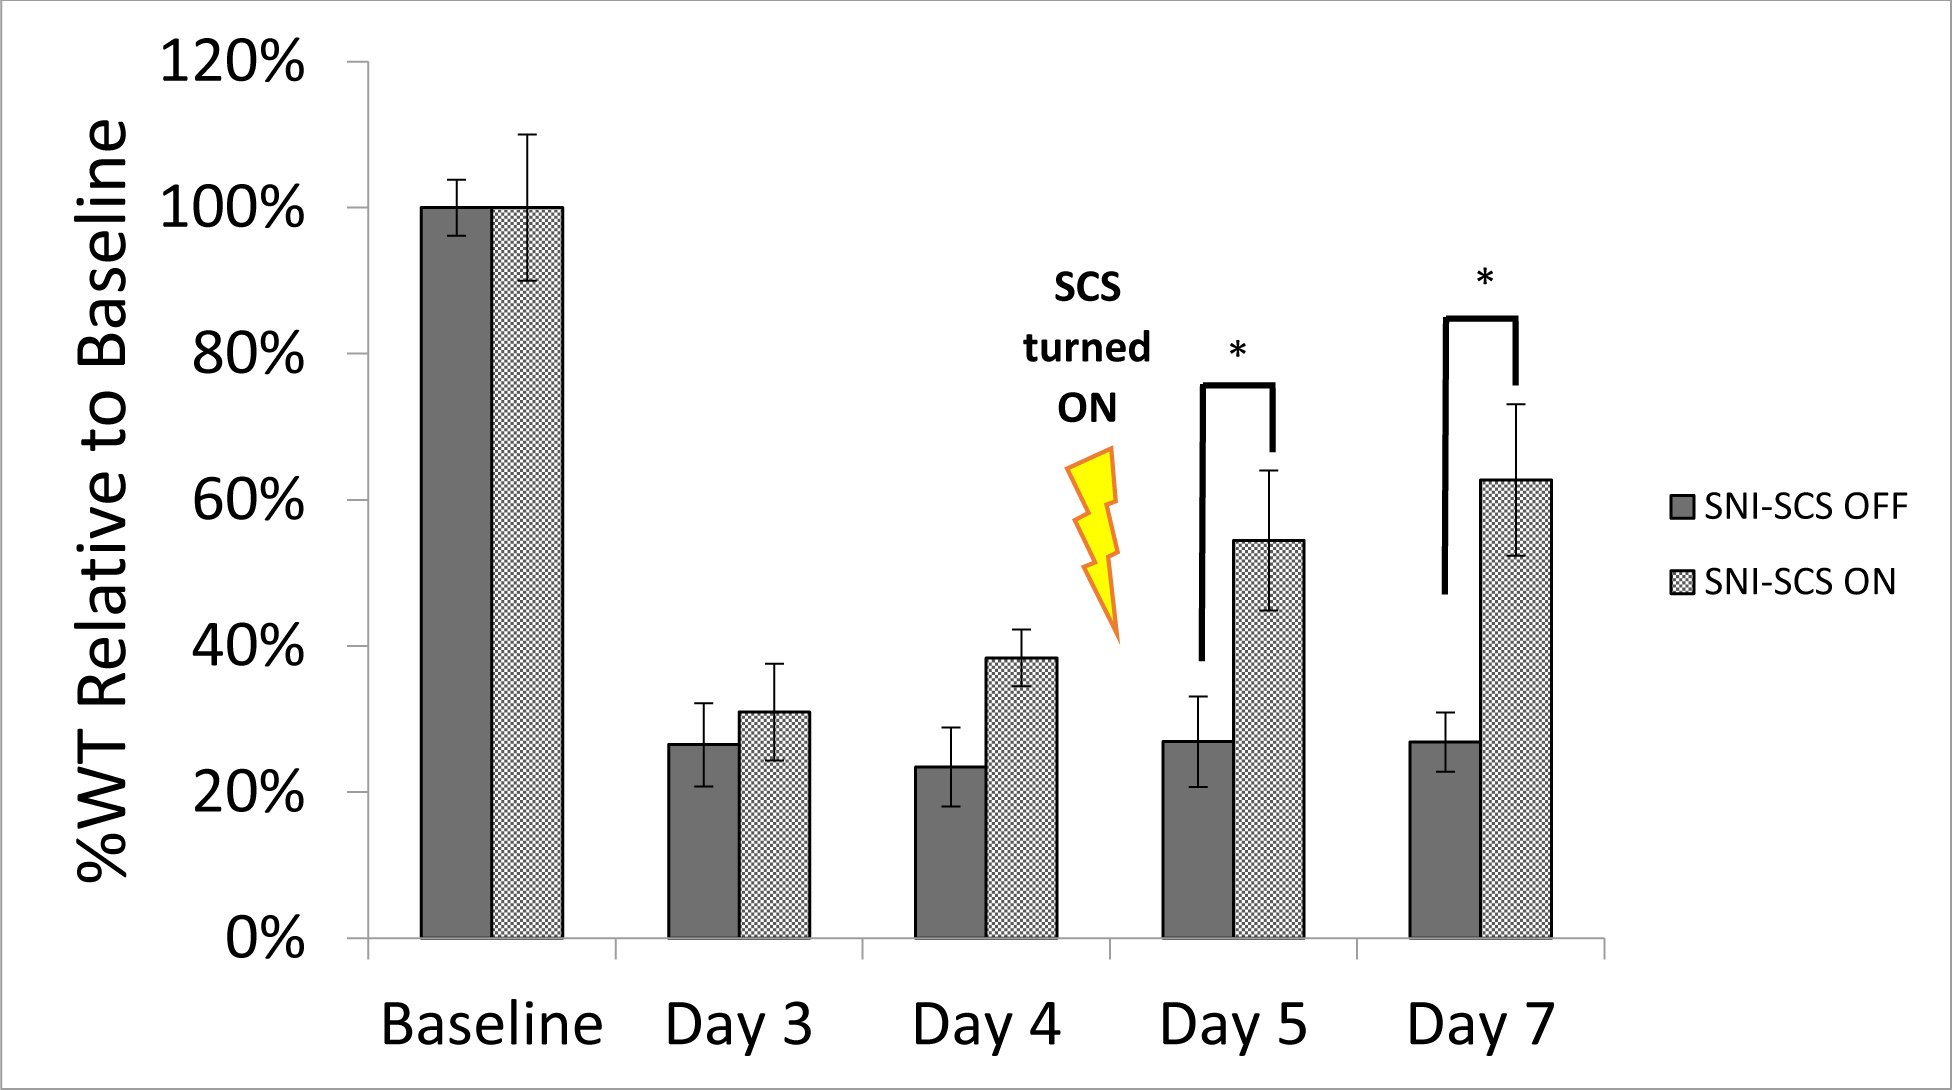
Percent withdrawal response of animals to electronic von Frey filament testing relative to baseline. No difference was observed between the groups at baseline or 3 and 4 days post injury model induction. Following Day 4 behavioral testing, SCS therapy was turned on (SCS-On) and a significant increase in withdrawal threshold was observed at Day 5 (p=0.042) and Day 7 (p=0.012) relative to animals not receiving stimulation. Significance is denoted when p<0.05 and marked in figure with asterisk (*). Error bars represent standard errors of the means.
SCS affects the proteome of the stimulated spinal cord
There were over 5,800 proteins that were identified and quantified using the LC/MS/MS method (Figure 1). Out of these, there were 155 proteins which presented with significant changes in expression as a result of SCS. Proteins identified by the Uniprot genome-predicted proteome for Rattus Norvegicus were mapped using String Database to show protein connectivity among the 155 significantly affected proteins (Figure 3). The protein network analysis yielded a protein-protein interaction enrichment p-value of 2.77 × 10⁻¹⁰ indicating a significant number of proteins were identified with enough connectivity to warrant further analyses and justifying the proteins identified were not randomly obtained but are affected by the intervention. The thickness of lines between the proteins demonstrates the variety of literature supported evidence of an interaction between the proteins. Protein analysis performed with the Panther Database was used to identify pathways each protein is involved with based on supporting literature. Only those with an FDR p-value<0.05 were evaluated (Table 1).
Figure 3.
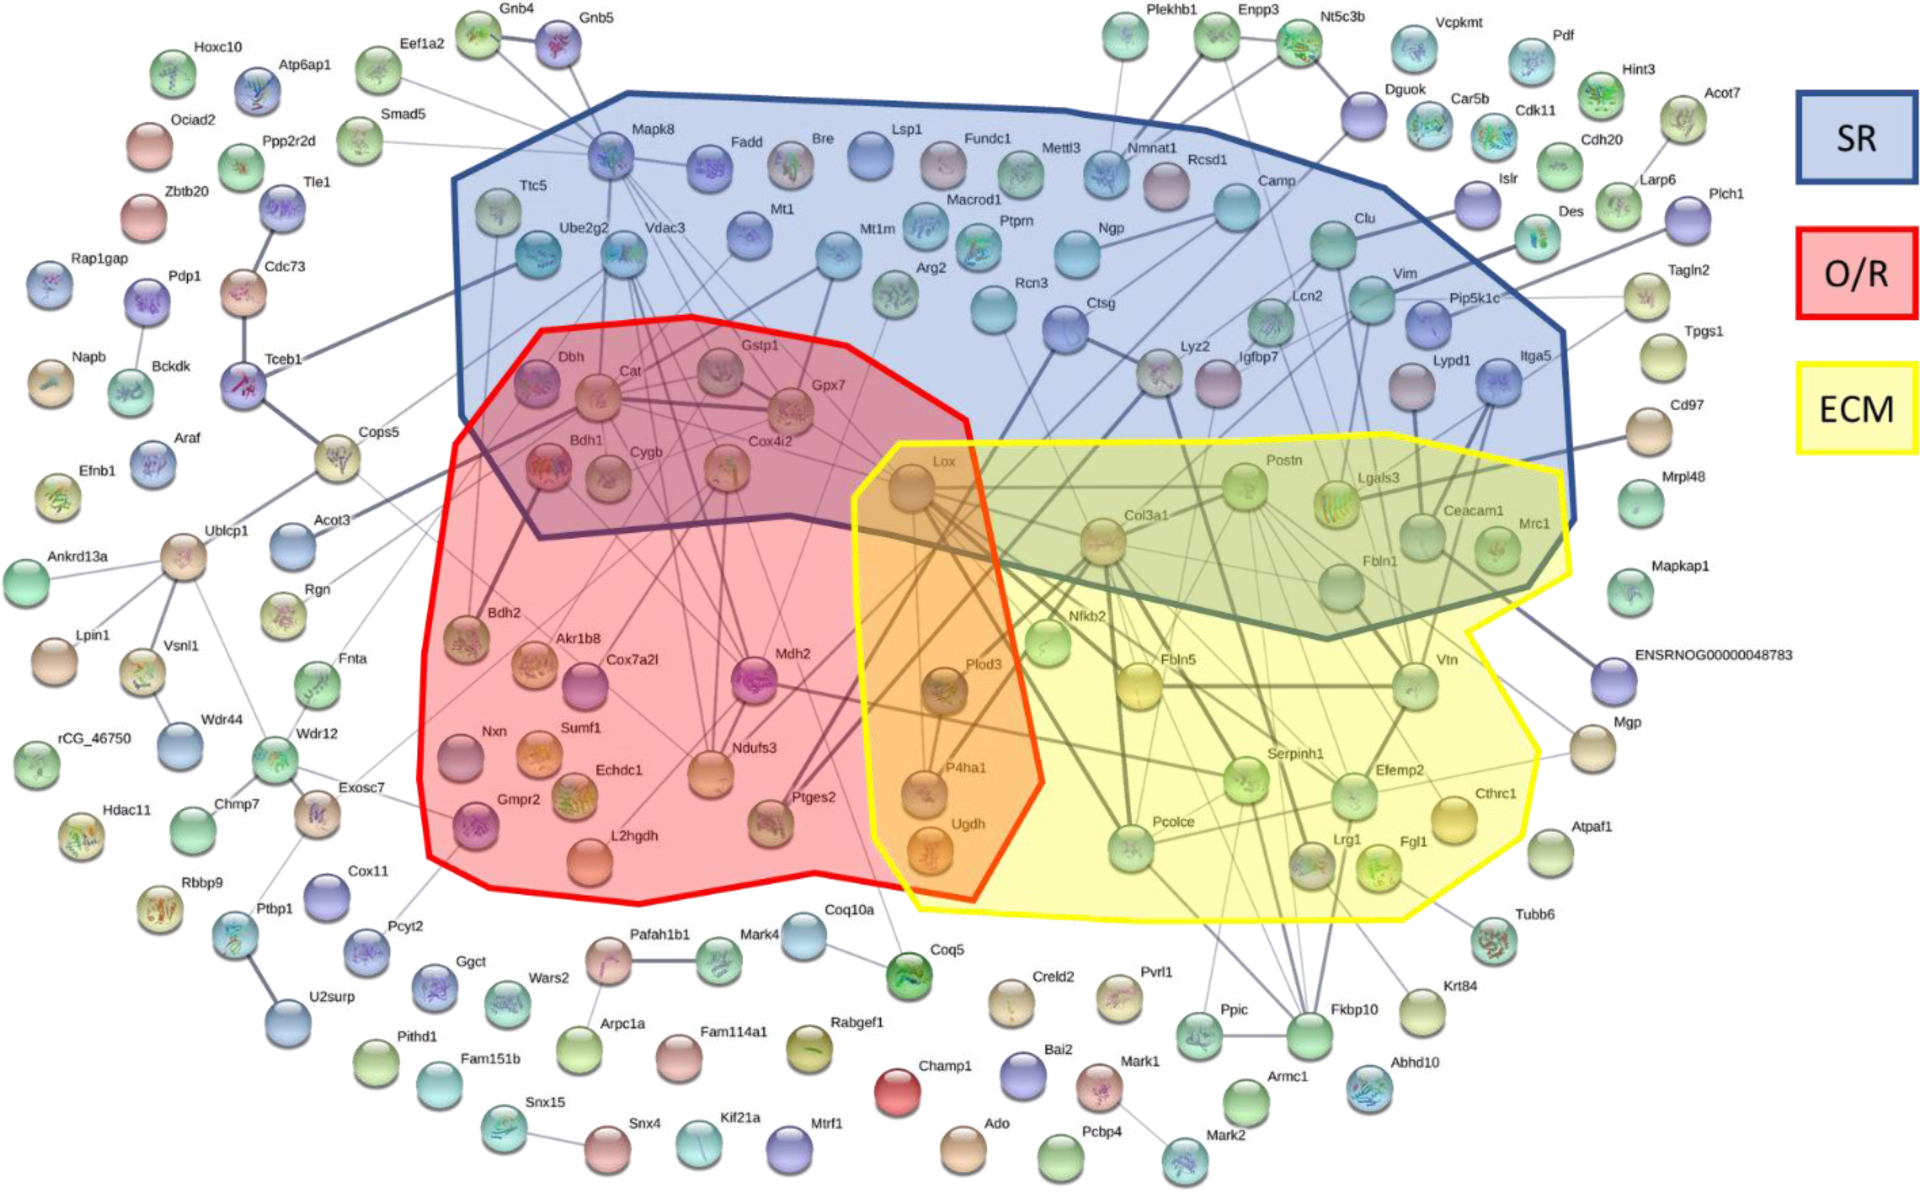
Network analysis performed using the String database to identify associations between proteins. A significant number of connections were found between the 155 proteins identified with a protein-protein interaction enrichment p-value of 2.77 × 10⁻¹⁰. Thickness of the line connecting two proteins denotes the connection strength using literature sources. Shaded boxes highlight the proteins from the stress related (SR), oxidative-reductive (O/R), and extracellular matrix (ECM) biological processes as identified by Panther.
Table 1.
Significant biological processes identified using the Panther database from proteins that were significantly altered by SCS therapy.
| GO Biological Process | # Identified Proteins | # Expected | Raw p-value | FDR p-value | Up-regulated | Down-regulated |
|---|---|---|---|---|---|---|
| Cellular process | 126 | 98.20 | 7.46 × 10⁻⁷ | 1.99 × 10⁻³ | 49 | 77 |
| Metabolic process | 85 | 52.41 | 7.16 × 10⁻⁸ | 1.14 × 10⁻³ | 24 | 61 |
| Response to stress | 42 | 22.23 | 4.18 × 10⁻⁵ | 3.93 × 10⁻² | 19 | 23 |
| Oxidation-reduction process | 22 | 6.38 | 5.31 × 10⁻⁷ | 2.12 × 10⁻³ | 8 | 14 |
| Extracellular matrix organization | 12 | 1.62 | 1.40 × 10⁻⁷ | 1.12 × 10⁻³ | 12 | 0 |
There were 59 proteins significantly upregulated. When these were mapped using the String database, and analyzed for GO enrichment, the most significant enriched (FDR-p<5×10⁻⁶) biological processes are associated with collagen fibril organization and extracellular matrix organization. A similar analysis for the 96 significantly downregulated proteins resulted in significant GO enrichment (FDR-p<7×10⁻³) for metabolic processes in which about a third of these proteins are involved. Interestingly, 15 out of such 34 proteins are also enriched in the phosphate-containing compound metabolic process. This implies some role by protein phosphorylation, which is a key process in cell signaling. Furthermore, 25 of these 34 proteins have a GO molecular function identified as catalytic activity, which further supports the role of these proteins in cell signaling. Some of these proteins are clustered around a phosphorylating protein node (MAPK8/10), which are enriched in the stress-related biological process(Figure 3), and has previously been shown to be involved in JNK signaling which is relevant to microglia activation and pain.
Extracellular Matrix related processes (Organization/Signaling)
The extracellular matrix (ECM) of neural tissue provides structural and biochemical support at the synapses. The ECM is closely involved in signaling between cells and provides attachment for nearby or migrating cells, such as microglia in the CNS. Of the 12 proteins identified by the Panther database, all were up-regulated following SCS therapy and are involved in the composition or remodeling of the ECM. Some of these proteins, such as Cathepsin G (CTSG), which was up-regulated 210%, are involved in protein cleavage and help to cleave ECM proteins resulting in changes in intracellular signaling cascades[12].
Oxidation-Reduction (Redox) pathways
There were 22 proteins identified as involved in redox pathways. Of those 22 proteins, 8 were up-regulated and 14 were down-regulated. Some of these proteins are involved in the Wnt-signaling cascade like Collagen triple helix repeat-containing protein 1 (CTHRC1) which was increased 113% in the SCS-On treatment group. Cell signaling pathways are governed by redox regulation, but also the signaling pathways regulate the cellular redox state in a feedback dependent manner. When neurons or glial cells are activated by extracellular stimuli, cells commonly produce ROS-related proteins, which then stimulate other cellular signaling pathways, indicating that ROS act as second messengers. Evidence shows that the cell’s fate is determined by cross-talk between the cell signaling pathways and the cellular redox state through a complicated regulation mechanism. The number of redox related proteins demonstrate significant changes within the spinal cord tissue in response to the SCS therapy.
Stress Response (Wound healing)
The application of SCS resulted in changes in 42 proteins involved in responding to stress and/or wound healing. Of these proteins, 23 were up-regulated and 19 were down-regulated. Notably, SCS decreased expression of some stress induced proteins like mitogen-activated protein kinase 10 (MAPK10; −17%), demonstrating that SCS therapy affects entire signaling cascades. Of the 42 stress activated proteins identified, 7 are also classified as wound healing and all of which were up-regulated proteins. Given that stress response proteins are not all negatively influencing to the cells, i.e. inflammatory inducing or apoptosis related, the SCS treatment appears to have a broad impact on the stress response cascade induced by the SNI model in these animals.
Metabolic Process
There were 85 proteins identified as involved in cellular metabolic processes. Of these 85 proteins, 24 were up-regulated and 61 were down-regulated. When an injury state develops, the overall activity of the cells increases which then promotes metabolism not just for energy but also to remove expressed proteins as part of the cyclic feedback within the cell. As such, it would be expected that a greater majority of the metabolic related genes are down-regulated following SCS as they would be returning to a more stable state.
Proteomic Literature Comparison
Proteomic data from five studies show a combined 538 proteins found to be significantly modulated by the SNI model[4, 5, 28–30]. Of the 155 proteins found to be significantly affected by SCS therapy, 33 overlap with the 538 proteins identified in literature as affected by the injury model. The overlapping proteins between our data and prior literature were entered into the String Database and a PPI enrichment p-value <0.0005 indicates a strong association among the proteins (Figure 4). The predominant biological process identified among the 33 proteins is the cellular response to stimulus (FDP p-value=0.0084) of which 14 of the 33 proteins have a known association. The 33 overlapping proteins are listed in Table 2, which includes the corresponding biological process identified in Figure 3, whether they were up- or down-regulated following induction of an injury model (based on literature), and if SCS reversed changes induced by the SNI model.
Figure 4.
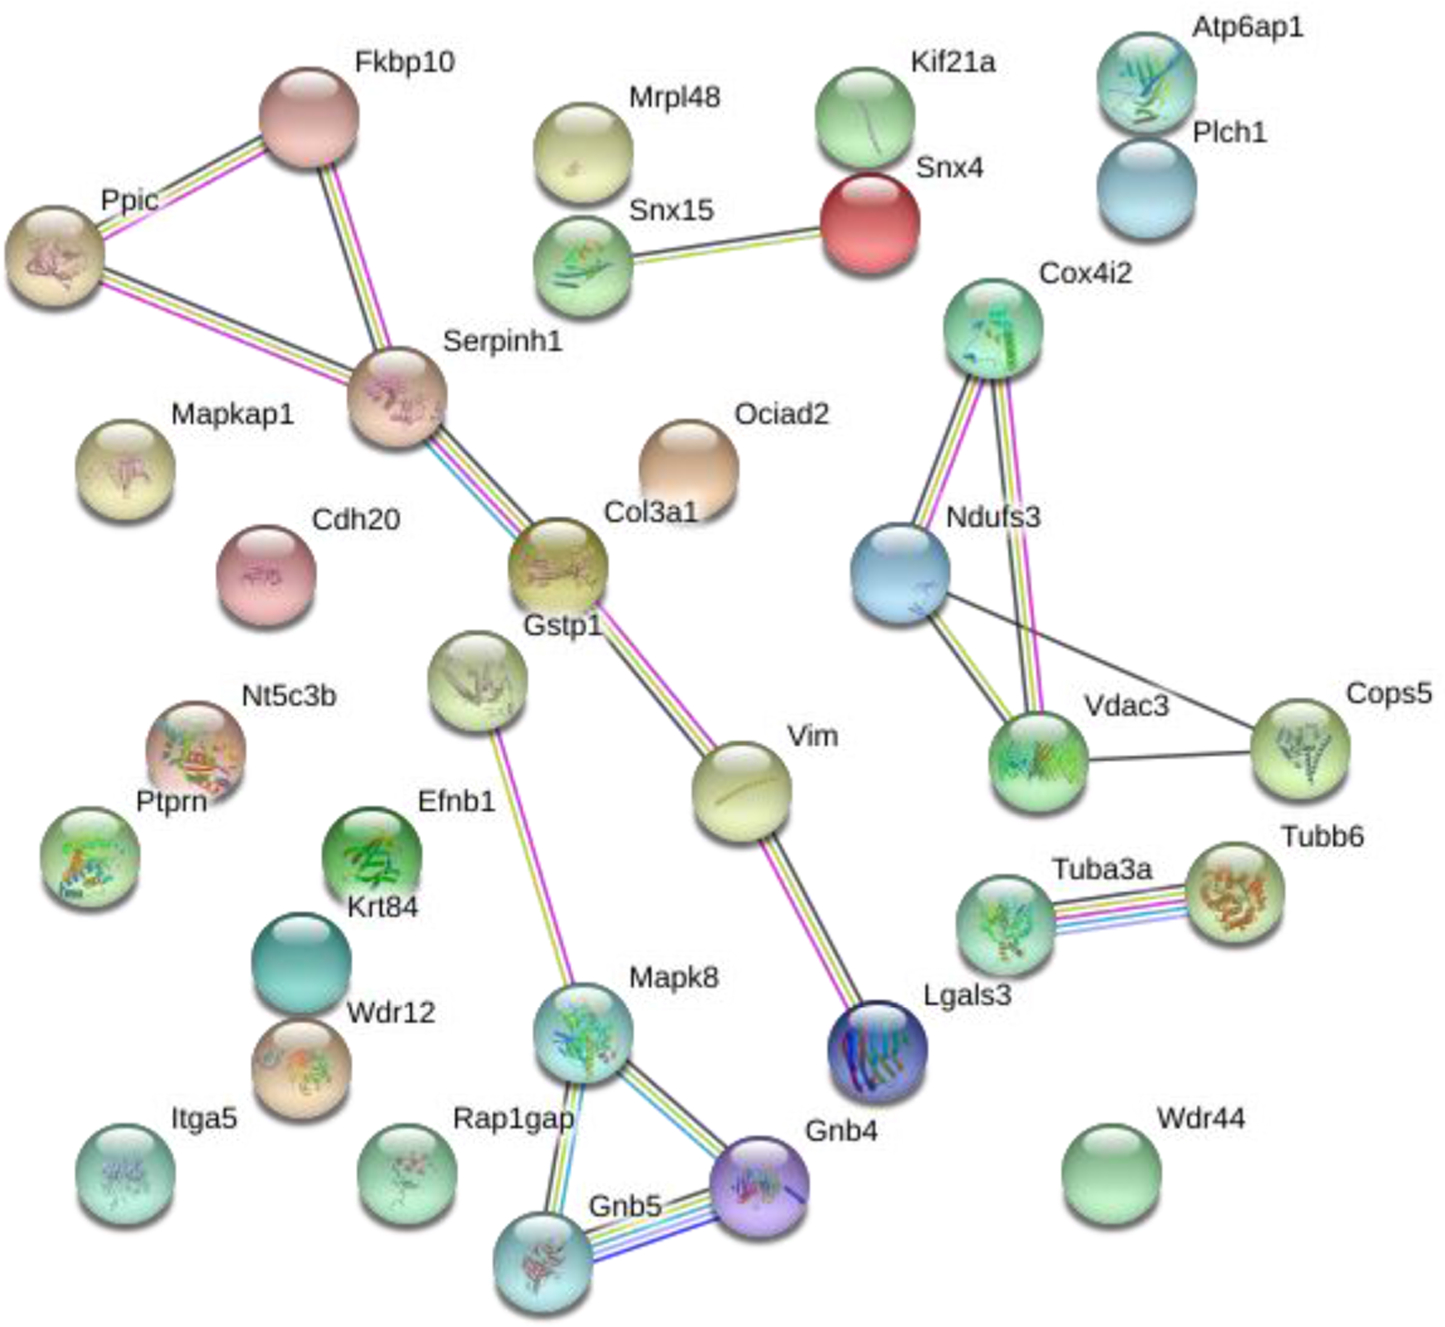
Network analysis performed on proteins overlapping with prior literature. The String database demonstrates a significant number of connections between the 33 proteins with a protein-protein interaction enrichment p-value<0.0005.
Table 2.
List of proteins overlapping between proteomic results from current study and prior literature. Previously identified GO processes are listed for each protein as well as the effect of SCS. All proteomic literature sources utilized the SNI model and protein changes are reflective of injury or SCS therapy.
| Protein Name | Panther GO Processes | Injury model induced (From Literature) | SCS Reversed? |
|---|---|---|---|
| Cadherin | Up | ||
| ECM/SR/Metab. | Down | Yes | |
| Metab. | Up | Yes | |
| OR/SR/Metab. | Down | No | |
| Up | No | ||
| Metab. | Down | Yes | |
| Up | Yes | ||
| Up | Yes | ||
| OR/SR/Metab. | Down | No | |
| SR | Up | No | |
| Down | No | ||
| Up | Yes | ||
| ECM/SR/Metab. | Up | No | |
| SR/Metab. | Up | Yes | |
| SR/Metab. | Up | Yes | |
| Down | No | ||
| OR/Metab. | Down | No | |
| Metab. | Up | Yes | |
| Down | No | ||
| Metab. | Up | No | |
| Metab. | Down | Yes | |
| SR/Metab. | Up | Yes | |
| Up | Yes | ||
| ECM/Metab. | Up | No | |
| Up | Yes | ||
| Up | Yes | ||
| Down | No | ||
| Down | Yes | ||
| SR | Down | No | |
| Up | Yes | ||
| SR | Down | Yes | |
| Metab. | Down | No | |
| Metab. | Down | No |
denotes two isoforms of same protein identifiedECM = Extracellular matrix, OR = Oxidative reductive, SR = Stress response, Metab. = metabolic
Similarly, in previous work from our lab, a transcriptomic analysis was done to determine changes in gene expression due to SCS under similar conditions. That study showed 111 genes were identified within the spinal cord tissue that overlapped with genomic data from other literature sources[20]. Of these 111 overlapping genes, the current proteomic data shows that 35 proteins matched the expression changes of their respective genes. Genomic changes are often more prolific than proteomic changes, thus not all transcripts are fully translated into proteins due to feedback mechanisms resulting in degradation of mRNA transcripts. The 35 overlapping genes and proteins were plotted based on their fold-change in expression and demonstrated a strong correlation (R2=0.73) between changes in genomic and proteomic expression (Figure 5).
Figure 5.
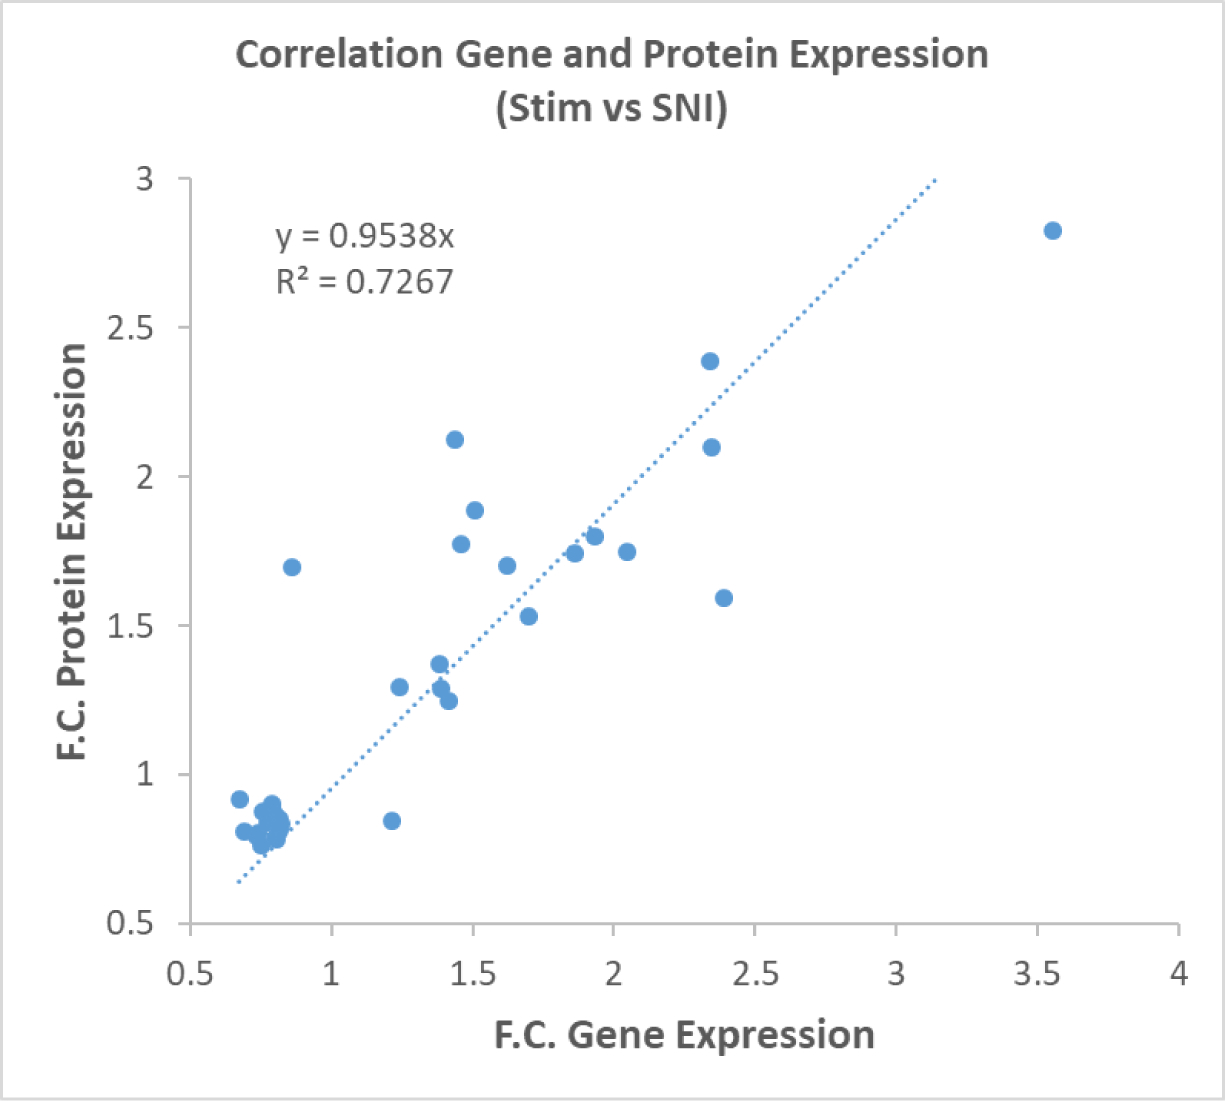
Correlated gene expression profile and protein expression profile in SCS treated animals. This correlation plot demonstrates a strong correlation between increased transcriptomic and proteomic expression profiles.
DISCUSSION
This study examined the modulation of protein expression in an animal model of neuropathic pain treated with continuous SCS therapy. Behavioral data demonstrated the onset of a neuropathic pain state following induction of the SNI model based on a significant reduction in withdrawal threshold (p<0.05). A significant increase in withdrawal threshold was observed within 24 hours (p=0.042) of SCS therapy that became more pronounced after 72 hours (p=0.012). The ipsilateral dorsal quadrant of the spinal cord was excised, and protein content was evaluated.
Using a type of conventional SCS, 50Hz with a 20us pulse duration, there were 5,389 proteins identified in the spinal cord tissues from both experimental groups. Of those proteins identified, 155 proteins were found to be significantly different between injured animals with or without SCS intervention. Previous studies have demonstrated significant protein expression changes in the spinal cord following induction of the SNI model[28–30] with 33 proteins commonly identified between prior literature and our comparative groups (Table 2). Overlapping pathways found to be affected by the SNI model and SCS were ECM organization, metabolism, stress response (including wound healing), and oxidative-reductive pathways.
Upon further classification using literature sources, there were an additional 8 proteins, CEACAM1, CTHRC1, CTSG, FGL1, LRG1, MRC1, PCOLCE, and UGDH, found to be involved in ECM remodeling or structure totaling 20 proteins. Interestingly, all 20 proteins were significantly up-regulated. Out of all 56 up-regulated proteins modulated by SCS, more than one third of them were ECM related indicating the importance of ECM remodeling following SCS therapy. In the spinal cord, glial cells have been shown to modulate changes in the neural ECM following a peripheral injury[11, 31]. Additionally, SCS has been shown to reverse activation of glial cells based on a reduction in markers commonly associated to activated microglial or astrocyte cells[18]. The neuron-glial cell-cell interactions and signaling cascades are heavily dependent on regulatory changes in ECM proteins[11]. The ECM provides structural and biochemical support at the synapse. Degradation of ECM can induce maladaptive changes and unbalancing of synapses leading to neuropathic pain[11, 32]. The ECM facilitates scaffolding for cells and also contains a variety of cell signaling proteins that upon binding can either activate or inhibit cells in response to a stimulus. This data indicates that SCS mode of action may involve reshaping of the ECM leading to normalization of cell-to-cell interactions and thus, ECM proteins may serve as potential biomarkers and/or therapeutic targets to treat chronic neuropathic pain and be a focus for future SCS studies.
Proteomic studies of the SNI model have shown altered protein expression within the spinal cord[4, 5, 28–30], which was found to have a degree of reversed expression following SCS therapy. Proteins involved in metabolism like cytochrome c oxidase (COX4I2), increased in SNI[5] and decreased by SCS (−20%), or proteins involved in redox pathways like NADH dehydrogenase iron-sulfur protein (NDUFS3), increased in SNI[5] and decreased by SCS (−21%), demonstrate SCS affects expression of intracellular as well as extracellular proteins. Over 70% of all metabolism related proteins were downregulated following SCS therapy. Any injury within a system causes an increase in metabolic activity to both begin repair of the damage as well as to replace signaling molecules released immediately following the injury[33]. As such, a negative change in metabolic protein expression indicates SCS can affect the reversal of cellular activity induced by the injury state.
Most of the proteins involved in the ECM, which are upregulated by SCS, are associated with collagen activity, procollagen modifications, cell adhesion, and integrin signaling. Interestingly, this cluster of proteins is associated to JNK (i.e. MAPK) signaling via a redox system mediated by LOX (lysine-6-oxidase). LOX catalyzes the oxidation of collagen fibrils, which is associated to hydrogen peroxide and is tightly regulated by enzymes like GPX7 (Glutathione peroxidase 7). Previous research has determined that changes in ECM proteins such as collagens and vitronectin, which are modulated by SCS, have been implicated in JNK-based signaling[34]. JNK-signaling is activated by pro-inflammatory cytokines that are expressed by glial cells in response to injury. The expression of MAPK8 and MAPK10 are upregulated by nerve injury[35]. SCS down regulates MAPK10 relative to untreated animals, implying that SCS is able to decrease the effect of JNK signaling.
Of the injury related proteins identified in Table 2, the majority underwent reversed expression following SCS therapy. Additionally, the main biological process associated with 30 of the 33 proteins, cellular response to stimulus, was down-regulated by SCS. This indicates that the effect of SCS appears to be a reversal of the injury evoked response perhaps directly or as a secondary effect of altered protein expression induced by SCS.
CONCLUSION
Neurons and glial cells respond to their electrochemical environment to modulate action potentials and alter signaling to the brain. The electric field applied during SCS therapy affects cell-- cell signaling and modifies the cellular protein environment. As new technologies and stimulation schemes for SCS therapy emerge, a better understanding of the cellular and molecular changes imposed by SCS is crucial to optimize patient outcome. Currently, SCS is being used to treat pain without a clear understanding of how the electric field affects the neuron-glial environment and modifies the proteome to a more balanced state. Understanding the proteomics of the neuron-glial interaction following SCS therapy will enable evidence-based technological advancement and result in enhanced patient efficacy and overall satisfaction.
Supplementary Material
Table 3.
List of proteins significantly modulated by SCS in this study that positively correlate with modulation of the respective gene.
| Protein | Fold Change (On/Off) | Gene | Fold Change (On/Off) |
|---|---|---|---|
| Lysozyme 2 | 2.83 | Lyz2 | 3.55 |
| Galectin 3 (LEG3) | 1.59 | Lgals3 | 2.39 |
| Periostin | 2.10 | Postn | 2.34 |
| Metallothionein-1 (MT1) | 2.39 | Mt1 | 2.34 |
| Leucine-rich alpha-2-glycoprotein 1 | 1.75 | Lrg1 | 2.05 |
| Collagen alpha-1(III) chain (CO3A1) | 1.80 | Col3a1 | 1.93 |
| Lymphocyte specific 1, isoform CRA_a | 1.86 | Lsp1 | 1.74 |
| Protein-lysine 6-oxidase (LYOX) | 1.53 | Lox | 1.70 |
| Ectonucleotide pyrophosphatase phosphodiesterase family member 3 (ENPP3) | 1.70 | Enpp3 | 1.62 |
| Fibulin-1 | 1.89 | Fbln1 | 1.51 |
| Peptidyl-prolyl cis-trans isomerase | 1.77 | Ppic | 1.46 |
| Collagen triple helix repeat-containing protein 1 (CTHR1) | 2.12 | Cthrc1 | 1.44 |
| Polypyrimidine tract-binding protein 1 (PTBP1) | 1.25 | Ptbp1 | 1.41 |
| EGF-containing fibulin extracellular matrix protein 2 | 1.29 | Efemp2 | 1.39 |
| Ephrin B1, isoform CRA_a | 1.37 | Efnb1 | 1.38 |
| Nuclear factor kappa B subunit 2 | 1.29 | Nfkb2 | 1.24 |
| Septin 8 | 0.835 | Sept8 | 0.821 |
| Mitogen-activated protein kinase 10 | 0.828 | Mapk10 | 0.818 |
| ATP synthase mitochondrial F1 complex assembly factor 1 | 0.852 | Atpaf1 | 0.818 |
| Mycophenolic acid acyl-glucuronide esterase, mitocondrial (ABHDA) | 0.823 | Abhd10 | 0.815 |
| Mitochondrial ribosomal protein L48 | 0.830 | Mrpl48 | 0.814 |
| Ubiquitin-like domain-containing CTD phosphatase 1 (UBCP1) | 0.814 | Ublcp1 | 0.814 |
| ADP-ribose glycohydrolase MACROD1 (MACD1) | 0.785 | Macrod1 | 0.806 |
| Cytochrome c oxidase copper chaperone COX11 | 0.846 | Cox11 | 0.805 |
| CHMP family, member 7 (Predicted), isoform CRA_a | 0.869 | Chmp7 | 0.799 |
| NADH dehydrogenase (Ubiquinone) Fe-S protein 3 (Predicted), isoform CRA_c | 0.789 | Ndufs3 | 0.798 |
| RAB guanine nucleotide exchange factor (GEF) 1 (Predicted), isoform CRA_a | 0.904 | Rabgef1 | 0.790 |
| Chromosome alignment maintaining phosphoprotein 1 | 0.893 | Champ1 | 0.787 |
| Catalase (CAT) | 0.842 | Cat | 0.773 |
| PITH domain-containing 1 | 0.878 | Pithd1 | 0.754 |
| Cytochrome c oxidase subunit 7A2-like | 0.764 | Cox7a2l | 0.749 |
| Cytosolic acyl coenzyme A thioester hydrolase (BACH) | 0.803 | Acot7 | 0.739 |
| Lipin 1 | 0.796 | Lpn1 | 0.734 |
| Beta-soluble NSF attachment protein | 0.810 | Napb | 0.693 |
| WD repeat-containing protein 44 (WDR44) | 0.918 | Wdr44 | 0.674 |
ACKNOWLEDGEMENTS
This work was primarily funded by the Millennium Pain Center LLC, Bloomington, IL USA and partially supported by the National Institute of Health Grant 1R01DK071801 and P41GM108538. The Orbitrap instrument was purchased through the support of the NIH shared instrument grant (NIH-NCRR S10RR029531 to L.L.).
REFERENCES
- 1.Colburn RW, et al. , Dissociation of microglial activation and neuropathic pain behaviors following peripheral nerve injury in the rat. J Neuroimmunol, 1997. 79(2): p. 163–75. [DOI] [PubMed] [Google Scholar]
- 2.Gwak YS, Hulsebosch CE, and Leem JW, Neuronal-Glial Interactions Maintain Chronic Neuropathic Pain after Spinal Cord Injury. Neural Plast, 2017. 2017: p. 2480689. [DOI] [PMC free article] [PubMed] [Google Scholar]
- 3.Vallejo R, et al. , The role of glia and the immune system in the development and maintenance of neuropathic pain. Pain Pract, 2010. 10(3): p. 167–84. [DOI] [PubMed] [Google Scholar]
- 4.Rouwette T, et al. , Standardized Profiling of The Membrane-Enriched Proteome of Mouse Dorsal Root Ganglia (DRG) Provides Novel Insights Into Chronic Pain. Mol Cell Proteomics, 2016. 15(6): p. 2152–68. [DOI] [PMC free article] [PubMed] [Google Scholar]
- 5.Barry AM, et al. , Region-Resolved Quantitative Proteome Profiling Reveals Molecular Dynamics Associated With Chronic Pain in the PNS and Spinal Cord. Front Mol Neurosci, 2018. 11: p. 259. [DOI] [PMC free article] [PubMed] [Google Scholar]
- 6.Ji RR, et al. , Matrix metalloprotease regulation of neuropathic pain. Trends Pharmacol Sci, 2009. 30(7): p. 336–40. [DOI] [PMC free article] [PubMed] [Google Scholar]
- 7.Milner R and Campbell IL, The integrin family of cell adhesion molecules has multiple functions within the CNS. J Neurosci Res, 2002. 69(3): p. 286–91. [DOI] [PubMed] [Google Scholar]
- 8.Milner R and Campbell IL, The Extracellular Matrix and Cytokines Regulate Microglial Integrin Expression and Activation. The Journal of Immunology, 2003. 170(7): p. 3850–3858. [DOI] [PubMed] [Google Scholar]
- 9.Smith JA, et al. , Role of pro-inflammatory cytokines released from microglia in neurodegenerative diseases. Brain Res Bull, 2012. 87(1): p. 10–20. [DOI] [PMC free article] [PubMed] [Google Scholar]
- 10.Dina OA, et al. , Integrin signaling in inflammatory and neuropathic pain in the rat. Eur J Neurosci, 2004. 19(3): p. 634–42. [DOI] [PubMed] [Google Scholar]
- 11.Tajerian M and Clark JD, The role of the extracellular matrix in chronic pain following injury. Pain, 2015. 156(3): p. 366–70. [DOI] [PubMed] [Google Scholar]
- 12.Stock AJ, Kasus-Jacobi A, and Pereira HA, The role of neutrophil granule proteins in neuroinflammation and Alzheimer’s disease. J Neuroinflammation, 2018. 15(1): p. 240. [DOI] [PMC free article] [PubMed] [Google Scholar]
- 13.Chen A, et al. , Proteomic and phosphoproteomic analyses of the soluble fraction following acute spinal cord contusion in rats. J Neurotrauma, 2010. 27(1): p. 263–74. [DOI] [PMC free article] [PubMed] [Google Scholar]
- 14.Yowtak J, et al. , Reactive oxygen species contribute to neuropathic pain by reducing spinal GABA release. Pain, 2011. 152(4): p. 844–52. [DOI] [PMC free article] [PubMed] [Google Scholar]
- 15.Melzack R and Wall PD, Pain mechanisms: a new theory. Science, 1965. 150(3699): p. 971–9. [DOI] [PubMed] [Google Scholar]
- 16.Lind AL, et al. , Spinal Cord Stimulation Alters Protein Levels in the Cerebrospinal Fluid of Neuropathic Pain Patients: A Proteomic Mass Spectrometric Analysis. Neuromodulation, 2016. 19(6): p. 549–62. [DOI] [PubMed] [Google Scholar]
- 17.McCarthy KF, Connor TJ, and McCrory C, Cerebrospinal Fluid Levels of Vascular Endothelial Growth Factor Correlate With Reported Pain and Are Reduced by Spinal Cord Stimulation in Patients With Failed Back Surgery Syndrome. Neuromodulation, 2012. [DOI] [PubMed] [Google Scholar]
- 18.Sato KL, et al. , Spinal cord stimulation reduces mechanical hyperalgesia and glial cell activation in animals with neuropathic pain. Anesth Analg, 2014. 118(2): p. 464–72. [DOI] [PMC free article] [PubMed] [Google Scholar]
- 19.Wolf-Goldberg T, et al. , Low electric fields induce ligand-independent activation of EGF receptor and ERK via electrochemical elevation of H(+) and ROS concentrations. Biochim Biophys Acta, 2013. 1833(6): p. 1396–408. [DOI] [PubMed] [Google Scholar]
- 20.Vallejo R, et al. , Genomics of the Effect of Spinal Cord Stimulation on an Animal Model of Neuropathic Pain. Neuromodulation, 2016. 19(6): p. 576–86. [DOI] [PubMed] [Google Scholar]
- 21.Tilley DM, et al. , A continuous spinal cord stimulation model attenuates pain-related behavior in vivo following induction of a peripheral nerve injury. Neuromodulation, 2015. 18(3): p. 171–6; discussion 176. [DOI] [PubMed] [Google Scholar]
- 22.Vivancos GG, et al. , An electronic pressure-meter nociception paw test for rats. Braz J Med Biol Res, 2004. 37(3): p. 391–9. [DOI] [PubMed] [Google Scholar]
- 23.Rauniyar N and Yates JR 3rd, Isobaric labeling-based relative quantification in shotgun proteomics. J Proteome Res, 2014. 13(12): p. 5293–309. [DOI] [PMC free article] [PubMed] [Google Scholar]
- 24.Geer LY, et al. , Open mass spectrometry search algorithm. J Proteome Res, 2004. 3(5): p. 958–64. [DOI] [PubMed] [Google Scholar]
- 25.Wenger CD, et al. , COMPASS: a suite of pre- and post-search proteomics software tools for OMSSA. Proteomics, 2011. 11(6): p. 1064–74. [DOI] [PMC free article] [PubMed] [Google Scholar]
- 26.Szklarczyk D, et al. , STRING v11: protein-protein association networks with increased coverage, supporting functional discovery in genome-wide experimental datasets. Nucleic Acids Res, 2019. 47(D1): p. D607–D613. [DOI] [PMC free article] [PubMed] [Google Scholar]
- 27.Mi H, et al. , PANTHER version 14: more genomes, a new PANTHER GO-slim and improvements in enrichment analysis tools. Nucleic Acids Res, 2019. 47(D1): p. D419–D426. [DOI] [PMC free article] [PubMed] [Google Scholar]
- 28.Kuhlein HN, et al. , Nerve injury evoked loss of latexin expression in spinal cord neurons contributes to the development of neuropathic pain. PLoS One, 2011. 6(4): p. e19270. [DOI] [PMC free article] [PubMed] [Google Scholar]
- 29.Park ES, et al. , Proteomic analysis of the dorsal spinal cord in the mouse model of spared nerve injury-induced neuropathic pain. J Biomed Res, 2017. [DOI] [PMC free article] [PubMed] [Google Scholar]
- 30.Singh OV, et al. , Proteome of synaptosome-associated proteins in spinal cord dorsal horn after peripheral nerve injury. Proteomics, 2009. 9(5): p. 1241–53. [DOI] [PMC free article] [PubMed] [Google Scholar]
- 31.Dityatev A and Schachner M, The extracellular matrix and synapses. Cell Tissue Res, 2006. 326(2): p. 647–54. [DOI] [PubMed] [Google Scholar]
- 32.Tan AM, et al. , Maladaptive dendritic spine remodeling contributes to diabetic neuropathic pain. J Neurosci, 2012. 32(20): p. 6795–807. [DOI] [PMC free article] [PubMed] [Google Scholar]
- 33.Simsek T, Simsek HU, and Canturk NZ, Response to trauma and metabolic changes: posttraumatic metabolism. Ulus Cerrahi Derg, 2014. 30 [DOI] [PMC free article] [PubMed] [Google Scholar]
- 34.You H, Lei P, and Andreadis ST, JNK is a novel regulator of intercellular adhesion. Tissue Barriers, 2013. 1(5): p. e26845. [DOI] [PMC free article] [PubMed] [Google Scholar]
- 35.Ji RR, Berta T, and Nedergaard M, Glia and pain: is chronic pain a gliopathy? Pain, 2013. 154 Suppl 1: p. S10–28. [DOI] [PMC free article] [PubMed] [Google Scholar]
Associated Data
This section collects any data citations, data availability statements, or supplementary materials included in this article.