Abstract
Epigenetic plasticity is a pivotal factor driving metastasis. Here, we show that the promoter of the gene encoding the ubiquitin ligase subunit FBXL7 is hypermethylated in advanced prostate and pancreatic cancers, correlating with decreased FBXL7 mRNA and protein levels. Low FBXL7 mRNA levels are predictive of poor survival in patients with pancreatic and prostatic cancers. FBXL7 mediates the ubiquitylation and proteasomal degradation of active c-SRC upon its phosphorylation on Ser104. The DNA-demethylating agent decitabine recovers FBXL7 expression and limits epithelial-to-mesenchymal transition and cell invasion in a c-SRC-dependent manner. In vivo, FBXL7-depleted cancer cells form tumors with high metastatic burden. Co-silencing of c-SRC or treatment with the c-SRC inhibitor dasatinib prevents metastases. Furthermore, decitabine reduces metastases derived from prostate and pancreatic cancer cells in a FBXL7-dependent manner. Collectively, this work implicates FBXL7 as a metastasis suppressor gene and suggests therapeutic strategies to counteract metastatic dissemination of pancreatic and prostatic cancer cells.
Introduction
Metastatic spread is the most common cause of cancer-related death1–3. Cancer dissemination involves multiple steps, including cells’ escape from the primary tumor, local invasion, intravasation/extravasation, and colonization of distant tissues. Despite extensive efforts, still relatively little is known about the detailed molecular mechanisms driving metastasis during the natural history of cancer progression. One hypothesis is that epigenetic, transcriptional programs contribute to drive the metastatic cascade4.
DNA methylation is one of the epigenetic mechanisms that cells use to modulate gene expression. Gains in DNA methylation in cancer cells typically reflect hypermethylation of CpG islands in the gene promoter region that leads to highly stable gene silencing that is transmittable over the course of many cell cycles. Promoter methylation of CpG islands of many tumor suppressor genes occurs during cancer progression as an alternative mechanism to gene copy loss or mutational inactivation, thus representing a bona-fide tumor-driving event5, 6. Notably, epigenetic reprogramming has been involved in the cell plasticity required during epithelial-to-mesenchymal transition (EMT), a process in which epithelial cells lose their junctions to gain a motile, migratory mesenchymal phenotype7.
Performing pan-cancer promoter methylation analysis, we found that the gene encoding FBXL7 is frequently hypermethylated in human aggressive cancers. The studies that followed this initial observation are described herein.
Results
FBXL7 is silenced by promoter hypermethylation in advanced human cancers
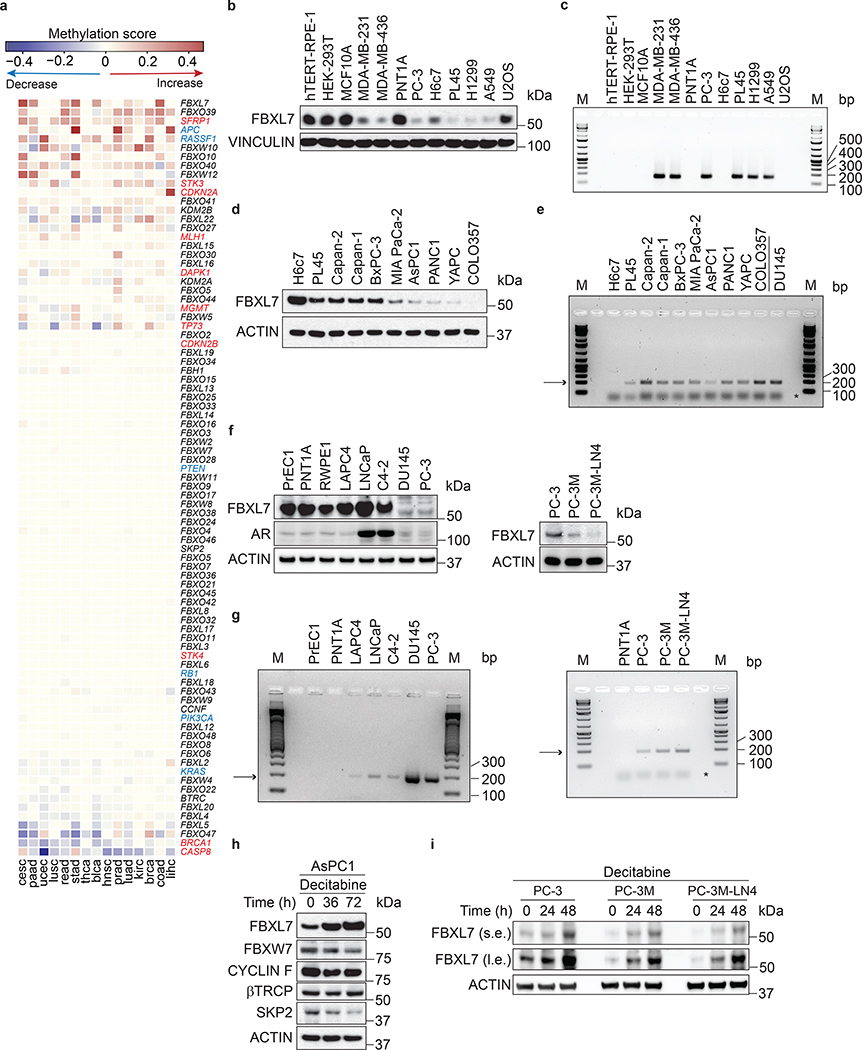
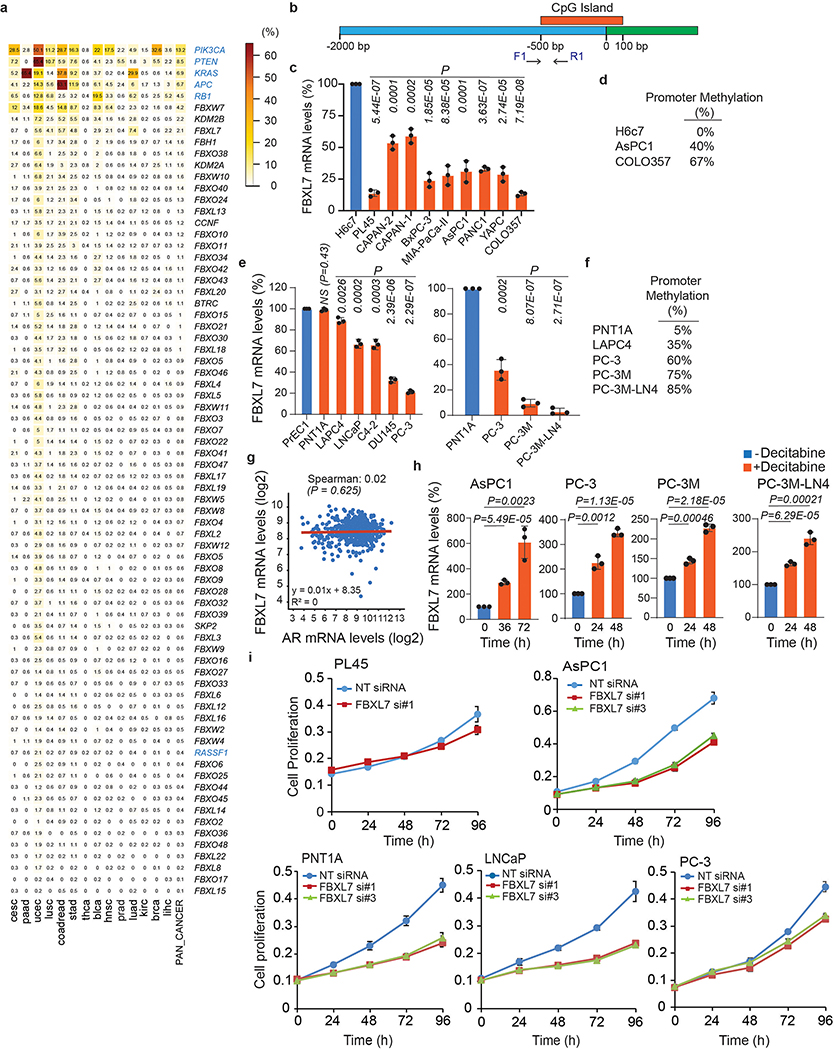
F-box proteins function as substrate receptors for SCF (SKP1, CUL1, F-box protein, RBX1) ubiquitin ligases complexes, which play important roles in the regulation of several cancer hallmarks8–10. For example, FBXW7 is the product of one of the top 20 genes mutated in human cancers. When we profiled 15 cancer cohorts of The Cancer Genome Atlas (TCGA) project, we confirmed that FBXW7 was the most highly mutated gene within the 69 members of the human F-box protein family (Extended Data Fig. 1a). However, the other members displayed only sporadic mutations. Since the promoters of many tumor suppressors are hypermethylated in human cancers to stably silence their expression, we evaluated the methylation status of the promoters of the 69 genes encoding F-box proteins. To this end, we used the same TCGA dataset and the pan-cancer methylation database MethHC (http://MethHC.mbc.nctu.edu.tw)11. As a comparison, we also analyzed 14 tumor suppressor genes, which are known to be hypermethylated in human cancers5, 6, 12. Analysis of the average beta value in tumor samples and matched normal samples showed that the promoter of the gene encoding the F-box protein FBXL7 is the most hypermethylated one among the 85 genes analyzed (Fig. 1a).
Fig. 1. FBXL7 promoter is hypermethylated in aggressive human cancers.
a, Heatmap showing promoter methylation profiles, ranked by their average methylation scores calculated across individual tumor types. Genes encoding F-box proteins are in black; genes whose promoters have been reported to be often methylated in human cancers are either in red or in blue. The latter are those also reported in Extended Data Fig. 1a.
b-c, Human immortalized normal cells from retinal pigment epithelium (hTERT-RPE-1), breast epithelium (MCF10A), prostate epithelium (PNT1A), pancreatic ductal epithelium (H6c7), invasive human breast (MDA-MB-231, MDA-MB-436), prostate (PC-3), pancreatic (PL45), lung (H1299, A549) cancer cells, human immortalized embryonic kidney cells (HEK-293T), and the U2OS human osteoblastoma cells were subjected to immunoblotting (b) or analyzed for methylation of the FBXL7 promoter (c). M, molecular weight markers.
d-e, Immortalized normal pancreatic ductal cells (H6c7), and the pancreatic cancer cell lines PL45, Capan-II, Capan-I, BxPC-3, Mia-Paca-II, AsPC1, PANC1, YAPC, and COLO357 were subjected to immunoblotting (d) or analyzed for methylation of the FBXL7 promoter (e). In e, the low-metastatic prostate cancer cells DU145 were included for comparison.
f-g, Human normal diploid (PrEC1) and immortalized (PNT1A, RWPE) prostate epithelial cells, hormone-naïve low-metastatic (LAPC4, LNCaP), castration-resistant low-metastatic (C4–2, DU145, PC-3) prostate cancer cells, and the highly metastatic derivatives of PC-3 cells (PC-3M and PC-3M-LN4) were subjected to immunoblotting (f) or analyzed for methylation of the FBXL7 promoter (g).
h, AsPC1 pancreatic cancer cells were incubated with decitabine for the indicated times and subjected to immunoblotting.
i, PC-3, PC-3M and PC-3M-LN4 cells were treated with decitabine for the indicated times and subjected to immunoblotting.
In e and g, the arrow points to methylated FBXL7 promoter, whereas the asterisk indicates the primers’ signal. b-i, three independent experiments were performed, with similar results.
FBXL7 protein was expressed at low levels in invasive cancer cells compare with paired immortalized cells (PC-3 prostate cancer cells vs. immortalized PNT1A prostate cells; PL45 pancreatic cancer cells vs. immortalized H6c7 pancreatic ductal cells; and MDA-MB-231 and MDA-MB-436 breast cancer cells vs. immortalized MCF10A breast cells) (Fig. 1b). Reduced FBXL7 protein levels in aggressive cancer cells correlated with hypermethylation of the CpG island within the FBXL7 promoter (Fig. 1c; Extended Data Fig. 1b; http://www.urogene.org/cgi-bin/methprimer/methprimer.cgi). We confirmed downregulation of FBXL7 protein, reduced FBXL7 mRNA levels, and FBXL7 promoter hypermethylation in a panel of 9 pancreatic cancer cell lines compared with immortalized H6c7 pancreatic ductal cells (Fig. 1d,e; Extended Data Fig. 1c,d).
Pancreatic cancer forms metastases very early, so, to assess whether FBXL7 promoter methylation occurs early during cancer development, we used as a model cells from prostate cancer, a slow-progressing cancer. Using primary, diploid, normal prostate epithelial cells (PrEC1), two normal immortalized prostate cell lines (PNT1A and RWPE), two hormone-naïve low-metastatic prostate cancer cell lines (LAPC4 and LNCaP), and three castration-resistant low-metastatic prostate cancer cell lines (C4–2, DU145, and PC-3)13, 14, we found that FBXL7 protein and mRNA were downregulated in the relatively more aggressive PC-3 and DU145 cells (Fig. 1f and Extended Data Fig. 1e). Consistently, FBXL7 promoter was highly methylated in PC-3 and DU145 cells (Fig. 1g and Extended Data Fig. 1f). Decreased FBXL7 protein DU145 and PC-3 cells did not correlate with changes in androgen receptor (AR) levels (Fig. 1f) and large-scale analysis of the TCGA prostate dataset showed no correlation between FBXL7 and AR mRNA levels (Extended Data Fig. 1g). We also analyzed two highly metastatic derivatives of PC-3 cells (PC-3M and PC-3M-LN4; metastatic potential: PC-3M-LN4 > PC-3M > PC-3)15 and found that the metastatic derivatives displayed even lower levels of FBXL7 protein and mRNA, and a further increase in FBXL7 promoter methylation compared to the parental PC-3 cells (Fig. 1f,g and Extended Data Fig. 1e,f).
Treatment of AsPC1 pancreatic cancer cells as well as PC-3, PC-3M, and PC-3M-LN4 prostate cancer cells with the FDA-approved methylase inhibitor 5-aza-2’-deoxycytidine (5-AZA or decitabine) increased FBXL7 protein and mRNA expression levels (Fig. 1h,i and Extended Data Fig. 1h), showing that epigenetic suppression of FBXL7 expression is a relevant mechanism in the regulation of FBXL7 levels in both prostate and pancreatic cancer.
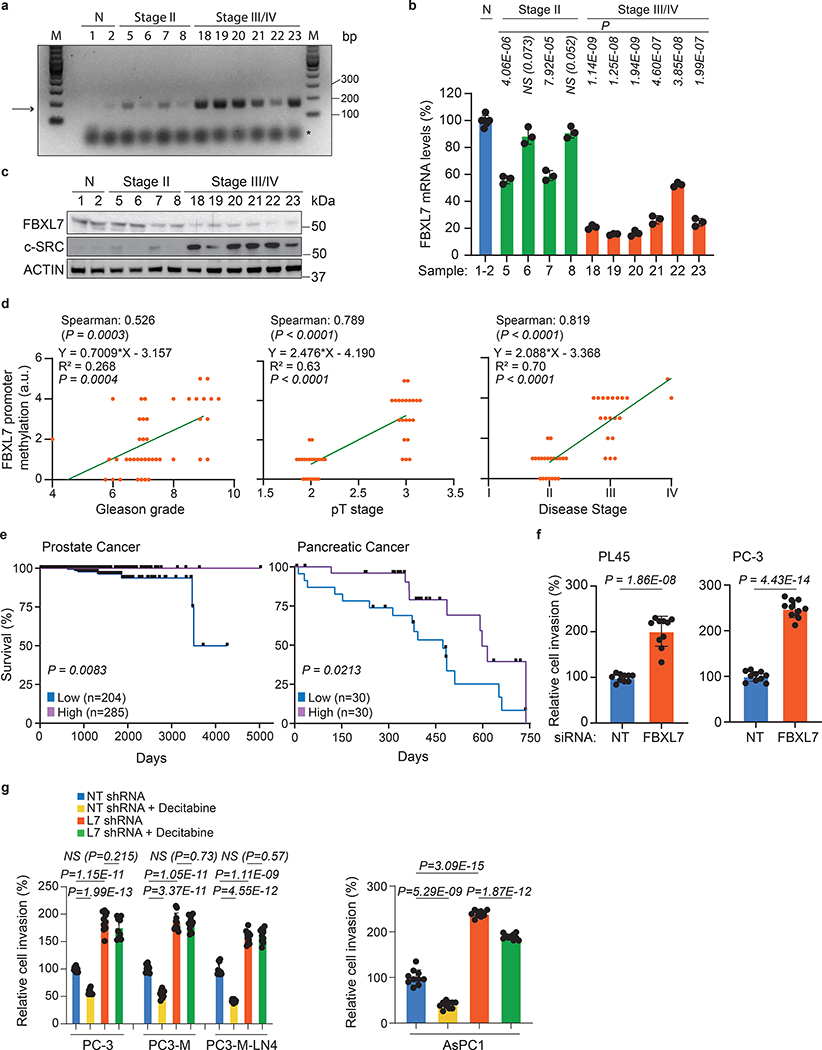
Next, we extracted genomic DNA, mRNA, and proteins from benign prostate tissues, Stage II, and Stage III/IV prostate cancer specimens, and found increased methylation of the FBXL7 promoter and decreased levels of FBXL7 mRNA and protein in Stage III/IV prostate cancers (Fig. 2a–c and Supplementary Table 1). Hypermethylation of the FBXL7 promoter was directly correlated with higher Gleason grade, and higher pathological (pT) and disease stage (Fig. 2d). Notably, survival analysis of prostate and pancreatic cancer patients revealed that patients with lower FBXL7 mRNA levels have significantly reduced survival probability (Fig. 2e), indicating that suppression of FBXL7 expression may be clinically important during cancer progression.
Fig. 2. Low FBXL7 mRNA levels predict poor survival in pancreatic and prostate cancer patients.
a-c, Normal (N) and tumor prostate specimens were analyzed for methylation of the FBXL7 gene promoter (a), FBXL7 mRNA levels (b), and levels of the indicated proteins (c). The arrow points to the methylated FBXL7 promoter, whereas the asterisk indicates the primers’ signal. Details on patients are reported in Extended Data Table 1. n = 12 biologically independent samples. a, c: Two independent experiments were performed, with similar results. b, Mean ± s.d. is shown; n = 3 independent experiments; P values are from unpaired, two-tailed t-test.
d, Correlation analysis of FBXL7 promoter methylation with Gleason grade, pT stage and disease stage for the specimens reported in Extended Data Table 1. n = 41. Two-tailed non-parametric Spearman correlation wad used. The linear regression line is shown.
e, Kaplan-Meier plot showing reduced survival probability of prostate cancer patients with low FBXL7 mRNA levels (n = 204) compared with high (n = 285) FBXL7 mRNA levels (TCGA set), and pancreatic cancer patients with low FBXL7 mRNA levels (n = 30) compared to high (n = 30) FBXL7 mRNA levels (https://www.proteinatlas.org/ENSG0000183580-FBXL7). Log rank (Mantel-Cox) statistical test was used.
f, PL45 and PC-3 cells were transfected with the indicated siRNAs and, after 24 h, re-plated on Matrigel-coated transwells. After 48 h, cells that invaded through Matrigel and migrated on the bottom of the transwells were stained and counted in 10 different fields/well. Each experiment was performed in triplicate. The graph shows quantification from a representative experiment.
g, The indicated cells stably transfected with a pool of shRNAs to FBXL7 or a non-targeting (NT) shRNAs were plated on Matrigel-coated transwells in the presence or absence of decitabine. Each experiment was performed in triplicate. After 48–72 h, cells that invaded through Matrigel were counted as in 2f. The graph shows quantification from a representative experiment. In f, g: two independent experiments were performed with similar results. Mean ± s.d. is shown; n = 10; P values are from unpaired, two-tailed t-test.
We next assessed the oncogenic potential of FBXL7 downregulation in cell systems. FBXL7 knockdown in pancreatic and prostate cancer cells significantly increased cell invasion through a layer of Matrigel (Fig. 2f), but not cell proliferation, which was instead inhibited (Extended Data Fig. 1i). Notably, treatment of AsPC1, PC-3, PC-3M, and PC-3M-LN4 cells with decitabine significantly decreased cell invasion (Fig. 2g). This phenotype was dependent on FBXL7 expression, since decitabine had no effect or a modest effect in the context of FBXL7 silencing. This result suggests that FBXL7 downregulation increases the metastatic potential of tumor cells, while suppression of FBXL7 promoter methylation decreases it, and shows that decitabine works, at least in part, by upregulating FBXL7.
FBXL7 mediates the proteasomal degradation of active c-SRC upon phosphorylation on Ser104
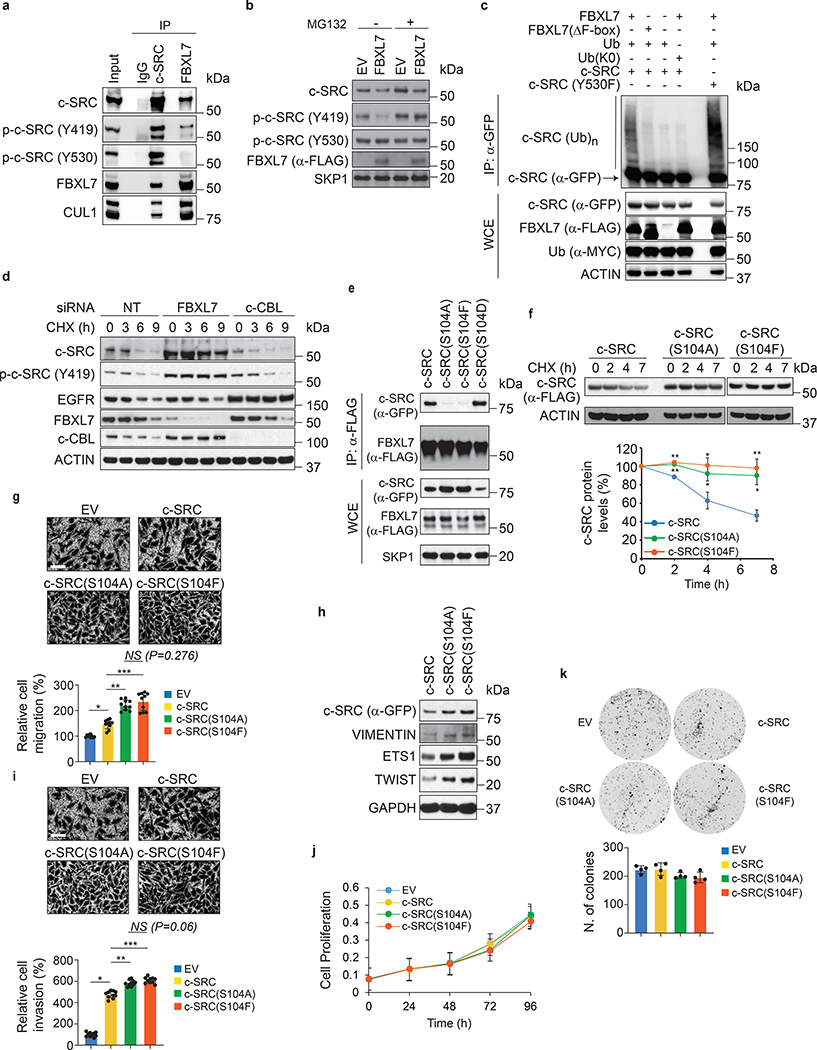
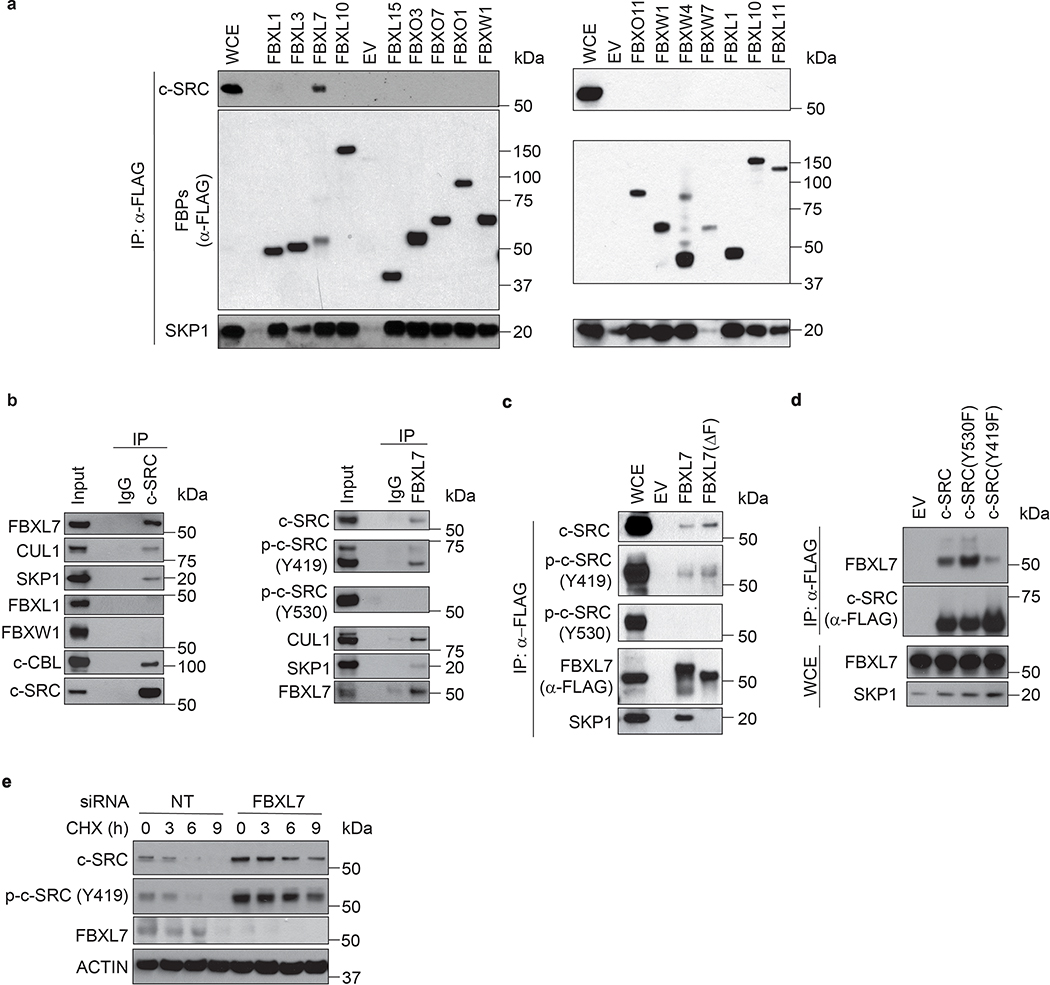
To identify potential FBXL7 substrates that could mediate its pro-invasive phenotype, we expressed FLAG-tagged FBXL7 in HEK-293T cells and subjected the anti-FLAG immunoprecipitates to mass spectrometry analysis. Among the proteins identified in the FBXL7 complex, we found peptides corresponding to c-SRC, a non-receptor protein kinase involved in several cancer hallmarks, including cell invasion and metastasis16, 17. Screening of a panel of 13 F-box proteins expressed in HEK-293T cells confirmed that c-SRC specifically interacted with FBXL7 (Extended Data Fig. 2a). This association was further confirmed with endogenous proteins in LAPC4 and PNT1A cells (Fig. 3a and Extended Data Fig. 2b). FBXL7 co-immunoprecipitated active c-SRC, i.e. p-c-SRC (Y419)18, but not inactive c-SRC, i.e. p-c-SRC (Y530) (Fig. 3a; Extended Data Fig. 2b,c). c-SRC(Y530F), a constitutively active version of c-SRC in which the negative tyrosine regulator Y530 is mutated to phenylalanine, exhibited increased binding to FBXL7 compared to wild-type c-SRC (Extended Data Fig. 2d). By contrast, c-SRC(Y419F), an inactive c-SRC mutant in which the positive tyrosine regulator Y419 is mutated to phenylalanine, co-immunoprecipitated FBXL7 less robustly than wild-type c-SRC (Extended Data Fig. 2d). FBXL7 expression induced a decrease in endogenous p-c-SRC (Y419) levels (and to a lesser extent total c-SRC), but not p-c-SRC (Y530) (Fig. 3b). Treatment with the proteasome inhibitor MG132 rescued the cellular levels of p-c-SRC (Y419), suggesting that the lower levels were due to enhanced proteolysis. Co-transfection of FBXL7 and Ubiquitin (Ub) induced the appearance of high-molecular-weight bands in c-SRC immunoprecipitates (Fig. 3c). These slow migrating bands were ubiquitylated species of c-SRC since they were not present when c-SRC was co-transfected with FBXL7 and Ub(K0), a mutant in which all lysine residues were mutated to arginine, preventing chain elongation. Moreover, FBXL7(ΔF-box) was unable to promote the ubiquitylation of c-SRC. FBXL7 ubiquitylated constitutively active c-SRC (Y530F) more extensively than c-SRC wild-type, consistent with increased binding. Finally, we silenced FBXL7 expression in PNT1A and DU145 cells and observed increased expression and stability of total c-SRC and p-c-SRC (Y419) (Fig. 3d and Extended Data Fig. 2e). Silencing of c-CBL, an ubiquitin ligase previously reported to target c-SRC19, stabilized EGFR, one of its established substrates, but did not affect c-SRC levels (Fig. 3d), in agreement with Teckchandani et al.20. Overall, these results indicate that FBXL7 promotes the ubiquitylation and degradation of c-SRC.
Fig. 3. FBXL7 controls the degradation of active c-SRC upon its phosphorylation on Ser104.
a, LAPC4 cells were treated with MG132 for 3 h before lysis. Lysates were immunoprecipitated with an antibody against c-SRC, FBXL7, or nonspecific IgG, and immunoblotted.
b, HEK-293T cells transfected for 24 h with FLAG-tagged FBXL7 or empty vector (EV), were treated for 3 h with MG132 or solvent before lysis, and immunoblotted.
c, LAPC4 cells were transfected with the indicated constructs and, after 18 h, incubated with MG132 for 2 h before lysis. Whole-cell extracts (WCE) were subjected to immunoprecipitation (IP) with anti-GFP resin and immunoblotting.
d, PNT1A cells were transfected for 48 h with siRNAs to FBXL7 or c-CBL, or a non-targeting (NT) siRNA, treated with cycloheximide (CHX) for the indicated times, and immunoblotted.
e, HEK-293T cells were co-transfected with FLAG-tagged FBXL7 and GFP-tagged wild-type or mutant c-SRC constructs. After 24 h, cells were treated for 3 h with MG132 before lysis. WCE were subjected to IP with anti-FLAG resin and immunoblotting.
a-e: The experiments were repeated three times with similar results.
f, HEK-293T cells transfected for 24 h with the indicated constructs were treated with CHX for the indicated times and immunoblotted. Quantification of three different experiments is shown. 2 h, 4 h, 7 h: **P=0.000931, *P=0.015, *P=0.0018 [c-SRC vs. c-SRC(S104A)]; **P=0.000262, *P=0.0052, **P=0.00077 [c-SRC vs. c-SRC(S104F)].
g-h, PNT1A cells were transfected with GFP-tagged wild-type c-SRC, c-SRC(S104A), c-SRC(S104F), or EV. After 24 h, cells were assayed for migration (g) or lysed for immunoblotting (h). Each experiment was performed in triplicate. The graph shows quantification of a representative experiment (n = 10). Two (g) and three (h) independent experiments were performed with similar results. *P=2.37E-07; **P=6.6E-08; ***P=1.09E-06.
i-k, PC-3 cells were transfected with an siRNA targeting c-SRC’s 3’UTR and, after 24h, transfected with GFP-tagged wild-type c-SRC, c-SRC(S104A), c-SRC(S104F) or EV. After 24 h, cells were re-plated on Matrigel-coated inserts (i), 96-well plate (j) or in a soft-agar layer (k). i-j, quantification from a representative experiment out of two (i, n=10; *P=5.34E-17; **P=2.67E-07; ***P=1.11E-08). k, n=4 independent experiments.
Mean ± s.d. is shown. P values are from unpaired, two-tailed t-test.
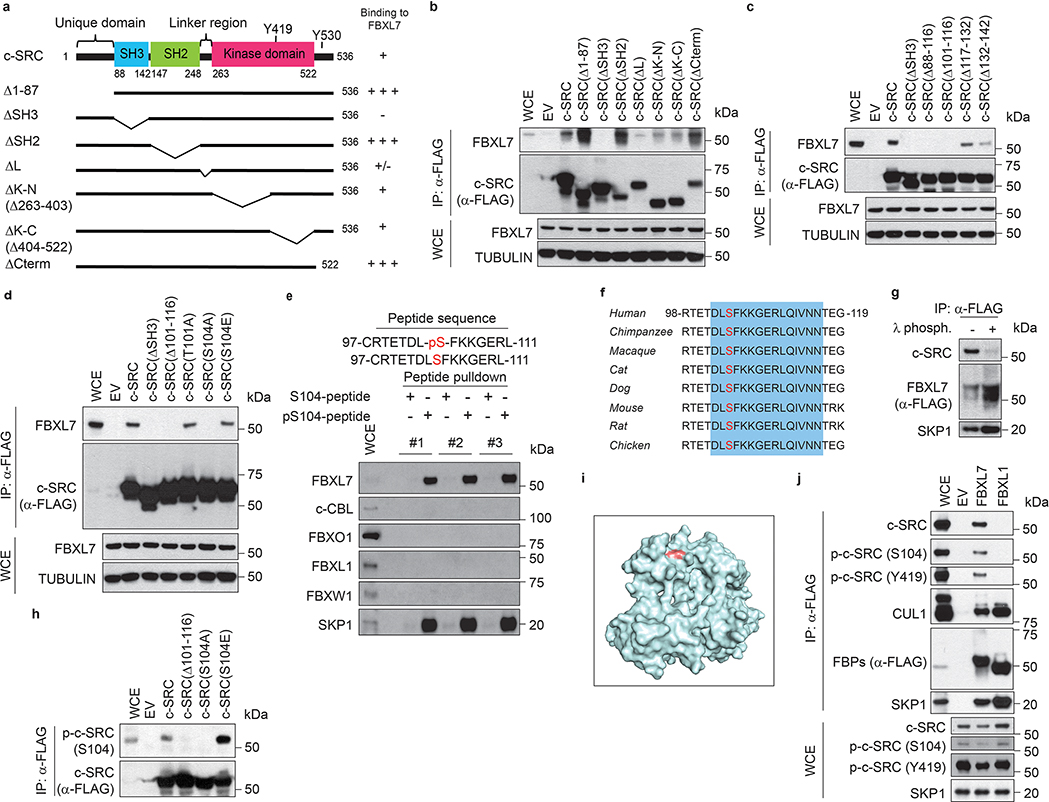
We also mapped the FBXL7 binding domain in c-SRC and narrowed it to the SH3 domain, between amino acids 102 and 116 (Extended Data Fig. 3a–c). Within this region, a Ser to Ala mutation at position 104 [generating c-SRC(S104A)] prevented co-precipitation with FBXL7 (Fig. 3e and Extended Data Fig. 3d), indicating that Ser104 is necessary for efficient binding of c-SRC to FBXL7. By contrast, mutations of Ser104 to the phospho-mimetic residues Glu or Asp [generating c-SRC(S104E) and c-SRC(S104D), respectively] did not alter c-SRC binding to FBXL7 (Fig. 3e and Extended Data Fig. 3d). We also used immobilized, synthetic peptides containing the candidate binding sequence (amino acids 97–111) and assayed their ability to bind FBXL7. While the peptide containing phosphorylated Ser104 was able to efficiently bind FBXL7, but not c-CBL, FBXO1, FBXL1 or FBXW1, the corresponding peptide containing non-phosphorylated Ser104 was not able to bind any of the proteins analyzed (Extended Data Fig. 3e,f). Accordingly, treatment with λ-phosphatase inhibited binding between FBXL7 and c-SRC (Extended Data Fig. 3g). Steady-state levels and stability of c-SRC(S104A) were increased compared to wild-type c-SRC (Fig. 3e,f). Similarly, c-SRC(S104F), a Ser104 to Phe mutant mimicking a mutation associated with metastatic pancreatic cancer (www.cbioportal.org), did not bind FBXL7 and was more stable than wild-type c-SRC (Fig. 3e,f). Next, we generated a phospho-specific antibody against a peptide containing p-Ser at position 104 and found that this antibody recognized wild-type c-SRC and c-SRC(S104E), but not c-SRC(S104A) (Extended Data Fig. 3h). This result demonstrated that Ser104, an amino acid residue that is well exposed in c-SRC (Extended Data Fig. 3i), is phosphorylated in vivo, in agreement with three large-scale proteomics studies21–23. Notably, levels of p-c-SRC (S104) decreased following FBXL7 expression, and c-SRC protein bound to FBXL7 was phosphorylated on S104 (Extended Data Fig. 3j).
Collectively, the above results indicate that FBXL7 (a) recognizes the SH3 domain of c-SRC when Ser104 is phosphorylated and (b) specifically targets the active form of c-SRC for degradation.
Defects in the FBXL7-mediated degradation of c-SRC increase cell migration, invasion, and the expression of EMT markers
Many c-SRC’s substrates (e.g., FAK, ETS1, and β-CATENIN) have been linked to the metastatic program24–26. In addition, activation of c-SRC has been linked to stabilization of transcription factors promoting the EMT and cell invasion, like SNAIL, SLUG, and ETS125–27. To study the biological significance of the FBXL7-mediated degradation of c-SRC in modulating cell migration, PNT1A and PC-3 cells were transiently transfected with either wild-type c-SRC, c-SRC(S104F), or c-SRC(S104A). Compared to control cells, cells expressing wild-type c-SRC showed an increase in cell migration, as measured by their ability to migrate towards a chemoattractant (Fig. 3g). However, PNT1A cells transfected with c-SRC(S104F) or c-SRC(S104A) displayed an even more pronounced migratory phenotype and expressed higher levels of ETS1 and EMT markers (VIMENTIN and TWIST) (Fig. 3h). c-SRC(S104F) and c-SRC(S104A) also promoted the invasive capability of PC-3 cells, as measured by their ability to invade through a thin layer of Matrigel in a Boyden chamber (Fig. 3i) without affecting the proliferation of adherent and non-adherent cells (Fig. 3j,k).
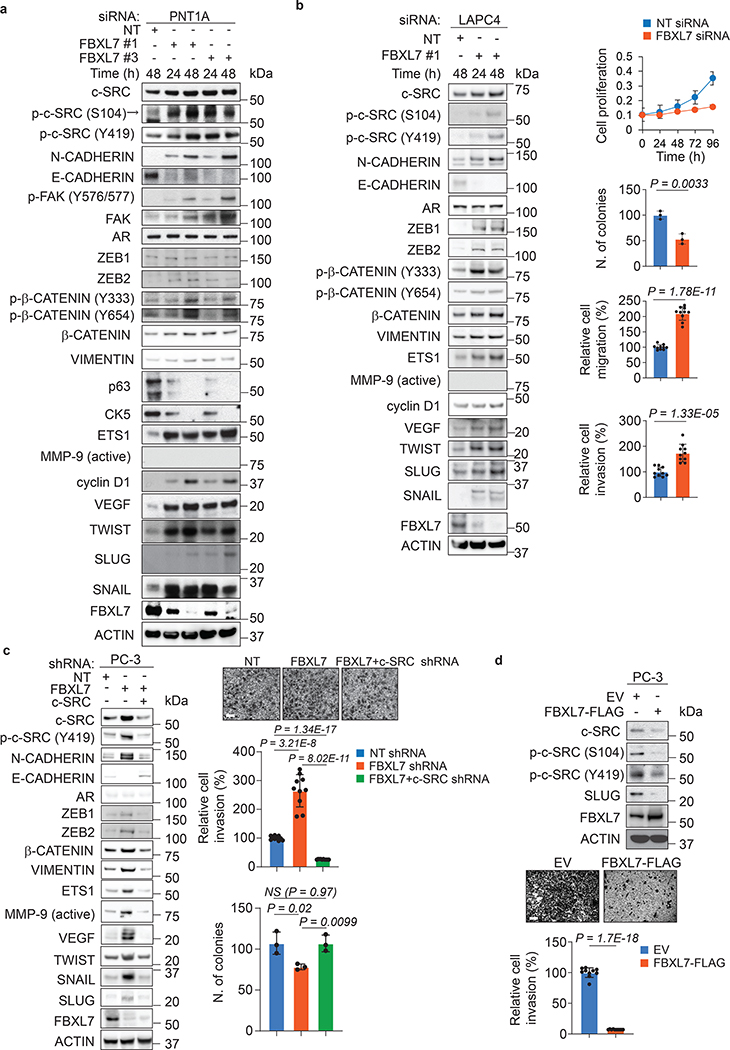
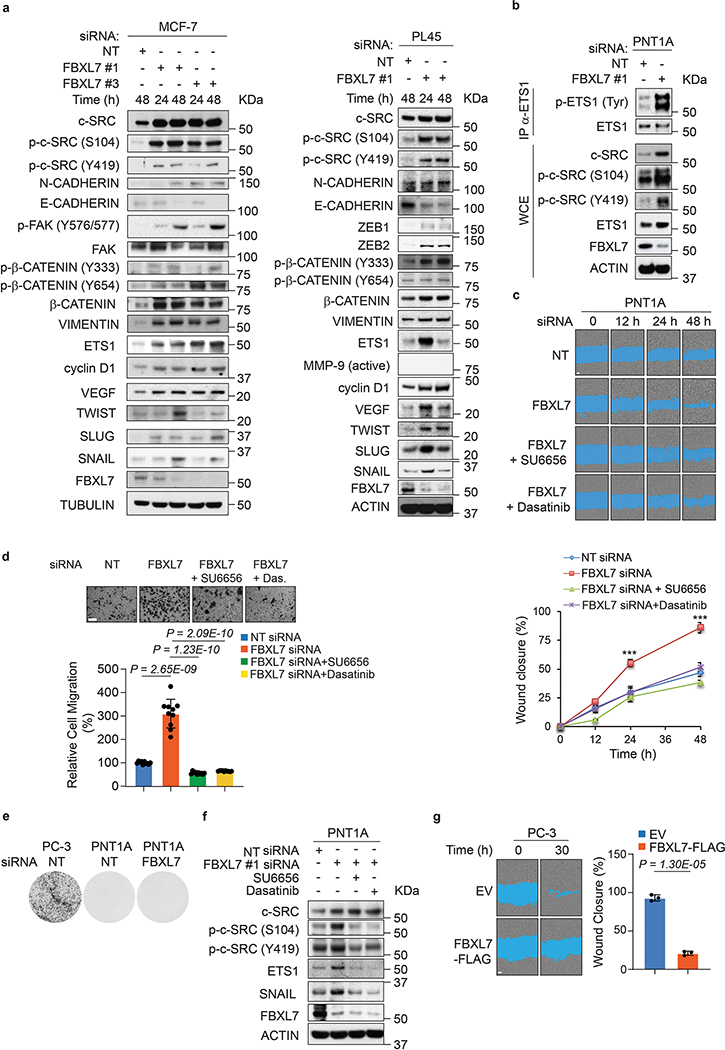
We next transfected two different siRNAs to FBXL7 in PNT1A, LAPC4, PL45, and MCF-7 cells (Fig. 4a,b and Extended Data Fig. 4a,b). FBXL7 knockdown resulted in a characteristic cellular phenotype: (i) upregulation of c-SRC, p-c-SRC (S104), and p-c-SRC (Y419); (ii) upregulation of c-SRC substrates and their phosphorylated species including FAK, p-FAK (Y576/577), β-CATENIN, p-β-CATENIN (Y333), p-β-CATENIN (Y654), ETS1, and p-ETS1; (iii) upregulation of cyclin D1, a target of β-CATENIN; (iv) acquisition of an EMT profile exemplified by a decrease in E-CADHERIN expression and an increase in the levels of N-CADHERIN, VIMENTIN, ZEB1, ZEB2, TWIST, SNAIL, and SLUG; and (v) upregulation of VEGF, an angiogenic factor regulated by c-SRC28. Moreover, FBXL7 depletion in PNT1A cells resulted in decreased expression of the basal cell markers p63 and CK5 (Fig. 4a). The increase in EMT induced by FBXL7 depletion in PNT1A cells correlated with increased cell motility and migration (Extended Data Fig. 4c,d), but was not associated with the acquisition of a malignant phenotype, as assessed by absence of colony formation in soft agar assays (Extended Data Fig. 4e). Notably, the appearance of EMT markers as well as increased cell motility and migration were reversed by treatment with the c-SRC inhibitors SU6656 or dasatinib (Extended Data Fig. 4c,d,f). Similarly, the increase in EMT induced by FBXL7 knockdown in LAPC4 and PC-3 cells correlated with increased cell migration and invasion, but decreased proliferation of both adherent and non-adherent cells (Fig. 4b,c and Extended Data Fig. 1i). The increased EMT markers and invasive capability of FBXL7-depleted PC-3 cancer cells were suppressed by co-depletion of c-SRC (Fig. 4c). Overexpression of FBXL7 in PC-3 cells resulted in a reduction of EMT markers, cell motility, and cell invasion (Fig. 4d and Extended Data Fig. 4g). In aggregate, these results demonstrate that suppression of the FBXL7-mediated degradation of c-SRC promotes EMT and a migratory phenotype.
Fig. 4. FBXL7 downregulation promotes expression of EMT markers and cell invasion in a c-SRC-dependent manner.
a, PNT1A cells were transfected with two different siRNAs to FBXL7 (individually) or a NT siRNA. At the indicated times after transfection, cells were subjected to immunoblotting. Three independent experiments were performed with similar results.
b, LAPC4 cells were transfected with an siRNA to FBXL7 (FBXL7si oligo #1) or a NT siRNA. At the indicated times after transfection, cells were subjected to immunoblotting (left panel) or plated in a 96-well plate, on a soft-agar layer, on a transwell in the presence of Collagen type I in the lower chamber as chemoattractant, or on Matrigel-coated transwells (top to bottom panels: cell proliferation, colony formation, migration, and invasion assay, respectively). A representative proliferation experiment performed in triplicate, out of two independent experiments, is shown. Colony formation assay: n = 3 independent experiments. After 6 h (migration) or 48 h (invasion), cells were fixed, stained, photographed, and counted in 10 different fields/well. A representative migration and invasion experiment out of two independent experiments/each is shown (n = 10). Mean ± s.d. is shown; P values are from unpaired, two-tailed t-test.
c, PC-3 cells were stably transduced with the indicated doxycycline-inducible shRNAs. Twenty-four hours after doxycycline induction, cells were subjected to immunoblotting (left panel) or re-plated on Matrigel-coated transwells (upper and middle right panels). After 48 h, cells that invaded through Matrigel were counted in 10 different fields/well. In the bottom, right panel, cells were assayed for anchorage-independent growth three weeks after being plated in soft agar (n = 3 independent experiments; mean ± s.d. is shown). A representative invasion experiment out of two independent experiments is shown. Scale bar: 40 μm. Mean ± s.d. is shown; n = 10; P values are from unpaired, two-tailed t-test.
d, PC-3 cells were transfected with FLAG-tagged FBXL7 or EV. Twenty-four hours after transfection, cells were subjected to immunoblotting (top panel; two representative experiments were performed with similar results) or re-plated on Matrigel-coated transwells (bottom panels). After 72 h, cells invaded through Matrigel and migrated on the bottom of the transwells were counted in 10 different fields/well. The graph shows quantification from a representative experiment out of two. Scale bar: 40 μm. Mean ± s.d. is shown; n = 10; P values are from unpaired, two-tailed t-test.
FBXL7 is downregulated and c-SRC is upregulated in highly aggressive human pancreatic and prostate cancers
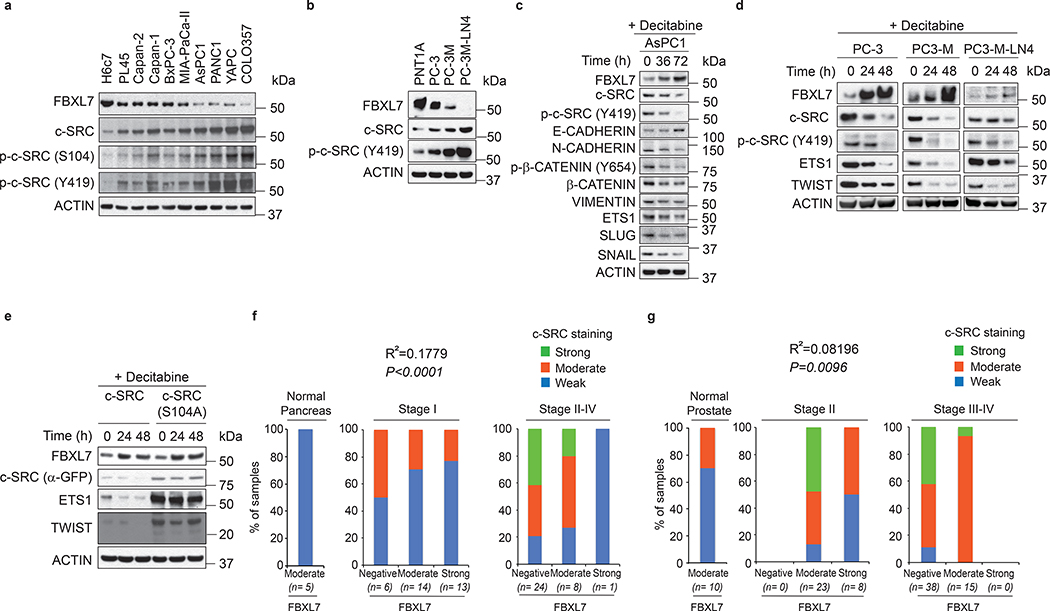
We examined the expression of c-SRC in pancreatic cell lines: all 9 pancreatic cancer cell lines had higher levels of c-SRC, p-c-SRC (S104), and p-c-SFK (Y419) compared to immortalized H6c7 cells derived from normal human pancreatic duct epithelial cells (Fig. 5a). Similarly, the PC-3M-LN4 > PC-3M > PC-3 invasive prostate cell lines displayed a progressive increase in active and total c-SRC levels (Fig. 5b). Treatment of pancreatic and prostate cancer cells with decitabine increased the levels of FBXL7 (as observed in Fig. 1h,i) and decreased the levels of total c-SRC (both endogenous and exogenous), phosphorylated c-SRC (Y419), ETS1, EMT markers, total β-CATENIN and p-β-CATENIN (Y654) (Fig. 5c–e). By contrast, although decitabine treatment increased FBXL7 expression, levels of the stable c-SRC(S104A) mutant, as well as endogenous ETS1 and TWIST did not decrease (Fig. 5e), confirming that FBXL7 is unable to target c-SRC(S104A) and indicating that the effect of decitabine on EMT markers is dependent on c-SRC.
Fig. 5. Downregulation of FBXL7 expression inversely correlates with c-SRC upregulation in pancreatic and high-stage prostate cancers.
a, Protein extracts from normal diploid pancreatic duct epithelial cells (H6c7) and the indicated pancreatic cancer cells were analyzed by immunoblotting.
b, The indicated cells were subjected to immunoblotting.
c-d The indicated cells were treated with decitabine for the indicated times and analyzed by immunoblotting.
e, PC-3 cells were transfected with FLAG-tagged wild-type c-SRC or c-SRC(S104A). Twenty-four hours after, cells were treated with decitabine for the indicated times and immunoblotted.
a-e, Two independent experiments were performed with similar results.
f, Tumor microarrays (TMAs) containing normal and tumor pancreatic human specimens were immunostained with antibodies to FBXL7 and c-SRC. The graphs show the percentage of normal, Stage I and Stage II-IV tumor pancreatic tissues with no, moderate or strong FBXL7 expression that have no, moderate or strong c-SRC expression. n = 71 biologically independent samples. Linear regression was determined using X2 test.
g, TMAs containing normal and tumor human prostate specimens were immunostained with antibodies to FBXL7 and c-SRC. The graphs show the percentage of normal, Stage II, and Stage III/IV prostate cancer tissues with no, moderate, or strong FBXL7 expression that have no, moderate, or strong c-SRC expression. n = 94 biologically independent samples. Linear regression was determined using Γ2 test.
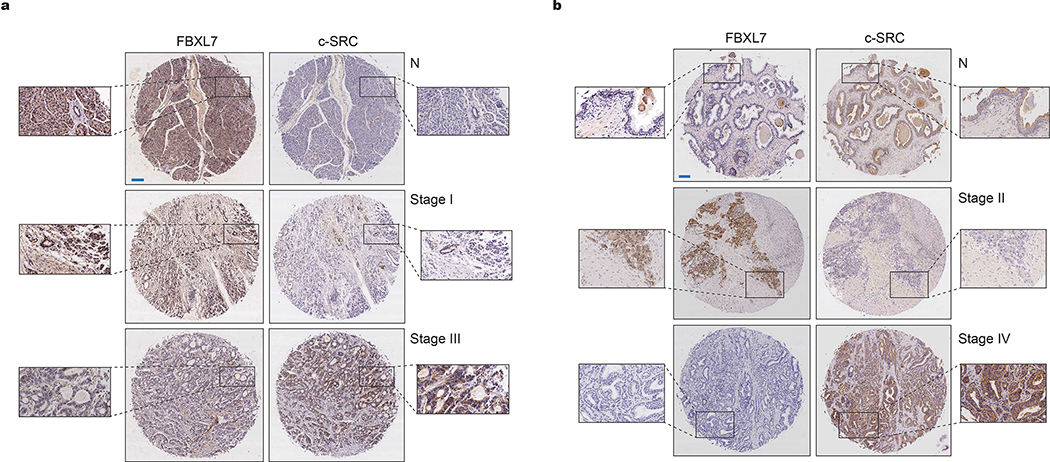
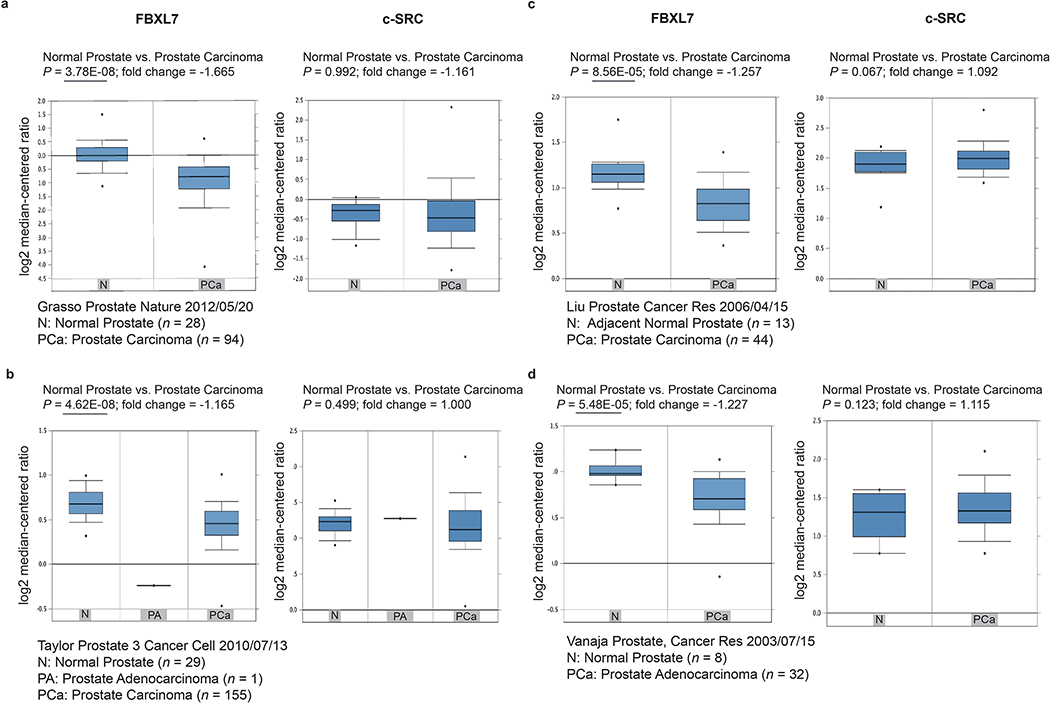
We also analyzed FBXL7 and c-SRC expression in normal and neoplastic human prostate and pancreatic tissues using tissue microarray (TMA) platforms. In Stage I pancreatic carcinomas and in Stage II prostatic carcinomas, FBXL7 levels did not change significantly compared to normal tissues. However, the majority of Stage II-IV pancreatic and Stage III/IV prostatic cancers lost FBXL7 expression (Fig. 5f,g and Extended Data Fig. 5a,b). Notably, an inverse correlation was found between FBXL7 and c-SRC levels in both cancers (Fig. 5f,g, Extended Data Fig. 5a,b, and Fig. 2c). Analysis of four Oncomine prostate cancer datasets showed that the decrease in FBXL7 mRNA levels in prostate cancer is not associated with an increase in c-SRC mRNA levels (Extended Data Fig. 6), in agreement with the post-transcriptional regulation of c-SRC by FBXL7.
Human cancers display mutations in FBXL7 and SRC, resulting in the stabilization of c-SRC
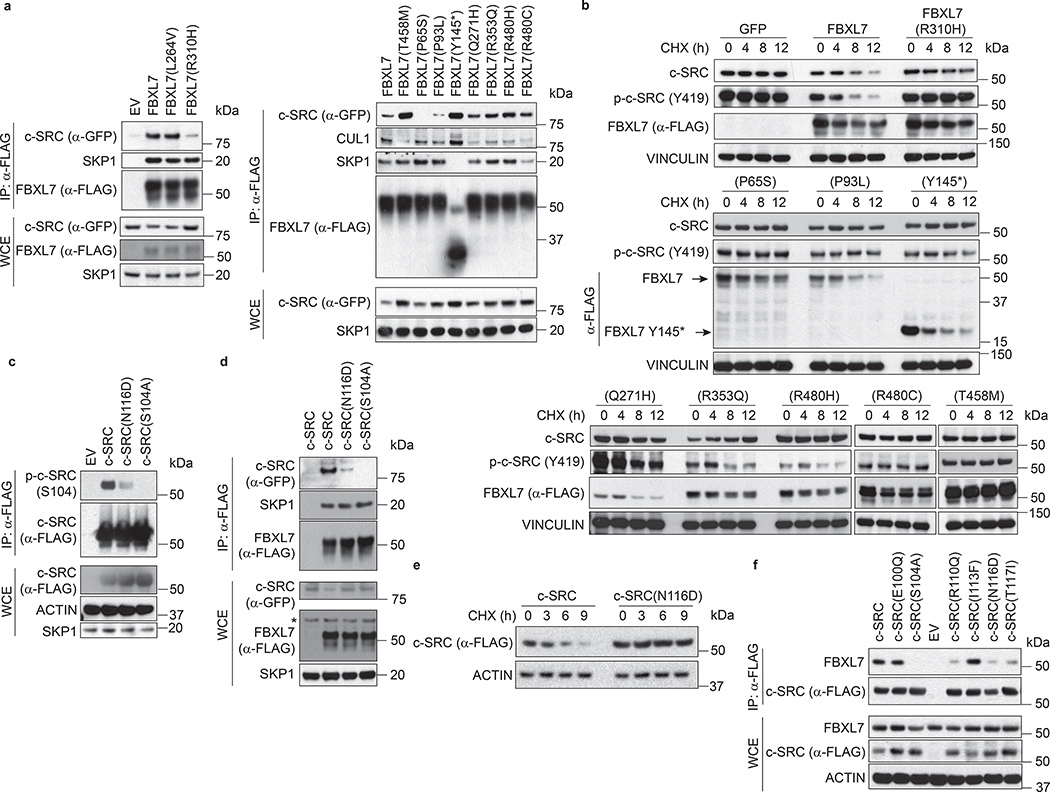
We assessed whether cancer-associated mutations identified in the FBXL7 and SRC genes (www.cbioportal.org and www.cancer.sanger.ac.uk/cosmic) may play a role in the upregulation of c-SRC expression observed in human cancers. We generated a panel of FBXL7 and c-SRC mutants mimicking the mutations detected in human cancers (Supplementary Table 2). Compared to wild-type FBXL7, FBXL7(R310H), a mutant reported in both metastatic prostate cancer and pancreatic ductal adenocarcinoma, displayed a weak binding to c-SRC (Fig. 6a). Moreover, FBXL7(R310H) was unable to induce the degradation of c-SRC (Fig. 6b). Similarly, FBXL7(P65S) and FBXL7(P93L) displayed weak/no binding to c-SRC and were unable to promote c-SRC degradation (Fig. 6a,b). FBXL7(Q271H), FBXL7(R353Q), FBXL7(T458M), FBXL7(R480H), FBXL7(R480C), and FBXL7(Y145*) did bind c-SRC efficiently, but displayed impaired interaction with CUL1 and/or SKP1, likely explaining why they were unable to induce the destabilization of c-SRC when expressed in DU145 cells (Fig. 6a,b). In addition to c-SRC(S104F) described earlier, we found other tumor-associated mutants with defects in degradation. c-SRC(N116D), mimicking a mutation found in early-onset prostate carcinoma, displayed a reduced phosphorylation on Ser104, and, accordingly, exhibited a weak binding to FBXL7, as well as increased c-SRC stability (Fig. 6c–e). Similarly, c-SRC(R110Q) and c-SRC(T117I) also consistently showed reduced binding to FBXL7 (Fig. 6f). Thus, although mutations in FBXL7 and SRC are relatively rare (Supplementary Table 2), they represent a further mechanism utilized by cancer cells to increase the levels of c-SRC.
Fig. 6. FBXL7 and c-SRC cancer mutations are inactivating and stabilizing, respectively.
a, HEK-293T cells were transfected with FLAG-tagged wild-type FBXL7 or FLAG-tagged FBXL7 cancer mutants, together with GFP-tagged c-SRC. Twenty-four hours after transfection, whole-cell extracts (WCE) were subjected to immunoprecipitation (IP) with an anti-FLAG resin and immunoblotting.
b, DU145 cells were transfected with FLAG-tagged versions of either wild-type FBXL7, FBXL7 cancer mutants (T458M, P65S, P93L, Y145*, Q271H, R353Q, R480H, R480C), or GFP. Twenty-four hours after transfection, cells were treated with cycloheximide (CHX) for the indicated times, and whole-cell extracts were subjected to immunoblotting.
a-b, Two independent experiments were performed with similar results.
c, HEK-293T cells were transfected with FLAG-tagged versions of wild-type c-SRC or the indicated c-SRC mutants. Twenty-four hours after transfection, whole-cell extracts (WCE) were subjected to immunoprecipitation (IP) with an anti-FLAG resin and immunoblotting.
d, HEK-293T cells were transfected with GFP-tagged versions of either wild-type c-SRC or the indicated c-SRC mutants, together with FLAG-tagged FBXL7. Twenty-four hours after transfection, whole-cell extracts (WCE) were subjected to immunoprecipitation (IP) with an anti-FLAG resin and immunoblotting.
e, HEK-293T cells were transfected with FLAG-tagged versions of wild-type c-SRC or c-SRC(N116D). Twenty-four hours after transfection, cells were treated with cycloheximide (CHX) for the indicated times and whole-cell extracts were immunoblotted.
c-e, Three independent experiments were performed with similar results.
f, HEK-293T cells were co-transfected with FLAG-tagged versions of either wild-type c-SRC or the indicated c-SRC mutants. Twenty-four hours after transfection, whole-cell extracts (WCE) were subjected to immunoprecipitation (IP) with anti-FLAG resin and immunoblotting. Two independent experiments were performed with similar results.
FBXL7 loss promotes c-SRC-dependent metastases in mouse models of prostate and pancreatic cancers
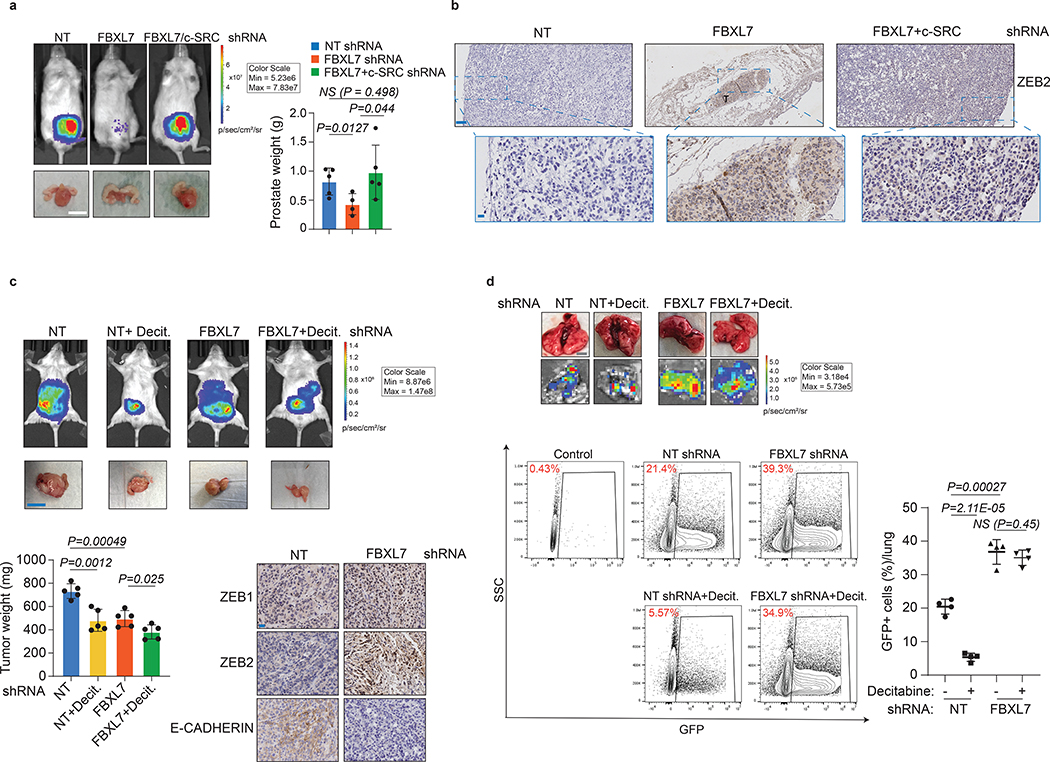
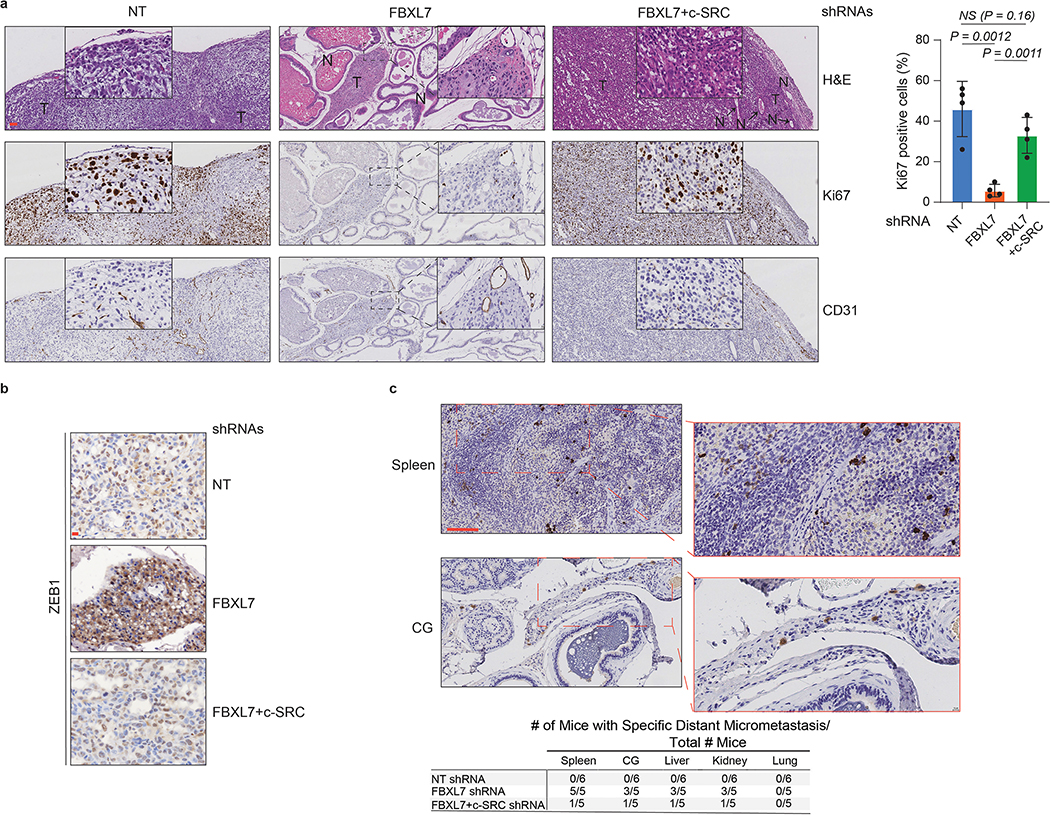
We then investigated whether the results obtained in cell systems were relevant at the organismal level. Because PC-3 cells have low metastatic potential in vivo15, 29, 30 and the decreased expression of FBXL7 in these cells promotes EMT (Fig. 4c), PC-3 cells constitutively expressing luciferase were stably transduced with doxycycline-dependent shRNA constructs [either a NT (non-targeting) shRNA, FBXL7 shRNA, or both FBXL7 and c-SRC shRNAs] and injected into the ventral prostate of NOD/SCID mice. Suppression of FBXL7 expression by doxycycline resulted in small primary prostate tumors with low Ki67-proliferative index and high levels of ZEB1 and ZEB2, two EMT markers (Fig. 7a,b and Extended Data Fig. 7a,b). In contrast, tumors transduced with both FBXL7 and c-SRC shRNAs were similar in size to NT shRNA tumors and expressed low levels of ZEB1 and ZEB2. Despite their smaller tumor size, only FBXL7 shRNA tumors gave rise to sparse micrometastases (Extended Data Fig. 7c). In similar experiments, we also used the more metastatic derivatives of PC-3, i.e. PC-3M cells, stably expressing luciferase and GFP, that when injected into the ventral prostate of NOD/SCID mice developed metastatic tumors (Fig. 7c,d). FBXL7 knockdown resulted in reduced primary tumor size, increased levels of ZEB1 and ZEB2, and decreased levels of E-CADHERIN (Fig. 7c). Notably, FBXL7 depletion significantly increased lung metastasis formation, as evaluated by FACS analysis of GFP-positive cells metastasized to the lungs (Fig. 7d). Decitabine treatment reduced the size of the primary tumors both in control and FBXL7 shRNA-expressing mice, but inhibited metastasis formation only in control mice (Fig. 7d), suggesting that decitabine reduces metastasis through a FBXL7-mediated mechanism.
Fig. 7. FBXL7 suppression promotes prostate cancer metastasis, which is counteracted by co-silencing c-SRC or decitabine treatment.
a, NOD/SCID-gamma mice were inoculated in the ventral prostate with 5 × 10⁵ PC-3 cells stably expressing both luciferase and the indicated doxycycline-inducible shRNAs. NT = non-targeting shRNA. Orthotopically transplanted mice were then treated with doxycycline to induce shRNA expression (NT shRNA: n = 5; FBXL7 shRNA: n = 7; FBXL7/c-SRC shRNA: n = 10). Top left panels, representative bioluminescent images taken at the end of the experiment. Two independent experiments were performed. Bottom left panels, representative excised prostates with tumors imaged 60 days post-injection. Scale bar: 1 cm. Right panel, quantification of prostate weights. Mean ± s.d. is shown. P values are from unpaired, two-tailed t-test.
b, Representative immunohistochemical staining of ZEB2 in primary tumor sections from mice shown in (a). n = 3. Scale bars: 100 μM (top), 10 μM (bottom). T = tumor.
c-d, NOD/SCID-gamma mice were inoculated in the ventral prostate with 5 × 10⁵ PC-3M cells stably expressing luciferase, GFP, and the indicated shRNAs. Orthotopic transplanted mice were treated with decitabine (Decit.) or vehicle once a week by intraperitoneal injection at 1 μg/g body weight up to 40 days post-implantation. Two independent experiments were performed with similar results. In c, top panels, representative mice imaged with BLI at the end of the experiment; middle panels, representative excised prostates with tumors imaged 40 days post-injection (scale bar: 1 cm); bottom left panels, quantification of tumor weight (n = 5 mice per group). Mean ± s.d. is shown. P values are from unpaired, two-tailed t-test. Bottom right panels, representative immunohistochemical staining of ZEB1, ZEB2 and E-CADHERIN in primary tumors (scale bar: 10 μm). In d, lungs were excised, imaged with BLI and subjected to FACS analysis for GFP-positive cells (bottom panels). Control: lung from non-transplanted mouse. Scale bar: 5 mm. The graph on the right shows the percentage of GFP+ cells/lung (n = 4 mice per group). Mean ± s.d. is shown. P values are from unpaired, two-tailed t-test.
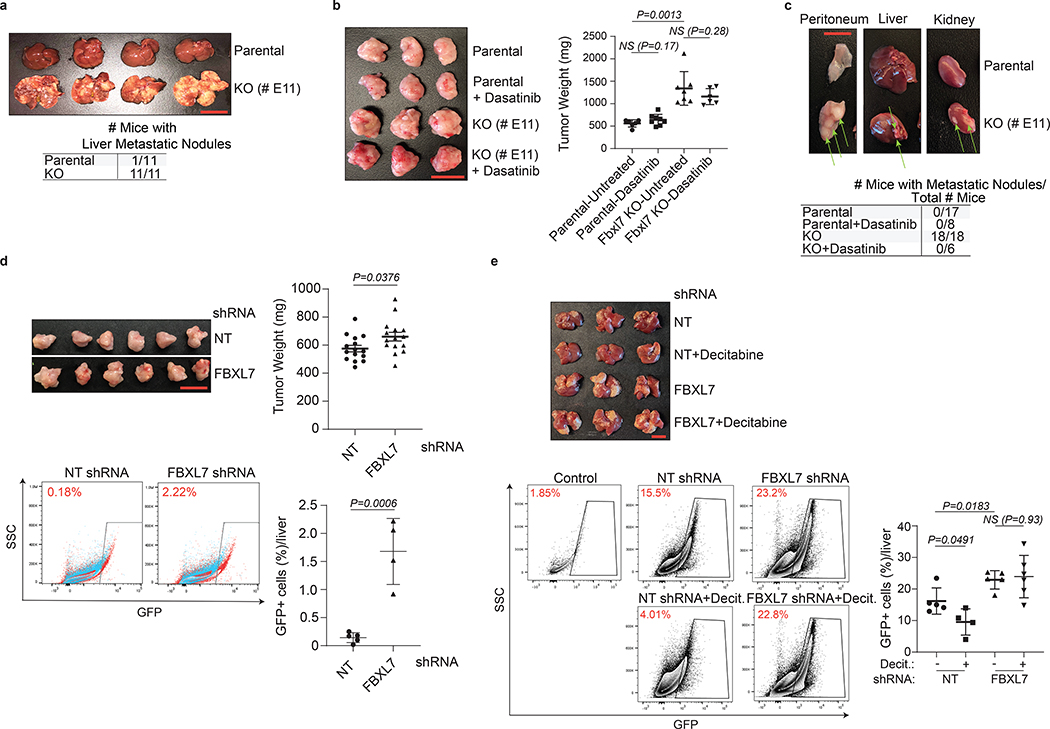
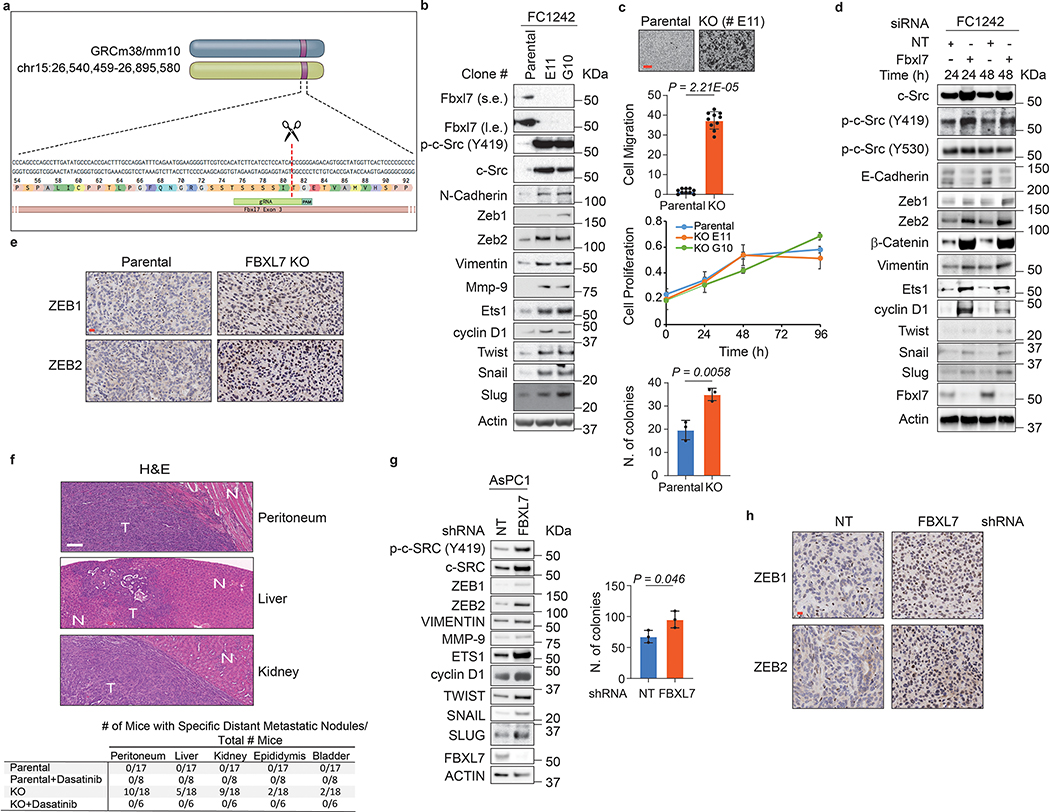
Next, we evaluated two mouse models of pancreatic cancer using PdxCre;LSL-KrasG12D;p53R172H mouse FC1242 pancreatic adenocarcinoma cells31 and FBXL7−/− FC1242 cells (Extended Data Fig. 8a). Immunoblot analyses showed that both FBXL7 knockout and knockdown in FC1242 cells resulted in increased levels of c-SRC and p-c-SRC (Y419), as well as higher levels of EMT markers (Extended Data Fig. 8b, d). No significant difference in cell proliferation was observed between FBXL7−/− FC1242 and parental FC1242 cells (Extended Data Fig. 8c). However, FBXL7−/− FC1242 cells exhibited increased migratory capacity and anchorage-independent growth (Extended Data Fig. 8c). We then used a portal venous hematogenous metastasis model to measure the ability of parental and FBXL7−/− FC1242 cells to form metastases in the liver, a metastatic site in >90% of patients with advanced pancreatic cancer32. Strikingly, all mice injected with FBXL7−/− FC1242 cells (11/11) displayed high volume metastatic disease to the liver, whereas nearly all mice (10/11) injected with parental FC1242 cells were protected (Fig. 8a).
Fig. 8. Fbxl7/FBXL7 suppression promotes pancreatic cancer metastasis, which is counteracted by decitabine or dasatinib treatment.
a, 1×10⁶ FC1242 cells (parental or Fbxl7 KO) were injected in the spleen of 8-weeks old C57BL/6 mice. Sixteen days after injection, livers were collected, weighed, and photographed. n = 11 mice/group. Scale bar: 1 cm.
b-c, 80,000 FC1242 cells (parental or Fbxl7 KO) were injected in the pancreas of 8-weeks old C57BL/6 mice. Where indicated, two days after injection, dasatinib was administered by daily oral gavage (200 μl, 20 mg/kg). Eighteen days after injection, primary tumors (b), kidney, peritoneum, liver, epidydimis, and bladder were collected. In b, scale bar: 1 cm. n = 6, Parental-Untreated; n = 8, Parental-Dasatinib; n = 7, KO-Untreated; n = 6, KO-Dasatinib. In c, representative pictures of peritoneum, liver, and kidney with macrometastasis (arrows) are shown. Two independent experiments were performed. The table shows the number of mice with macrometastases/total number of mice. n = 17, Parental; n = 8, Parental + dasatinib; n = 18, KO; n = 6, KO+Dasatinib.
d, 500,000 AsPC1 cells stably expressing GFP-tagged NT or FBXL7 shRNAs were injected in the pancreas of 8-weeks old B6.129S7-Rag1tm1Mom/J(002216) mice. Five weeks after injection, primary tumors (top panels) and livers (bottom panels) were collected. Two independent experiments were performed. Scale bar: 1 cm. Top right panel, quantification of tumor weight (n = 15 mice/group). Bottom panels, livers were subjected to FACS analysis for GFP-positive cells (NT siRNA: n = 5 mice; FBXL7 siRNA: n = 4 mice).
e, 1×10⁶ AsPC1 cells stably expressing GFP-tagged FBXL7 or NT shRNA were injected in the spleen of 8-weeks old B6.129S7-Rag1tm1Mom/J(002216) mice. Twenty-four hours before cell injection, decitabine was administered by intraperitoneal injection at 1 μg/g body weight. Six days after cell injection, livers were collected and subjected to FACS analysis for GFP-positive cells (NT siRNA: n = 5 mice; NT siRNA+ Decit.: n = 4 mice; FBXL7 siRNA: n = 5 mice; FBXL7 siRNA+Decit.: n = 6 mice). Two independent experiments were performed. Control: liver from normal, non-injected mouse. Decit.=decitabine. Mean ± s.d. is shown. P values are from unpaired, two-tailed t-test.
In a second pancreatic in vivo model, parental and FBXL7−/− FC1242 cells were orthotopically implanted in the tail of the pancreas. FBXL7 knockout tumors had increased expression of ZEB1 and ZEB2, and developed spontaneous metastases to distant organs, including the peritoneum, kidney, liver, bladder, and epididymis (Fig. 8b,c and Extended Data Fig. 8e,f). By contrast, parental FC1242 cells formed smaller primary tumors with no evidence of metastases. Treatment with the c-SRC inhibitor dasatinib rescued the metastatic phenotype of FBXL7−/− FC1242 cells in all tissues (Fig. 8c and Extended Data Fig. 8f). Dasatinib treatment had no effect on primary tumor burden (Fig. 8b), indicating that the effect of dasatinib on metastasis is not due to a reduced primary tumor growth and that, in contrast to metastasis, FBXL7 may affect growth of the primary tumor through a c-SRC-independent mechanism.
In a third mouse model of pancreatic cancer, AsPC1 human pancreatic cancer cells stably expressing either GFP-tagged FBXL7 shRNA or NT shRNA were orthotopically injected in immunocompromised Rag1-deficient mice. AsPC1 FBXL7 shRNA cells formed tumors larger than NT shRNA expressing cells, consistent with increased colony formation in soft-agar (Fig. 8d and Extended Data Fig. 8g), and expressed high levels of ZEB1 and ZEB2 (Extended Data Fig. 8h). FACS analysis of the liver showed a significant increase in the number of GFP-positive cells derived from FBXL7 shRNA implanted cells relative to controls (Fig. 8d). Finally, when injected directly in the portal vein of immunocompromised Rag1-deficient mice, human AsPC1 FBXL7 shRNA cells metastasized to the liver more than control cells (Fig. 8e). Notably, a single injection of decitabine significantly reduced metastasis formation using control AsPC1 cells, but not FBXL7 shRNA-expressing AsPC1 cells (Fig. 8e), suggesting that decitabine is effective in reducing metastatic spread of pancreatic cancer cells in a FBXL7-dependent manner.
Discussion
Here, we report an anti-metastatic role for FBXL7 in cancer, whereby promoter hypermethylation results in silencing of FBXL7 in pancreatic cancer and high stage prostate adenocarcinomas, promoting metastatic spread. FBXL7 is located on chromosome 5p, a region frequently amplified in human cancers; yet within this amplicon, FBXL7 mRNA is often the sole construct that is downregulated33–36. This is consistent with our analysis showing that the FBXL7 promoter is highly methylated in cancer. In prostate cancer, FBXL7 promoter methylation directly correlates with higher Gleason grade, pT stage, and disease stage. Notably, low FBXL7 mRNA levels are associated with poor survival in both patients with pancreatic and prostatic cancer.
We found that FBXL7 mediates the degradation of c-SRC and that hypermethylation of the FBXL7 promoter is associated with increased c-SRC levels in human prostate and pancreatic cancer specimens and cancer cell lines.
Overexpression of c-SRC occurs in many solid tumors, mostly at later stages of the disease17. Pancreatic cancer, one of the most lethal malignancies, displays, among other aberrations, c-SRC overexpression and/or activation in more than 70% of primary tumors37. A progressive increase in c-SRC activity is observed as cancer evolves towards a more invasive phenotype, likely because c-SRC mediates EMT and increases the migratory capacity of tumor cells, as well as survival in the circulation and extravasation 38, 39,40, 41. Increased c-SRC protein levels and activity in prostate and pancreatic cancers predict poor prognosis and are associated with vascular invasion, lymph node metastasis, and reduced survival37, 40, 42–46. Mechanistically, overactivation of c-SRC mediates a metastatic phenotype through the phosphorylation of a plethora of protein substrates, although some may play a predominant role24–26, 40, 47.
We demonstrated that suppression of FBXL7 enables the formation of distant metastases in orthotopic models of prostate and pancreatic cancers in a c-SRC-dependent manner. We propose that epigenetic loss of FBXL7 in cancer cells and consequential increased c-SRC levels may promote both early steps of the invasion-metastasis cascade (i.e. local infiltration, intravasation, and dissemination) and possibly later steps of the metastatic cascade.
While our results show that the effect of FBXL7 loss on cell invasion is dependent on the stabilization of c-SRC both in prostate and pancreatic cells, they indicate that FBXL7 control cell proliferation in a tissue type-dependent manner, possibly through the regulation of different sets of substrates48, 49 in the various cell types.
Our in vivo results suggest that targeting c-SRC with dasatinib or other inhibitors in a neoadjuvant setting holds promise in the therapeutic treatment of patients with high-risk prostate cancer or with resectable pancreatic cancer. Moreover, our data highlight the potential efficacy of decitabine treatment in preventing the metastatic spread in a selective cohort of prostate and pancreatic cancers, i.e. those displaying hypermethylation of the FBXL7 promoter.
Overall, our results imply that early epigenetic changes represent a crucial event in determining cancerous dissemination, but do not necessarily affect the growth of the primary tumor. As hypermethylation of the FBXL7 promoter is observed in a variety of human cancers, our observations in prostate and pancreatic cancers may have implications for other solid tumors.
Extended Data
Extended Data Fig. 1: Genes encoding F-box proteins are not highly mutated in human cancers.
a, Heat map showing percentages of samples mutated in the indicated genes, across individual tumor types or pan-cancer, and ranked by their percent mutation rate in pan-cancer. Genes encoding F-box proteins are in black; different cancer genes are in blue.
b, Scheme showing the CpG island within the FBXL7 promoter and the primers used to assess FBXL7 promoter methylation by methylation-specific PCR analysis.
c, Total RNA extracts from the indicated pancreatic cells were analyzed for FBXL7 mRNA levels by qPCR. Mean ± s.d. is shown; n = 3 independent experiments; P values are from unpaired, two-tailed t-test.
d, Total DNA extracts from H6c7, AsPC1, and COLO357 pancreatic cells were subjected to bisulfite modification and sequencing of a FBXL7 promoter region within the CpG island. The table shows the percentage of methylation of the FBXL7 promoter.
e, Total mRNA extracts from the indicated prostate cells were analyzed for FBXL7 mRNA levels by qPCR. Mean ± s.d. is shown; n = 3 independent experiments; P values are from unpaired, two-tailed t-test.
f, Total DNA extracts from PNT1A, LAPC4, PC-3, PC-3M, and PC-3M-LN4 prostate cells were subjected to bisulfite modification and sequencing of a FBXL7 promoter region within the CpG island. The table shows the percentage of methylation of the FBXL7 promoter.
g, Co-expression of FBXL7 and AR mRNAs was analyzed in the prostate TCGA dataset (cBioPortal; n = 450). Two-tailed non-parametric Spearman correlation was used. The linear regression line is shown in red.
h, Total mRNA extracts from AsPC1, PC-3, PC-3M and PC-3M-LN4 cells were analyzed for FBXL7 mRNA levels by qPCR upon addition of decitabine for the indicated times. Mean ± s.d. is shown; n = 3 independent experiments; P values are from unpaired, two-tailed t-test.
i, PL45, AsPC1, PNT1A, LNCaP, and PC-3 cells were transfected with two different siRNAs to FBXL7 (each individually) or a non-targeting (NT) siRNA. Twenty-four hours after transfection, cells were harvested and plated in 96-well plates in triplicates. Cell proliferation was assessed at the indicated times by measuring absorbance (OD) at 590–650 nm. A representative experiment out of two, each performed in triplicate, is shown. Mean ± s.d. is shown.
Extended Data Fig. 2: FBXL7 mediates the degradation of active c-SRC.
a, HEK-293T cells were transfected with the indicated FLAG-tagged F-box proteins (FBPs) or an empty vector (EV). Twenty-four hours after transfection, cells were harvested and lysed. Whole-cell extracts (WCE) were subjected to immunoprecipitation (IP) with an anti-FLAG resin and immunoblotting.
b, PNT1A cells were treated with MG132 during the last 3 h before lysis. Lysates were immunoprecipitated with either an antibody against c-SRC, an antibody to FBXL7, or nonspecific IgG, and immunoblotted.
c, HEK-293T cells were transfected with FLAG-tagged wild-type FBXL7, FLAG-tagged FBXL7(ΔF), or an empty vector (EV). Twenty-four hours after transfection, whole-cell extracts (WCE) were subjected to immunoprecipitation (IP) with an anti-FLAG resin and immunoblotting.
d, HEK-293T cells were transfected with FLAG-tagged wild-type c-SRC, FLAG-tagged c-SRC(Y530F), FLAG-tagged c-SRC(Y419F), or an empty vector (EV). Twenty-four hours after transfection, whole-cell extracts (WCE) were subjected to immunoprecipitation (IP) with an anti-FLAG resin and immunoblotting.
e, DU145 cells were transfected with a pool of four siRNAs to FBXL7 or a non-targeting (NT) siRNA oligo for 48 h, and treated with cycloheximide (CHX) for the indicated times. Protein extracts were then immunoblotted as indicated.
a-e, two independent experiments were performed with similar results.
Extended Data Fig. 3: FBXL7 binds c-SRC phosphorylated on Ser104.
a, Schematic representation of c-SRC mutants. Binding of c-SRC to FBXL7 is indicated with the symbol (+).
b-d, HEK-293T cells were transfected with FLAG-tagged versions of either wild-type c-SRC or the indicated c-SRC mutants, or with an empty vector (EV). Twenty-four hours after transfection, whole-cell extracts (WCE) were subjected to immunoprecipitation (IP) with an anti-FLAG resin and immunoblotting.
b-d, two independent experiments were performed with similar results.
e, Lysates from HEK-293T cells were used in binding reactions with beads coupled to either a peptide or a phospho-peptide flanking the residue S104 in the c-SRC sequence (sequences shown on top of the panel). Bound proteins from three independent experiments were subjected to immunoblotting.
f, Alignment of the region corresponding to amino acids 98–119 of human c-SRC in c-SRC orthologs.
g, HEK-293T cells were transfected with FLAG-tagged FBXL7. Twenty-four hours after, whole-cell extracts were treated with λ-phosphatase for 4 h, then subjected to immunoprecipitation (IP) with an anti-FLAG resin and immunoblotting.
h, Experiment was performed as in b-d.
i, Surface structure of human c-SRC obtained from PDB [www.rcsb.org;50]. The amino acid S104 is highlighted in red. Its position shows that it is a solvent-exposed surface amino acid.
j, HEK-293T cells were transfected with either one of two FLAG-tagged F-box proteins (FBPs), namely FBXL7 or FBXL1, or with an empty vector (EV). Twenty-four hours after transfection, whole-cell extracts (WCE) were subjected to immunoprecipitation (IP) with an anti-FLAG resin and immunoblotting.
g, j: Two independent experiments were performed with similar results.
Extended Data Fig. 4: FBXL7 silencing promotes cell migration.
a, MCF-7 cells were transfected with two different siRNAs to FBXL7 or a non-targeting (NT) siRNA oligo (left panels). PL45 cells were transfected with an siRNA oligo to FBXL7 or NT siRNA (right panels). Twenty-four hours after transfection, whole-cell extracts were immunoblotted as indicated.
b, PNT1A cells were transfected with an siRNA oligo to FBXL7 (FBXL7 si#1) or a non-targeting (NT) siRNA. Twenty-four hours after transfection, whole-cell extracts (WCE) were denatured and subjected to immunoprecipitation (IP) with anti-ETS1 antibody followed by immunoblotting. ETS1 phosphorylated on Tyr was detected with an anti-phospho-Tyr antibody (PY20).
a, b: Two independent experiments were performed with similar results.
c-d, PNT1A cells were transfected with an siRNA oligo to FBXL7 (FBXL7 si#1) or a non-targeting (NT) siRNA. Twenty-four hours after, cells were treated with either vehicle alone or two c-SRC kinase inhibitors [SU6656 or dasatinib] for an additional twenty-four hours, and either re-plated (c) or seeded on collagen type I-coated transwells (d). In c, after 18 hours, a wound-healing assay was performed up to 48 h in presence or absence of SU6656 or dasatinib. The graph shows a representative experiment out of two, each performed in triplicate. Mean ± s.d. is shown; 24 h, *** P = 0.00093 (NT vs. FBXL7 siRNA), 48 h, *** P = 0.00032 (NT vs. FBXL7 siRNA). P values are from unpaired, two-tailed t-test. In d, after 5 h, cells that migrated on the bottom of the transwells were counted in 10 different fields/well. The graph shows a representative experiment out of two performed for each condition. Mean ± s.d. is shown. n = 10. P values are from unpaired, two-tailed t-test.
e, PNT1A cells were transfected with an siRNA oligo to FBXL7 (FBXL7 si#1) or a non-targeting (NT) siRNA. Twenty-four hours after, cells were re-plated in 6-weel plates in a soft agar layer. After three weeks, the colonies were stained with nitro-blue-tetrazolium and photographed. PC-3 cancer cells were used as positive control.
f, PNT1A cells treated as in c-d, were analyzed by immunoblotting.
g, PC-3 prostate carcinoma cells were transfected with FLAG-tagged FBXL7 or an empty vector (EV). Twenty-four hours after transfection, cells were plated on 96-well plate in triplicates, allowed to adhere and, after 18 hours, assayed for cell motility through a wound-healing assay. The graph shows quantification from two independent experiments. e-g, n = 3 independent experiments. In g, mean ± s.d. is shown. P values are from unpaired, two-tailed t-test.
Extended Data Fig. 5: FBXL7 protein expression inversely correlates with c-SRC protein expression in pancreatic and prostate cancer.
a, Representative immunohistochemistry staining images of normal (N) and tumor human pancreatic specimens at different disease stage. Levels of FBXL7 and c-SRC protein in consecutive tissue slides are shown. n = 5 (N) and n = 66 (tumor) independent specimens. Scale bar: 100 μm.
b, Representative immunohistochemistry staining images of normal (N) and tumor prostate human specimens at different disease stage. Levels of FBXL7 and c-SRC protein in consecutive tissue slides are shown. n = 10 (N) and n = 84 (tumor) independent specimens. Scale bar: 100 μm.
Extended Data Fig. 6: Decrease in FBXL7 mRNA expression in prostate cancer is not associated with changes in c-SRC mRNA levels.
a-d, Oncomine analysis of FBXL7 and c-SRC mRNA levels in four independent collections of normal and tumor prostate human specimens. N, normal prostate; PCa, prostate carcinoma; PA, prostate adenocarcinoma. a, n = 28 (N), n = 94 (PCa); b, n = 29 (N), n = 155 (PCa), n = 1 (PA); c, n = 13 (N), n = 44 (PCa); d, n = 8 (N), n = 32 (PCa) independent specimens. Median, 10th and 90th percentile are shown in the bar graph. P values are from unpaired, two-tailed t-test, as reported in Oncomine (www.oncomine.org).
Extended Data Fig. 7: FBXL7 suppression promotes prostate cancer metastasis.
a, NOD/SCID-gamma mice were inoculated in the ventral prostate with 5 × 10⁵ PC-3 cells stably transfected with a non-targeting shRNA (NT), shRNAs to FBXL7, or both shRNAs to FBXL7 and c-SRC. Orthotopically transplanted mice were treated with doxycycline to induce shRNA expression (n = 5, NT shRNA; n = 7, FBXL7 shRNA; n = 10, FBXL7/c-SRC shRNA mice). Panels show representative H&E and immunohistochemical staining (antibodies to Ki67 and CD31) of primary tumors. Scale bar: 100 μm. The right panel shows quantification of Ki67 positive cells. Mean ± s.d. is shown. n = 4. P values are from unpaired, two-tailed t-test.
b, Representative anti-ZEB1 immunohistochemical staining of primary tumors from the experiment shown in a. n = 3. Scale bar: 10 μm.
c, Representative immunohistochemical staining of spleen and coagulating gland (CG) sections from FBXL7 shRNA mice with an antibody specific for human mitochondria. Bottom panel, number of mice with specific micrometastases in different organs/tissues. Scale bar: 100 μm.
Extended Data Fig. 8: Fbxl7 suppression promotes pancreatic cancer metastasis.
a, Schematic representation of the murine Fbxl7 genomic loci and gRNAs target locations.
b, Fbxl7 was knocked-out in FC1242 cells using CRISPR technology. 80% confluent FC1242 cells were lysed and whole-cell extracts were immunoblotted. KO clones E11 and G10 are shown. Two independent experiments were performed with similar results.
c, Top panels, FC1242 cells (parental and Fbxl7 KO, clone E11) were plated on transwells in the presence of 10% FBS in the outer chamber as chemoattractant. After 6 h, cells that migrated to the bottom of the transwells were counted in 10 different fields/well. Scale bar: 10 μm. The graph shows quantification from a representative experiment out of three independent experiments. n = 10. Middle graph, FC1242 cells (parental and Fbxl7 KO, clones E11 and G10) were harvested and plated in 96-well plates in triplicates. Cell proliferation was assessed by measuring absorbance (OD) at 590–650 nm at the indicated times. A representative experiment of two performed is shown. Bottom graph, FC1242 cells (parental and Fbxl7 KO, clone E11) were plated in a soft agar layer. After 3 weeks, colonies were stained and counted. The graph shows quantification from three independent experiments. Mean ± s.d. is shown. P values are from unpaired, two-tailed t-test.
d, FC1242 mouse pancreatic adenocarcinoma cells were transfected with an siRNA oligo to Fbxl7 or a non-targeting siRNA oligo (NT). Twenty-four or forty-eight hours after transfection, whole-cell extracts were immunoblotted. Two independent experiments were performed.
e, f, 80,000 Fbxl7 KO FC1242 cells were injected in the pancreas of 8-weeks old C57BL/6 mice. Eighteen days after injection, primary tumors, kidney, peritoneum, liver, epididymis and bladder were collected. Sections of primary tumors were stained with anti-ZEB1 and anti-ZEB2 antibodies (e). Sections of peritoneum, liver and kidney were subjected to H&E staining (f). N, normal tissue; T, tumor tissue. The table on the bottom shows the number of mice exhibiting macrometastases in specific tissues/total number of mice. Scale bars: 20 μm (e), 100 μm (f).
g, AsPC1 cells stably expressing non-targeting (NT) shRNA or FBXL7 shRNA were analyzed by immunoblotting (Left panel; two independent experiments performed) or plated in soft agar layer and, three weeks after, colonies were counted. The graph in the right panel shows quantification from three independent experiments Mean ± s.d. is shown. P values are from unpaired, two-tailed t-test.
h, 500,000 AsPC1 cells stably expressing NT or FBXL7 shRNA were injected in the tail of the pancreas of 8-weeks old B6.129S7-Rag1tm1Mom/J(002216) mice. Five weeks after injection, primary tumors were collected and sections analyzed by immunohistochemistry with an antibody to ZEB1 or ZEB2. n = 4. Scale bar: 20 μm.
Extended Data Table 1.
Clinical characteristics of prostate cancer specimens analyzed for FBXL7 promoter methylation.
| Patient No. | Age (y) | PSA (ng/ml) | Gleason Grade | TNM Stage | Disease Stage | FBXL7 Promoter Methylation (a.u.) |
|---|---|---|---|---|---|---|
| 1 | 27 | NR | - | - | - | 0 |
| 2 | 35 | NR | - | - | - | 1 |
| 3 | 20 | NR | - | - | - | 0 |
| 4 | 18 | NR | - | - | - | 1 |
| 5 | 59 | 5.4 | 4 (2+2) | T2N0M0 | II | 2 |
| 6 | 66 | 6 | 8 (3+5) | T2N0M0 | II | 1 |
| 7 | 66 | 7.7 | 7 (3+4) | T2N0M0 | II | 2 |
| 8 | 56 | 2.28 | 7 (3+4) | T2N0MX | II | 1 |
| 9 | 70 | 18 | 7 (3+4) | T2N0M0 | II | 0 |
| 10 | 62 | 5.1 | 7 (3+4) | T2cNXMX | II | 0 |
| 11 | 60 | 15 | 7 (3+4) | T2cNXMX | II | 1 |
| 12 | 59 | 5.1 | 7 (3+4) | T2cNXMX | II | 1 |
| 13 | 69 | 5.3 | 7 (3+4) | T2N0M0 | II | 1 |
| 14 | 65 | 8.38 | 7 (3+4) | T2N0M0 | II | 1 |
| 15 | 86 | 6.1 | 7 (3+4) | T2N0M0 | II | 1 |
| 16 | 60 | 15 | 7 (3+4) | T2cNXMX | II | 1 |
| 17 | 69 | 5.3 | 7 (3+4) | T3N0M0 | III | 1 |
| 18 | 64 | 6.1 | 7 (4+3) | T3N0M0 | III | 4 |
| 19 | 65 | 8.38 | 7 (4+3) | T3N0M0 | III | 4 |
| 20 | 53 | 5.1 | 6 (3+3) | T3bN0MX | III | 4 |
| 21 | 58 | 9.7 | 7 (4+3) | T3aNXMX | III | 3 |
| 22 | 63 | 5.42 | 9 (5+4) | T3N0M0 | III | 3 |
| 23 | 64 | 13 | 9 (5+4) | T3N0MX | III | 4 |
| 24 | 62 | 6.15 | 9 (4+5) | T3NXMX | III | 3 |
| 25 | 76 | 7.8 | 9 (4+5) | T3aN0MX | III | 1 |
| 26 | 53 | 8.8 | 9 (4+5) | T3bN0MX | III | 1 |
| 27 | 66 | 55 | 9 (5+4) | T3N1M1 | IV | 4 |
| 28 | 59 | 33.9 | 6 (3+3) | T2N0M0 | II | 1 |
| 29 | 55 | 7.8 | 6 (3+3) | T2N0M0 | II | 0 |
| 30 | 63 | 4.36 | 6 (3+3) | T2N0M0 | II | 0 |
| 31 | 56 | 4.2 | 6 (3+3) | T2N0M0 | II | 1 |
| 32 | 58 | 2.9 | 6 (3+3) | T2N0M0 | II | 0 |
| 33 | 65 | 0.05 | 7 (3+4) | T2N0M0 | II | 0 |
| 34 | 66 | 17 | 7 (4+3) | T3N0M0 | III | 3 |
| 35 | 58 | 5.2 | 7 (4+3) | T3N0M0 | III | 3 |
| 36 | 59 | 4.7 | 7 (3+4) | T2N0M0 | II | 1 |
| 37 | 58 | 2.67 | 7 (3+4) | T2N0M0 | II | 1 |
| 38 | 64 | 6.15 | 7 (4+3) | T3N0M0 | III | 2 |
| 39 | 69 | 6.46 | 7 (3+4) | T2N0M0 | II | 0 |
| 40 | 65 | 7 | 7 (4+3) | T3N0M0 | III | 2 |
| 41 | 74 | 5.3 | 8 (4+4) | T3bN0MX | III | 4 |
| 42 | 61 | 18 | 9 (5+4) | T3N1M1 | IV | 5 |
| 43 | 60 | 45.3 | 9 (5+4) | T3N1M1 | IV | 5 |
| 44 | 63 | 8.5 | 9 (5+4) | T3N0MX | III | 4 |
| 45 | 76 | 7.8 | 9 (5+4) | T3bN0MX | III | 4 |
| 46 | 53 | 11 | 9 (5+4) | T3bN0MX | III | 4 |
Specimens n. 1–4: benign prostate; NR, not recorded; a.u., arbitrary units: 2, 3, 4, 5 indicate at least 2-, 3-, 4- and 5-fold increase in promoter methylation levels compared to benign prostate.
Supplementary Material
Acknowledgments
The authors thank Andrea Viale for reagents, and Sara Courtneidge for critically reading the manuscript and insightful discussion. MP is grateful to T.M. Thor for continuous support. This work was funded by grants from the National Institutes of Health to MP (GM136250 and CA76584) and GM (CA168611, CA215471, CA206105) and by the Pancreatic Cancer Action network Translational Research Grant to GM. MP is an Investigator with the Howard Hughes Medical Institute. The NYU Center for Biospecimen Research and Development, Immunohistochemistry Laboratory is supported in part by the Laura and Isaac Perlmutter Cancer Center Support Grant; NIH /NCI P30CA016087” and the National Institutes of Health S10 Grants; NIH/ORIP S10OD01058 and S10OD018338.
Footnotes
Competing Interests
The authors declare no competing financial interests. M.P. is a consultant for BeyondSpring Pharmaceuticals, CullGen Inc., Kymera Therapeutics, Exo Therapeutics, and SEED Therapeutics.
References
- 1.Lambert AW, Pattabiraman DR & Weinberg RA Emerging Biological Principles of Metastasis. Cell 168, 670–691 (2017). [DOI] [PMC free article] [PubMed] [Google Scholar]
- 2.Harper KL et al. Mechanism of early dissemination and metastasis in Her2+ mammary cancer. Nature (2016). [DOI] [PMC free article] [PubMed] [Google Scholar]
- 3.Hosseini H et al. Early dissemination seeds metastasis in breast cancer. Nature (2016). [DOI] [PMC free article] [PubMed] [Google Scholar]
- 4.Patel SA & Vanharanta S Epigenetic determinants of metastasis. Mol Oncol (2016). [DOI] [PMC free article] [PubMed] [Google Scholar]
- 5.Pfeifer GP Defining Driver DNA Methylation Changes in Human Cancer. Int J Mol Sci 19 (2018). [DOI] [PMC free article] [PubMed] [Google Scholar]
- 6.Liu L et al. Association of tissue promoter methylation levels of APC, TGFbeta2, HOXD3 and RASSF1A with prostate cancer progression. Int J Cancer 129, 2454–2462 (2011). [DOI] [PubMed] [Google Scholar]
- 7.Skrypek N, Goossens S, De Smedt E, Vandamme N & Berx G Epithelial-to-Mesenchymal Transition: Epigenetic Reprogramming Driving Cellular Plasticity. Trends Genet 33, 943–959 (2017). [DOI] [PubMed] [Google Scholar]
- 8.Skaar JR, Pagan JK & Pagano M SCF ubiquitin ligase-targeted therapies. Nat Rev Drug Discov 13, 889–903 (2014). [DOI] [PMC free article] [PubMed] [Google Scholar]
- 9.Wang Z, Liu P, Inuzuka H & Wei W Roles of F-box proteins in cancer. Nat Rev Cancer 14, 233–247 (2014). [DOI] [PMC free article] [PubMed] [Google Scholar]
- 10.Heo J, Eki R & Abbas T Deregulation of F-box proteins and its consequence on cancer development, progression and metastasis. Semin Cancer Biol 36, 33–51 (2016). [DOI] [PMC free article] [PubMed] [Google Scholar]
- 11.Huang WY et al. MethHC: a database of DNA methylation and gene expression in human cancer. Nucleic Acids Res 43, D856–861 (2015). [DOI] [PMC free article] [PubMed] [Google Scholar]
- 12.Grawenda AM & O’Neill E Clinical utility of RASSF1A methylation in human malignancies. Br J Cancer 113, 372–381 (2015). [DOI] [PMC free article] [PubMed] [Google Scholar]
- 13.Cunningham D & You Z In vitro and in vivo model systems used in prostate cancer research. J Biol Methods 2 (2015). [DOI] [PMC free article] [PubMed] [Google Scholar]
- 14.Bao J, Gur G & Yarden Y Src promotes destruction of c-Cbl: implications for oncogenic synergy between Src and growth factor receptors. Proc Natl Acad Sci U S A 100, 2438–2443 (2003). [DOI] [PMC free article] [PubMed] [Google Scholar]
- 15.Pettaway CA et al. Selection of highly metastatic variants of different human prostatic carcinomas using orthotopic implantation in nude mice. Clin Cancer Res 2, 1627–1636 (1996). [PubMed] [Google Scholar]
- 16.Mayer EL & Krop IE Advances in targeting SRC in the treatment of breast cancer and other solid malignancies. Clin Cancer Res 16, 3526–3532 (2010). [DOI] [PubMed] [Google Scholar]
- 17.Summy JM & Gallick GE Src family kinases in tumor progression and metastasis. Cancer Metastasis Rev 22, 337–358 (2003). [DOI] [PubMed] [Google Scholar]
- 18.Bromann PA, Korkaya H & Courtneidge SA The interplay between Src family kinases and receptor tyrosine kinases. Oncogene 23, 7957–7968 (2004). [DOI] [PubMed] [Google Scholar]
- 19.Yokouchi M et al. Src-catalyzed phosphorylation of c-Cbl leads to the interdependent ubiquitination of both proteins. J Biol Chem 276, 35185–35193 (2001). [DOI] [PubMed] [Google Scholar]
- 20.Teckchandani A et al. Cullin 5 destabilizes Cas to inhibit Src-dependent cell transformation. J Cell Sci 127, 509–520 (2014). [DOI] [PMC free article] [PubMed] [Google Scholar]
- 21.Mertins P et al. Proteogenomics connects somatic mutations to signalling in breast cancer. Nature 534, 55–62 (2016). [DOI] [PMC free article] [PubMed] [Google Scholar]
- 22.Schreiber TB, Mausbacher N, Keri G, Cox J & Daub H An integrated phosphoproteomics work flow reveals extensive network regulation in early lysophosphatidic acid signaling. Mol Cell Proteomics 9, 1047–1062 (2010). [DOI] [PMC free article] [PubMed] [Google Scholar]
- 23.Trinidad JC et al. Global identification and characterization of both O-GlcNAcylation and phosphorylation at the murine synapse. Mol Cell Proteomics 11, 215–229 (2012). [DOI] [PMC free article] [PubMed] [Google Scholar]
- 24.Kalluri R EMT: when epithelial cells decide to become mesenchymal-like cells. J Clin Invest 119, 1417–1419 (2009). [DOI] [PMC free article] [PubMed] [Google Scholar]
- 25.Guarino M Src signaling in cancer invasion. J Cell Physiol 223, 14–26 (2010). [DOI] [PubMed] [Google Scholar]
- 26.Lu G et al. Phosphorylation of ETS1 by Src family kinases prevents its recognition by the COP1 tumor suppressor. Cancer Cell 26, 222–234 (2014). [DOI] [PMC free article] [PubMed] [Google Scholar]
- 27.Thaper D et al. Targeting Lyn regulates Snail family shuttling and inhibits metastasis. Oncogene 36, 3964–3975 (2017). [DOI] [PubMed] [Google Scholar]
- 28.Mukhopadhyay D et al. Hypoxic induction of human vascular endothelial growth factor expression through c-Src activation. Nature 375, 577–581 (1995). [DOI] [PubMed] [Google Scholar]
- 29.Kozlowski JM et al. Metastatic behavior of human tumor cell lines grown in the nude mouse. Cancer Res 44, 3522–3529 (1984). [PubMed] [Google Scholar]
- 30.Xie D et al. Role of DAB2IP in modulating epithelial-to-mesenchymal transition and prostate cancer metastasis. Proc Natl Acad Sci U S A 107, 2485–2490 (2010). [DOI] [PMC free article] [PubMed] [Google Scholar]
- 31.Seifert L et al. The necrosome promotes pancreatic oncogenesis via CXCL1 and Mincle-induced immune suppression. Nature 532, 245–249 (2016). [DOI] [PMC free article] [PubMed] [Google Scholar]
- 32.Bellon E, Gebauer F, Tachezy M, Izbicki JR & Bockhorn M Pancreatic cancer and liver metastases: state of the art. Updates Surg 68, 247–251 (2016). [DOI] [PubMed] [Google Scholar]
- 33.Birnbaum DJ et al. Genome profiling of pancreatic adenocarcinoma. Genes Chromosomes Cancer 50, 456–465 (2011). [DOI] [PubMed] [Google Scholar]
- 34.Vazquez-Mena O et al. Amplified genes may be overexpressed, unchanged, or downregulated in cervical cancer cell lines. PLoS One 7, e32667 (2012). [DOI] [PMC free article] [PubMed] [Google Scholar]
- 35.Iwakawa R et al. MYC amplification as a prognostic marker of early-stage lung adenocarcinoma identified by whole genome copy number analysis. Clin Cancer Res 17, 1481–1489 (2011). [DOI] [PubMed] [Google Scholar]
- 36.Boelens MC et al. Genomic aberrations in squamous cell lung carcinoma related to lymph node or distant metastasis. Lung Cancer 66, 372–378 (2009). [DOI] [PubMed] [Google Scholar]
- 37.Coppola D Molecular prognostic markers in pancreatic cancer. Cancer Control 7, 421–427 (2000). [DOI] [PubMed] [Google Scholar]
- 38.Criscuoli ML, Nguyen M & Eliceiri BP Tumor metastasis but not tumor growth is dependent on Src-mediated vascular permeability. Blood 105, 1508–1514 (2005). [DOI] [PubMed] [Google Scholar]
- 39.Zhang XH et al. Latent bone metastasis in breast cancer tied to Src-dependent survival signals. Cancer Cell 16, 67–78 (2009). [DOI] [PMC free article] [PubMed] [Google Scholar]
- 40.Patel A, Sabbineni H, Clarke A & Somanath PR Novel roles of Src in cancer cell epithelial-to-mesenchymal transition, vascular permeability, microinvasion and metastasis. Life Sci 157, 52–61 (2016). [DOI] [PMC free article] [PubMed] [Google Scholar]
- 41.Dosch AR et al. Src kinase inhibition restores E-cadherin expression in dasatinib-sensitive pancreatic cancer cells. Oncotarget 10, 1056–1069 (2019). [DOI] [PMC free article] [PubMed] [Google Scholar]
- 42.Irby RB & Yeatman TJ Role of Src expression and activation in human cancer. Oncogene 19, 5636–5642 (2000). [DOI] [PubMed] [Google Scholar]
- 43.Lutz MP et al. Overexpression and activation of the tyrosine kinase Src in human pancreatic carcinoma. Biochem Biophys Res Commun 243, 503–508 (1998). [DOI] [PubMed] [Google Scholar]
- 44.Tatarov O et al. SRC family kinase activity is up-regulated in hormone-refractory prostate cancer. Clin Cancer Res 15, 3540–3549 (2009). [DOI] [PubMed] [Google Scholar]
- 45.Park SI et al. Targeting SRC family kinases inhibits growth and lymph node metastases of prostate cancer in an orthotopic nude mouse model. Cancer Res 68, 3323–3333 (2008). [DOI] [PubMed] [Google Scholar]
- 46.Morton JP et al. Dasatinib inhibits the development of metastases in a mouse model of pancreatic ductal adenocarcinoma. Gastroenterology 139, 292–303 (2010). [DOI] [PubMed] [Google Scholar]
- 47.Brabletz T et al. Invasion and metastasis in colorectal cancer: epithelial-mesenchymal transition, mesenchymal-epithelial transition, stem cells and beta-catenin. Cells Tissues Organs 179, 56–65 (2005). [DOI] [PubMed] [Google Scholar]
- 48.Liu Y et al. The Proapoptotic F-box Protein Fbxl7 Regulates Mitochondrial Function by Mediating the Ubiquitylation and Proteasomal Degradation of Survivin. J Biol Chem 290, 11843–11852 (2015). [DOI] [PMC free article] [PubMed] [Google Scholar]
- 49.Coon TA, Glasser JR, Mallampalli RK & Chen BB Novel E3 ligase component FBXL7 ubiquitinates and degrades Aurora A, causing mitotic arrest. Cell Cycle 11, 721–729 (2012). [DOI] [PMC free article] [PubMed] [Google Scholar]
- 50.Xu W, Doshi A, Lei M, Eck MJ & Harrison SC Crystal structures of c-Src reveal features of its autoinhibitory mechanism. Mol Cell 3, 629–638 (1999). [DOI] [PubMed] [Google Scholar]
Associated Data
This section collects any data citations, data availability statements, or supplementary materials included in this article.


