

Summary
Pausing by RNA polymerase (RNAP) during transcription elongation, in which a translocating RNAP uses a “stepping” mechanism, has been studied extensively, but pausing by RNAP during initial transcription, in which a promoter-anchored RNAP uses a “scrunching” mechanism, has not. We report a method that directly defines the RNAP-active-center position relative to DNA with single-nucleotide resolution (XACT-seq; “crosslink-between-active-center-and-template sequencing”). We apply this method to detect and quantify pausing in initial transcription at 411 (~4,000,000) promoter sequences in vivo, in Escherichia coli. The results show initial-transcription pausing can occur in each nucleotide addition during initial transcription, particularly the first 4–5 nucleotide additions. The results further show initial-transcription pausing occurs at sequences that resemble the consensus sequence element for transcription-elongation pausing. Our findings define the positional and sequence determinants for initial-transcription pausing and establish initial-transcription pausing is hard-coded by sequence elements similar to those for transcription-elongation pausing.
eTOC Blurb
Winkelman et al. report a protein-DNA photocrosslinking method that provides single-nucleotide-resolution readout of RNA polymerase active-center position relative to DNA and enables analysis of initial-transcription pausing. Analysis of 411 (~4,000,000) promoter sequences defines positional determinants and sequence determinants for initial-transcription pausing by bacterial RNA polymerase in vitro and in vivo.
Graphical Abstract
Introduction
RNA polymerase (RNAP) initiates transcription by binding double-stranded promoter DNA, unwinding a turn of promoter DNA to yield an RNAP-promoter open complex (RPo) containing a ~13 base pair single-stranded “transcription bubble” (Figure 1A) and selecting a transcription start site (TSS) (Ruff et al., 2015; Mazumder and Kapanidis, 2019; Winkelman et al., 2019). TSS selection entails placement of the start-site nucleotide (position +1) and the next nucleotide (position +2) of the template DNA strand into the RNAP-active-center product site (“P-site”) and addition site (“A-site”), respectively, and binding an initiating entity in the P-site and an extending NTP in the A-site.
Figure 1. Mechanisms of initial transcription and transcription elongation.

(A) Initial transcription involves RNAP-active-center translocation through “DNA scrunching,” with RNAP in complex with initiation factor σ. Panel shows first six nucleotide-addition steps of initial transcription, starting from RNAP-promoter open complex (RPo), and yielding successive RNAP-promoter ITCs containing 2- to 6-nt RNA products (ITC,2-ITC,6). Following each nucleotide addition, the RNAP active center translocates forward through a DNA scrunching mechanism, from a pre-translocated state (pre; right column) to a post-translocated state (post; left column), and the RNAP-active-center A-site position advances by 1 bp. Grey, RNAP; yellow, σ; dark yellow, σ finger; blue, −10 element and TSS; P and A, RNAP-active-center P-site and A-site, respectively; black boxes, DNA nucleotides (nontemplate-strand nucleotides above template-strand nucleotides); red boxes, RNA nucleotides; positions numbered relative to the TSS position, +1.
(B) Transcription elongation involves RNAP-active-center translocation through “DNA stepping,” with RNAP not containing σ. Panel shows two nucleotide-addition steps of transcription elongation, from TEC containing 11 nt of RNA (TEC,11) to TEC containing 13 nt of RNA (TEC,13). Following each nucleotide addition, RNAP translocates forward through a DNA stepping mechanism, between a pre-translocated state (pre; right column) and a post-translocated state (post; left column), and the RNAP-active-center A-site position advances by 1 bp. Symbols and colors as in A.
The first ~10 nucleotides (nt) of an RNA product are synthesized as an RNAP-promoter initial transcribing complex (ITC) in which RNAP remains anchored on promoter DNA through sequence-specific protein-DNA interactions (Figure 1A; Mazumder and Kapanidis, 2019; Winkelman et al., 2019). Initial transcription starts with phosphodiester bond formation between the initiating entity and the extending NTP, to yield an initial RNA product (Figure 1A; ITC,2). Each nucleotide-addition cycle after initial product formation requires translocation of the RNAP active center relative to DNA and RNA, starting from a “pre-translocated” state, and yielding a “post-translocated” state (Figure 1A,B; Erie et al., 1992; Zhang and Landick, 2009; Larson et al., 2011; Belogurov and Artsimovitch, 2019). Translocation of the RNAP active center repositions the RNA 3ʹ nucleotide from the A-site to the P-site, rendering the A-site available to bind the next extending NTP. Initial transcription proceeds until synthesis of an RNA product of a threshold length of ~10 nt (Mazumder and Kapanidis, 2019; Winkelman et al., 2019). Upon synthesis of a threshold-length RNA product, RNAP breaks the sequence-specific protein-DNA interactions that anchor it on promoter DNA, escapes the promoter, and synthesizes the rest of the RNA product as a transcription elongation complex (TEC; Figure 1B).
There are two clear differences in the mechanism of initial transcription (performed by ITC) and transcription elongation (performed by TEC): (i) a different mechanism of RNAP active-center translocation, and (ii) a different RNAP subunit composition (Figure 1).
The first difference in the mechanisms of initial transcription and transcription elongation is a consequence of sequence-specific protein-DNA interactions that anchor RNAP on promoter DNA in initial transcription, but not in elongation (Larson et al., 2011; Belogurov and Artsimovitch, 2019; Mazumder and Kapanidis, 2019; Winkelman et al., 2019). These protein-DNA interactions prevent RNAP from moving relative to DNA in initial transcription, but not in elongation. Therefore, RNAP uses a different mechanism of RNAP active-center translocation in initial transcription vs elongation (Larson et al., 2011; Belogurov and Artsimovitch, 2019; Mazumder and Kapanidis, 2019; Winkelman et al., 2019). In initial transcription, RNAP uses a “scrunching” mechanism, in which, in each nucleotide-addition cycle, RNAP remains anchored to promoter DNA, unwinds one base pair of DNA downstream of the RNAP active center, pulls the unwound single-stranded DNA (ssDNA) into and past the RNAP active center, and accommodates the additional unwound ssDNA as bulges in the transcription bubble (Figure 1A; Kapanidis et al., 2006; Margeat et al., 2006; Revyakin et al., 2006). In contrast, in elongation, RNAP uses a “stepping” mechanism, in which, in each nucleotide-addition cycle, RNAP steps forward by one base pair relative to the DNA (Figure 1B; Abbondanzieri et al., 2005).
The second difference in the mechanisms of initial transcription and elongation is a consequence of the fact that initial transcription is carried out by a macromolecular assembly containing the initiation factor σ (Figure 1A), whereas transcription elongation is typically carried out by a macromolecular assembly lacking σ (Figure 1B; Mooney et al., 2005; Larson et al., 2011; Belogurov and Artsimovitch, 2019; Mazumder and Kapanidis, 2019; Winkelman et al., 2019). In the ITC, a module of σ referred to as the “σ finger,” reaches into the RNAP-active-center cleft and interacts with template-strand ssDNA in the transcription bubble close to the RNAP active center (Figure 1A; Severinov et al., 1994; Murakami et al., 2002; Kulbachinskiy and Mustaev, 2006; Zhang et al., 2012; Basu et al., 2014). These interactions pre-organize template-strand ssDNA to engage the RNAP active center, thereby facilitating binding of initiating and extending NTPs (Murakami et al., 2002; Kulbachinskiy and Mustaev, 2006; Zhang et al., 2012; Pupov et al., 2014). Interactions of the σ finger with template-strand ssDNA places the σ finger in the path that will be occupied by nascent RNA upon RNA extension (Murakami et al., 2002; Kulbachinskiy and Mustaev, 2006; Zhang et al., 2012; Basu et al., 2014; Pupov et al., 2014; Zuo and Steitz, 2015). Thus, interactions of the σ finger with template-strand ssDNA presumably create an obstacle that must be overcome during initial transcription. Specifically, when the RNA reaches a length of ~4 to ~5 nt (after ~2 to ~3 RNAP-active-center translocation steps), the RNA 5ʹ end appears to contact, and make favorable interactions with, the σ finger, but, when the RNA reaches a length of ~5 to ~7 nt (after ~3 to ~5 RNAP-active-center translocation steps), the RNA 5ʹ end is expected to collide with, and clash with, the σ finger (Figure 1A; Murakami et al., 2002; Kulbachinskiy and Mustaev, 2006; Zhang et al., 2012; Basu et al., 2014; Pupov et al., 2014; Zuo and Steitz, 2015). The occurrence at one point of a favorable interaction with the σ finger (after ~2 to ~3 translocation steps), and subsequently a clash with the σ finger (after ~3 to ~5 translocation steps), is expected to have position-specific effects on RNAP active-center translocation during initial transcription. In contrast, in elongation, where σ typically is absent (Mooney et al., 2005; Belogurov and Artsimovitch, 2019), no such position-specific effects on translocation are expected to occur.
In both initial transcription and elongation, in the presence of saturating NTPs, each nucleotide-addition cycle takes, on average, ~20 ms (Belogurov and Artsimovitch, 2019). In both initial transcription and elongation, pauses--nucleotide-addition cycles that occur on the second or longer timescales--are off-pathway states that potentially modulate gene-expression levels (Larson et al., 2011; Belogurov and Artsimovitch, 2019; Kang et al., 2019; Mazumder and Kapanidis, 2019). Transcription-elongation pausing has been the subject of extensive analysis, both in vitro and in vivo (Larson et al., 2011; Belogurov and Artsimovitch, 2019; Kang et al., 2019). The results establish that transcription-elongation pausing is determined by the sequence of the DNA template, rather than TEC position relative to the TSS or the length of RNA in the TEC. For Escherichia coli RNAP, both in vitro and in vivo, transcription-elongation pausing occurs at DNA sequence elements that have the consensus sequence G−10N−9N−8N−7N−6N−5N−4N−3N−2Y−1G+1, where Y is a pyrimidine and Y−1 corresponds to the position of the RNA 3’ end (Herbert et al., 2006; Larson et al., 2014; Vvedenskaya et al., 2014; Imashimizu et al., 2015; see also Kang et al., 2019; Saba et al., 2019). In contrast, initial-transcription pausing has been subject to only limited studies in vitro (Duchi et al., 2016; Lerner et al., 2016; Dulin et al., 2018) and no studies in vivo. As a result, it is not known whether initial-transcription pausing occurs in vivo, it is not known what fraction of promoter sequences undergo initial-transcription pausing, the promoter-position dependence of initial-transcription pausing has not been defined, and the promoter-sequence determinants for initial-transcription pausing have not been defined.
Results
Rationale
During RNA synthesis, the dwell time of the RNAP active center at each transcribed-region position, “RNAP occupancy,” is correlated with the tendency of RNAP to pause at that position. Accordingly, pause sites can be identified using methods that provide a measure of RNAP occupancy (Figure 2). Previously reported sequencing-based methods to monitor RNAP occupancies, such as native elongating transcript sequencing (NET-seq), rely on identifying and quantifying RNA 3’ ends (Figure 2A; Churchman and Weissman, 2011; Churchman and Weissman, 2012; Larson et al., 2014; Vvedenskaya et al., 2014; Imashimizu et al., 2015). The identities of RNA 3’ ends allow estimation of RNAP-active-center positions--subject to uncertainties, due to ability of RNAP to sample pre-translocated, post-translocated, reverse-translocated, and hyper-translocated states (Figure 2A,B; Larson et al., 2011; Belogurov and Artsimovitch, 2019)--and the quantities of RNA 3’ ends allow estimation of RNAP-active-center dwell times. However, these methods provide only an indirect measure of RNAP-active-center positions relative to DNA (Figure 2A), and because these methods cannot be applied to RNAs less than ~15-nt in length (Figure S1), these methods are not suitable for analysis of initial transcription. Methods combining chromatin immunoprecipitation (ChIP) with sequencing, such as ChIP-seq and ChIP-exo, are alternative sequencing-based methods of mapping RNAP relative to DNA (Barski et al., 2007; Rhee and Pugh, 2012; Srivastava et al., 2013; Latif et al., 2018). However, these methods provide insufficient resolution for most purposes and define overall RNAP boundaries relative to DNA rather than RNAP-active-center positions.
Figure 2. Approaches to map the RNAP-active-center A-site position: NET-seq and XACT-seq.

(A) Approach to map the RNAP-active-center A-site position through analysis of RNA 3’ ends. Procedure entails isolating nascent RNA and identifying and quantifying RNA 3’ ends by polyacrylamide gel electrophoresis (PAGE) or high-throughput sequencing (NET-seq). The RNAP-active-center A-site position (purple box; numbered relative to TSS position, +1) is approximated based on the RNA 3’ end (pink box); other symbols and colors as in Fig. 1. Different translocational states adopted by TEC containing single, defined 20-nt RNA product--e.g., reverse-translocated by 5 bp (TEC,20-reverse-5), reverse-translocated by 1 bp (TEC,20-reverse-1), pre-translocated (TEC, 20-pre), post-translocated (TEC,20-post), and hyper-translocated by 1 bp (TEC,20-hyper-1)--all yield the same RNA 3’ end and therefore cannot be distinguished.
(B) Approach to map the RNAP-active-center A-site position through site-specific protein-DNA photocrosslinking. using RNAP derivative containing photoactivatable agent (green circle labeled Bpa) that crosslinks to DNA at defined distance from RNAP active center. Procedure entails UV-irradiating transcription complexes, isolating RNAP-crosslinked DNA, and identifying and quantifying crosslinking sites by analysis of primer extension products by PAGE or HTS (XACT-seq). The RNAP-active-center A-site position (purple box; numbered relative to TSS position, +1) is defined based on identity of crosslinking site (green box). Symbols as in A. Different translocational states adopted by a TEC containing single, defined RNA product yield different crosslinking sites and therefore can be distinguished.
See also Fig. S1.
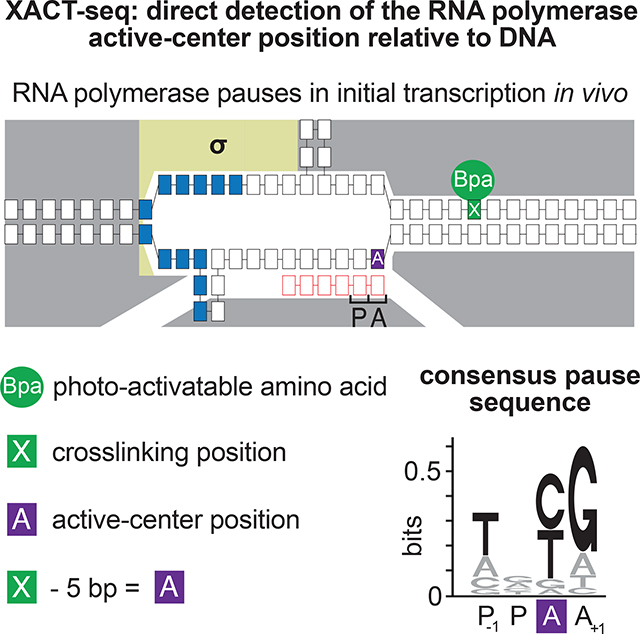
Here we describe a sequencing-based method to monitor RNAP occupancy that overcomes these limitations, providing a direct, single-nucleotide-resolution readout of RNAP-active-center position relative to DNA (Figure 2B), and that is suitable for analysis of initial transcription as well as elongation. The method entails formation of transcription complexes in vitro or in vivo using an RNAP derivative that has a photo-activatable crosslinking agent incorporated at a single, defined site in RNAP that, upon photo-activation in vitro or in vivo, forms covalent crosslinks with DNA at a defined position relative to the RNAP-active-center A-site; photo-activation to initiate covalent crosslinking of RNAP to DNA in vitro or in vivo; and high-throughput sequencing of primer extension products to define crosslink positions and crosslink yields. We term this method: “crosslink-between-active-center-and-template sequencing” (XACT-seq; Figure 2B).
XACT-seq takes advantage of an RNAP derivative that has a photo-activatable crosslinking amino acid p-benzoyl-L-phenylalanine (Bpa) incorporated at RNAP-β’ subunit residue R1148 (RNAP-β’ R1148Bpa), which, upon photo-activation, forms covalent crosslinks with DNA at a position exactly 5-nt downstream of the RNAP-active-center A-site (Figure 2B; Yu et al., 2017). In previous work, we used this RNAP derivative for structural analysis of static, trapped transcription complexes (Winkelman et al., 2015; Winkelman et al., 2016a; Yu et al., 2017). In this work, we show this RNAP derivative exhibits transcription-elongation pausing and initial-transcription pausing properties indistinguishable from those of wild-type, unmodified RNAP (Figure 3), and we apply this RNAP derivative for analysis of actively-transcribing complexes (Figures 4–6, S2–S4, S6, S7).
Figure 3. Incorporation of Bpa at RNAP-β’ subunit residue R1148 does not affect pausing in vitro.

(A) Transcription-elongation pausing. Top, sequence of DNA template containing 65-bp transcribed region with consensus sequence element for transcription-elongation pausing (red). Bottom, PAGE analysis of products of transcription reactions performed with RNAP-β’ R1148Bpa or RNAP-β’ wt. Gel shows RNA products at indicated times after addition of NTPs to complexes halted at position +29. +46, pause position. Pause-capture efficiencies (calculated as described in Landick et al., 1996) are means ± SD (n =3).
(B) Initial-transcription pausing. Top, sequence of placCONS initial-transcribed region. Bottom left, products of reactions performed using ApA as initiating entity and NTP subsets that enable synthesis of RNA products of up to 7 nt (UTP/GTP) or up to 11 nt (UTP/GTP/ATP). Bottom right, products of reaction performed using ApA as initiating entity and NTP subset that enables synthesis of RNA products up to 11 nt, with RNAP-β’ R1148Bpa (β’ Bpa) or RNAP-β’ wt (β’ wt). Positions of 6-nt paused RNA product and 7- and 11-nt full-length RNA products are indicated. Percentage of 6-nt RNA products are means ± SD (n = 3).
See also Fig. S2.
Figure 4. RNAP-active-center A-site positions in initial-transcription pausing at the lacCONS promoter in vitro and in vivo.

(A) In vitro. Top, placCONS. Middle, primer extension mapping of crosslinking sites. Bottom, position of RNAP-active-center A-site (purple) and nucleotide crosslinked to Bpa (green) defined relative to the TSS position. Markers, sequence ladder generated using placCONS. β’ Bpa, RNAP-β’ R1148Bpa; β’ Bpa; σΔ finger, RNAP-β’ R1148Bpa containing σ finger deletion; β’ Bpa; βD446A, RNAP-β’ R1148Bpa containing β substitution D446A.
(B) In vivo. Top, three-plasmid merodiploid system for co-production, in E. coli cells, of decahistidine-tagged, RNAP-β’ R1148Bpa, in the presence of untagged wild-type RNAP. First plasmid carries gene for RNAP βʹ subunit (grey rectangle) with nonsense codon (green) at residue βʹ R1148; second plasmid carries genes for engineered Bpa-specific nonsense-suppressor tRNA and aminoacyl-tRNA synthetase (white rectangles); third plasmid carries placCONS; and chromosome (brown oval) carries genes for wild-type RNAP subunits (light grey rectangle). Middle, primer-extension mapping of crosslinking sites. Bottom, position of RNAP-active-center A-site (purple) and nucleotide crosslinked to Bpa (green) defined relative to the TSS position, +1. Rif, rifampin; Markers, sequence ladder generated using placCONS.
(C) Interpretation of results in A and B. Symbols and colors as in Figs. 1–2.
See also Fig. S3.
RNAP-active-center A-site positions in initial-transcription pausing at the lacCONS promoter in vitro and in vivo
To demonstrate that the RNAP derivative that underpins XACT-seq, RNAP-β’ R1148Bpa, enables detection of RNAP-active-center A-site positions in actively-transcribing complexes, and enables detection of initial-transcription pausing, we used RNAP-β’ R1148Bpa to analyze actively-transcribing complexes engaged in initial-transcription pausing (Figure 4). We analyzed initial-transcription pausing at the lacCONS promoter (placCONS; Figure 4A, top), the best-characterized example of initial-transcription pausing (Duchi et al., 2016; Lerner et al., 2016; Mazumder and Kapanidis, 2019). Lerner et al. and Duchi et al. showed in vitro that initial-transcription pausing occurs at placCONS after ~4 to ~6 RNAP-active-center translocation steps (Duchi et al., 2016; Lerner et al., 2016). Duchi et al. and Dulin et al. further showed in vitro that this pause is reduced upon deletion of the σ finger (Duchi et al., 2016) and is increased upon substitution of the RNAP β-subunit residue 446 (βD446A) (Dulin et al., 2018), a substitution that alters the sequence dependence of RNAP-active-center translocation behavior (Zhang et al., 2012; Vvedenskaya et al., 2014).
We first used RNAP-β’ R1148Bpa to detect initial-transcription pausing at placCONS in vitro. The results in Figure 4A, lanes 5, 8, and 11, confirm the previously reported ability of the RNAP-β’ R1148Bpa to detect the A-site position with single-nucleotide resolution in static initial-transcribing complexes in the absence of NTP substrates in vitro (Winkelman et al., 2015; Winkelman et al., 2016a; Winkelman et al., 2016b; Yu et al., 2017). The results in Figure 4A, lanes 6, 9, and 12, demonstrate that the detected position of the A-site does not change upon addition of a 2-nt RNA (ApA), suggesting that the resulting ITC,2 is in a pre-translocated state (ITC,2-pre). The results in Figure 4A, lane 7, demonstrate the ability of RNAP-β’ R1148Bpa to detect A-site positions--and to detect initial-transcription pausing--in active initial-transcribing complexes in the presence of all NTP substrates in vitro.
We observe strong pausing at a position corresponding to exactly 4 RNAP-active-center translocation steps relative to RPitc,2-pre (i.e., when the A-site is at promoter position +6; Figure 4A). We observe that RNAP occupancy at this position decreases upon deletion of the σ finger (Figure 4A, compare lanes 7 and 10) and increases upon substitution of RNAP β-subunit residue 446 (Figure 4A, compare lanes 7 and 13). The pause exhibits the previously reported hallmarks of initial-transcription pausing at placCONS: i.e., pausing after ~4 to ~6 active-center translocation steps (i.e., when the RNAP active-center A site is at promoter position +6 to +8; Duchi et al., 2016; Lerner et al., 2016), a decrease in pausing upon deletion of the σ finger (Duchi et al., 2016; Figure S2), and an increase in pausing upon substitution of RNAP β-subunit residue 446 (Dulin et al., 2018; Figure S2). The pause is not reduced upon addition of transcript-cleavage factor GreB (Figures S2 and S3), indicating the pause does not involve a backtracked state (see Fish and Kane, 2002). We conclude that the pausing that occurs when the RNAP-active-center A-site is at promoter position +6 represents initial-transcription pausing.
We next used RNAP-β’ R1148Bpa to detect initial-transcription pausing at placCONS in vivo. We produced, in Escherichia coli, a Bpa-labeled, decahistidine-tagged RNAP-β’ R1148Bpa in the presence of unlabeled, untagged, wild-type RNAP, using a three-plasmid system (Figure 4B, top) comprising (i) a plasmid carrying a gene for RNAP β’-subunit containing a nonsense codon (TAG) at position 1148 and a decahistidine coding sequence; (ii) a plasmid carrying genes for an engineered Bpa-specific UAG-suppressor tRNA and an engineered Bpa-specific aminoacyl-tRNA synthetase; and (iii) a pSC101-derived plasmid containing placCONS (copy number ~5; Cohen and Chang, 1977). We then grew cells in medium containing Bpa, UV irradiated cells, lysed cells, purified crosslinked material using immobilized metal-ion-affinity chromatography targeting the decahistidine tag on RNAP-β’ R1148Bpa, and mapped crosslinks using primer extension (Figure 4B, middle). In order to trap static initial-transcribing complexes containing 2- to 3-nt RNA products in vivo, despite the presence of all NTP substrates in vivo, we used a chemical biology approach, exploiting the RNAP inhibitor rifampin (Rif), which blocks extension of RNA products beyond a length of 2 to 3 nt (McClure and Cech, 1978). The results show matching crosslinking patterns in vitro and in vivo for the initial-transcription pause at promoter position +6 (Figure 4B).
The results in Figure 4 establish that RNAP-β’ R1148Bpa enables detection of the RNAP-active-center A-site position in actively-transcribing complexes. The results further establish that initial-transcription pausing at placCONS occurs in vivo, exhibits a similar promoter-position dependence in vivo as in vitro, and reveal the exact RNAP-active-center position in initial-transcription pausing at placCONS. In particular, the results show that the RNAP-active-center A-site during initial-transcription pausing at placCONS is located at promoter position +6 and thus, neglecting possible fractionally-translocated states, show that pausing occurs in either RPitc,5-post (Figure 4C, bottom left) or RPitc,6-pre (Figure 4C, bottom right).
The results in Figures 3 and S2 indicate that the paused complex contains a 6-nt RNA product. By combining results in Figure 4 defining the A-site position in the paused complex with results in Figures 3 and S2 defining the RNA-product length in the paused complex, we conclude that pausing occurs in RPitc,6 pre (Figure 4C, bottom right).
Promoter-position dependence of initial-transcription pausing for a library of 411 (~4,000,000) promoters in vivo
Having validated RNAP-β’ R1148Bpa as a reagent for detection of the RNAP-active-center A-site position in actively-transcribing complexes in vitro and in vivo, we next combined RNAP-β’ R1148Bpa with a library of placCONS derivatives (placCONS-N11; Figure 5A) containing all possible sequences from promoter positions +3 to +13 (411; ~4,000,000 sequences), to enable multiplexed analysis of initial-transcription pausing on all possible initial-transcribed region sequences in vivo. We used a three-plasmid system analogous to that used in the previous section but having representatives of the placCONS-N11 library of plasmids instead of the plasmid carrying placCONS. We UV irradiated cells, lysed cells, isolated crosslinked material, and mapped crosslinks using primer extension as in the previous section. We used the same chemical-biology approach, exploiting the fact that the RNAP inhibitor Rif prevents extension of RNA products beyond the length of ~4 nt, to trap static initial-transcribing complexes corresponding to RPitc,2, RPitc,3 and RPitc,4 (Figure 5B).
Figure 5.

Promoter-position dependence of initial-transcription pausing for a library of 411 (~4,000,000) promoters in vivo
(A) placCONS template library containing all possible sequences from promoter position +3 through +13 (placCONS-N11). These promoter positions encompass expected positions of crosslinking of RNAP-β’ R1148Bpa in initial transcription.
(B) Left, PAGE analysis of RNAP-active-center A-site positions in vivo. Right, histogram showing signals detected in absence (black line) or presence (grey line) of Rif. Markers, sequence ladder generated using placCONS-N11.
(C) Position of RNAP-active-center A-site (purple) and nucleotide crosslinked to Bpa (green) defined relative to the TSS position, +1.
See also Fig. S4.
To read out position-specific RNAP occupancies across the entire sampled initial-transcribed-region sequence space, we performed urea-PAGE of radiolabeled primer extension products (Figure 5B). In the presence of Rif, we see two major bands and a minor band across the sampled initial-transcribed-region sequence space at positions corresponding to RPitc,2; RPitc,3; and RPitc,4--i.e. when the A-site is at promoter positions +2, +3, or +4 (see Figure 1A)--exactly as above for the placCONS initial-transcribed-region sequence (compare Figure 5B, lane 5 with Figure 4B, lane 7). In the absence of Rif, we observe a series of additional bands corresponding to positions of initial-transcription pausing (Figure 5B, lane 6). The prominence of the additional bands indicates that initial-transcription pausing is a prominent feature of transcription across the entire sampled initial-transcribed-region sequence space. As compared to the experiments in the presence of Rif, in the absence of Rif, we observe higher levels of RNAP occupancy at positions corresponding to exactly 1, 2, 3, 4, 5, 6, and 7 RNAP-active-center translocation steps relative to RPitc,2-pre (i.e., when the A-site is at promoter positions +3, +4, +5, +6, +7, +8, and +9; Figure 5B,C). RNAP occupancy levels are highest at positions corresponding to 1 to 4 RNAP-active-center translocation steps (i.e., when the A-site is at promoter positions +3, +4, +5, and +6; Figure 5B,C) and are lower for the positions corresponding to 5, 6, or 7 RNAP-active-center translocation steps (i.e., when the A-site is at promoter positions +7, +8, and +9; Figure 5B,C). Similar results are observed in parallel experiments using a promoter library that randomizes 20 bp of the initial-transcribed region, from position +2 through +21 (Figure S4). We conclude that, across the sampled initial-transcribed-region sequence space, initial-transcription pausing occurs at a large fraction of promoters and can occur at each position in the initial-transcribed region, with highest levels for promoter positions +3 through +6.
Promoter-sequence determinants for initial-transcription pausing in a library of 411 (~4,000,000) promoters in vivo
To quantify the promoter-position dependence and define the promoter-sequence determinants for initial-transcription pausing, for the library of 411 (~4,000,000) initial-transcribed-region sequences, we performed the full XACT-seq protocol (Figure S5). We used the same three-plasmid system and the same procedure of UV irradiation, cell lysis, purification of crosslinked material, and primer extension as in the previous sections. We then used high-throughput sequencing of primer extension products to determine yields of crosslinks at positions +2 to +25, thus providing a measure of the total RNAP A-site occupancy at positions −3 to +20. We assigned sites of initial-transcription pausing as sites having >50% of the total RNAP A-site occupancy at a single position from +3 to +9. The results confirm and quantify the finding in the preceding section that a substantial fraction of promoter initial-transcribed-region sequences (~15%) show initial-transcription pausing (Table S1) and that pausing can occur when the A-site is at each promoter position from +3 through +9, with highest levels occurring when the A-site is at positions +3 through +7, and lower levels when the A-site is at positions +8 and +9 (Table S1).
To confirm that the pause sites detected by XACT-seq represent above-background transcription-dependent phenomena, we performed a parallel XACT-seq analysis in the presence of Rif, which blocks synthesis of RNA products greater than ~3- to 4-nt. This allows us, for pausing at positions +5, +6, +7, +8, and +9, to define, definitively, the number of sequences that are above-background transcription-dependent pausing (Table S1). Observed pauses detected for A-site positions +8 and +9 are low, but these numbers are bona-fide, above-background, transcription-dependent pausing (Table S1, column 3).
A global alignment of sequences showing the highest RNAP occupancies at positions +5, +6, +7, +8, and +9--aligning by the A-site position--yields a clear consensus sequence: TP-1NPYAGA+1, where Y is pyrimidine and YA is the position of the A-site (Figure 6A). A plot of RNAP occupancy as a function of initial-transcribed-region tetranucleotide sequence shows RNAP occupancy is strongly correlated with match to the consensus sequence (Figure 6B). Separate alignments of sequences showing the highest RNAP occupancy for each promoter position from +3 through +9, yield, in all cases, a consensus sequence resembling the global alignment (Figures 6C). At positions +6 and +7, the consensus sequence is especially strong (≥0.3 bits). At other positions the match to consensus is evident but the strength of the consensus is lower (≤ 0.3 bits). Plots of RNAP occupancy as a function of initial-transcribed-region sequence shows that RNAP occupancy strongly correlates with match to the consensus sequence for each position (Figure S6). We note that placCONS, the promoter previously shown to exhibit initial-transcription pausing at a position in the range +5 to +7 in vitro (Duchi et al., 2016; Lerner et al., 2016; Dulin et al., 2018), and shown here to exhibit initial transcription pausing when the RNAP-active center A-site is at position +6 in vitro and in vivo (Figure 4), contains a 3-of-3 match to the consensus sequence in the register that would yield initial transcription pausing at position +6 (compare Figure 4A and Figure 6A).
Representative individual initial-transcribed-region sequences showing initial-transcription pausing were analyzed individually, both in vitro and in vivo, and showed clear pausing at the expected positions in vitro and in vivo (Figures 6D–F and S7). The staircase pattern in Figure 6E (in vitro) and Figure S7C (in vivo) shows graphically that initial-transcription pausing can occur when the A-site is at each promoter position in the tested range.
Figure 6. Promoter-sequence determinants for initial-transcription pausing in a library of 411 (~4,000,000) promoters in vivo.

(A) Position-independent, global, consensus sequence for initial-transcription pausing for RNAP-active-center A-site positions +5, +6, +7, +8, and +9. Consensus nucleotides are in black.
(B) Percent occupancy at each initial-transcribed region tetranucleotide sequence for RNAP-active-center A-site positions +5, +6, +7, +8, and +9. Red, pink, cyan, and blue denote pause-site sequences with 3 of 3, 2 of 3, 1 of 3, and 0 of 3 matches to global consensus sequence, respectively. Mean ± SEM (n = 3).
(C) Position-specific consensus sequences for initial-transcription pausing for RNAP-active-center A-site positions +3, +4, +5, +6, +7, +8, and +9.
(D) Representative sequences yielding high RNAP occupancy at positions +5, +6, +7, +8, and +9. Colors as in Fig. 5C.
(E) RNAP-active-center A-site positions and crosslinking positions in vitro for sequences of D. Lanes 1–4, sequence markers; lanes 5–9, data for RNAP-β’ R1148Bpa; lanes 10–14, data for RNAP-β’ R1148Bpa containing σ finger deletion.
(F) RNAP-active-center A-site positions and crosslinking positions in vitro for sequences of D analyzed as pool. Histogram on right presents quantitation of RNAP occupancies at +5, +6, +7, +8 and +9, with data for RNAP-β’ R1148Bpa in red and data for RNAP-β’ R1148Bpa containing σ finger deletion in black. Ratios are means ± SD (n = 3).
We performed analogous experiments with individual initial-transcribed-region sequences using an RNAP holoenzyme derivative containing a deletion of the σ finger (Figure 6E,F). Qualitatively, the results for wild-type RNAP holoenzyme and the derivative containing the σ finger deletion were identical (Figure 6E,F), indicating that sequence, rather than position-dependent collision with the σ finger, is the crucial determinant for initial-transcription pausing. Quantitatively, however, we observe reductions in RNAP occupancies for the RNAP holoenzyme containing a deletion of the σ finger, relative to wild-type RNAP holoenzyme, for promoter positions +5 and +6, but not for promoter positions +7, +8 and +9 (Figure 6E,F). We infer that the σ finger contributes quantitatively to pausing when the A-site is at promoter positions +5 and +6, which are positions where collision of the RNA 5ʹ end and the σ finger potentially may occur (Murakami et al., 2002; Kulbachinskiy and Mustaev, 2006; Zhang et al., 2012; Basu et al., 2014; Pupov et al., 2014; Zuo and Steitz, 2015). Considering the results in Figure 6, as a whole, we conclude that sequence is the crucial determinant of initial-transcription pausing. We further conclude that sequence is the crucial determinant of initial-transcription pausing at each promoter position from position +3 to position +9, and that the consensus sequences for initial-transcription pausing is similar or identical at each position.
Relationship between sequence determinants for initial-transcription pausing and transcription-elongation pausing
Our results define the consensus sequence for initial-transcription pausing as: TP-1NPYAGA+1 (Figure 7A). This is both the global consensus sequence for initial-transcription pausing irrespective of position and, in most, and possibly all, cases the position-specific sequence for initial-transcription pausing at each initial-transcribed region position (Figure 6A–C).
Figure 7. Relationship between sequence determinants for initial-transcription pausing and transcription-elongation pausing.

(A) Consensus sequence for initial-transcription pausing. Positions are labeled relative to the RNAP-active-center A-site (purple box) and P-site.
(B) Consensus sequence for transcription-elongation pausing. Top, positions numbered relative to RNA 3’ end (pink box). Bottom, positions numbered relative to RNAP-active-center A-site (purple box) and P-site.
(C) Positions of consensus-sequence nucleotides in pre-translocated-state complexes in initial-transcription pausing (ITC-pre) and transcription-elongation pausing (TEC-pre). Grey boxes with white lettering, high-information-content DNA nucleotides of consensus sequence; grey boxes without white lettering; low-information-content nucleotides of consensus-sequence; pink boxes with white lettering, high-information-content RNA nucleotides of consensus sequence. Dotted rectangle, region enlarged in D. Other symbols and colors as in Fig. 1.
(D) Enlarged view, showing unfavorable interaction of RNAP β residue D446 with nontemplate-strand pyrimidine (Y) at A-site (crossed-out bracket labeled βD446).
(E) Positions of consensus-sequence nucleotides in post-translocated-state complexes in initial transcription pausing (ITC-post) and transcription-elongation pausing (TEC-post). Dotted rectangle, region enlarged in F.
(F) Enlarged view showing favorable interaction of RNAP β residue D446 with nontemplate-strand purine (R) at A-site (bracket labeled βD446).
Three groups previously have used NET-seq to define the consensus sequence for transcription-elongation pausing as: G−10N−9N−8N−7N−6N−5N−4N−3N−2Y−1G+1, where Y-1 is the position of the RNA 3ʹ end (Figure 7B, top; Larson et al., 2014; Vvedenskaya et al., 2014; Imashimizu et al., 2015). Mapping of TEC translocational state by analysis of pyrophosphorolysis kinetics (Vvedenskaya et al., 2014) and by cryo-EM structure determination (Guo et al., 2018; Kang et al., 2018; Vos et al., 2018) indicates that TECs paused at the consensus sequence element assume a pre-translocated or fractionally-translocated state. Accordingly, the consensus sequence for transcription-elongation pausing can be expressed as: GP−8NP−7NP−6NP−5NP−4NP−3NP−2NP−1NPYAGA+1, where YA is the position of the A-site (Figure 7B, bottom). The consensus sequence for transcription-elongation pausing, GP−8NP−7NP−6NP−5NP−4NP−3NP−2NP−1NPYAGA+1, comprises a highly conserved downstream segment, YAGA+1 (Larson et al., 2014; Vvedenskaya et al., 2014; Imashimizu et al., 2015). In the paused TEC, the GA+1:CA+1 nucleotide pair is located at the downstream end of the transcription bubble and must be broken for RNAP forward translocation, and the DNA-template-strand RA interacts with the RNAP active center (Figure 7C,E; Vvedenskaya et al., 2014; see also Saba et al., 2019); the identities of nucleotides at these positions affects RNAP-translocation behavior through sequence-dependent effects on DNA duplex thermal stability and sequence-dependent effects on interactions of the DNA template strand with the RNAP active center (Vvedenskaya et al., 2014). The consensus sequence element for transcription-elongation pausing also comprises a less-highly-conserved upstream segment, GP−8 (Larson et al., 2014; Vvedenskaya et al., 2014; Imashimizu et al., 2015). In the paused TEC, the GP−8:CP−8 RNA:DNA base pair is located at the upstream end of the RNA-DNA hybrid and must be broken for RNAP translocation (Figure 7C,E; Vvedenskaya et al., 2014); sequence at these positions affects RNAP-translocation behavior through effects on RNA-DNA duplex thermal stability (Vvedenskaya et al., 2014).
The consensus sequence for initial-transcription pausing defined in this work: TP−1NPYAGA+1 (Figure 7A), exhibits a striking resemblance to the downstream, most-highly-conserved portion of the consensus sequence for transcription-elongation pausing: YAGA+1 (Figure 7B, bottom). This resemblance extends both to the sequence and the position of the A-site relative to sequence. Consistent with the conclusion that the consensus sequence for initial-transcription pausing: TP−1NPYAGA+1, may be functionally related to the downstream, most-highly-conserved portion of the consensus sequence for transcription-elongation pausing, YAGA+1, the consensus sequence for initial-transcription pausing contains T at position P−2 (Figure 7A) and two groups defining the consensus sequence for transcription-elongation pausing identified T as the optimal nucleotide at the corresponding position (Larson et al., 2014; Imashimizu et al., 2015). The observation that the consensus sequence for initial-transcription pausing does not contain a sequence corresponding to the upstream, less-highly-conserved portion of the consensus sequence for elongation pausing, GP−8, is explained by the fact that ITCs contain short RNA products and short RNA:DNA hybrids that do not extend to this upstream position.
We suggest that the resemblance of the consensus sequence for initial-transcription pausing and the downstream portion of the consensus sequence for transcription-elongation pausing reflects a functional relationship. We infer that initial-transcription pausing and transcription-elongation pausing share mechanistic commonalities. Consistent with this proposal, substitution of the RNAP β-subunit residue 446 (βD446A), increases sequence-dependent pausing in both initial transcription (Figures 4A, S2 and 7D,F; Dulin et al., 2018) and transcription elongation (Vvedenskaya et al., 2014).
Discussion
XACT-seq provides a high-throughput, direct, single-nucleotide-resolution readout of the RNAP-active-center A-site position relative to DNA during transcription in living cells. Here, using the reagent that underpins XACT-seq, we (i) defined the RNAP-active-center A-site position at placCONS (Figure 4), (ii) demonstrated initial-transcription pausing occurs at a substantial fraction of promoter initial-transcribed-region sequences in vivo (Figures 5 and S4), (iii) showed that initial-transcription pausing can occur at each promoter position from +3 to +9 (Figures 5 and S4), (iv) and showed that the σ finger contributes quantitatively to pausing at promoter positions +5 and +6, presumably through collision with the RNA 5ʹ end (Figures 4 and 6E,F). Next, using XACT-seq and sampling a library of 411 (~4,000,000) promoter initial-transcribed-region sequences, we: (i) confirmed that initial-transcription pausing occurs in vivo (Figures 6 and S6; Table S1), (ii) confirmed and quantified that initial-transcription pausing occurs at a substantial fraction (~15%) of initial-transcribed-region sequences (Figure 6C; Table S1), (iii) confirmed and quantified that initial-transcription pausing can occur at each position in the initial-transcribed region (high prevalence for positions +3 to +7; lower prevalence for positions +8 and +9; Figure 6C; Table S1), (iv) showed that initial-transcription pausing is determined primarily by promoter sequence (Figures 6 and S6), (v) defined the consensus sequence for initial-transcription pausing as TP−1NPYAGA+1 (Figure 6A), and (vi) showed that the consensus sequence for initial-transcription pausing resembles the consensus sequence for transcription-elongation pausing, suggesting that initial-transcription pausing and transcription-elongation pausing share mechanistic commonalities (Figure 7). A major finding is that initial-transcription pausing and transcription-elongation pausing appear to be fundamentally similar, with the key mechanistic difference, a “scrunching” mechanism of RNAP-active-center translocation in the former vs. a “stepping” mechanism of RNAP-active-center translocation in the latter, having no detectable effect, and the key structural difference, the presence of the initiation factor σ in the former but not the latter, having only a quantitative, modulatory effect on initial-transcription pausing.
We applied XACT-seq to analysis of a library of 411 (~4,000,000) initial-transcribed region sequences. However, in principle, the sequence of other promoter regions also may impact pausing. Therefore, repeating XACT-seq with libraries containing randomized segments within other promoter regions potentially could reveal additional determinants of initial-transcription pausing. In addition, the in vivo experiments reported in this work were performed in the context of a plasmid-borne promoter. A priority for future work will be use XACT-seq to analyze pausing in the context of the bacterial chromosome.
In this report, we focused on results for initial-transcription pausing. However, the same experiments also provide information for pausing in subsequent stages of transcription, including pausing at the moment of promoter escape and formation of a TEC, promoter-proximal σ-dependent pausing by TECs, and sequence-dependent elongation pausing by TECs. The findings for these stages of transcription will be reported elsewhere.
We used the model bacterium E. coli to develop and first apply XACT-seq, but XACT-seq could be applied to organisms with more complex genomes. Bpa has previously been incorporated into RNAP subunits in yeast (Chen et al., 2007) and can be incorporated into proteins in mammalian cells (Hino et al., 2005). Methods for UV irradiation, DNA fragmentation, RNAP purification, and sequencing library preparation would be similar for each organism. A priority for future work will be to apply XACT-seq for analysis of RNAP-active-center A-site positions ex vivo on isolated DNA or chromatin, or in vivo, in living cells, providing a basis for “RNAP profiling” analogous to existing methods for ribosome profiling (Ingolia et al., 2009). Combining XACT-seq and NET-seq for genome-wide analysis of RNAP-active-center A-site positions and RNA 3ʹ-end positions, respectively, each with single-nucleotide resolution, should provide an unprecedently rich description of the sequence-dependent, factor-dependent transcriptional landscape.
STAR Methods
Resource Availability
Lead Contact
Further information and requests for resources and reagents should be directed to and will be fulfilled by the Lead Contact, Bryce Nickels (bnickels@waksman.rutgers.edu).
Materials Availability
This study did not generate new unique reagents.
Data and Code Availability
Original data for all replicates is available at https://data.mendeley.com/datasets/p5cscgdd5x. Unprocessed sequencing reads have been deposited in the NIH/NCBI Sequence Read Archive under the study accession number PRJNA615362. Source code and documentation for analysis of sequencing data are provided at https://github.com/NickelsLabRutgers/XACT-seq.
Experimental Model and Subject Details
For all in vivo crosslinking assays, Escherichia coli was grown at 37°C in LB broth containing 1 mM Bpa, 100 μg/ml carbenicillin, 50 μg/ml spectinomycin, 50 μg/ml streptomycin, and 25 μg/ml chloramphenicol. For plasmid maintenance and protein expression, Escherichia coli was grown at 37°C in LB broth supplemented with the appropriate antibiotic.
Method Details
Plasmids
To generate plasmid pIA900-βD446A RNAP-β’ R1148Bpa, we performed PCR using ~20 ng of pIA900-RNAP-β’ R1148Bpa (Winkelman et al., 2015) in 12.5 μl reactions containing 0.8 μM oligo JW44 and 1 X Phusion HF Master Mix (Thermo Fischer Scientific) (95°C for 2 min; 95°C for 15 s, 55°C for 15s, 72°C for 5 min; 30 cycles; 72°C for 6 min). Next, to remove the wild-type plasmid template, 20 units of DpnI (New England Biolabs) was added, the reactions was incubated at 37°C for 16 h,1 μl of the reaction was introduced into electrocompetent DH10B cells (Thermo Fischer Scientific), and cells plated on LB agar plates containing 100 μg/ml carbenicillin to select for transformants.
To generate plasmid pσ70Δ finger-His, we performed PCR using 4 ng of plasmid pσ70-His (Marr and Roberts, 1997) in 50 μl reactions containing 0.8 μM oligo JW268, 0.8 μM oligo JW269, and 1 X Phusion HF Master Mix (2 min at 95°C; 95°C for 15 s, 55°C for 15s, 72°C for 4 min (30 x); 2 min at 72°C). 30 units of DpnI was added, the reaction was incubated at 37°C for 16 h, and DNA was recovered using a PCR purification kit (Qiagen). The recovered DNA was treated with 10 units of T4 polynucleotide kinase (PNK) (New England Biolabs) in 1 X T4 PNK buffer containing 20 μM ATP for 30 min at 37°C, 400 units of T4 DNA ligase (New England Biolabs) was added, reactions were incubated at 16°C for 16 h, 1 μl of the reaction was introduced into electrocompetent DH10B cells, and cells plated on LB agar plates containing 50 μg/ml kanamycin, and recombinant plasmid DNA was isolated from individual transformants.
Plasmid pCDF-CP (Yu et al., 2017) contains a CloDF13 replication origin, a selectable marker conferring resistance to spectinomycin, and two BglI recognition sites that are used to introduce DNA fragments upstream of transcription terminator tR2. Plasmid pCDF-lacCONS (Yu et al., 2017) is a derivative of pCDF-CP containing sequences from positions −88 to +70 of placCONS inserted into BglI-digested pCDF-CP.
To generate plasmids pCDF-lacCONS-p5, -p6, -p7, -p8, and -p9, which contain the sequences between positions +3 and +13 shown in Figure 6D, we performed PCR using 1 ng of pCDF-lacCONS in 25 μl reactions containing 1 X Phusion HF Master Mix, 0.8 μM oligo JW80 and 0.8 μM oligo JW433, JW408, JW409, JW580, or JW575, respectively. 1 μl of this reaction was used as a template in PCR reactions (50 μl) containing 1 X Phusion HF Master Mix, 0.8 μM JW79, and 0.8 μM JW80. Amplicons were treated with BglI and BglI-digested fragments were ligated into BglI-digested pCDF-CP. The ligation mixture was transformed into NEB 5-alpha competent cells (New England Biolabs), cells plated on LB agar plates containing 50 μg/ml spectinomycin, and recombinant plasmid DNA was isolated from individual transformants.
Plasmid-borne promoter libraries placCONS-N11 and placCONS-N20 were generated using a procedure described in (Vvedenskaya et al., 2015; Vvedenskaya et al., 2018b) that provides a “self-assembling barcode,” in which for each DNA molecule in the library a first randomized sequence in a region of interest is associated with a known corresponding second randomized sequence that serves as a barcode. The procedure involves synthesis of three oligos for use in PCR. One oligo, which serves as the template for PCR amplification, contains a first randomized sequence spanning the region of interest and a second randomized sequence that serves as a barcode. The other oligos serve as amplification primers. One of these oligos contains 5’-end sequences that introduce a BglI recognition sequence and the other oligo contains 3’-end sequences complementary to the template oligo. Libraries placCONS-N11, containing up to 411 initial-transcribed region sequences from position +3 to position +13, was constructed using oligo JW153 as the template and oligos s1219 and s1220 as amplification primers. Library placCONS-N20, containing up to 420 initial-transcribed region sequences from position +2 to position +21, was constructed using oligo JW203 as the template and oligos s1219 and s1220 as amplification primers. Amplicons were treated with BglI and BglI-digested fragments were ligated into BglI-digested pCDF-CP. The ligation mixture was transformed into NEB 5-alpha competent cells, cells plated on LB agar plates containing 50 μg/ml spectinomycin, and recombinant plasmid DNA was isolated from ~107 transformants.
Plasmid pEVOL-pBpF contains genes directing the synthesis of an engineered Bpa-specific UAG-suppressor tRNA and an engineered Bpa-specific aminoacyl-tRNA synthetase that charges the amber suppressor tRNA with Bpa (Addgene; Chin et al., 2002).
Proteins
Wild-type RNAP core enzyme was prepared from E. coli strain NiCo21(DE3) (New England Biolabs) containing plasmid pIA900 (Artsimovitch et al., 2003) using procedures described in (Winkelman et al., 2015).
Bpa-containing RNAP core enzyme derivatives RNAP-β’ R1148Bpa and βD446A RNAP-β’ R1148Bpa were prepared from E. coli strain NiCo21(DE3) (New England Biolabs) containing plasmid pEVOL-pBpF and plasmid pIA900-RNAP-β’ R1148Bpa (Winkelman et al., 2015) or plasmid pIA900-βD446A RNAP-β’ R1148Bpa, using procedures described in (Winkelman et al., 2015).
Wild-type σ70 or a σ70 derivative containing a deletion of the σ finger (residues 513–519), were prepared from E. coli strain NiCo21(DE3) containing plasmid pσ70-His (gift of J. Roberts; Marr and Roberts, 1997) or plasmid pσ70-His Δ finger using procedures described in (Marr and Roberts, 1997). To form RNAP holoenzyme, 1 μM RNAP core enzyme and 5 μM wild-type σ70 or Δ finger σ70 in 10 mM Tris-Cl (pH 8.0), 100 mM KCl, 10 mM MgCl2, 0.1 mM EDTA, 1 mM DTT, and 50% glycerol were incubated for 30 min at 25°C. GreB was purified using procedures described in (Borukhov et al., 1993).
Oligonucleotides
Oligodeoxyribonucleotides (Table S2) were purchased from IDT. Diribonucleotides ApA and ApU (HPLC-purified) were purchased from TriLink Biotechnologies.
Templates for in vitro assays
Linear DNA templates used for in vitro assays in Figures 3B, 4, S2, and S3A contain sequences from positions −88 to +70 of placCONS. Templates used for in vitro assays in Figures 6E,F and S7 contain sequences from positions −88 to +70 of placCONS-p5, placCONS-p6, placCONS-p7, placCONS-p8, or placCONS-p9. Templates were generated by PCR in reactions containing 1 X Phusion HF Master Mix, 0.8 μM primer JW61, 0.8 μM primer JW62, and ~1 pg of plasmids placCONS-p5, -p6, -p7, -p8, or -p9. Reaction products were purified using a PCR purification kit. The linear DNA template used for in vitro transcription assays in Figure 3A contained sequences from positions −93 to +9 of the T7A1 promoter, a T-less tract from +10 to +29, a T at +30, followed by a 35-bp sequence containing the yrbL consensus pause sequence (Vvedenskaya et al., 2014). This template was generated by PCR in reactions containing 1 X Phusion HF Master Mix, 0.8 μM primer JB49, 0.8 μM primer JB105, and ~1 pg of plasmid pIA171 (Artsimovitch and Landick, 2000).
In vitro transcription assays: transcription-elongation pausing
40 nM of the T7A1-yrbL DNA template was mixed with 150 nM RNAP holoenzyme in 1X RB and incubated at 37°C for 5 minutes to form open complexes. Complexes were stalled at position +29 by addition of 100 μM ApU, 2.5 μM ATP, 2.5 μM CTP [cold CTP + 5 μCi 32P-α-CTP (Perkin Elmer; 3000 Ci/mmol)], 1 μM GTP and incubation at 37°C for 15 minutes. NTPs and heparin were then added to final concentrations of: 200 μM ATP, 200 μM UTP, 200 μM CTP, 10 μM GTP and 40 μg/ml heparin. Aliquots were taken before addition of UTP, and 15, 30, 45, 60, and 120 seconds after addition of UTP and mixed with an equal volume of 2 X RNA loading dye. Samples were heated at 95°C for 1 min, cooled to room temperature, and run on 12% TBE-Urea polyacrylamide gels (UreaGel system, National Diagnostics). Autoradiography of gels was performed as above. Pause-capture efficiency was calculated as described in (Landick et al., 1996). Values of pause-capture efficiency reported in Figure 3A are means ± SD of three independent experiments.
In vitro transcription assays: initial-transcription pausing
For reactions in Figures 3B and S2A, 8 μl reactions containing 4 nM of the lacCONS DNA template, 20 nM RNAP holoenzyme, 100 μM ApA, 1X RB, and 100 nM GreB (where indicated) were incubated for 2 min at 25°C. For reactions halted at position +7 (Figure 3B, left), 2 uL of 50 μM UTP and 50 μM GTP (final concentration of 10 μM UTP, and 10 μM GTP [cold GTP + 5 μCi 32P-α-GTP (Perkin Elmer; 3000 Ci/mmol)]) were added. For reactions halted at position +11, 2 uL of 50 μM ATP, 50 μM UTP and 50 μM GTP (final concentration of 10 μM ATP, 10 μM UTP, and 10 μM GTP [cold GTP + 5 μCi 32P-α-GTP (Perkin Elmer; 3000 Ci/mmol)]) were added. After addition of NTPs, reactions were incubated for 5 min at 25°C, and 10 μl of 2 X RNA loading dye was added. Samples were heated at 95°C for 1 min, cooled to room temperature, and run on 20% TBE-Urea polyacrylamide gels (UreaGel system, National Diagnostics). Autoradiography of gels was performed as above. The intensity of the 6- and 11-nt RNA products were used to calculate the percentage of the total RNA products that were 6 nt using the formula: % 6-nt RNA = 100 x ((6-nt RNA/ (6-nt RNA + 11-nt RNA)). Values reported in Figures 3B, right and S2B are means ± SD of three independent experiments.
Determination of RNAP-active-center A-site positions by protein-DNA photo-crosslinking in vitro
In vitro photo-crosslinking and crosslink mapping experiments were done using procedures described in (Yu et al., 2017). For the experiments in Figure 4A,B, 50 μl reactions containing 20 nM RNAP holoenzyme, 4 nM template, 100 μM ApA dinucleotide (where indicated), and 1 X RB [10 mM Tris-Cl, pH 8.0, 70 mM NaCl, 10 mM MgCl2, and 0.1 mg/ml bovine serum albumin (BSA)] were incubated for 5 min at 25°C, 5 uL of 100 μM ATP, 100 μM CTP, 100 μM GTP, and 100 μM UTP (final concentration of 10 μM ATP, 10 μM CTP, 10 μM GTP, and 10 μM UTP) were added (where indicated), reactions were incubated 2 min at 25°C, and subjected to UV irradiation for 2 min at 25°C in a Rayonet RPR-100 photochemical reactor equipped with 16 × 350 nm tubes (Southern New England Ultraviolet). For the experiments in Figure 6E, 50 μl reactions containing 20 nM RNAP holoenzyme, 4 nM template, and 1 X RB were incubated for 5 min at 25°C, 5 uL of 1 mM ATP, 1 mM CTP, 1 mM GTP, and 1 mM UTP were added, reactions were incubated 2 min at 25°C, and subjected to UV irradiation for 2 min at 25°C. For the experiments in Figure 6F, 50 μl reactions containing 50 nM RNAP holoenzyme, 20 nM template (4 nM of placCONS-p5, -p6, -p7, -p8, and -p9), and 1 X RB were incubated for 5 min at 25°C, 5 μL of 1 mM ATP, 1 mM CTP, 1 mM GTP, and 1 mM UTP was added, reactions were incubated 2 min at 25°C, and subjected to UV irradiation for 2 min at 25°C.
To denature RNAP-DNA complexes, reactions were mixed with 15 μl 5 M NaCl and 6 μl 100 μg/ml heparin, incubated for 5 min at 95°C and then cooled to 4°C. Crosslinked RNAP-DNA complexes were isolated by adding 20 μl MagneHis Ni-particles (Promega) equilibrated and suspended in 1 X Taq DNA polymerase buffer, 10 μg/ml heparin, and 0.1 mg/ml BSA; MagneHis Ni-particles were collected using a magnetic microfuge tube rack; particles were washed with 1 X Taq DNA polymerase buffer, 10 μg/ml heparin, and 0.1 mg/ml BSA, washed twice with 50 μl 1 X Taq DNA polymerase buffer (New England Biolabs), and particles (which contained bound RNAP-DNA complexes) were resuspended in 10 μl 1 X Taq DNA polymerase buffer. Primer extension reactions (12.5 μl) were performed by combining 2 μl of the recovered RNAP-DNA complexes, 1 μl of 1 μM 32P-5’-end-labeled primer JW61 [200 Bq/fmol; prepared using [γ32P]-ATP (PerkinElmer) and T4 polynucleotide kinase (New England Biolabs) as described in (Sambrook et al., 2006)], 1 μl 10 X dNTPs (2.5 mM dATP, 2.5 mM dCTP, 2.5 mM dGTP, 2.5 mM dTTP, 0.25 μl 5 U/μl Taq DNA polymerase (New England Biolabs), 5 μl 5 M betaine, 0.625 μl 100% dimethyl sulfoxide, and 1.25 μl 10 X Taq DNA polymerase buffer; 40 cycles of 30 s at 95°C, 30 s at 55°C, and 30 s at 72°C. Reactions were stopped by addition of 12.5 μl 1 X TBE, 8 M urea, 0.025% xylene cyanol, and 0.025% bromophenol blue; radiolabeled products were separated by electrophoresis on 10% 8M urea slab gels (equilibrated and run in 1 X TBE) and visualized by storage-phosphor imaging (Typhoon 9400 variable-mode imager; GE Life Science). Positions of RNAP-DNA crosslinking were determined by comparison to products of a DNA-nucleotide sequencing reaction generated using oligo JW61 and a linear DNA template containing sequences from positions −88 to +70 of placCONS (Thermo Sequenase Cycle Sequencing Kit; Affymetrix).
For the experiment in Figure 4, values of %XL+11 were calculated using the formula: %XL+11 = ((XL+11/ (XL+7 + XL+11)), where XL+7 and XL+11 correspond to the intensity of the bands at positions +7 and +11, respectively. The values of %XL+11, which are reported in Figure S2B, are means ± SD of three independent experiments.
Histogram of band intensities shown in Figures 5B, 6F, and S4B represent the means ± SD of three independent experiments.
Determination of RNAP-active-center A-site positions by protein-DNA photo-crosslinking in vivo
In vivo photo-crosslinking and crosslink mapping experiments of Figures 4B, 5B, and S7 were done essentially as described in (Yu et al., 2017) except the RNAP active site was not mutationally inactivated. Analysis of RNAP-active-center A-site positions in vivo for placCONS transcription complexes was performed by sequential introduction of plasmid pCDF-lacCONS, plasmid pIA900-RNAP-β’ R1148Bpa, and plasmid pEVOL-pBpF into E. coli strain NiCo21(DE3) by transformation. After the final transformation step, cells were plated on LB agar containing 100 μg/ml carbenicillin, 50 μg/ml spectinomycin, 50 μg/ml streptomycin, and 25 μg/ml chloramphenicol; at least 1,000 individual colonies were scraped from the plate, combined, and used to inoculate 250 ml LB broth containing 1 mM Bpa (Bachem), 100 μg/ml carbenicillin, 50 μg/ml spectinomycin, 50 μg/ml streptomycin, and 25 μg/ml chloramphenicol in a 1000 ml flask (Bellco) to yield OD600 = 0.3; the culture was placed in the dark and shaken (220 rpm) for 1 h at 37°C; isopropyl-β-D-thiogalactoside (IPTG) was added to 1 mM; and the culture was placed in the dark and shaken (220 rpm) for 3 h at 37°C.
Analysis of RNAP-active-center A-site positions in vivo for placCONS-N11 and placCONS-N20 transcription complexes was performed by sequential introduction into E. coli strain NiCo21(DE3) of the pCDF-lacCONS-N11 library (yielding ~2 million transformants) or the placCONS-N20 library (yielding ~2 million transformants), plasmid pIA900-RNAP-β’ R1148Bpa (yielding ~15 million transformants), and plasmid pEVOL-pBpF (yielding ~4 million transformants). After the final transformation step, cells were plated on ~10–15 LB agar plates containing 100 μg/ml carbenicillin, 50 μg/ml spectinomycin, 50 μg/ml streptomycin, and 25 μg/ml chloramphenicol to yield a lawn. Colonies were scraped from the surface of the plates, combined, and used to inoculate 250 ml LB broth containing 1 mM Bpa, 100 μg/ml carbenicillin, 50 μg/ml spectinomycin, 50 μg/ml streptomycin, and 25 μg/ml chloramphenicol in a 1000 ml flask to yield OD600 = 0.3; the culture was placed in the dark and shaken (220 rpm) for 1 h at 37°C; IPTG was added to 1 mM; and the culture was placed in the dark and shaken (220 rpm) for 3 h at 37°C. To measure background signal, a portion of the cell cultures containing pCDF-lacCONS, pCDF-lacCONS-N11, or pCDF-lacCONS-N20 were removed, rifampin was added to a final concentration of 200 μg/ml, and the culture was shaken for 10 min prior to UV irradiation.
Cell suspensions (9 ml) were removed from each culture to a 13 mm x 100 mm borosilicate glass test tube (VWR) and subjected to UV irradiation for 20 min at 25°C. Cells were collected by centrifugation (3000 x g; 15 min at 4°C) and cell pellets were stored at −20°C. To lyse cells, the frozen cell pellets were incubated at 4°C for 30 min, re-suspended in 40 ml of 50 mM Na2HPO4 (pH 8.0), 1.4 M NaCl, 20 mM imidazole, 14 mM β-mercaptoethanol, 0.1% Tween 20, and 5% ethanol containing 2 mg egg white lysozyme, and sonicated for 5 min at 4°C. Lysates were centrifuged (23,000 x g; 30 min at 4°C), supernatants were added to 1 ml Ni-NTA-agarose (Qiagen) in 50 mM Na2HPO4 (pH 8.0), 1.4 M NaCl, 20 mM imidazole, 0.1% Tween 20, 5 mM β-mercaptoethanol, and 5% ethanol, and the mixture was incubated 30 min at 4°C with gentle rocking. The slurry was loaded into a 15 ml polyprep column (BioRad) to collect the Ni-NTA-agarose resin. The resin was washed with 10 ml of 1 X WB (50 mM Na2HPO4, pH 8.0, 300 mM NaCl, 30 mM imidazole, 0.1% Tween 20, 5 mM β-mercaptoethanol, and 5% ethanol) and His-tagged RNAP was eluted from the resin with 3 ml of 1 X WB containing 300 mM imidazole. The eluate was concentrated to 0.2 ml in 20 mM Tris-Cl (pH 8.0), 200 mM KCl, 20 mM MgCl2, 0.2 mM EDTA, and 1 mM DTT using a 100K MWCO Amicon Ultra-4 centrifugal filter (EMD Millipore), 0.2 ml glycerol was added, and the sample was stored at −20°C.
To denature RNAP-DNA complexes, 25 μl of the concentrated eluate was mixed with 25 μl water, 15 μl 5 M NaCl, and 6 μl 100 μg/ml heparin, incubated at 95°C for 5 min, then incubated at 4°C for 5 min. Crosslinked RNAP-DNA complexes were isolated by adding 20 μl MagneHis Ni-particles equilibrated and suspended in 1 X Taq DNA polymerase buffer, 10 μg/ml heparin, and 0.1 mg/ml BSA; MagneHis Ni-particles were collected using a magnetic microfuge tube rack; particles were washed with 50 μl 10 mM Tris-Cl, pH 8.0, 1.2 M NaCl, 10 mM MgCl2, 10 μg/ml heparin, and 0.1 mg/ml BSA, washed twice with 50 μl 1 X Taq DNA polymerase buffer (New England Biolabs), and the particles (which contained bound RNAP-DNA complexes) were resuspended in 10 μl 1 X Taq DNA polymerase buffer. Primer extension reactions and analysis of radiolabeled products generated in these reactions were performed using procedures identical to those used in the analysis of placCONS in vitro (see above) using material isolated from cells containing pCDF-lacCONS (Figure 4B), cells containing the pCDF-lacCONS-N11 library (Figure 5B), or cells containing the pCDF-lacCONS-N20 library (Figure S4). XACT-seq experiments (see below) were performed using denatured RNAP-DNA complexes isolated from cells containing the pCDF-lacCONS-N11 library.
XACT-seq: primer extension
Primer extension reactions (50 μl) were performed by combining 8 μl of recovered RNAP-DNA complexes, 1 μl of 1 μM primer s128a, 5 μl 10 X dNTPs (2.5 mM dATP, 2.5 mM dCTP, 2.5 mM dGTP, 2.5 mM dTTP, 1 μl 5 U/μl Taq DNA polymerase, 20 μl 5 M betaine, 2.5 μl 100% dimethyl sulfoxide, and 5 μl 10 X Taq DNA polymerase buffer, and cycling 40 times through 30 s at 95°C, 30 s at 55°C, and 30 s at 72°C. Primer extension products were isolated by ethanol precipitation, washed twice with 80% cold ethanol, resuspended in 20 μl water, and mixed with 20 μl of 2 X RNA loading dye (95% deionized formamide, 18 mM EDTA, 0.25% SDS, xylene cyanol, bromophenol blue, amaranth).
Primer extension products were separated by electrophoresis on 10% 7M urea slab gels (equilibrated and run in 1 X TBE). The gel was stained with SYBR Gold nucleic acid gel stain (Life Technologies) and ssDNA products ~35- to ~75-nt in size were excised from the gel. To elute nucleic acids from the gel, the gel fragment was crushed as described in (Vvedenskaya et al., 2018a), 350 μl of 0.3 M NaCl in 1 X TE buffer was added, the mixture was incubated for 10 min at 70°C, and the supernatant was collected using a Spin-X column (Corning). The elution procedure was repeated, supernatants were combined, and nucleic acids were recovered by ethanol precipitation, washed twice with 80% cold ethanol, and resuspended in 5 μl of nuclease-free water.
XACT-seq: 3′-adapter ligation and library amplification
The recovered primer extension products (5 μl) were combined with 1 μl 10 X NEB buffer 1, ~0.8 μM 3′-adapter oligo s1248 [5′ adenylated and 3′-end blocked oligo containing ten randomized nucleotides (10N) at the 5′ end], 5 mM MnCl2 and 1 μM of 5′-AppDNA/RNA ligase (New England Biolabs) in a final volume of 10 μl. The mixture was incubated for 1 h at 65°C followed by 3 min at 90°C, and cooled to 4°C for 5 min. The reaction was combined with 15 μl of mixture containing 10 U of T4 RNA ligase 1 (New England Biolabs), 1 X T4 RNA ligase 1 reaction buffer, 12% PEG 8000, 10 mM DTT, 60 μg/mL BSA. Reactions were incubated at 16°C for 16 h.
Adapter-ligated products were separated by electrophoresis on 10% 7M urea slab gels (equilibrated and run in 1 X TBE). The gel was stained with SYBR Gold nucleic acid gel stain and species ranging from ~60 to ~100-nt (for reactions containing oligo s1248 and primer extension products) or ~50 and 90 nt (for reactions containing oligo s1248 and oligo JW402) were isolated by gel excision. The gel fragment was crushed, 700 μl of 0.3M NaCl in 1 X TE buffer was added, the mixture was incubated for 2 h at 37°C, the supernatant was collected using a Spin-X column (Corning). The elution procedure was repeated, supernatants were combined, and nucleic acids were recovered by ethanol precipitation, washed twice with 80% cold ethanol, and resuspended in 13 μl of nuclease-free water.
Adapter-ligated DNA (5 μl) were used as template in emulsion PCR (ePCR). Reactions contained 1 X Detergent-free Phusion HF reaction buffer containing 5 μg/ml BSA, 0.4 mM dNTPs, 0.5 μM Illumina RP1 primer, 0.5 μM Illumina index primer and 0.04 U/μl Phusion HF polymerase [95°C for 10 s, 95°C for 5 s, 60°C for 5 s, 72°C for 15 seconds (20 cycles), 72°C for 5 min]. Amplicons were recovered using a Micellula DNA Emulsion and Purification Kit. The emulsion was broken, DNA was purified according to the manufacturer’s recommendations, recovered by ethanol precipitation, and resuspended in 20 μl of nuclease-free water. Reaction products were separated by electrophoresis on a non-denaturing 10% slab gel (equilibrated and run in 1 X TBE), and amplicons between ~160 bp and ~170 bp were isolated by gel excision. The gel fragment was crushed, 600 μl of 0.3M NaCl in 1 X TE buffer was added, the mixture was incubated for 2 h at 37°C, the supernatant was collected using a Spin-X column. The elution procedure was repeated, supernatants were combined, and nucleic acids were recovered by ethanol precipitation, washed twice with 80% cold ethanol, and resuspended in 20 μl of nuclease-free water.
Libraries generated by this procedure are: CP21/CP21D, CP23/CP23D, CP27/CP27C, CP22/CP22D, CP24/CP24D, and CP28/CP28C (where “/” indicates libraries that are technical replicates). Libraries CP21/CP21D, CP23/CP23D, and CP27/CP27C are generated from material isolated from cells not treated with rifampin. Libraries CP22/CP22D, CP24/CP24D, and CP28/CP28C are generated from material isolated from cells treated with rifampin. Each library was analyzed by HTS using an Illumina NextSeq with custom sequencing primer s1115. Results were used to define the RNAP occupancy at each position from −3 to +20 on each promoter sequence as described below.
XACT-seq: analysis of template sequences in the placCONS-N11 library
We performed ePCR reactions with ~109 molecules of the placCONS-N11 plasmid library, 1 X Detergent-free Phusion HF reaction buffer, 5 μg/ml BSA, 0.4 mM dNTPs, 0.5 μM Illumina RP1 primer, 0.5 μM Illumina index primer and 0.04 U/μl Phusion HF polymerase [95°C for 10 s, 95°C for 5 s, 60°C for 5 s, 72°C for 15 seconds (20 cycles), 72°C for 5 min]. Amplicons were recovered using a Micellula DNA Emulsion and Purification Kit. The emulsion was broken, DNA was purified according to the manufacturer’s recommendations, recovered by ethanol precipitation, and resuspended in 20 μl of nuclease-free water. Products were subjected to electrophoresis on a non-denaturing 10% slab gel (equilibrated and run in 1 X TBE), the 204 bp fragment was excised from the gel. The gel fragment was crushed, 600 μl of 0.3M NaCl in 1 X TE buffer was added, the mixture was incubated for 2 h at 37°C, the supernatant was collected using a Spin-X column. The elution procedure was repeated, supernatants were combined, and nucleic acids were recovered by ethanol precipitation, washed twice with 80% cold ethanol, and resuspended in 20 μl of nuclease-free water. The library generated by this procedure, CP26T, was analyzed by HTS using an Illumina NextSeq with custom sequencing primer s1115. Results were used to identify barcodes associated with each initial-transcribed region sequences in the placCONS-N11 library (see below).
XACT-seq: data analysis
We selected sequencing reads in sample CP26T that matched sequences from positions −39 to +2 and from positions +14 to +31 of placCONS-N11 (aggcttgacactttatgcttcggctcgtataatgtgtggaannnnnnnnnnngataacaatttcaacaatnnnnnnnnnnnnnnnnntggaattctcgggtgccaagg; −35 element and −10 element are in bold; randomized sequences in the initial-transcribed region, +3 to +13, and in the barcode region, +32 to +48, are underlined). From this subset of reads, we identified barcodes associated with each initial-transcribed region sequence using procedures described in (Winkelman et al., 2016b). Barcode sequences were used to identify initial-transcribed region sequences associated with primer extension products in libraries CP21/CP21D, CP23/CP23D, CP27/CP27C, CP22/CP22D, CP24/CP24D, and CP28/CP28C. The 3′-end sequence of each primer extension product was used to identify positions of RNAP-DNA crosslinking and corresponding RNAP active-center A-site positions located 5 nt upstream. Next, we calculated the read count corresponding to crosslinks at each position (X) from +2 to +25 (RCX) and the total number of reads derived from crosslinks at all positions from +2 to +25 (RCtotal). The percent occupancy for each RNAP active-center A-site position from −3 to +20 was calculated using the formula: 100 x (RCX/ RCtotal), where X is the position 5 nt downstream of the A site.
Table S1, column 1 shows the total number of template sequences where % occupancy at positions +3, +4, +5, +6, +7, +8, or +9 is ≥ 50% in at least 2 of 3 replicates. Values of above-background pausing in Tables S1, column 3 were calculated by eliminating pause sites where % occupancy at positions +5, +6, +7, +8, or +9 is ≥ 10%. The sequence logo shown in Figure 6A was generated using nontemplate-strand sequences for templates with RCtotal ≥ 10 having % occupancy values in the top 0.1% for promoter positions +5, +6, +7, +8, and +9. The sequence logos shown in Figure 6C were generated using templates with RCtotal ≥ 10 having % occupancy values in the top 0.1% for promoter positions +3, +4, +5, +6, +7, +8, or +9. Each sequence logo was generated from 480 out of 480,000 sequences for which RCtotal ≥ 10; information content was adjusted to account for the sequence composition of the background (Dey et al., 2018).
The plot shown in Figure 6B depicts mean % occupancy for nontemplate-strand tetranucleotide sequences at RNAP active-center positions P−1, P, A, and A+1 for promoter position +5, +6, +7, +8, and +9. Plots shows the mean and SEM calculated from three biological replicates. The plots shown in Figure S6 depict mean % occupancy for nontemplate-strand dinucleotide sequences at RNAP active-center positions A and A+1 for promoter positions +3 or +4 or for nontemplate-strand tetranucleotide sequences at RNAP active-center positions P−1, P, A, and A+1 for promoter positions +5, +6, +7, +8, or +9.
Quantification and Statistical Analysis
Statistical details of experiments including the number of replicates (n) and dispersion and precision measures can be found in the figure legends and Method Details.
Supplementary Material
KEY RESOURCES TABLE.
| REAGENT or RESOURCE | SOURCE | IDENTIFIER |
|---|---|---|
| Bacterial and Virus Strains | ||
| NiCo21(DE3) | NEB | C2529H |
| ElectroMax DH10B-T1R electrocompetent cells | Thermo Fisher | 1521050 |
| Chemicals, Peptides, and Recombinant Proteins | ||
| Nuclease-free water (not DEPC-treated) | Thermo Fisher | AM9932 |
| H-Bpa-OH | Bachem | F-2800 |
| Bacto agar | VWR | 90000–760 |
| Bacto tryptone | VWR | 90000–286 |
| Bacto yeast extract | VWR | 90000–726 |
| L-Arabinose | Calbiochem | 178680 |
| IPTG | Gold Biotech | I2481C50 |
| Chloramphenicol | Gold Biotech | C-105–25 |
| Spectinomycin | Gold Biotech | S0188–25 |
| Streptomycin | Fisher Scientific | 15140122 |
| Carbenicillin | Gold Biotech | C-103–25 |
| Rifampicin | Gold Biotech | R-120–25 |
| SOC Outgrowth Medium | NEB | B9020S |
| dNTP solution mix, 10 mM of each NTP | NEB | N0447S |
| NTP set (ultra-pure), 100 mM solutions | GE Healthcare | 27–2025-01 |
| Tris base (Amresco) | VWR | 97061–800 |
| Boric Acid (ACS grade) | VWR | 97061–980 |
| EDTA disodium salt dyhydrate | VWR | 97061–018 |
| 0.5 M EDTA pH 8 | Thermo Fisher | AM9260G |
| Sodium Chloride | EMD Milipore | SX0420–3 |
| Sodium hydroxide | VWR | BDH0292–500G |
| Potassium Chloride | EMD Milipore | 7300–500GM |
| Sodium Acetate, trihydrate | VWR | MK736406 |
| β-mercaptoethanol | Omnipur | 60–24-2 |
| Lysozyme | VWR | EM-5980 |
| Formamide, deionized | VWR | EM-4610 |
| Sodium dodecylsulfate (SDS) | VWR | 97064–470 |
| Magnesium chloride hexahydrate | VWR | EM-5980 |
| Glycerol (ACS grade) | VWR | EMGX0185–5 |
| Bovine Serum Albumin (BSA) fraction V | VWR | 101174–932 |
| Betaine Solution | VWR | 101375–612 |
| Bromophenol Blue | VWR | EM-BX1410–7 |
| Xylene Cyanol | Sigma-Aldrich | X4126–10G |
| Amaranth Dye | VWR | 200030–400 |
| Temed (JT Baker) | VWR | JT4098–1 |
| Ammonium Persulfate | VWR | 97064–594 |
| Dithiothreitol (DTT) | Gold Bio | DTT50 |
| Glycogen from Oyster (type II) | Sigma-Aldrich | G8751 |
| Hydrochloric Acid (ACS plus) | Fisher Scientific | A144–212 |
| Ethyl Alcohol | Pharmco-AAPER | 111000200 |
| Isopropyl Alcohol | BDH | BDH1133–1LP |
| DMSO | VWR | EM-2951 |
| Heparin sulfate | Sigma-Aldrich | H-3393 |
| GeneMate LE Quick Dissolve agarose | BioExpress | E-3119–500 |
| SequaGel sequencing system | National Diagnostics | EC833 |
| 10% TBE-Urea gels, 1mm x 10 wells | Thermo Fisher | EC6875Box |
| 10% TBE gels, 1mm x 10 wells | Thermo Fisher | EC6275Box |
| alpha-32P CTP EasyTide 250 uCi | Perkin Elmer | BLU508H250UC |
| alpha-32P GTP EasyTide 250 uCi | Perkin Elmer | BLU506H250UC |
| alpha-32P UTP EasyTide 250 uCi | Perkin Elmer | BLU507H250UC |
| Gamma-32P ATP EasyTide 250 uCi | Perkin Elmer | BLU502Z001MC |
| Low Range ssRNA Ladder | NEB | N0364S |
| O’Gene Ruler Ultra Low Range DNA Ladder | Thermo Fisher | SM1223 |
| 6X Orange DNA Loading Dye | Thermo Fisher | R0631 |
| SYBR Gold nucleic acid gel stain | Thermo Fisher | S11494 |
| B-Per Bacterial Extraction Reagent | Thermo Fisher | 78248 |
| Amicon Ultra-4 100K MWCO | Fisher Scientific | UFC810024 |
| Acid phenol:chloroform (CHCl3) pH 4.5 | Thermo Fisher | AM9720 |
| Ni-NTA agarose | Qiagen | 30230 |
| MagneHis Ni-Particles | Promega | V8560 |
| DNase I | Zymo Research | E1009A |
| T4 RNA Ligase 1 (ssRNA Ligase) | NEB | M0204L |
| 5’ App DNA/RNA ligase | NEB | M0319S |
| T4 Polynucleotide Kinase (PNK) | NEB | M0201S |
| Superscript III Reverse Transcriptase | Thermo Fisher | 18080–044 |
| RNAse H | Thermo Fisher | AM2293 |
| Phusion HF Master Mix | Thermo Fisher | F-548L |
| Taq DNA polymerase | NEB | M0273 |
| 5X Detergent-free Phusion HF Buffer Pack | NEB | B0520S |
| Phusion Flash HF master mix | Thermo Fisher | F-548L |
| E. coli RNA polymerase core (β'-10xHis) | (Artsimovitch et al., 2003) | N/A |
| E. coli σ70-6xHis | (Marr and Roberts, 1997) | N/A |
| Critical Commercial Assays | ||
| Sequenase Cycle Sequencing Kit | Thermo Fisher | 785001KT |
| QIAprep Spin Miniprep Kit | Qiagen | 27106 |
| Qubit dsDNA HS assay kit | Thermo Fisher | Q32851 |
| Qubit ssDNA Assay kit | Thermo Fisher | Q10212 |
| Micellula DNA Emulsion PCR Kit | Chimerx | 3600–02 |
| QIAquick PCR purification kit | Qiagen | 28104 |
| Deposited Data | ||
| High throughput sequencing data | NIH Sequence Read Archive | study accession number: PRJNA615362 |
| Experimental Models: Organisms/Strains | ||
| NiCo21(DE3) | NEB | C2529H |
| Oligonucleotides | ||
| DNA/RNA Oligos listed in Oligonucleotides table | Integrated DNA Technologies (IDT) | N/A |
| ApA | Trilink | N/A |
| ApU | Trilink | N/A |
| Recombinant DNA | ||
| pIA900 | Gift of I. Artsimovitch | N/A |
| pIA900-RNAP-β' R1148Bpa | (Winkelman et al., 2015) | N/A |
| pIA900-βD446A RNAP-β' R1148Bpa | This work | N/A |
| pσ70-His | Gift of J. Roberts | N/A |
| pσ70Δ finger-His | This work | N/A |
| pMASTER-lacCONS-N11 | This work | N/A |
| pMASTER-lacCONS-N20 | This work | N/A |
| pCDF-CP | (Yu et al., 2017) | N/A |
| pEVOL-pBpF | (Chin et al., 2002) | N/A |
| pCDF-lacCONS | (Yu et al., 2017) | N/A |
| pCDF-lacCONS-p5 | This work | N/A |
| pCDF-lacCONS-p6 | This work | N/A |
| pCDF-lacCONS-p7 | This work | N/A |
| pCDF-lacCONS-p8 | This work | N/A |
| pCDF-lacCONS-p9 | This work | N/A |
| pIA171 | (Artsimovitch et al., 2000) | N/A |
| Software and Algorithms | ||
| Excel | Microsoft | 2011 |
| ImageQuant | GE Healthcare | TL 5.1 |
| SigmaPlot | Systat Software Inc. | Ver. 10 |
| XACT-seq | This work | https://github.com/NickelsLabRutgers/XACT-seq |
| R programming language | R Core Team | http://www.R-project.org/ |
| ggplot2 | (Wickham, 2009) | http://www.springer.com/us/book/9780387981413 |
| dplyr | (Wickham and Francois, 2016) | https://CRAN.R-project.org/package=dplyr |
| Pymol | Schrodinger, LLC | http://www.pymol.org |
| Illustrator | Adobe | Ver. CS6 |
| Other | ||
| Molecular Dynamics PhosphorImager | GE Healthcare | Typhoon 9400 |
| Illumina high-throughput sequencing (NextSeq) | Waksman Genomics Core Facility, Rutgers University | N/A |
Highlights.
XACT-seq detects RNA polymerase active-center position relative to DNA
Initial-transcription pausing at 411 (~4,000,000) promoters was quantitated
Consensus sequence element for initial-transcription pausing was identified
Initial-transcription pausing and elongation pausing share mechanistic commonalities
Acknowledgements
Work was supported by NIH grants GM124976 (PS), GM041376 (RHE), and GM118059 (BEN). JTW was supported by a fellowship from the Helen Hay Whitney Foundation.
Footnotes
Declaration of Interests
The authors declare no competing interests.
Publisher's Disclaimer: This is a PDF file of an unedited manuscript that has been accepted for publication. As a service to our customers we are providing this early version of the manuscript. The manuscript will undergo copyediting, typesetting, and review of the resulting proof before it is published in its final form. Please note that during the production process errors may be discovered which could affect the content, and all legal disclaimers that apply to the journal pertain.
References
- Abbondanzieri EA, Greenleaf WJ, Shaevitz JW, Landick R, and Block SM (2005). Direct observation of base-pair stepping by RNA polymerase. Nature 438, 460–465. [DOI] [PMC free article] [PubMed] [Google Scholar]
- Artsimovitch I, and Landick R (2000). Pausing by bacterial RNA polymerase is mediated by mechanistically distinct classes of signals. Proc Natl Acad Sci USA 97, 7090–7095. [DOI] [PMC free article] [PubMed] [Google Scholar]
- Artsimovitch I, Svetlov V, Murakami KS, and Landick R (2003). Co-overexpression of Escherichia coli RNA polymerase subunits allows isolation and analysis of mutant enzymes lacking lineage-specific sequence insertions. J Biol Chem 278, 12344–12355. [DOI] [PubMed] [Google Scholar]
- Barski A, Cuddapah S, Cui K, Roh TY, Schones DE, Wang Z, Wei G, Chepelev I, and Zhao K (2007). High-resolution profiling of histone methylations in the human genome. Cell 129, 823–837. [DOI] [PubMed] [Google Scholar]
- Basu RS, Warner BA, Molodtsov V, Pupov D, Esyunina D, Fernandez-Tornero C, Kulbachinskiy A, and Murakami KS (2014). Structural basis of transcription initiation by bacterial RNA polymerase holoenzyme. J Biol Chem 289, 24549–24559. [DOI] [PMC free article] [PubMed] [Google Scholar]
- Belogurov GA, and Artsimovitch I (2019). The Mechanisms of Substrate Selection, Catalysis, and Translocation by the Elongating RNA Polymerase. Journal of Molecular Biology [DOI] [PMC free article] [PubMed] [Google Scholar]
- Borukhov S, Sagitov V, and Goldfarb A (1993). Transcript cleavage factors from E. coli. Cell 72, 459–466. [DOI] [PubMed] [Google Scholar]
- Chen HT, Warfield L, and Hahn S (2007). The positions of TFIIF and TFIIE in the RNA polymerase II transcription preinitiation complex. Nat Struct Mol Biol 14, 696–703. [DOI] [PMC free article] [PubMed] [Google Scholar]
- Chin JW, Martin AB, King DS, Wang L, and Schultz PG (2002). Addition of a photocrosslinking amino acid to the genetic code of Escherichia coli. Proc Natl Acad Sci U S A 99, 11020–11024. [DOI] [PMC free article] [PubMed] [Google Scholar]
- Churchman LS, and Weissman JS (2011). Nascent transcript sequencing visualizes transcription at nucleotide resolution. Nature 469, 368–373. [DOI] [PMC free article] [PubMed] [Google Scholar]
- Churchman LS, and Weissman JS (2012). Native elongating transcript sequencing (NET-seq). Current Protocols in Molecular Biology Chapter 4, Unit 4 14 11–17. [DOI] [PubMed] [Google Scholar]
- Cohen SN, and Chang AC (1977). Revised interpretation of the origin of the pSC101 plasmid. J Bacteriol 132, 734–737. [DOI] [PMC free article] [PubMed] [Google Scholar]
- Dey KK, Xie D, and Stephens M (2018). A new sequence logo plot to highlight enrichment and depletion.” BMC Bioinfomatics, 19:473. [DOI] [PMC free article] [PubMed] [Google Scholar]
- Duchi D, Bauer DL, Fernandez L, Evans G, Robb N, Hwang LC, Gryte K, Tomescu A, Zawadzki P, Morichaud Z, et al. (2016). RNA Polymerase Pausing during Initial Transcription. Mol Cell 63, 939–950. [DOI] [PMC free article] [PubMed] [Google Scholar]
- Dulin D, Bauer DL, Malinen AM, Bakermans JJ, Kaller M, Morichaud Z, Petushkov I, Depken M, Brodolin K, and Kulbachinskiy A (2018). Pausing controls branching between productive and non-productive pathways during initial transcription in bacteria. Nature Communications 9, 1478. [DOI] [PMC free article] [PubMed] [Google Scholar]
- Erie DA, Yager TD, and von Hippel PH (1992). The single-nucleotide addition cycle in transcription: a biophysical and biochemical perspective. Annu Rev Biophys Biomol Struct 21, 379–415. [DOI] [PubMed] [Google Scholar]
- Fish RN, and Kane CM (2002). Promoting elongation with transcript cleavage stimulatory factors. Biochim Biophys Acta 1577, 287–307. [DOI] [PubMed] [Google Scholar]
- Guo X, Myasnikov AG, Chen J, Crucifix C, Papai G, Takacs M, Schultz P, and Weixlbaumer A (2018). Structural Basis for NusA Stabilized Transcriptional Pausing. Mol Cell 69, 816–827 e814. [DOI] [PMC free article] [PubMed] [Google Scholar]
- Herbert KM, La Porta A, Wong BJ, Mooney RA, Neuman KC, Landick R, and Block SM (2006). Sequence-resolved detection of pausing by single RNA polymerase molecules. Cell 125, 1083–1094. [DOI] [PMC free article] [PubMed] [Google Scholar]
- Hino N, Okazaki Y, Kobayashi T, Hayashi A, Sakamoto K, and Yokoyama S (2005). Protein photo-cross-linking in mammalian cells by site-specific incorporation of a photoreactive amino acid. Nat Methods 2, 201–206. [DOI] [PubMed] [Google Scholar]
- Imashimizu M, Takahashi H, Oshima T, McIntosh C, Bubunenko M, Court DL, and Kashlev M (2015). Visualizing translocation dynamics and nascent transcript errors in paused RNA polymerases in vivo. Genome Biology 16, 98. [DOI] [PMC free article] [PubMed] [Google Scholar]
- Ingolia NT, Ghaemmaghami S, Newman JR, and Weissman JS (2009). Genome-wide analysis in vivo of translation with nucleotide resolution using ribosome profiling. Science 324, 218–223. [DOI] [PMC free article] [PubMed] [Google Scholar]
- Kang JY, Mishanina TV, Bellecourt MJ, Mooney RA, Darst SA, and Landick R (2018). RNA Polymerase Accommodates a Pause RNA Hairpin by Global Conformational Rearrangements that Prolong Pausing. Mol Cell 69, 802–815 e805. [DOI] [PMC free article] [PubMed] [Google Scholar]
- Kang JY, Mishanina TV, Landick R, and Darst SA (2019). Mechanisms of Transcriptional Pausing in Bacteria. J Mol Biol. 431, 4007–4029. [DOI] [PMC free article] [PubMed] [Google Scholar]
- Kapanidis AN, Margeat E, Ho SO, Kortkhonjia E, Weiss S, and Ebright RH (2006). Initial transcription by RNA polymerase proceeds through a DNA-scrunching mechanism. Science 314, 1144–1147. [DOI] [PMC free article] [PubMed] [Google Scholar]
- Kulbachinskiy A, and Mustaev A (2006). Region 3.2 of the σ subunit contributes to the binding of the 3′-initiating nucleotide in the RNA polymerase active center and facilitates promoter clearance during initiation. J Biol Chem 281, 18273–18276. [DOI] [PubMed] [Google Scholar]
- Landick R, Wang D, and Chan CL (1996). Quantitative analysis of transcriptional pausing by Escherichia coli RNA polymerase: his leader pause site as paradigm. Methods Enzymol 274, 334–353. [DOI] [PubMed] [Google Scholar]
- Larson MH, Landick R, and Block SM (2011). Single-molecule studies of RNA polymerase: one singular sensation, every little step it takes. Mol Cell 41, 249–262. [DOI] [PMC free article] [PubMed] [Google Scholar]
- Larson MH, Mooney RA, Peters JM, Windgassen T, Nayak D, Gross CA, Block SM, Greenleaf WJ, Landick R, and Weissman JS (2014). A pause sequence enriched at translation start sites drives transcription dynamics in vivo. Science 344, 1042–1047. [DOI] [PMC free article] [PubMed] [Google Scholar]
- Latif H, Federowicz S, Ebrahim A, Tarasova J, Szubin R, Utrilla J, Zengler K, and Palsson BO (2018). ChIP-exo interrogation of Crp, DNA, and RNAP holoenzyme interactions. PLoS One 13, e0197272. [DOI] [PMC free article] [PubMed] [Google Scholar]
- Lerner E, Chung S, Allen BL, Wang S, Lee J, Lu SW, Grimaud LW, Ingargiola A, Michalet X, Alhadid Y, et al. (2016). Backtracked and paused transcription initiation intermediate of Escherichia coli RNA polymerase. Proc Natl Acad Sci U S A 113, E6562–E6571. [DOI] [PMC free article] [PubMed] [Google Scholar]
- Margeat E, Kapanidis AN, Tinnefeld P, Wang Y, Mukhopadhyay J, Ebright RH, and Weiss S (2006). Direct observation of abortive initiation and promoter escape within single immobilized transcription complexes. Biophysical Journal 90, 1419–1431. [DOI] [PMC free article] [PubMed] [Google Scholar]
- Marr MT, and Roberts JW (1997). Promoter recognition as measured by binding of polymerase to nontemplate strand oligonucleotide. Science 276, 1258–1260. [DOI] [PubMed] [Google Scholar]
- Mazumder A, and Kapanidis AN (2019). Recent Advances in Understanding σ70-Dependent Transcription Initiation Mechanisms. J Mol Biol. 431, 3947–3959. [DOI] [PMC free article] [PubMed] [Google Scholar]
- McClure WR, and Cech CL (1978). On the mechanism of rifampicin inhibition of RNA synthesis. J Biol Chem 253, 8949–8956. [PubMed] [Google Scholar]
- Mooney RA, Darst SA, and Landick R (2005). Sigma and RNA polymerase: an on-again, off-again relationship? Mol Cell 20, 335–345. [DOI] [PubMed] [Google Scholar]
- Murakami KS, Masuda S, and Darst SA (2002). Structural basis of transcription initiation: RNA polymerase holoenzyme at 4 Å resolution. Science 296, 1280–1284. [DOI] [PubMed] [Google Scholar]
- Pupov D, Kuzin I, Bass I, and Kulbachinskiy A (2014). Distinct functions of the RNA polymerase σ subunit region 3.2 in RNA priming and promoter escape. Nucleic Acids Research 42, 4494–4504. [DOI] [PMC free article] [PubMed] [Google Scholar]
- Revyakin A, Liu C, Ebright RH, and Strick TR (2006). Abortive initiation and productive initiation by RNA polymerase involve DNA scrunching. Science 314, 1139–1143. [DOI] [PMC free article] [PubMed] [Google Scholar]
- Rhee HS, and Pugh BF (2012). Genome-wide structure and organization of eukaryotic pre-initiation complexes. Nature 483, 295–301. [DOI] [PMC free article] [PubMed] [Google Scholar]
- Ruff EF, Record MT Jr., and Artsimovitch I (2015). Initial events in bacterial transcription initiation. Biomolecules 5, 1035–1062. [DOI] [PMC free article] [PubMed] [Google Scholar]
- Saba J, Chua XY, Mishanina TV, Nayak D, Windgassen TA, Mooney RA, and Landick R (2019). The elemental mechanism of transcriptional pausing. Elife 8, e40981. [DOI] [PMC free article] [PubMed] [Google Scholar]
- Sambrook J, Russell D.e., and Sambrook J (2006). The condensed protocols from molecular cloning: a laboratory manual. NY: Cold Spring Harbor Laboratory Press [Google Scholar]
- Severinov K, Fenyö D, Severinova E, Mustaev A, Chait BT, Goldfarb A, and Darst SA (1994). The sigma subunit conserved region 3 is part of the “5’-face” of the active center of Escherichia coli RNA polymerase. J Biol Chem 269, 20826–20828. [PubMed] [Google Scholar]
- Srivastava DB, Leon K, Osmundson J, Garner AL, Weiss LA, Westblade LF, Glickman MS, Landick R, Darst SA, Stallings CL, et al. (2013). Structure and function of CarD, an essential mycobacterial transcription factor. Proc Natl Acad Sci U S A 110, 12619–12624. [DOI] [PMC free article] [PubMed] [Google Scholar]
- Vos SM, Farnung L, Urlaub H, and Cramer P (2018). Structure of paused transcription complex Pol II-DSIF-NELF. Nature 560, 601–606. [DOI] [PMC free article] [PubMed] [Google Scholar]
- Vvedenskaya IO, Bird JG, Zhang Y, Zhang Y, Jiao X, Barvik I, Krasny L, Kiledjian M, Taylor DM, Ebright RH, et al. (2018a). CapZyme-Seq Comprehensively Defines Promoter-Sequence Determinants for RNA 5’ Capping with NAD. Mol Cell 70, 553–564 e559. [DOI] [PMC free article] [PubMed] [Google Scholar]
- Vvedenskaya IO, Goldman SR, and Nickels BE (2018b). Analysis of Bacterial Transcription by “Massively Systematic Transcript End Readout,” MASTER. Methods in Enzymology 612, 269–302. [DOI] [PMC free article] [PubMed] [Google Scholar]
- Vvedenskaya IO, Vahedian-Movahed H, Bird JG, Knoblauch JG, Goldman SR, Zhang Y, Ebright RH, and Nickels BE (2014). Interactions between RNA polymerase and the “core recognition element” counteract pausing. Science 344, 1285–1289. [DOI] [PMC free article] [PubMed] [Google Scholar]
- Vvedenskaya IO, Zhang Y, Goldman SR, Valenti A, Visone V, Taylor DM, Ebright RH, and Nickels BE (2015). Massively Systematic Transcript End Readout, “MASTER”: Transcription Start Site Selection, Transcriptional Slippage, and Transcript Yields. Mol Cell 60, 953–965. [DOI] [PMC free article] [PubMed] [Google Scholar]
- Winkelman JT, Chandrangsu P, Ross W, and Gourse RL (2016a). Open complex scrunching before nucleotide addition accounts for the unusual transcription start site of E. coli ribosomal RNA promoters. Proc Natl Acad Sci U S A 113, E1787–E1795. [DOI] [PMC free article] [PubMed] [Google Scholar]
- Winkelman JT, Nickels BE, and Ebright RH (2019). The transition from transcription initiation to transcription elongation: start-site selection, initial transcription, and promoter escape In RNA Polymerase as a Molecular Motor, Second Edition, Landick R, Wang J, and Strick T, eds. (Cambridge, UK: RSC Publishing; ). [Google Scholar]
- Winkelman JT, Vvedenskaya IO, Zhang Y, Zhang Y, Bird JG, Taylor DM, Gourse RL, Ebright RH, and Nickels BE (2016b). Multiplexed protein-DNA cross-linking: Scrunching in transcription start site selection. Science 351, 1090–1093. [DOI] [PMC free article] [PubMed] [Google Scholar]
- Winkelman JT, Winkelman BT, Boyce J, Maloney MF, Chen AY, Ross W, and Gourse RL (2015). Crosslink Mapping at Amino Acid-Base Resolution Reveals the Path of Scrunched DNA in Initial Transcribing Complexes. Mol Cell 59, 768–780. [DOI] [PMC free article] [PubMed] [Google Scholar]
- Yu L, Winkelman JT, Pukhrambam C, Strick TR, Nickels BE, and Ebright RH (2017). The mechanism of variability in transcription start site selection. eLife 6, e32038. [DOI] [PMC free article] [PubMed] [Google Scholar]
- Zhang LR, and Landick R (2009). Substrate loading, nucleotide addition, and translocation by RNA polymerase In RNA Polymerases as Molecular Motors, Buc H, and Strick S, eds. (London, UK: Royal Society of Chemistry; ). [Google Scholar]
- Zhang Y, Feng Y, Chatterjee S, Tuske S, Ho MX, Arnold E, and Ebright RH (2012). Structural basis of transcription initiation. Science 338, 1076–1080. [DOI] [PMC free article] [PubMed] [Google Scholar]
- Zuo Y, and Steitz TA (2015). Crystal structures of the E. coli transcription initiation complexes with a complete bubble. Mol Cell 58, 534–540. [DOI] [PMC free article] [PubMed] [Google Scholar]
Associated Data
This section collects any data citations, data availability statements, or supplementary materials included in this article.
Supplementary Materials
Data Availability Statement
Original data for all replicates is available at https://data.mendeley.com/datasets/p5cscgdd5x. Unprocessed sequencing reads have been deposited in the NIH/NCBI Sequence Read Archive under the study accession number PRJNA615362. Source code and documentation for analysis of sequencing data are provided at https://github.com/NickelsLabRutgers/XACT-seq.