

SUMMARY
Cancer cells without mitochondrial DNA (mtDNA) do not form tumors unless they reconstitute oxidative phosphorylation (OXPHOS) by mitochondria acquired from host stroma. To understand why functional respiration is crucial for tumorigenesis, we used time-resolved analysis of tumor formation by mtDNA-depleted cells and genetic manipulations of OXPHOS. We show that pyrimidine biosynthesis dependent on respiration-linked dihydroorotate dehydrogenase (DHODH) is required to overcome cell-cycle arrest, while mitochondrial ATP generation is dispensable for tumorigenesis. Latent DHODH in mtDNA-deficient cells is fully activated with restoration of complex III/IV activity and coenzyme Q redox-cycling after mitochondrial transfer, or by introduction of an alternative oxidase. Further, deletion of DHODH interferes with tumor formation in cells with fully functional OXPHOS, while disruption of mitochondrial ATP synthase has little effect. Our results show that DHODH-driven pyrimidine biosynthesis is an essential pathway linking respiration to tumorigenesis, pointing to inhibitors of DHODH as potential anti-cancer agents.
Graphical Abstract
In Brief
Cancer cells without mitochondrial DNA (mtDNA) do not form tumors unless they can highjack host mitochondria. Bajzikova et al. show that the acquired mitochondrial electron transport is necessary to drive de novo pyrimidine synthesis to overcome cell-cycle arrest. Surprisingly, ATP generation is dispensable for tumorigenesis in this context.
INTRODUCTION
Mitochondria are vital organelles for most eukaryotic cells (Karnkowska et al., 2016). They carry their own DNA (mtDNA) and are involved in a number of essential processes. The signature feature of mitochondria is oxidative phosphorylation (OXPHOS), responsible for respiration and ATP formation. Respiration is performed by four respiratory complexes (RCs; i.e., CI-IV) that associate into supercomplexes (SCs) and generate a proton gradient across the inner mitochondrial membrane (IMM) that is used by ATP synthase (CV) to produce ATP (Acin-Perez et al., 2008; Althoff et al., 2011; Moreno-Lastres et al., 2012; Gu et al., 2016; Letts et al., 2016; Wu et al., 2016). Respiration also drives biosynthetic pathways directly or via the tricarboxylic acid cycle (Bezawork-Geleta et al., 2018).
Essential protein subunits of OXPHOS complexes are encoded by nuclear DNA and mtDNA. Therefore, when mtDNA is absent or damaged, OXPHOS is severely compromised (Brandon et al., 2006; Wallace, 2012). Recently we showed that cancer cells deficient in OXPHOS due to mtDNA depletion (ρ0 cells) cannot form tumors unless they acquire functional mtDNA from host stroma (Tan et al., 2015) by transfer of whole mitochondria (Dong et al., 2017). Other researchers support our findings (Osswald et al., 2015; Lei and Spradling, 2016; Moschoi et al., 2016; Strakova et al., 2016). These observations suggest that functional OXPHOS is essential for tumorigenesis, a concept consistent with other reports (LeBleu et al., 2014; Viale et al., 2014). Furthermore, they conform to the notion that the Warburg effect is associated with altered biosynthetic needs of cancer cells rather than with cancer-linked mitochondrial damage (Vander Heiden et al., 2009; Vander Heiden and DeBerardinis, 2017).
However, important questions remain unresolved. Foremost, it is unclear which aspect of OXPHOS activity is limiting for tumor growth. ATP production is the best known function of OXPHOS, but proliferating cells also require respiration for its oxidizing power and to produce aspartate for pyrimidine biosynthesis (Birsoy et al., 2015; Sullivan et al., 2015; Titov et al., 2016). Further, OXPHOS directly drives the respiration-coupled mitochondrial enzyme dihydroorotate dehydrogenase (DHODH) that converts dihydroorotate (DHO) to orotate in the de novo pyrimidine synthesis pathway (Loffler et al., 2005).
Here we analyzed temporal events preceding tumor formation in ρ0 cancer cells in the context of horizontal transfer of mtDNA in vivo and linked this to genetic manipulations of the OXPHOS system. Our results indicate that a key event facilitating tumor growth upon respiration recovery is reactivation of DHODH-driven pyrimidine synthesis.
RESULTS
mtDNA Is Replenished and Respiration Recovers Prior to Tumor Formation
Mouse breast cancer 4T1 ρ0 cells form tumors with a 3-week lag compared with parental cells, with palpable tumors appearing on day 20–25 (Figures 1A and S1A). To understand the sequence of events leading to tumor growth, 4T1 ρ0 cells (referred to as day 0, D0 cells) were grafted into BALB/c mice, tissue at the injection site was excised at various time points post injection (Figures 1B and 1C) and cancer cells were selected using 6-thioguanine (6TG) (Aslakson and Miller, 1992). Individual lines established in medium supplemented with pyruvate/uridine were stable over a long time in culture, maintaining their mtDNA status and growth properties. Analysis of the lines for respiration revealed its recovery prior to tumor formation (Figure 1D), pointing to an association between respiration recovery and tumor growth.
Figure 1. mtDNA Is Replenished and Respiration Recovers Early in Tumor Formation by 4T1ρ° Cells.

(A) BALB/c mice (n = 6) were grafted subcutaneously (s.c.) with 4T1 or 4T1 ρ° cells at 106 per animal, and tumor volume was assessed by ultrasound imaging (USI) (n = 6).
(B and C) Time schedule of retrieval of pre-tumor plaques and tumors from BALB/c mice is shown in (B), as indicated in (C) for D5 tissue.
(D) Individual lines retrieved from mice according to the schedule in (B) were assessed for uncoupled (ETC), routine, and leak respiration using the Oxygraph (n = 3).
(E) Cell lines were evaluated for the presence of mtDNA using probes against a polymorphism in either 4T1 or host 16S rRNA by sc/qPCR; 92 cells per line were assessed.
(F) Distribution of mtDNA polymorphism in 16S rRNA of individual cells of lines plotted using data presented in (E).
(G) mTRIP assay in the presence of proteinase K was used to detect the mtDNA initiation of replication marker (mREP) and global mitochondrial transcripts (mTRANS) unmasked from proteins, in single cells (n = 3; 100 cells were assessed per condition).
(H) Cell lines were assessed for binding of TFAM and POLG1 to the D LOOP region of mtDNA using a mitoChIP assay (n = 3).
(I) Individual lines were probed for the level of mtDNA-processing proteins using WB.
(J–L) qRT-PCR was used to assess the level of transcripts of selected subunits of mitochondrially encoded transcripts of RCs (n = 3) (J). Selected subunits of mitochondrial RCs were evaluated using WB in individual lines (K), which were then assessed by NBGE for the assembly of RCs and SCs using antibodies to relevant subunits, as shown (L).
Data in (A), (D), (G), (H), and (J) are mean values ± SD. Representative images of three biological replicates are shown for (I), (K), and (L).
We next assessed the mtDNA content in the lines using single-cell PCR (sc/qPCR) and probes that discriminate between the 16S rRNA polymorphism of host cells and that of 4T1 cells (Bayona-Bafaluy et al., 2003; Tan et al., 2015). We observed a progressive increase in the homoplasmic mtDNA of host origin in D5–D15 cells as well as absence of 4T1 mtDNA polymorphism in these cells (Figure 1E). The distribution profile of mtDNA was normalized in D15 cells (Figure 1F). The relative mtDNA copy number was verified by qPCR (Figure S1B), and the host origin of homoplasmic polymorphism was confirmed by DNA sequencing (Table S1).
To test whether the acquired mtDNA was functional, we assessed replication (mREP) and transcription (mTRANS) of mtDNA in single cells by the mTRIP method (Chatre and Ricchetti, 2013). Figure 1G shows relatively high mREP and mTRANS signal already in D5 cells. We also set up a specific mitochondrial “chromatin” immunoprecipitation (mitoChIP) assay that revealed a gradual increase in mtDNA binding of mitochondrial transcription factor TFAM and DNA polymerase-γ (POLG). The binding was very low in D5 cells, increased in D10 cells, and normalized in D15 and D20 cells. The protein levels of TFAM, POLG, and the mitochondrial single strand-binding protein (mtSSB) fully recovered in D15 cells that contain substantial mtDNA (Figure S1C and S1I).
Transcripts of mitochondrial genes encoding subunits of RCs were detectable in D5 cells and approached parental values in D15–D20 cells (Figures 1J and S1D). Protein subunits of RCs recovered in D15 cells (Figure 1K), where also fully assembled RCs and SCs appeared, and a switch from sub-CV to CV occurred (Figure 1L). Finally, we assessed the lines for mitochondrial morphology by transmission electron microscopy (TEM) (Figure S2) and for the presence of mitochondrial nucleoids using stimulated emission depletion (STED) (Figure S3). TEM detected mitochondria with cristae in D15 cells, consistent with the link between cristae formation and respiration (Cogliati et al., 2013), while STED microscopy revealed high numbers of TFAM-containing nucleoids in D15 cell mitochondria (Kukat et al., 2015).
In conclusion, mtDNA is acquired and amplified, and OXHPOS machinery is reconstituted in ρ0 cancer cells during the long dormant period prior to tumor appearance.
Mitochondrial Function and Bioenergetics Are Normalized Early in Tumorigenesis and Are Unrelated to ATP Generated by OXPHOS
We investigated whether replenishment of mtDNA/reconstitution of OXPHOS components are reflected by normalization of the mitochondrial function. Figure 2A shows that mitochondrial membrane potential (ΔΨm,i), low in D0 to D10 cells, increased in D15 cells to parental cell level. Similarly, mitochondrial superoxide increased in D15 cells (Figure 2B), consistent with active electron transport through assembled RCs/SCs.
Figure 2. Mitochondrial Function and Bioenergetics Are Normalized Early in 4T1ρ° Cell Tumorigenesis and Are Unrelated to OXPHOS-Generated ATP.

(A–C) Individual lines derived from 4T1ρ° cells were assessed for ΔΨm,i using TMRE in the absence and presence of the uncoupler FCCP (A), for generation of mitochondrial superoxide using MitoSOX in the absence and presence of antimycin A (AntiA) (B), and for basal respiration using a Seahorse XF96 (C).
(D) NADH/NAD+ ratio was assessed in cell lines using a luminescence kit.
(E) Two-photon microscopy was used to visualize the level of mitochondrial NAD(P)H in individual lines.
(F) Cell lines were assessed for glycolytic reserve using a Seahorse XF96.
(G) Individual lines were evaluated for ATP levels in the absence and presence of 50 mM 2DG at 4.5 g/L glucose and 1 mM pyruvate, and the results were expressed relative to total ATP in parental cells.
(H) The lines as shown were assessed for the ATP/ADP ratio using liquid chromatography-mass spectrometry.
(I) Parental and ρ° cells and two clones of ATP5BKO cells were probed for the level of ATP5B using WB.
(J–L) Parental, ρ°, and ATP5BKO cells were assessed by NBGE for assembly of RCs and SCs (J). Parental, ρ°, and ATP5BKO cells were tested for the level of ATP at 4.5 g/L glucose in the absence or presence of 50 mM 2DG (K) and for the ATP/ADP ratio (L).
(M) BALB/c mice were injected s.c. with 106 cells per animal, and tumor volume was quantified by USI.
(N) Cell lines derived on day 20 from tumors grown from parental, ρ°, and ATP5BKO 4T1 cells were assessed for ATP as described in (G). The insert documents the level of ATP5B protein in the tumor-derived cell lines; 1, parental; 2, ρ°; 3, ATP5BKO7 cells.
Data in (A)–(D), (F)–(H), and (K)–(M) are mean values ± SD (n = 3); those in (M) are mean values ± SED (n = 5). The symbol “*” in (A)–(D), (F)–(H), (K), and (N) indicates statistically significant differences from parental cells; in (M), statistically significant differences from tumors grown from ρ° cells; and in (L), statistically different from tumors grown from parental cells, with p < 0.05. (E), (I), (J), and (N) (insert) show representative images of three biological replicates.
We next assessed the bioenergetics of D0–D60 lines, evaluating their basal respiration. Figure 2C shows little or no respiration in D0–D10 cells, with an increase to 50%–60% of the parental cell values in D15 cells and normalization in D20 cells. This was similar for CI- and CII-dependent respiration (Figure S4A), with reserve respiratory capacity absent in D0–D10 cells (Figure S4B). Compromised respiration was confirmed by increased NADH/NAD+ ratio in D0–D15 cells evaluated by a luminescence kit (Figure 2D) and elevated mitochondrial NAD(P)H assessed by two-photon microscopy (Figures 2E and S4C). D0–D10 cells had no glycolytic reserve (Figure 2F), consistent with increased lactate production and glucose uptake compensating for the loss of OXPHOS-derived ATP (Figure S4D and S4E). Indeed, we found that glycolysis contributed to ATP generation by ≈30% in parental and 90% in D0–D10 cells (Figure 2G). Total ATP was comparable in all cell lines and the ATP/ADP ratio was not reduced in respiration-deficient cells, suggesting that ATP availability is not the limiting factor (Figure 2H).
To test directly whether the onset of tumor formation is dissociated from ATP generation by OXPHOS, we prepared cells that cannot assemble CV by knocking out ATP5B (Figure 2I). Native blue gel electrophoresis (NBGE) followed by western blotting (WB) revealed that ATP5BKO cells failed to assemble CV (Figure 2J), with other RCs/SCs also decreased. ATP5BKO cells predominantly used glycolysis for ATP formation, their ATP content was comparable to that of parental cells (Figure 2K), and the ATP/ADP ratio was maintained (Figure 2L). When grafted into BALB/c mice, ATP5BKO cells produced tumors somewhat slower than parental cells, but significantly faster than 4T1ρ0 cells (Figure 2M). To exclude the possibility that ATP5BKO-derived tumors “acquire” ATP synthase and re-establish OXPHOS-dependent ATP production, we assessed ATP5B expression and ATP levels in lines isolated from tumors grown from 4T1, 4T1 ρ0, and 4T1 ATP5BKO cells. We observed that ATP5BKO tumor-derived cells were deficient in both OXPHOS-derived ATP and in ATP5B, whereas 4T1 ρ0 cells re-established ATP production by mitochondrial transfer (Figure 2N).
To see whether these results are more broadly applicable, we deleted ATP5B in B16 cells. When grafted into C57BL/6 mice, B16 ρ0 cells acquire mtDNA (Tan et al., 2015) via transfer of whole mitochondria, yielding B16 DP cells (Dong et al., 2017). We first assessed B16, B16ρ0, B16 DP, and B16 ATP5BKO cells by SDS-PAGE and NBGE for the level of subunits of RCs (Figure S5A) and their assembly (Figure S5B), and for ATP production (Figure S5C). These lines behaved similarly to their 4T1 counterparts. Also, B16 ATP5BKO cells were more efficient in tumor formation than B16ρ0 cells (Figure S5D). These results indicate that OXPHOS-derived ATP is not essential for tumorigenesis.
Respiration Recovery Is Associated with Reactivation of Dihydroorotate Dehydrogenase
Cells devoid of mtDNA are auxotrophic for uridine and pyruvate (King and Attardi, 1988, 1989). OXPHOS defects may also increase the dependence of cells on otherwise non-essential nutrients such as pyruvate (Sullivan et al., 2015; Birsoy et al., 2015; Cardaci et al., 2015; Lussey-Lepoutre et al., 2015). We therefore tested the auxothrophy profile of 4T1 lines and observed that uridine and/or pyruvate are needed for proliferation of non-/low-respiring cells (D0–D10), while the dependence is lost in D15–D20 cells (Figures 3A and S4F).
Figure 3. Respiration Recovery Is Associated with Reactivation of DHODH.

(A) Cell lines as shown were evaluated for growth in the presence of uridine and pyruvate, or with pyruvate or uridine removed.
(B) Cell lines were assessed for DHODH expression by qRT-PCR and WB.
(C–E) DHODH-dependent respiration was assessed in parental 4T1 cells in the absence and presence of 30 μM leflunomide (Lef) (C). Individual lines were assessed for DHODH-dependent respiration (D) and for the orotate-to-DHO ratio (E).
(F) Parental, D0, D5, D10, D15, D20, D25, and D60 cells (106) were grafted s.c. into BALB/c mice, and tumor growth was evaluated by USI.
(G) Tumors grown from parental or 4T1 ρ° cells were excised and processed in a dedicated tissue shredder, and the homogenates were assessed for CI-, CII-, and DHODH-dependent respiration using an Oxygraph.
(H) BALB/c mice were grafted s.c. with 106 D0 cells. On the days indicated, animals were sacrificed and tissue from the grafted region excised, sectioned, and assessed by immunohistochemistry for proliferation using anti-Ki67 IgG followed by confocal microscopy. The numbers indicate percentage of Ki67-positive cells.
Data in (A) are mean values derived from two biological replicates with differences less than 10%; data in (B) are mean values ±SD (n ≥ 3); data in (C–G) are mean values ± SEM (n = 3); images in (B) and (H) are representative of three independent experiments. The symbol “*” indicates statistically significant differences from parental cells, and the symbol “#” indicates statistically significant difference from D0 cells, with p < 0.05.
We next investigated whether auxotrophy for uridine could explain the association between recovery of respiration and the onset of tumor growth. Since uridine auxotrophy is related to the dysfunction of DHODH (King and Attardi, 1988; He et al., 2014), we investigated its role in D0–D60 lines and its link to the initiation of tumorigenesis. We found little difference in DHODH mRNA and protein contents in D0–D60 cells (Figure 3B). DHODH converts DHO to orotate, with the resulting two electrons transferred to the respiratory chain (Loftier et al., 2005). Figure 3C shows the extent of DHODH-dependent respiration in parental 4T1 cells and its suppression by leflunomide, a selective inhibitor of the enzyme (Greene et al., 1995). DHODH-dependent respiration was absent in D0–D10 cells and recovered in D15 cells (Figure 3D). We then assessed the orotate-to-DHO ratio, reflecting native DHODH activity. Figure 3E reveals low orotate/DHO ratio in D0–D10 cells, indicating little DHODH function in these cells, while its function recovered in D15 cells.
To link the level of respiration to the kinetics of tumor initiation, we grafted D0–D20 lines into BALB/c mice. D5 and D10 cells formed tumors with considerable lag, while D15 and D20 cells formed tumors with kinetics similar to parental cells (Figure 3F). We next evaluated tumors grown from parental and D0 cells for CI-, CII-, and DHODH-dependent respiration and found no significant difference (Figure 3G).
Finally, we tested whether respiration including the DHODH-dependent component was associated with proliferation of malignant cells after grafting 4T1ρ0 (D0) cells into BALB/c mice (cf. Figures 1B and 1C). The tissue excised from the grafted region was sectioned and assessed for proliferation using Ki67 staining. Figure 3H shows low proliferation in D5 tissue, with some increase in D10 and with parental tumor levels in D15 tissue, consistent with the delay in tumor formation shown in Figure 3F. These results suggest an important role for DHODH in tumorigenesis.
DHODH Is Essential for Tumor Growth
To directly examine whether DHODH is important for tumor formation/progression, we deleted the gene for DHODH in 4T1 cells using CRISPR/Cas9. WB in Figure 4A shows the absence of DHODH in two clones of DHODHKO cells and its presence in DHODH-reconstituted (DHODHrec) cells. Consistent with this, DHODH-dependent respiration was undetectable in DHODHKO cells and recovered in DHODHrec cells, while routine respiration was identical in all lines (Figure 4B). We also found no difference in mitochondrial superoxide in these cells (Figure S4G). In contrast, DHODHKO cells showed stalled proliferation in the absence of uridine, which was restored by DHODH reconstitution (Figure 4C). No significant difference in the NADH/NAD+ ratio was detected in these lines (Figure 4D). NBGE revealed no discernible difference in the assembly of any of the five RCs or SCs in the cells, regardless of their DHODH status (Figure 4E), and also showed that DHODH does not associate with any of the complexes (Figure 4E, right panel). We then investigated DHODHKO and DHODHrec cells for ATP generation as well as for the role of glycolysis. Figure 4F shows that there was virtually no difference when DHODH-manipulated cells were compared with parental cells. Further, DHODHKO cells contain mitochondria with cristae, unlike ρ0 cells (Figure 4G).
Figure 4. DHODH Is Essential for Tumor Growth.

(A–I) WB shows the absence of DHODH in two clones of DHODHKO 4T1 cells and its presence in DHODHrec cells (A). Parental, DHODHKO, and DHODHrec cells were tested for routine and DHODH-dependent respiration (B), auxotrophyfor uridine (C), NADH/NAD+ ratio (D), assembly of RCs and SCs (E), ATP generation in the absence or presence of 50 mM 2DG (4.5 g/L glucose) (F), mitochondrial morphology using TEM (G), DHODH activity (H), and orotate-to-DHO ratio (I).
(J) Parental, DHODHKO, and DHODHrec cells were grafted s.c. in BALB/c mice at 106 per animal, and tumor formation was assessed by USI.
Data in (B)–(D), (F), and (I) are mean values ± SD(n ≥ 3); data in (H) and (J) are mean values ± SEM (n = 3 for H, n = 6 for J). The symbol “*” indicates statistically significant differences from parental cells, with p.
We next assessed the activity of DHODH in parental, DHODHKO, and DHODHrec cells using an in vitro enzymatic assay independent of CIII/CIV. This revealed a similar pattern of DHODH activity to that of DHODH-dependent respiration (Figure 4H; cf. Figure 4B). Consistent with these results, DHODHKO cells showed low orotate/DHO ratio, which increased to parental values in DHODHrec cells (Figure 4I), verifying this parameter as a proxy for in situ DHODH activity. Finally, we found that DHODHKO cells failed to produce tumors, while similar tumorforming capacity was found for parental and DHODHrec cells (Figure 4J).
To verify whether the presence of DHODH is required for tumor growth in another model, we examined B16 DHODHKO and B16 DHODHrec cells. Compared with the parental line, these cells had comparable levels of subunits of mitochondrial complexes (Figure S5A) and OXPHOS assembly (Figure S5B). The cell lines also had similar relative levels of ATP generated by OXPHOS and glycolysis (Figure S5C). We next found that B16 DHODHKO cells failed to form tumors, while B16 DHODHrec cells formed tumors with similar rate to parental cells (Figure S5E). As expected, while DHODHrec cells grew in the absence of uridine, B16 DHODHKO cells were auxotrophic (Figure S5F). Consistent with this, B16 DHODHKO cells featured normal routine respiration but lacked DHODH-dependent respiration (Figure S5G). Finally, we tested B16 lines for DHODH activity and found that it was absent in DHODHKO cells (Figure S6H).
To summarize, DHODH is essential for tumor growth in 4T1 breast cancer and B16 melanoma models.
DHODH Links Respiration to De Novo Pyrimidine Synthesis and to Cell-Cycle Progression
De novo pyrimidine synthesis involves reactions that convert glutamine to uridine 5-monophosphate (UMP), with DHODH catalyzing the “mitochondrial” step (Figure 5A). To understand whether this pathway is operational in 4T1 lines, we measured the conversion of 13C515N2-Gln into UMP. In agreement with low DHODH respiration, formation of the m+5 isotopomer of UMP was low in D0–D10 cells, while it increased in D15 cells (Figure 5B). We also evaluated the level of unlabeled pyrimidines and purines in parental and D0–D25 cells. Compared with parental cells, pyrimidine nucleotides were low in non-/low-respiring cells and increased in D15 cells, while the levels of purine nucleotides were only marginally affected (Figure S4H). We next assessed conversion of labeled glutamine to UMP in parental, DHODHKO, and DHODHrec cells. DHODHKO cells contained lower UMP synthesis capacity compared with parental cells, and this was restored in DHODHrec cells (Figure 5C).
Figure 5. DHODH Links Respiration to De Novo Pyrimidine Synthesis and Cell-Cycle Progression.

(A–L) De novo pyrimidine synthesis is catalyzed by the trifunctional CAD protein that includes the enzymatic activities of carbamoyl phosphate synthase 2, aspartate transcarbamoylase and dihydroorotase, the DHODH protein, the bifunctional UMPS protein with enzymatic activities of orotate phosphoribosyl transferase, and orotate decarboxylase (A). OMM, outer mitochondrial membrane; IMS, intermembrane space; IMM, inner mitochondrial membrane. 4T1 lines (B) and 4T1 cells with different DHODH status (C) were analyzed by liquid chromatography-mass spectrometry with 13C515N2-glutamine as the substrate for generation of the m+5 isotopomer of UMP, the product of the de novo pyrimidine pathway shown in (A). 4T1 lines were assessed for cell-cycle distribution (D), arrest in G2 following nocodazole treatment (10 μM, 1 hr) (E), and the level of cyclin E (F). 4T1 cells with different DHODH status were assessed for cell-cycle distribution (G), arrest in G2 following nocodazole treatment (H), and the level of cyclin E (I). Parental, D0, D5, D10, D15, D20, D25, and D60 cells were used for transcriptome analysis using the mouse Affymetrix chip, and the data were assessed by PCA (J). Parental and D0–D60 cells were assessed for members of the de novo pyrimidine pathway by WB (K) and for the DHODH enzymatic activity using an in vitro assay (L).
(M) Parental, D0, DHODHKO, and DHODHrec cells were assessed for components of the de novo pyrimidine pathway by WB.
(N) Raw mutation rates as a function of the average expression level. Mutations of oncogenes (in orange) and tumor suppressor genes (in blue) are compared with genes involved in the de novo pyrimidine biosynthesis. The baseline from median mutation rate of non-cancer genes is also shown as gray for comparison.
(O) Statistical significance of mutation rates over expected values (MutsigCV Q-value) as a function of the average expression level for cancer genes and genes involved in de novo pyrimidine biosynthesis, as compared with the baseline from non-cancer genes.
Data in (B)–(E), (G), and (H) are mean values ± SD; data in (L) are mean values ± SEM (n ≥ 3). The symbol “*” indicates statistically significant differences from parental cells, and the symbol “#” indicates statistically significant difference from D0 cells, with p < 0.05. (F), (I), (K), and (M) show representative images of three biological replicates. Data in (N) and (O) represent analysis of more than 11,000 patients diagnosed with 33 different types of cancer listed in the Cosmic database.
Cancer cells are typified by rapid proliferation, which involves unhindered progression through the cell cycle. During the S phase, genomic DNA is replicated in a process that includes insertion of nucleotides produced by the de novo pyrimidine pathway into nascent DNA strands (Sigoillot et al., 2003). To test if respiration is linked to cell-cycle progression, we evaluated D0–D60 lines for cell-cycle distribution. This revealed that more D0–D10 cells were in the S phase compared with parental and D20–D60 cells (Figure 5D). We also found that upon nocodazole synchronization, a higher proportion of parental and D15–D60 cells were arrested in G2 compared with D0–D10 cells (Figure 5E). Finally, D0–D10, but not parental and D15–D60 cells, accumulated cyclin E, a marker of early S phase (Figure 5F).
We next investigated a link between S-phase arrest and DHODH activity. Cell-cycle evaluation revealed increased number of DHODHKO cells in S phase compared with parental cells, with the proportion of DHODHrec cells in S phase being comparable to parental cells (Figure 5G). A similar pattern was observed for G2 arrest after nocodazole treatment (Figure 5H) and for the cellular content of cyclin E (Figure 5I), consistent with a previous report (Mohamad Fairus et al., 2017). Finally, we found that B16 DHODHKO cells were also arrested in S phase, while B16 DHODHrec cells showed cell-cycle distribution similar to parental cells (Figure S5I). Hence, absence of DHODH activity suppresses pyrimidines and interferes with cell-cycle progression.
De Novo Pyrimidine Pathway Is Primed in OXPHOS-Deficient Cells
To understand the status of the pyrimidine pathway in D0–D60 lines and in parental 4T1 cells, we performed transcriptome analysis. Principal component analysis (PCA) in Figure 5J shows clustering of D0–D10 and D15–D25 cells. A similar pattern was observed for mitochondrial protein transcripts sourced from MitoCarta 2.0 (Calvo et al., 2015) (Figure S6A). Given the link between respiration, DHODH, pyrimidine synthesis, and tumor progression observed above, we analyzed microchip data for transcripts relevant for the de novo pyrimidine pathway (cf. Figure 5A) to test if the clustering pattern was maintained. This revealed no trend in the expression of CAD, DHODH, and UMPS transcripts in parental, D0–D25, and D60 cells (Figure S6B), consistent with the DHODH mRNA and protein levels shown in Figure 3B.
We nest examined expression of proteins of the de novo pyrimidine pathway. Similar to DHODH, there were few differences in CAD, phosphorylated CAD, and UMPS among the lines tested (Figure 5K). Next, DHODH activity was 30%–50% lower in D0–D10 than in parental cells (Figure 5L), yet considerably higher than the very low DHODH-dependent respiration and low orotate/DHO ratio in these lines (cf. Figures 3D and 3E). Also, cells with manipulated DHODH content did not show significant changes in the expression of CAD and UMPS (Figure 5M).
The above results suggest that the de novo pyrimidine pathway is primed and preserved in OXPHOS-deficient cells. To interrogate this notion with patient data, we compared mutation rates of known cancer genes to genes of de novo pyrimidine synthesis (CAD, DHODH, and UMPS) as a function of average expression levels in >11,000 patients diagnosed with 33 different types of cancer listed in the Human Genome Atlas database. Both raw mutation rate (number of mutations per base pair in a gene) (Figure 5N) and statistical significance of mutations of a gene over expected mutations (Figure 5O) are shown for comparison. The median mutation rates (or significance) for other genes (not annotated as cancer genes) were utilized as a baseline. Raw mutation rates of CAD, DHODH, and UMPS were close to the baseline, and were statistically indistinguishable from the expected mutations according to MutsigCV (Q is nearly 1). By comparison, many known oncogenes and tumor suppressor genes had significantly higher mutation rates (20%, Q < 0.1). These results suggest that genes of the de novo pyrimidine pathway are rarely mutated in cancer.
To assess whether DHODH-dependent respiration and DHODH activity are conserved in different types of cancer, we examined breast, cervical, and pancreatic cancer cell lines as well as osteosarcoma cells. Routine and DHODH-dependent respiration varied between 30–80 and 2–4 pmol O2/s/106 cells, respectively (Figure S6C), while DHODH activity ranged from 200 to 450 pmol O2/hr/106 cells (Figure S6D), indicating that DHODH/pyrimidine synthesis pathway function is preserved in cancer cells.
ATP5BKO Cells Maintain Functional DHODH
Despite the absence of OXPHOS-derived ATP, ATP5BKO cells form tumors in mice (Figures 2M and S5D) and should therefore maintain functional DHODH. We found that ATP5BKO cells grew in the absence of uridine (Figure 6A), contained normal amounts of the DHODH protein (Figure 6A, insert), and featured DHODH-dependent respiration while routine respiration was decreased (Figure 6B). The relative NADH/NAD+ ratio increased by 50%-60% in ATP5BKO cells compared with parental cells (Figure 6C). ATP5BKO cells had mitochondria without cristae (Figure 6F), in agreement with the literature (Daum et al., 2013). The finding of normal DHODH protein and DHODH-dependent respiration in ATP5BKO cells was corroborated by normal DHODH activity (Figure 6H) and conserved proteins of the de novo pyrimidine pathway (Figure 6I). We also tested ATP5BKO B16 cells and found a similar pattern for the corresponding lines (Figures S5F-S5H). Consistent with this, we observed fewer cells in S phase in both 4T1 ATP5BKO and B16 ATP5BKO cells than in their non-respiring counterparts (Figures 6K and Figure S5I).
Figure 6. ATP5B Cells Maintain Functional DHODH, Propelled by CIII and CIV.

(A–D) Parental, ρ°, ρ° AOX, and ATP5BKO cells were evaluated for growth in the absence of uridine (A), the level of the DHODH proteins by WB (A, insert), routine and DHODH-dependent respiration (B), NADH/NAD+ ratio (C), and ATP generation in the absence or presence of 50 mM 2DG (4.5 g/L glucose) (D).
(E–K) Parental, ρ°, and ρ° AOX cells were evaluated by NBGE for the assembly of RCs and SCs using antibodies against subunits of individual RCs (E). Cells as shown were evaluated for mitochondrial morphology using TEM (F); the ratio of orotate-to-DHO (G); DHODH activity (H); level of the CAD, p(S1859)-CAD, DHODH, and UMPS proteins (I); formation of m+5 UMP from 13C5,15N2-Gln (J); and cell-cycle distribution (K).
(L) Parental, ρ°, and ρ° AOX cells were grafted s.c. in BALB/c mice at 106 per animal, and tumor formation was assessed by USI.
(M–O) BALB/c mice with 4T1 and 4T1ρ° AOX cell-derived tumors (≈250 mm3) were cannulated via the jugular vein and infused with 13C5, 15N2-Gln, and the tumors were analyzed for the M+5 UMP isotopomer as detailed in STAR Methods (M). ρ° AOX(D0 AOX) cells were grafted into BALB/c mice s.c. at 106 per animal. On days 5, 10, 15, and 20 post-grafting, the (pre-)tumor plaques were excised from the animals and D5 AOX, D10 AOX, D15 AOX, and D20 AOX lines were established. Parental and D0 AOX-D20 AOX cells were assessed for mtDNA using qPCR (N) and for routine and DHODH-dependent respiration using the Oxygraph (O).
(P) Parental, D0, and D0 AOX to D20 AOX cells were grafted in BALB/c mice (106 cells/per animal), and tumor volume was assessed by USI.
(Q) Parental, ρ°, and ρ° AOX cells were assessed for the ratio of CoQH2 and total CoQ including the CoQ9 and CoQ10 analogs.
(R) Parental and ρ° (D0) cells as well as D5–D60 lines were assessed for the ratio of CoQH2 and total CoQ.
(S) BALB/c mice were grafted with ρ° AOX cells at 106 per animal; tumors were treated with metformin (Met), leflunomide(Lef), and salicylhydroxamicacid (SHAM) as detailed in STAR Methods; and tumor volume was quantified.
Data in (A)–(D), (G), (J), (K), (M), (N), (Q), and (R) are mean values ± SD (n = 3); those in (H) and (O) n = 3; (L) and (S) (n = 5) are mean values ±SEM. The symbol “*” indicates statistically significant differences from parental cells, with p < 0.05; the symbol “#” indicates statistically significant differences from ρ° cells, with p < 0.05. (A, insert), (E), (F), and (I) show representative images of three biological replicates.
Complexes III and IV Propel DHODH-dependent Respiration to Promote Tumor Formation
The above data indicate that DHODH presents a link between respiration and tumor formation, controlling de novo pyrimidine synthesis independently of mitochondrial ATP generation. As DHODH connects to the mitochondrial pool of coenzyme Q (CoQ) that is redox-cycled by CIII/CIV, DHODH might be stalled when respiration is deficient due to lack of its electron acceptor before it is reconstituted in D15–D20 cells. We therefore expressed alternative oxidase (AOX) in 4T1ρ0 and B16ρ0 cells. This protein is present in lower eukaryotes where it replaces CIII + CIV, facilitating direct electron transfer from CoQ to oxygen (Hakkaart et al., 2006; Perales-Clemente et al., 2008).
4T1 ρ0 AOX cells proliferated in the absence of uridine (Figure 6A), suggesting that AOX reactivates DHODH in ρ0 cells. Consistent with this, 4T1ρ0 AOX cells contained normal DHODH protein (Figure 6A, insert) and DHODH-dependent respiration, while routine respiration was low and comparable to 4T1ρ0 cells (Figure 6B). The virtual absence of routine respiration was reflected by increased NADH/NAD+ ratio in ρ0 AOX cells, which was similar to 4T1ρ0 cells (Figure 6C). As with 4T1ρ0 cells, 4T1ρ0 AOX cells used glycolysis to maintain normal levels of ATP (Figure 6D), lacking assembled mitochondrial complexes (except for CII) (Figure 6E) and mitochondrial cristae (Figure 6F); 4T1 ρ0 AOX cells converted DHO to orotate (Figure 6G), exerted normal DHODH activity (Figure 6H), maintained proteins of the de novo pyrimidine pathway (Figure 6I), and efficiently converted glutamine to UMP (Figure 6J). As a result, 4T1 ρ0 AOX cells were unlocked from the S phase arrest (Figure 6K) and efficiently formed tumors in BALB/c mice (Figure 6L). To verify the AOX-driven reactivation of the de novo pyrimidine pathway in tumors in vivo, we performed a live labeling study, in which. 13C515N2-Gln was infused via the jugular vein into BALB/c mice carrying tumors derived from 4T1 (17 days after grafting) and 4T1ρ0 AOX cells (14 days after grafting), and the abundance of the m+5 isotopomer of UMP was evaluated in isolated tumor tissue. Conversion of Gln to UMP was comparable in 4T1 and 4T1 ρ0 AOX cell-derived tumors (Figure 6M), consistent with normal flux through the de novo pyrimidine pathway in AOX-expressing tumors. B16 lines showed behavior similar to the corresponding 4T1ρ0 lines (Figures S5J-S5P), and B16ρ0 AOX cells formed tumors almost as efficiently as their parental counterparts (Figure S5Q).
To confirm that AOX acts in vivo by reactivating CoQ redoxcycling rather than by enhancing mitochondrial transfer into ρ0 cells, we grafted 4T1 ρ0 AOX cells into BALB/c mice and derived lines on days 5,10,15, and 20. The temporal increase in mtDNA in 4T1 ρ0 AOX cells was similar to 4T1ρ0 lines (Figure 6N; cf. Figures 1E and S1B). However, D0–D15 AOX cells had very low routine respiration that increased in D20 AOX cells to ≈40% of parental cells, while DHODH-dependent respiration remained close to parental cell levels (Figure 6O). To examine their tumor-forming propensity, we grafted D0–D20 AOX cells into BALB/c mice, and observed that D5 AOX–D20 AOX cells formed tumors similarly to D0 (ρ0) AOX cells (Figure 6P; cf. Figure 6L).
The link between CIII + CIV and electrons generated upstream in the OXPHOS systems is mediated by redox-cycling of CoQ (i.e., oxidation of CoQH2 to CoQ). To assess whether CoQH2 is re-oxidized in 4T1ρ0 AOX cells, where the AOX protein substitutes CIII + CIV in redox-cycling CoQ, we determined the CoQ redox state in parental, 4T1ρ0 and 4T1ρ0 AOX cells. In rodents, CoQ9 is the major form of CoQ with the remainder made up by CoQ10. We therefore assessed the CoQH2/total CoQ (i.e., CoQH2+CoQ) for both forms of CoQ. In parental cells, >50% of CoQ was in the oxidized state, while in 4T1 ρ0 cells most CoQ was in the reduced form (Figure 6Q). Expression of AOX in nonrespiring cells shifted the redox state of CoQ to its more oxidized form (Figure 6Q), consistent with published data (Guarás et al., 2016). We next assessed the CoQH2/total CoQ ratio in D0–D60 cells and found it higher in D0–D10 and lower in D15-–60 cells, suggesting that restoration of respiration resulted in efficient oxidation of the CoQ pool (Figure 6R).
To confirm that restoration of DHODH function by reactivation of CoQ redox-cycling is a major consequence of AOX expression in ρ0 cells that supports tumor formation, we tested the effect of the AOX inhibitor salicylhydroxamic acid (SHAM) (Martínez-Reyes et al., 2016), the DHODH inhibitor leflunomide (Loffler et al., 2005), and the CI inhibitor metformin (Wheaton et al., 2014) on tumor formation in BALB/c mice with grafted 4T1ρ0 AOX cells. Figure 6 shows the inhibitory effect of both SHAM and leflunomide but not that of metformin, pointing to the involvement of the AOX-DHODH axis in this process and excluding potential effects of AOX on the NADH/NAD+ cycling via nascent CI.
Pyruvate May Not Be Limiting for Tumor Growth
Since low-respiring cells are auxotrophic for pyruvate and uridine, we tested whether the capacity of ρ0 AOX cells to form tumors could be promoted by the presence of pyruvate in the microenvironment. By providing external oxidizing power, extracellular pyruvate could conceivably release the potential block in proliferation and tumor growth linked to defective aspartate biosynthesis due to the lack of NAD+ recycling (Sullivan et al., 2015, 2018; Birsoy et al., 2015; Garcia-Bermudez et al., 2018). Pyruvate was suggested to be increased in malignant compared with normal tissues (Goveia et al., 2016). We thus analyzed pyruvate in tissue excised from the site of grafted 4T1 ρ0 cells at time points used to establish the lines, in parental and D5–D25 cells (cf. Figure 1B). At all time points, pyruvate concentrations in the tumor lesions/tissue were ≈20%–40% higher than in the liver (Figure S7A), being 2–3 nmol/mg of tumor tissue. Assuming a tissue density close to 1 g/mL, this corresponds to concentration of ≈2 mM (i.e., higher than the 1 mM pyruvate that supported proliferation of respiration-deficient cells in our in vitro experiments) (cf. Figure 3A) (King and Attardi, 1988, 1989).
To see whether pyruvate detected in tumors was extracellular (i.e., able to provide the oxidizing power for aspartate production), we analyzed serum (containing no intracellular pyruvate) from C57BL/6 and BALB/c mice with and without tumors as well as serum from cancer patients and healthy human subjects for pyruvate. The measured concentration was about 75–150 μM in mice and about 200 μM in human samples (Figure S7B), the latter being similar to published values (Landon et al., 1962).
To determine the effect of extracellular pyruvate on intracellular aspartate and on the proliferative potential of ρ0 cells, we evaluated 4T1ρ0 and B16ρ0 cells maintained with uridine and increasing amounts of added pyruvate for intracellular aspartate. Figures S7C and S5R document ≈ 1.5-fold increase of intracellular aspartate with escalating extracellular concentrations of pyruvate over the range of 0–1 mM. Aspartate increased at extracellular pyruvate concentrations equivalent to those measured in mouse and human serum. Similarly, the same level of pyruvate as found in serum resulted in stimulation of cell proliferation (Figures S7D and S5S).
We next evaluated intracellular aspartate in the absence of extracellular pyruvate and uridine. While aspartate was reduced by ≈30% in non-respiring D0–D10 cells, it recovered in D15 cells (Figure S7E). Intracellular aspartate was unchanged in ATP5BKO (Figure S7F) or DHODH-manipulated cells (Figure S7G). Further, AOX expression in 4T1 ρ0 cells did not increase aspartate, which remained similar as in the ρ0 cells (Figure S7H). This demonstrates that AOX overexpression does not increase intracellular aspartate in our system and should not support growth of ρ0 cells in the absence of pyruvate. Accordingly, ρ0 AOX cells, similarly as ρ0 cells, were auxotrophic for pyruvate (Figure S7I).
Finally, we tested the effect of uridine on proliferation of 4T1 ρ0 and B16ρ0 cells cultured in the presence of serum prepared from BALB/c and C57BL/6 mice instead of FCS. We observed uridine to significantly enhance cell growth under these conditions (Figures S7I and S5T). To further document the importance of uridine limitation in tumor growth, we tested the effect of uridine supplementation of mice with grafted 4T1ρ0 cells on tumor formation. Figure S7K shows that tumors appeared earlier in uridine-supplemented mice, and at a time that precedes mitochondrial transfer and the associated respiration recovery. Collectively, this further supports the notion that non-functional DHODH presents a severe limitation for tumor growth.
DISCUSSION
The importance of mitochondria for the initiation and progression of tumorigenesis is now emerging. It is evident that, despite the well-known Warburg effect, tumors have active mitochondrial bioenergetic metabolism (Marin-Valencia et al., 2012; Hensley et al., 2016). Disruption of the ETC shows promise in cancer therapy (Rohlena et al., 2011; Zhang et al., 2014; Rohlenova et al., 2017). Cells with deleterious mtDNA mutations fail to form tumors (Park et al., 2009), and genetic ablation of OXPHOS restrains tumorigenesis (Weinberg et al., 2010). mtDNA-depleted (ρ0) tumor cells present a particularly instructive case. Having no functional OXPHOS, these cells cannot form tumors in mice unless they acquire host mtDNA (Tan et al., 2015) via horizontal transfer of whole mitochondria from the stroma (Dong et al., 2017). In this way, ρ0 cells give rise to palpable tumors only after a long initial lag period (Tan et al., 2015; Dong et al., 2017). While these studies suggest that functional OXPHOS is necessary for tumorigenesis, previously published data did not pinpoint exactly which aspect of OXPHOS function is essential. The key finding of the current study is that DHODH-driven pyrimidine biosynthesis, rather than OXPHOS-mediated ATP production, is essential for tumorigenesis.
To further explore this issue, we developed a unique model that allowed us to characterize the link between OXPHOS function and tumor formation in unprecedented temporal detail. We followed the events associated with tumorigenesis of mtDNA-depleted ρ0 cells in mice during the initial lag period and throughout the various stages of tumor progression and demonstrate that the appearance of tumors coincides with OXPHOS reconstitution at days 15–25 post-grafting, after the end of a “dormant” period when mtDNA is replenished and OXPHOS machinery re-assembled. This detailed investigation was possible because cancer cells isolated at various time points in the 4T1 ρ0 tumor model are remarkably stable in culture, and their properties, such as the level of mtDNA, respiration, or ETC assembly, did not change with time. This unexpected stability, observed by others in a different model (Picard et al., 2014), can be explained by the absence of selection pressure in the rich culture media containing uridine/pyruvate (see below).
Surprisingly, we found that the best known OXPHOS function, production of ATP by ATP synthase, is not essential for tumori-genesis. While increased mitochondrial contribution to total ATP production was concurrent with OXPHOS reconstitution, ATP synthase assembly and appearance of tumors, the total ATP content in the cells and energy charge were not, in general, significantly decreased, but maintained by glycolysis with its much faster kinetics compared with OXPHOS (Koppenol et al., 2011). Most strikingly, cells deficient in ATP synthase were found to readily produce tumors. This suggests that mitochondrial ATP production is not limiting for tumor growth, at least at its earlier stages. Instead, we found that the important OXPHOS-related feature that promotes tumorigenesis is de novo pyrimidine synthesis, directly driven by respiration via DHODH, which converts DHO to orotate. This was clearly demonstrated by the failure of DHODH-deficient cells to form tumors, despite the fact that these cells show otherwise fully functional OXPHOS and normal ATP levels. Furthermore, the DHO/orotate ratio was increased in DHODHKO cells and nonrespiring D0–D10 cells, and formation of UMP from glutamine was compromised. This indicates that the enzyme is inactive but is reactivated before tumors appear. The central role for DHODH in tumorigenesis is consistent with a recent report demonstrating upregulation of DHODH during the course of UV-induced skin tumorigenesis and its functional role therein (Hosseini et al., 2018).
The link between OXPHOS and DHODH is maintained by CoQ redox-cycling (Gregoire et al., 1984; Ayer et al., 2015). Electrons, removed from DHO by DHODH, are transferred to CoQ yielding CoQH2, which is then re-oxidized at CIII. The CoQ redox cycle is broken in the absence of CIII/CIV activity when OXPHOS is non-functional due to mtDNA deficiency. This removes the only practical means of CoQ recovery in mammalian cells, while maintaining upstream sources of electrons for CoQ reduction such as CII or DHODH itself. These sources of electrons reduce CoQ to the maximal attainable level before they stall due to the lack of the electron acceptor. Indeed, in non-respiring D0–D10 cells CoQ was present predominantly in the reduced form, whereas the CoQH2/CoQ redox state decreased and approached parental cell values before the onset of tumor formation, coinciding with CIII/CIV reconstitution. AOX expression in ρ0 cells was sufficient to reactivate DHODH-driven respiration, normalize the CoQH2/CoQ and DHO/orotate ratios, reinitiate UMP synthesis both in vitro and in vivo, and restore tumorigenicity in the absence of mtDNA. Importantly, live labeling with 13C5,15N2-Gln confirmed the in vitro results in a mouse model derived from 4T1 ρ0 AOX cells 14 days after grafting the cells, i.e., at the stage when respiration is not recovered and tumor formation is largely dependent on AOX-propelled DHODH (Figures 6M-6P). It thus seems that lack of redox-cycling of CoQ, not OXPHOS deficiency per se, restricts tumorigenesis.
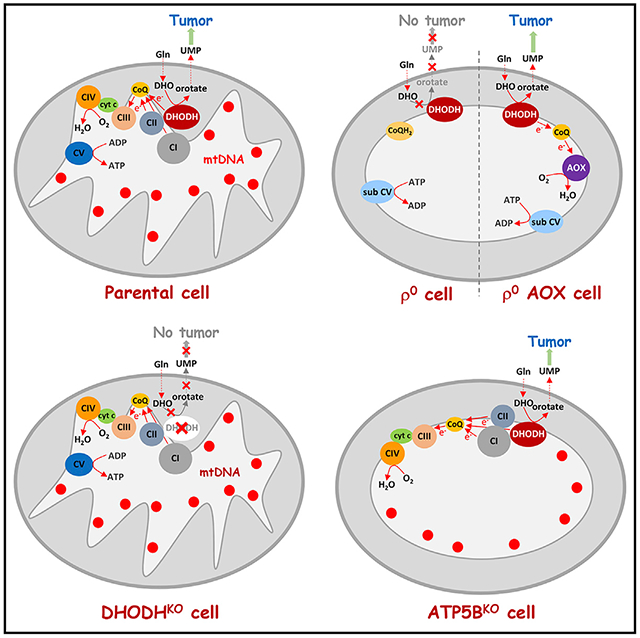
We therefore propose a scenario based on our experimental models and depicted schematically in Figure 7. In fully respiring cells, CI, CII, and DHODH transfer electrons to CoQ, which are then forwarded to CIII. This latter complex transfers electrons to CIV, which then produces water at the expense of molecular oxygen. CI, CIII, and CIV increase the proton-motive force in the form of ΔΨm,i that, among other functions, drives formation of ATP catalyzed by CV. In ρ0 cells, mtDNA is missing, resulting in the collapse of CI, CIII, and CIV, and in the assembly of CII and sub-CV. Under this scenario, DHODH cannot convert DHO to orotate, since CoQ cannot transfer electrons to CIII. ATP is generated by glycolysis and ΔΨm,i maintained by ATP cleavage by the ATPase activity of sub-CV; ρ0 cells form tumors only after acquisition of mtDNA from the host and restoration of respiration (Tan et al., 2015; Dong et al., 2017). DHODHKO cells lack tumorforming capacity and cannot be “repaired” by mtDNA acquisition, because the absence DHODH precludes conversion of DHO to orotate. On the other hand, ρ0 AOX cells have normal DHODH-dependent respiration, since electrons generated by conversion of DHO to orotate are captured by CoQ and transferred to AOX, which substitutes for the combined activity of CIII and CIV. These cells efficiently form tumors. Finally, ATP5BKO cells that are highly glycolytic have normal DHODH-dependent respiration and form tumors faster than ρ0 cells. Together, our findings demonstrate an important role of DHODH and CoQ redox-cycling in tumor formation in cells with damaged mtDNA, resulting in mtDNA acquisition and restoration of respiration independent of OXPHOS-derived ATP.
Figure 7. Scheme Depicting the Role of Respiration in Propelling De Novo Pyrimidine Synthesis.

Individual schemes illustrating the role of respiration in de novo pyrimidine synthesis with central role of CoQ and DHODH, as documented using our cell models, including parental (1), ρ° (2), DHODHKO (3), ρ° AOX (4), and ATP5BKO cells (5).
A typical consequence of OXPHOS dysfunction is the auxotrophy for pyruvate and uridine. Pyruvate as an exogenous electron acceptor is required to produce aspartate, a precursor of de novo pyrimidine pathway biosynthesis, and uridine to complement defective DHODH-linked pyrimidine synthesis via salvage pathways (Loffler, 1980; King and Attardi, 1988, 1989; Birsoy et al., 2015; Sullivan et al., 2015). We observed auxotrophy in D0–D15 cells, which was relieved by OXPHOS reconstitution following mtDNA transfer and prior to tumorigenesis, or in the case of uridine, by AOX expression. Given the efficacy of AOX-mediated restoration of tumorigenicity, this suggests that the DHODH dysfunction-induced defect in de novo pyrimidine synthesis could be a major obstacle for in vivo growth of respiration-compromised tumor cells, and that pyruvate might not be the limiting factor. Indeed, we consistently measured substantial pyruvate at the site of tumor growth throughout the course of the experiment, and levels of pyruvate in serum of mice and cancer patients were sufficient to support proliferation of ρ0 cells in vitro, although suboptimal. In addition, it has been reported that cancer cells deficient in the CII subunit SDHB are addicted to pyruvate (Cardaci et al., 2015; Lussey-Lepoutre et al., 2015), yet they readily form tumors in mice (Guzy et al., 2008; Bezawork-Geleta et al., 2018). Importantly, SDHB-deficient neoplasias are relatively common in humans and have unfavorable prognosis (King et al., 2011). These data suggest that pyruvate may not be limiting in vivo under all circumstances.
To begin to place our results into context, we suggest that de novo pyrimidine biosynthesis, driven by functional OXPHOS, is crucial for tumor growth. This notion is supported by the failure of DHODHKO cells to form tumors, and by the recovery of tumorigenicity when AOX is expressed in ρ0 cells. Our results also suggest that DHODH represents a bottleneck for pyrimidine synthesis in non-respiring cells, although they do not rule out other limitations that might constrain in vivo growth in the absence of functional OXPHOS. While a deficiency in DHODH disrupts the pyrimidine biosynthesis pathway in a defined manner, expression of AOX restores DHODH activity as well as reactivating CoQ redox-cycling. AOX might also impact on additional metabolic pathways converging on the CoQ pool. It seems unlikely, however, that AOX indirectly supports the synthesis of aspartate. Thus, we have ruled out an involvement of CI, and AOX expression did not affect the NADH/NAD+ ratio or content of aspartate in ρ0 cells, just as ρ0 AOX cells are auxotrophic for pyruvate. Previous studies have reported that aspartate can be limiting for tumor growth in vivo due to its inefficient import into cells and proposed that CI inhibition constrains tumor growth by limiting aspartate biosynthesis (Garcia-Bermudez et al., 2018; Sullivan et al., 2018). However, while growth retardation by CI inhibition was complete in vitro in the absence of pyruvate, it was incomplete when CI was targeted in vivo (Sullivan et al., 2018). The remaining proliferation in that case could perhaps be supported by extracellular pyruvate. To summarize, while this and other reports clearly show that pyrimidine biosynthesis is essential for tumor growth in multiple cancer models, the identity of the rate-limiting steps in various conditions deserves further investigation, as it will likely be affected by the environment and by the experimental model employed.
What does this mean for cancer therapy? We found that components of the de novo pyrimidine synthesis pathway rarely mutate in cancer, clearly showing its importance. In our experimental models, the pathway, including DHODH itself, was primed to respond when the block in CoQ redox-cycling was removed. Inhibitors of DHODH are used in the clinic as anti-rheumatics (Olsen and Stein, 2004) and show efficacy in cancer settings either alone or in combination with anti-cancer agents (Brown et al., 2017; Mathur et al., 2017; Sykes et al., 2016; Shukla et al., 2017; Kim et al., 2017; Koundinya et al., 2018). A more effective therapeutic approach could involve intervention at the level of respiratory CIII. This would not only block DHODH activity and pyrimidine biosynthesis, but would also increase the generation of reactive oxygen species from the respiratory chain (Adam-Vizi and Chinopoulos, 2006; Murphy, 2009; Quinlan et al., 2012), striking the cancer cell on two fronts at once by way of combining the cell death inducing activity of excessive oxidative stress (Rohlena et al., 2011) with the cytostatic activity of DHODH inhibition. While anti-cancer agents directed at CIII exist (Le et al., 2007), their potential side effects on the hematopoietic and immune systems would need to be carefully evaluated (Anso et al., 2017).
In conclusion, we show here that cancer cells with dysfunctional OXPHOS due to mtDNA deficiency import mitochondria from the host to restore respiration and facilitate the DHODH-catalyzed conversion of DHO to orotate. Intriguingly, reactivation of CoQ redox-cycling is sufficient to drive DHODH and to allow cancer cells to form tumors. We propose that DHODH-mediated CoQ redox-cycling is an important link between de novo pyrimidine synthesis and respiration, and that it may be a promising target for broad-spectrum cancer therapy. This notion is corroborated by the emergence of tumor metabolism as a target for anti-cancer therapeutic strategies (Sullivan et al., 2016; Martinez-Outschoorn et al., 2017). Our reasoning is based on the concept that despite their high metabolic plasticity, that includes the ability to “import” mitochondria, cancer cells seem unable to “bypass” pyrimidine synthesis defects, presenting a novel aspects of cancer biology with potential therapeutic implications.
Limitations of Study
While we propose that targeting DHODH may present a novel, broad-spectrum anti-cancer strategy, we note that there are mitochondrial inhibitors that are under clinical trial, such as inhibitors of complex I (Molina et al., 2018; Rohlenova et al., 2017) or α-ketoglutarate dehydrogenase (Alistar et al., 2017), which effectively suppress tumor growth without DHODH inhibition. In addition, it can be expected that DHODH inhibition will not be effective in all types of tumors, and that combined targeting involving DHODH and complex I may provide a broader and more effective anti-cancer strategy by simultaneously interfering with two crucial steps of pyrimidine biosynthesis. In addition, while we do not see a direct effect of AOX overexpression on aspartate biosynthesis in vitro in the absence of complex I activity, it is possible that AOX expression, by altering cellular redox balance, could stimulate tumor growth in vivo in a complex I-independent manner or that as yet uncharacterized factors in the tumor microenvironment could synergize with AOX to stimulate tumor growth.
STAR★METHODS
CONTACT FOR REAGENT AND RESOURCE SHARING
Further information and requests for reagents may be directed and will be fulfilled by the Lead Contact, Jiri Neuzil (j.neuzil@griffith.edu.au).
EXPERIMENTAL MODEL AND SUBJECT DETAILS
We have used female Balb/c mice, and male and female C57BL mice. Human cell lines were authenticated.
METHOD DETAILS
Cell Culture
4T1 mouse metastatic breast cancer cells were purchased from the ATCC and maintained in the RPMI medium with 10% FCS and antibiotics. B16 mouse metastatic melanoma cells were purchased from the ATCC cells and maintained in DMEM with 10% FCS and antibiotics. Unless stated otherwise, the cells were cultivated in the presence of 1 mM pyruvate and 50 μg/mL uridine. 4T1ρ0 and B16ρ0 cells were prepared as described (Tan et al., 2015). D5, D10, D15, D20, D25, D30, D40, D50 and D60 sublines were prepared following injection of D0 (ρ0) cells subcutaneously (s.c.) into Balb/c mice at 106 per animal into groups of 5-6 mice. On days 5, 10, 15, 20, 25, 30, 40, 50 and 60, mice were sacrificed, the pre-tumor lesions or tumors excised, and cells isolated from the tissue in the presence of 6TG as described (Tan et al., 2015). The isolated cells were used to establish sublines for further study. D5–D20 AOX cells were prepared identically, following grafting of 4T1ρ0 AOX (D0 AOX) cells into Balb/c mice. The same procedure was applied to obtain cells derived from ATP5BKO tumors. These cells were maintained in tissue culture media supplemented with uridine (50 μg/mL) and pyruvate (1 mM). Cells were moved into the same media without uridine/pyruvate, as indicated. B16 DP cells were derived from tumours grown in transgenic C57BLsu9-DsRed2 mice injected with B16ρ0 cells with blue fluorescent protein nucleus as reported (Dong et al., 2017). The human breast cancer MCF7 and MDA-MB-231 cells, human cervical cancer HeLa cells, human osteosarcoma 143B cells, mouse mastocytoma P815 cells and human pancreatic cancer PANC-1 cells (all from the ATCC), as well as human pancreatic cancer PaTu8902 cells (DMSZ) were maintained in the same media as B16 cells without uridine and pyruvate.
Evaluation of Uridine and Pyruvate Auxotrophy
Cells were seeded in 6-well plates at a density of 2.5x10⁵ cells per well. Cells were then incubated in RPMI medium supplemented with 1 mM pyruvate (4T1 medium) or with 1 mM pyruvate and 50 μg/mL uridine (ρ0 medium) for 24, 48 or 72 h at 37°C in 5% CO2. At various time points, duplicates of cells (4T1 and ρ0 were washed with PBS, harvested by trypsinization, and the number of cells counted using a Casy Cell Counter (Roche).
Preparation of Cells with Knocked Out or Reconstituted Genes
To prepare DHODHKO and ATP5BKO cells, we used CRISPR/Cas9 system (Shalem et al., 2014). Guide RNAs sequences from the GeCKO library (v2 09Mar2015) were synthesized and cloned into BsmBI-cleaved pXPR_001 vector containing the mammalian codon-optimized Cas9 nuclease expression cassette. Parental 4T1 or B16 cells were transiently transfected using Lipofectamine 3000 (Thermo Scientific), grown for 24 h and selected by puromycin for 48-72 h, or until all non-transfected control cells were eliminated. Surviving cells were sorted into 96 well plates, expanded, and clones unable to grow in media lacking uridine and pyruvate (for DHODHKO cells) or glucose (ATP5BKO cells) were selected. The absence of the targeted proteins was verified by WB. The guide RNA sequences used were as follows: DHODH, 5′-TCA GGT ACT CGG CGT AGA AA-3′; ATP5B, 5′-CAC TGC CAC CGG GCG AAT CG-3′.
To reconstitute DHODH protein expression, the DHODH coding sequence was PCR-amplified from cDNA obtained from mouse B16 cells. Primers used were 5′-ATA AAG AAT TCC ACC ATG GCG TGG AGA CAG CTG-3′ (forward) and 5′-ATA AAG GAT CCT CAC CTG CGG TGA TCT ACT C-3′ (reverse). Gel-purified PCR product was cleaved by fast-digest EcoRI and BamHI enzymes (Thermo Scientific) and ligated into the pCDH-CMV-MCS-EF1-Puro lentiviral vector (System Biosciences) digested in the same way. Lentiviral particles were produced as described (Blecha et al., 2017) and used to transduce 4T1 or B16 DHODHKO cells, followed by puromycin selection. DHODH expression was verified by WB. To express AOX in 4T1ρ0 cells, we used pWPI-AOX-IRES-GFP vector (a kind gift of N.S. Chandel; Martínez-Reyes et al., 2016). Lentiviral particles were produced as above and transduced cells were selected by sorting for GFP. To express AOX in B16ρ0 cells, we used lipofectamine transfection as described above, as lentiviral transduction was ineffective in these cells. Transfected cells were grown for 10 days, and selected by two rounds of sorting for GFP.
Mitochondrial Membrane Potential and Mitochondrial Superoxide Evaluation
To assess ΔΨm,i, cells were seeded at 80,000 per mL in 96-well plates and allowed to recover for 24 h. Tetramethylrhodamine ethyl ester (TMRE) at 50 nM was added to all wells and incubated for 30 min prior to analysis by flow cytometry (FACScalibur, Becton Diskinson). Prior to analysis, control cells were also pre-treated with 1 μM of carbonyl cyanide-4-(trifluoromethoxy) phenylhydrazone (FCCP) for 10 min.
Mitochondrial superoxide was assessed in cells seeded at 80,000 per well in a 96-well plate and incubated with 5 μM MitoSOX for 90 min at 37°C. Fluorescence was assessed at the excitation of 510 nm and emission of 580 nm in a Biotek Cytation 3 microplate reader (Biotek Instruments). Mitochondrial superoxide production was further stimulated by incubation with 1 μM antimycin A for 90 min, and MitoSOX fluorescence was measured under the same conditions.
Evaluation of ATP Level, Glucose Uptake and Lactate Formation
ATP was determined in cells seeded at 104 per well in 96-well plates in media containing either 4.5 g/L glucose and 50 mM or no 2DG using a luciferase-based assay (CellTiter-Glo Luminescent Assay, Promega). Results were normalised to the total protein level in cell lysates assessed by the bicinchoninic acid (BCA) method.
For glucose uptake, cells were pre-incubated in low-glucose (1 g/L) RPMI medium for 24 h at 37°C and 5% CO2, followed by 15 min incubation in normal DMEM (4.5 g/L glucose) in the presence of 50 μM 2-nitrobenzodeoxyglucose (Life Technologies); glucose uptake was then analysed by flow cytometry.
For lactate evaluation, cells were seeded at 105 per well in 96-well plates. Aliquots of the medium were used for the analysis of lactate using a colorimetric kit (Trinity Biotech) following 24 h incubation. Results were normalised to the total protein level in cell lysates.
Evaluation of NADH/NAD+ Ratio
Oxidized and reduced nicotinamide adenine dinucleotides (NAD+ and NADH, respectively) were assessed in cells seeded at 1.5 x 10⁴ per well in white-walled 96-well plates using the bioluminescent NADH/NAD+ Glo Assay (Promega). Luminescence intensity was acquired with a Tecan Infinite M200 Microplate Reader.
Analysis of Coenzyme Q
Cells were grown in 60 mm culture dishes, washed with PBS and scraped. Pellets were collected in conical-bottom cryotubes filled with argon and stored in liquid nitrogen. During the procedure, all solutions used were bubbled with argon and all sample preparation steps were carried out under an atmosphere of argon. Vials containing the cells were centrifuged briefly (1 min) at 800 rpm and 4°C, before 100 μL the HES buffer containing protease inhibitors (10 mM Hepes pH 7.4, 250 mM sucrose, 1 mM EDTA, 100 μM DTPAand 1:50 protease inhibitors) were added. Cell lysate (90 μL) was then added to 2 mL methanol containing 0.02% acetic acid, followed by 10 mL Milli Q water-washed hexane, mixed vigorously for 30 sec and the mixture centrifuged for 5 min at 900 x g and 4°C. The resulting hexane layer was removed, evaporated under vacuum using a rotary evaporator, the vacuum released under argon, and the residue re-dissolved in 140 μL argon-flushed solvent mixture (73.375% ethanol, 22.5% methanol, 3.75% isopropyl alcohol, 0.375% MilliQ water and 5 mM LiClO4.3H2O). The re-dissolved lipids (100 μL) were subjected to isocratic HPLC performed using a C18 column (Supelcosil 250 x 4.6 mm, 5 μm; Supelco, Sigma-Aldrich) with guard column eluted with 65% ethanol, 30% methanol, 3% isopropyl alcohol and 2% ammonium acetate (1 M, pH 4.4) at 1 mL/min, with mobile phase being bubbled gently with a stream of argon gas. CoQ9/CoQ10 and CoQ9H2/CoQ10H2 were determined by HPLC with coulometric multi-electrode electrochemical detection (CoulArray, Thermo Fisher Scientific), with the oxidation and reduction potentials set at +700 and −700 mV, respectively, and the gain range set at 100 nC. The concentrations of all analytes were determined from calibration curves generated using authentic standards of CoQ9 and CoQ10 (Sigma-Aldrich). Standards of CoQ9H2 and CoQ10H2 were prepared from CoQ9 and CoQ10, respectively, by reduction with sodium borohydrate (Frei et al., 1990). Concentrations of CoQ9, CoQ10, CoQ9H2 and CoQ10H2 were determined by UV-VIS spectrophotometry (Agilent Technologies Cary 100 UV-VIS) using ε275 nm for CoQ9 and CoQ10 of 14,700 and 14,240 M−1 cm−1, respectively, and ε290 nm for CoQ9H2 and CoQ10H2 of 4,120 and 4,010 M−1 cm−1, respectively (Podda et al., 1999).
Evaluation of Respiration and Glycolysis
As relevant, the high-resolution Oxygraph-2k respirometer (Oroboros) and the Seahorse XF96 Extracellular Flux Analyzer (Agilent Technologies) were used. Routine, CI- and CII-dependent respiration was assessed as published (Boukalova et al., 2016; Rohlenova et al., 2017). DHODH-dependent respiration was carried out as follows. In brief, cells were trypsinized, washed with PBS, re-suspended at 2x10⁶ cells per mL of the Mir05 medium (0.5 mM EGTA, 3 mM MgCl2, 60 mM K-lactobionate, 20 mM taurine, 10 mM KH2PO4, 110 mM sucrose, 1 g/L essentially fatty acid-free bovine serum albumin, 20 mM Hepes, pH 7.1 at 30°C) and transferred to the chamber of the Oxygraph-2k instrument (Oroboros). Respiration measurements were performed at 37°C. Cells were permeabilized with 5 μg digitonin per 106 cells and a CI inhibitor (0.3 μM rotenone) was added prior to the addition of the substrate. DHODH-mediated respiration was assessed by subtracting the residual respiration rate remaining after addition of 30 μM leflunomide from the respiration rate in the presence of 1 mM dihydroorotate (DHO), 3 mM ADP, and 10 μM cytochrome c.
For evaluation of CI-, CII- and DHODH-dependent respiration in tumors, freshly excised tissue was weighed, homogenised in a PBI-Shredder (Oroboros), re-suspended in Mir05 medium and transferred to the chamber of the Oxygraph-2k instrument. The total oxygen consumption was monitored in the absence and presence of specific inhibitors and substrates of CI (rotenone or glutamate/malate/pyruvate, respectively), CII (malonate or succinate, respectively) and DHODH (leflunomide and DHO, respectively). Carbonyl cyanide 3-chlorophenylhydrazone (CCCP) was titrated to obtain maximal uncoupled respiration rate. Residual oxygen consumption after antimycin A addition was subtracted from all results to obtain mitochondria-specific rates.
The Seahorse XF96 Extracellular Flux Analyzer was used for assessment of both cellular oxygen consumption rate (OCR) and extracellular acidification rate (ECAR) as described (Deus et al., 2017). Cells were seeded in XF96 cell culture microplates at 8x10⁴ per well in standard culture media. After 24 h, the medium was replaced by serum-free RPMI containing 5 mM glucose, 1 mM pyruvate, and 50 μg/mL uridine of the Mitostress kit and without supplementation for the Glycostress kit, with pH adjusted to 7.4. Cells were incubated at 37°C for 30 min to allow the temperature and pH of the medium to reach equilibrium before measurement. The assay protocol for mitochondrial respiration consisted of consecutive injection steps in which 1 μM oligomycin, 1 μM FCCP, and the combination of 0.5 μM rotenone and 0.5 μM antimycin A were added. For glycolytic measurements, 10 mM glucose, 1 μM oligomycin, and 50 mM 2-deoxy-D-glucose (2DG) were consecutively added. OCR and ECAR measurements were made using the 3 min mix and 5 min measure cycle. Results were analyzed by the XF Stress Test Report Generators (Agilent Technologies). The results were normalized to cellular protein.
DHODH Activity Assay
DHODH activity measurements were performed using a modified protocol according to Yin et al. (2017). In brief, cells were collected, washed with PBS, re-suspended in potassium phosphate buffer (0.1 M, pH 7.0) and lysed using three freeze-thaw cycles; the lysates were incubated in the solution of 160 mM K2CO3-HCl (pH 8.0), 400 μM DHO, 80 μM decylubiquinone at 37°C for 60 min. The reference sample was kept on ice. The reaction mixture was supplemented with 20 mM K2CO3, 2 mM K3[Fe(CN)6] and 1 mM 4-(trifluoromethoxy) benzamidoxime (4-TFMBAO), and heated at 80°C for 4 min. The reaction was stopped by cooling on ice and fluorescence intensity was measured using the Infinite M200 plate reader (Tecan); the excitation and emission wavelengths were 320 nm and 420 nm, respectively. The calibration curve was plotted using lysate-free samples containing 0.5, 0.75 and 1 μM orotic acid.
Cell-Cycle Analysis
For cell-cycle analysis, cells grown in medium without uridine for 48 h were pre-treated with 10 μM BrdU for 30 min 37°C, harvested and fixed with 500 μL of cold 80% EtOH added drop-wise during shaking, and incubated at −20°C. EtOH was then removed and 2M HCl was added for 30 min (room temperature) to denaturate DNA. HCl was removed and the pellet neutralised with 0.1M disodium tetraborate (pH 8.5) for 1 min. Cells were then incubated for 1 h with anti-BrdU-FITC IgG (BD Biosciences; 0.5 μg/mL of PBS) in the dark. Finally, cells were re-suspended in 150 μL of PSB containing 2.5 μg/mL propidium iodide and analysed by flow cytometry.
To assess G2 arrest, cells were grown in medium without uridine for 48 h and then treated with nocodazol (1 μg/mL) for 16 h. Cells (5x10⁴) re-suspended in 60 μL PBS were as above. After fixation, EtOH was removed and cells were re-suspended in 150 μL of PSB containing 2.5 μg/mL of propidium iodide and analysed by flow cytometry.
Western Blotting
Cells were lysed in the RIPA buffer supplemented with the Complete Protease Inhibitor Cocktail (Roche) and the Phosphatase Inhibitor Cocktail (Sigma-Aldrich). The lysate was cleared by centrifugation and total protein determined. 50 μg of total protein were resolved by SDS-PAGE and transferred to nitrocellulose membranes, which were then probed with the following antibodies: anti-TFAM IgG HPA040648, anti-mtSSB IgG HPA002866, anti-ATP5B IgG HPA001520 (all Sigma), anti-POLG IgG PA5-35163, anti-cyclin E IgG MA5-14336, anti-mtCO4 IgG PA5-29992 (all Thermo Fisher Scientific), anti-UMPS IgG sc-398086 (Santa Cruz Biotechnology), anti-CAD IgG 93925, anti-p(S1859)-CAD IgG 12662 (both Cell Signaling), anti-NDUFS3 IgG ab110246, anti-NDUFA9 IgG ab14713, anti-mtCO1 IgG Ab14705, anti-SDHB IgG ab14714 (all Abcam); anti-DHODH IgG was either from Santa Cruz Biotechnology (sc-166348) or from Proteintech (14877-1-AP).
Native Blue Gel Electrophoresis (NBGE)
NBGE was accomplished basically as published (Wittig et al., 2006). In brief, mitochondria were isolated using a Balch-style homogenizer as detailed elsewhere (Schmitt et al., 2013; Blecha et al., 2017). Digitonin-solubilised mitochondria were separated on NativePAGE Novex Bis-Tris 3%-12% gradient gels. After electrophoresis, the gels were incubated in transfer buffer containing 0.1% SDS for 10 min and proteins were transferred to PVDF membranes probed with specific antibodies against complex I (NDUFA9, ab14713, Abcam; or NDUFB8, ab110242, Abcam), CII (SDHA, 14715, Abcam), CIII (Core2, ab14745, Abcam), CIV (COXVa, ab110262, Abcam) and CV (ATP5A, ab14748, Abcam; or ATP5B, HPA001520, Sigma Aldrich), and VDAC1 (ab15895, Abcam) or HSP60 (12165S, Cell Signaling) as the loading control.
DNA Sequencing
Total DNA containing mtDNA was isolated via the DNAzol reagent (MRC) according to manufacturer’s instructions. Full-length mtDNA was sequenced by amplifying ten 1.8 kb dsDNA PCR products using the 5x HOT FIREPol Blend Master Mix with 10 mM MgCl2. PCR products were separated on agarose gels to confirm the specificity of the reaction and were purified using the DNA clean-and-concentrator kit (Zymoresearch). Purified products (200 to 400 ng) were combined with water and 0.5 μL of 100 μM primer stocks to yield 10 μL sequencing reaction mixture. Classical Sanger sequencing was performed via GACT Biotech sequencing service, and the resulting sequences aligned using the SeqManPro suite from the DNASTAR Lasergene 11 software.
mtDNA Level Assay
Total DNA was extracted using the AquaPure Genomic DNA Isolation Kit (BioRad). 50 ng of DNA was diluted with water to 4.5 μL, and 0.5 μL of the combined 10 μM forward and reverse primers added (for mtDNA, mMito1 primers; for nDNA mB2M1 primers; see Table S2 for sequences of primers) and 5 μL of 2xRT2 SYBR Green qPCR Mastermix (Qiagen) added. The reaction was run on the Eco qPCR System (Illumina) with the following setting: one cycle of 50°C for 2 min; one cycle of 95°C for 10 min; 40 cycles of 95°C for 15 s and 60°C for 1 min.
Quantitative Real-Time (Reverse Transcription) PCR
RNA was obtained in triplicate from 4T1- and 4T1ρ0-derived sublines using the RNeasy Mini Kit (Qiagen). The Revertaid First-Strand Synthesis System plus random hexamer primers (Fermentas) were used to reverse-transcribe total RNA into cDNA. Primers specific for all mitochondrial and nuclear encoded genes (see Table S2 for sequences of primers) were then assessed with 2x EvaGreen (Solis BioDyne) using the Eco qPCR System. Target genes were normalized to the housekeeping gene GAPDH, and change in gene expression was determined using the ΔΔCt method.
Single Cell qPCR
Single cell samples were obtained by automated FACS sorting (Influx, BD Biosciences). The cell suspension was filtered and nuclei stained with DAPI to identify viable cells. Individual cells were placed in 96 well plate at 1 cell per well containing 5 μl of nuclease-free water supplemented with 1 μg/μl BSA (ThermoFisher). The plate was sealed and placed on dry ice until use. Positive samples contained 100 sorted cells. Negative controls were medium only. For mtDNA analysis 80% of cell lysate was used (4 μl) in 10 μl of qPCR reagent following the manufacturer’s recommendations using Grandmastermix for probes (TATAA Biocenter) supplemented with 400 nM primers, 200 nM probes (Sigma Aldrich) (for sequences see Table below). We used the CFX 96 (BioRad) thermocycler as follows: 95°C for 30 s, 40 cycles of 95°C for 5 s, 57°C for 30 s with signal acquisition. Cq values were obtained using the subtracted baseline curve fit and the common threshold method with manual setting in the CFX manager 3.1. Data were analysed with Genex (MultiD) according to the MIQE guidelines (Bustin et al., 2009).
Table.
Primer and probe sequences used in sc/qPCR. Capital letters indicate LNA bases; polymorphism is shown in gray.
| m_4T1_12S_Fw | cttggtgatagctggtta |
| m_4T1_12S_Rv | ggcctacaatggttaaaag |
| m_4T1_12S_mut_HEX (parental 4T1) | aataGtgAaCaAttAaCaAaaca |
| m_4T1_12S_WT_FAM (host mouse) | aataGtgAaTaAttAaCaAaaca |
The annealing temperature for the 12S qPCR assay was optimized using a gradient run, validation of the FACS direct lysis for mtDNA was performed using 2-fold “serial dilution” sorting of 1, 2, 4, 8 up to 1024 cells per well and showed good linearity up to 128-256 cells (data not shown). Positive controls of 100 host cells, including all single cell samples showed no or negligible quantification of parental mtDNA. No template controls (NTC) as well as 4T1ρ0 cells were negative.
mTRIP Analysis
The fluorescence in situ hybridization analysis mTRIP (mitochondrial Transcription and Replication Imaging Protocol) was performed and analysed as previously described (Chatre and Ricchetti, 2013). Experiments were performed in the presence of proteinase K that reveals mitochondrial nucleic acids unmasked from proteins. Briefly, the mtDNA probes were labeled by nick translation of PCR products, incorporating either Atto488-dUTP or Atto550-dUTP (Jena Bioscience), using the commercial kit Atto488/Atto550 Nick Translation Labeling kit (Jena Bioscience. Mitochondrial coordinates of mREP correspond to the non-coding region 446-544, which is labelled when initiation of mtDNA replication is activated, and mTRANS to the coordinates of three distinct probes (1905-2866, which covers part of 16S rDNA; 7400-8518, which extends from COI end to ATP8; and 13416-14836 from ND5 end until the beginning of CYTB). Cells were cultured on slides, fixed, permeabilized, and denaturated with formamide. Cells were treated with 5μg/mL of proteinase K for 5 min at 37°C, then hybridized with the mREP and mTRANS probes for 16 h at 37°C. DNA was counterstained with 10 μg/mL Hoechst 33342. Confocal acquisition was performed using a spinning-disk Perkin-Elmer Ultraview RS Nipkow Disk, an inverted laser-scanning confocal microscope Zeiss Axiovert 200M with an Apochromat 63x/1.4 oil objective and a Hamamatsu ORCA II ER camera (Imagopole, CiTech, Institut Pasteur). Images were acquired using non-saturating settings, and the same imaging parameters were used for all samples. Optical slices were taken every 200-nm interval along the z-axis covering the whole depth of the cell, at resolution of 1024/1024 pixels. All acquisitions were post-treated using the same Intensity Range (Min/Max), Maximum Intensity Projection, and background correction using the Imaris software (Bitplane), which automatically performs pixel averaging. Three-dimensional (3D)-reconstruction was achieved using the IMARIS software. Original 2D images generated from 3D volume rendering were used for fluorescence quantification using a single-imaging frame collection and ImageJ software (postacquisition analysis). Graphic settings were applied to 2D images for the purpose of visualization (panels in figures). For each condition, one hundred 3D-reconstructed cells were analysed from three independent experiments.
Mitochondrial Chromatin Immunoprecipitation (mitoChIP) Assay
Cells were crosslinked with 1% formaldehyde, harvested, and cell pellets frozen. Pellets were then resuspended in the ChIP lysis buffer, sonicated for 12 min at cycles consisting of 15 s sonication at amplitude 5 (Qsonica Q700) and 30 s cooling in ice-water bath. An aliquot of the sheared chromatin was treated with RNAse A and proteinase K, and subjected to agarose electrophoresis to confirm correct shearing. Dynabeads were pre-absorbed with salmon sperm DNA (0.2 mg/mL) and BSA (0.5%) overnight, and 20 μL of bead slurry was combined with 5 μg of sheared chromatin and 1 μL of either anti-POLG1 IgG (Abcam, ab128899), anti-TFAM IgG (Abcam ab131607) or non-specific rabbit IgG, and incubated overnight on a rotating platform. After extensive washing, chromatin was eluted and treated with RNAseA and proteinase K to reverse the crosslinking, followed by purification using PCR clean-up columns (MachereyNagel). qRT-PCR was then run using the Eva Green system (Solis Biodyne) at 95°C for 12 min, 40 cycles of 95°C for 15 s, 60°C for 20 s, 72°C for 35 s, followed by melt curve analysis using primers for mouse mtDNA encompassing D-loop; the binding site of POLG: mPOLG ChIP F, TGA TCA ATT CTA GTA GTT CCC AAA A; mPOLG ChIP R, ACC TCT AAT TAA TTA TAA GGC CAGG. Data were quantified against a non-specific IgG via the AACt method.
Microarray Analysis
Transcriptomic analysis of parental, D0, D5, D10, D15, D20, D25 and D60 4T1 cells was performed using a standard protocol and the MouseGene 2.0 ST array (Affymetrix). The data are deposited under the accession number ArrayExpress: MTAB-6150 in the EBI ArrayExpress database.
Stimulated Emission Depletion (STED) Microscopy
Cells were grown on high precision coverslips overnight, fixed with 4% paraformaldehyde for 10 min at 37°C, permeabilized with 0.05% Triton X-100, 0.05% TWEEN-20 and 0.1 M glycin in PBS, blocked with 5% normal goat serum, and incubated with primary antibodies against DNA (PROGEN), TFAM (Abcam) or TOM20 (Santa Cruz Biotechnology). This was followed by appropriate secondary antibodies conjugated with Abberior STAR RED or Abberior STAR 580 (Abberior Instruments). Nuclei were labelled with Hoechst 33342 (Sigma-Aldrich). The coverslips were mounted on glass slides using Abberior Mount Liquid Antifade (Abberior Instruments). STED images were acquired on commercial Abberior STED 775 QUAD Scanning microscope (Abberior Instruments) equipped with Nikon CFI Plan Apo Lambda objective (60 x Oil, NA 1.40). Abberior STAR 580 and STAR RED labelled proteins were illuminated by pulsed 561 nm and 640 nm lasers and depleted by pulsed 775 nm STED depletion laser of 2D donut. Confocal images were acquired by illuminating the sample by cw 405 nm laser, all channels were obtained in line-interleaved acquisition mode. Fluorescence signal was filtered (emission bandpasses: 500-550 nm, 580-630 nm and 650-720 nm; pinhole 35 μm) and detected on single photon counting modules (Excelitas Technologies). Z-stacks of three planes in distance of 250 nm were acquired for each channel, images were scanned with pixel size of 25 x 25 nm and pixel dwell time 6 μs. All images were stabilized for drift, deconvolved with Huygens Professional version software 17.04 (Scientific Volume Imaging) using Classic Maximum Likelihood Estimation algorithm and processed by FiJi ImageJ software. The maximal intensity projection of 500 nm z-stack is shown.
Mitochondrial NADH Assessment
Mitochondrial NADH was assessed by two-photon microscopy using Zeiss LSM880 NLO inverted microscope equipped with Chameleon Ultra II and Compact OPO MP lasers (Coherent, Santa Clara, CA, USA) as described (Blecha et al., 2017); 3 independent experiments were performed, with more than 150 cells per condition imaged in each experiment.
Transmission Electron Microscopy (TEM)
Cells were grown on cover-slips, fixed with 2.5% glutaraldehyde (Agar Scientific) and post-fixed with 1% OsO4 made up in Sorensen’s phosphate buffer (0.1 M, pH 7.2-7.4), dehydrated, and embedded in Epon-Durkupan (Sigma-Aldrich). Ultrathin sections (~70-90 nm) were cut, contrasted with uranyl acetate (Agar Scientific), and examined in the Morgagni 268 transmission electron microscope (FEI) at 80 kV and in the TECNAI G2 20 LaB6 electron microscope (FEI) at 200 kV. Images were captured with Mega View III CCD camera (Olympus Soft Imaging Solutions) and Gatan Model 894 UltraScan 1000 camera (Gatan Incorporated).
Measurement of Dihydroorotate and Orotate
For measurement of DHO and orotate, 5x10⁶ cells were seeded in a 100 mm cell culture dish and incubated with growth medium at 37°C in 5% CO2. After 24 h, the cells were lysed for the metabolite extraction. All the cells were washed with DPBS two times and lysed with 2:1 methanol/chloroform mixture (total of 600 μL). The cell lysates were vortexed for 30 s, and incubated on liquid nitrogen for 60 s. It was then thawed at room temperature and 1:1 chloroform/water mixture (total of 400 μL) was added. After that, the lysates were centrifuged at 15,000 x g at 4°C for 30 min. The upper water phase was collected separately and evaporated using a centrifugal evaporator. The complete dried pellet samples were stored at −80°C until mass spectrometry analysis. Liquid chromatography-mass spectrometry (LC-MS) was done as described in Flux analysis of conversion of glutamine to UMP (see below).
Flux Analysis of Conversion of Glutamine to UMP
To evaluate UMP labeled with 13C3, 15N2 (M+5), 3x10⁶ cells were seeded in 100 mm cell culture dish with growth medium and incubated at 37°C in 5% CO2. After 24 h incubation, media were changed to 1 mM L-glutamine (13C5, 99%; 15N2, 99%; Cambridge Isotope Laboratories) containing medium, and the cells were labeled overnight. After that, the cells were lysed for the metabolite extraction. The dried pellet samples were dissolved with 1:1 acetonitrile/water mixture for mass spectrometry analysis. The Agilent 1100 Series HPLC System and XBridge Amide Column (3.5 μm, 4.6 mm x 100 mm; Waters) were used for the chromatography, with 20 mM ammonium acetate (pH was adjusted to 9 with ammonium hydroxide) and acetonitrile as mobile phases. API 2000 Mass Spectrometer with Analyst 1.6 Software (AB/SCIEX, Framingham) was used for the mass spectrometry analysis to measure DHOA, orotate and labeled UMP.
Analysis of Aspartate and Nucleotides
To measure aspartate and other nucleotides, 5x10⁵ cells were seeded in a 6-well cell culture dish and incubated with growth medium at 37°C in 5% CO2. The cells were lysed with 5:3:2 methanol/acetonitrile/water mixture (total of 200 μL). The lysates were centrifuged at 28,000 x g at 4°C for 30 min. The supernatant was collected separately and evaporated using a centrifugal evaporator. The Agilent 1290 Infinity LC System and SeQuant ZIC-pHILIC Column (5 μm, 150 mm x 2.1 mm; Merck KGaA, 64271 Darmstadt, Germany) were used for the chromatography, with 20 mM ammonium acetate (pH was adjusted to 9 with ammonium hydroxide) and acetonitrile as mobile phases. Agilent Technologies 6460 Triple Quad LC/MS with MassHunter Software (Agilent, United States) was used for the mass spectrometry analysis.
In Vivo Metabolic Studies
Balb/c mice with 4T1 and 4T1ρ0 AOX cell-derived tumors (volume of about 150 mm3) were infused with 13C5, 15N2-Gln (Sigma-Aldrich) according to a published protocol (Mashimo et al., 2014). Briefly, mice were anaesthetised with isoflurane and their jugular vein cannulated. The animals were then infused with labelled Gln at 0.28 mg/g body weight (in 0.3 mL saline) over 1 min and with Gln at 0.005 mg/g body weight (in 600 μL saline) at 200 μL/h for 180 min. After infusion, the mice were sacrificed and tumors excised. Tumor tissue was homogenised and assessed for labelled UMP as described above.
Mutation Rates of Genes in the De Novo Pyrimidine Biosynthesis Pathway
We obtained all somatic mutations from The Cancer Genome Atlas (TCGA), which contains 11,330 patients of 33 cancer types. Mutation maf files were downloaded from Firehose (http://gdac.broadinstitute.org/). The average gene expression levels (microarray RMA, log2ratio) for all genes in cancer cells were derived from 91 CCLE (Cancer Cell Line Encyclopedia) cell lines. Cancer genes were retrieved from CGC (cancer gene census, http://cancer.sanger.ac.uk/census COSMIC v81). To facilitate calculation of mutation rates, we excluded those cancer genes that are affected by translocation, amplifications or large deletions. This led to 262 cancer genes in which 67 are annotated as oncogenes, 100 as tumor suppressors. We calculated the raw mutation rate of a gene according to the number of mutations per base pair in the coding sequence (CDS) and normalised by sample size. For comparison, we used the mutation rates of 15,067 non-cancer genes as a background after excluding 1,090 genes lacking expression information and 2,440 putative cancer genes from CGC, uniprot oncogenes Proto-oncogenes/Tumor suppressor genes, NCG (Network of Cancer Genes) and DISEASE. They were firstly divided into 20 bins according to gene expression levels. An error bar was then calculated for each bin, marking 75 quantile, 25 quantile and median mutation rates, respectively. We then fitted a baseline for mutation rates of non-cancer genes using the generalised additive model (GAM). Because different genes have different background (random) mutation rates, we utilised MutsigCV, which employs a sophisticated model for estimating gene-specific and patient-specific background mutation rate and calculating significantly mutated genes (Q-score, the smaller Q-score, the higher significance). For MutsigCV calculation, the combined pan-cancer mutation maf file was used as input and all other input files and default options were kept. Data analysis and visualisation were conducted in R using packages dplyr and ggplot2.
Evaluation of Cell Proliferation in Tumor Tissue
Immunohistochemistry was performed using paraffin-embedded tissue section (7 μm). Sections were dehydrated, heated in citrate buffer (70 mM, pH 6.0) for antigen retrieval, and blocked with PBS containing 10% normal goat serum (Jackson Immuno Research Labs) and 0.1% Tween 20 (Sigma). Anti-Ki67 IgG was purchased from Cell Signaling, the secondary antibody coupled to AlexaFluor 594 from Jackson Immuno Research Labs. To detect cell nuclei, sections were mounted on histology mounting medium Fluoroshield with DAPI (Sigma). The sections were imaging with fluorescence microscope Nikon Eclipse E400.
Evaluation of Pyruvate
The levels of pyruvate in tumor and liver tissue were measured using a colorimetric assay (Abcam) according to the manufacturer’s instructions. In brief, serum from mice with and without tumors, and from cancer patients and healthy subjects, as well as mouse tumor and liver tissue (10 mg) was collected, washed with cold PBS, and lysed in the pyruvate assay buffer; the supernatant was collected by centrifugation at 20,000 x g for 5 min at 4°C. The reaction assay mixture (50 μL), prepared according to the manufacturer’s instructions, was then added to each well containing 50 μL of the sample. The colorimetric signal was evaluated at 570 nm using the Tecan Infinite M200 plate reader. The following cancer patient serum was used in the analysis: colorectal cancer (7 patients), pancreatic cancer (9 patients), gastric cancer (1 patient), B-cell lymphoma (1 patient).
Formation of Syngeneic Tumors
4T1, 4T1ρ0 (D0), D5, D10, D15 and D20 cells, D0 AOX, D5 AOX, D10 AOX, D15 AOX and D20 AOX cells, DHODHKO42 and DHODHrec cells, and ρ0 AOX and ATP5BKO7 cells were injected subcutaneously (s.c.) into the right flank of female Balb/c mice at 106 cells per animal. To examine the effect of uridine on tumor formation, 10 Balb/c mice were grafted with 106 4T1ρ0 cells. Two days later, uridine (1 g/kg) was administered by intra-peritoneal injection to 5 mice 3 times per week (Peters et al., 1988), with the remaining 5 mice kept as control animals. To examine the effect of Met, Lef and SHAM on growth of tumors derived from 4T1ρ0 AOX cells, the respective agent was administered by intra-peritoneal injection twice a week for 28 days as soon as USI-detectable tumors appeared in the mice. The following dosing was used: SHAM, 200 mg/kg in 5% DMSO in corn oil; lefluomide, 20 mg/kg in corn oil containing 4% ethanol; metformin, 125 mg/kg in PBS. Tumors were visualized and their volume precisely calculated using the USI device Vevo770 or Vevo3100 (Fuji Film). The experiments were terminated when tumor volume reached about 1,000 mm3. Animal studies were performed according to the guidelines of the Australian and New Zealand Council for the Care and Use of Animals in Research and Teaching, as well as the Czech Animal Ethics Committee, and were approved by the respective local Animal Ethics Committee.
Statistical Analysis
Unless stated otherwise, data are mean values ± S.D. of at least three independent experiments. In mouse experiments, groups of 6 animals were used, unless stated otherwise. The two-tailed unpaired Student’s t test was used to assess statistical significance with p<0.05 being regarded as significant, using GraphPad Prism software. Anova was used for multiple comparisons where applicable. Images are representative of at least three independent experiments.
Supplementary Material
KEY RESOURCES TABLE
| REAGENT or RESOURCE | SOURCE | IDENTIFIER |
|---|---|---|
| Antibodies | ||
| anti-BrdU-FITC IgG | BD Biosciences | 340649 |
| anti-TFAM IgG | Sigma-Aldrich | HPA040648 |
| anti-SSB IgG | Sigma-Aldrich | HPA002866 |
| anti-ATP5B IgG | Sigma-Aldrich | HPA001520 |
| anti-POLG IgG | Thermo Fisher Scientific | PA5-35163 |
| anti-cyclin E IgG | Thermo Fisher Scientific | MA5-14336 |
| anti-mtCO4 IgG | Thermo Fisher Scientific | PA5-29992 |
| anti-UMPS IgG | Santa Cruz Biotechnology | sc-398086 |
| anti-DHODH IgG | Santa Cruz Biotechnology | sc-166348 |
| anti-TOM20 IgG | Santa Cruz Biotechnology | sc-136211 |
| anti-CAD IgG | Cell Signaling | 93925 |
| anti-p(S1859)-CAD IgG | Cell Signaling | 12662 |
| anti-HSP60 IgG | Cell Signaling | 12165S |
| anti-Ki67 IgG | Cell Signaling | 9129 |
| anti-NDUFS3 IgG | Abcam | ab110246 |
| anti-NDUFA9 IgG | Abcam | ab14713 |
| anti-NDUFB8 IgG | Abcam | ab110242 |
| anti-mtCO1 IgG | Abcam | ab14705 |
| anti-COXVa IgG | Abcam | ab110262 |
| anti-SDHA IgG | Abcam | ab14715 |
| anti-SDHB IgG | Abcam | ab14714 |
| anti-Core2 IgG | Abcam | ab14745 |
| anti-ATP5A IgG | Abcam | ab14748 |
| anti-VDAC IgG | Abcam | ab15895 |
| anti-TFAM IgG | Abcam | ab47517 |
| anti-DHODH IgG | Proteintech | 14877-1-AP |
| anti-DNA IgG | PROGEN | 61014 |
| Critical Commercial Assays/Kits | ||
| NADH/NAD Glo Assay | Promega | G9071 |
| ATP CellTiter Glo Assay | Promega | G9241 |
| Seahorse XF Cell Mito Stress Test Kit | Agilent | 103015-100 |
| Seahorse XF Glycolysis Stress TestKit | Agilent | 103020-100 |
| Colorimetric pyruvate assay | Abcam | ab65342 |
| Pierce BCA Protein Assay Kit | Thermo Fisher Scientific | #23225 |
| Atto488 NT Labeling Kit | Jena Bioscience | PP-305S-488 |
| Atto550 NT Labeling Kit | Jena Bioscience | PP-305S-550 |
| Chemicals, Peptides and Recombinant Proteins | ||
| ATP | Sigma-Aldrich | A1852 |
| 2-nitrobenzodeoxyglucose | Thermo Fisher Scientific | N13195 |
| Dihydroorotic acid | Sigma-Aldrich | D7128 |
| Orotic acid | TCI | 50887-69-9 |
| 6-thioguanine | Sigma-Aldrich | A4882 |
| Metformin | Metformin | 04635 |
| Leflunomide | Sigma-Aldrich | L5025 |
| Salicylhydroxamic acid | Sigma-Aldrich | S607 |
| 13C5,15N2-glutamine | Sigma-Aldrich | 607983 |
| 13C5,15N2-glutamine | Cambridge Isotope Laboratories | CNLM-1275-H-0.1 |
| Coenzyme Q9 | Santa Cruz Biotechnology | sc-207451 |
| Coenzyme Q10 | Fluka | 27595 |
| Tetramethylrhodamine ethyl ester | Sigma-Aldrich | 87917 |
| Carbonyl cyanide-4-(trifluoromethoxy) phenylhydrozone | Sigma-Aldrich | C2920 |
| Carbonyl cyanide-3-chlorophenylhydrozone | Sigma-Aldrich | C2759 |
| Oligomycin | Sigma-Aldrich | O4876 |
| Antimycin A | Sigma-Aldrich | A8474 |
| 2-deoxyglucose | Sigma-Aldrich | D8375 |
| 4-(trifluoromethoxy) benzamidoxime | Sigma-Aldrich | 422231 |
| ADP | Sigma-Aldrich | A5285 |
| Cytochrome c | Sigma-Aldrich | C7752 |
| Rotenone | Sigma-Aldrich | R8875 |
| Digitonin | Fluka | 37008 |
| K-lactobionate | Sigma-Aldrich | 153516 |
| Nocodazol | Sigma-Aldrich | M1404 |
| Fluoroshield with DAPI | Sigma-Aldrich | F6057 |
| MitoSOX | Thermo Fisher Scientific | M36008 |
| Decylubiquinone | Sigma-Aldrich | D7911 |
| Deposited Data | ||
| Microarray Analysis Data | EBI ArrayExpress Database | ArrayExpress: MTAB-6150 |
| Experimental Models: Cell Lines | ||
| 4T1 | ATCC | CRL-2539 |
| B16 | ATCC | CRL-6323 |
| MCF-7 | ATCC | HTB-22 |
| MDA-MB-231 | ATCC | HTB-26 |
| HeLa | ATCC | CCL-2 |
| 143B | ATCC | CRL-8303 |
| P815 | ATCC | TIB-64 |
| PaTu8902 | DSMZ | ACC-179 |
| PANC-1 | ATCC | CRL-1469 |
| Experimental Models: Organisms/Strains | ||
| C57BL/6 mice | Jackson Laboratories | C57BL/6 |
| Balb-c mice | Jackson Laboratories | Balb-c |
| C57BL/6su9-DsRed2 mice | Our laboratory | Dong et al., 2017 |
| Oligonucleotides | ||
| Forward mouse DHODH cloning primer | Sigma-Aldrich | AAA GAA TTC CAC CAT GGC GTG GAG ACA GCT G |
| Reverse mouse DHODH cloning primer | Sigma-Aldrich | ATA AAG GAT CCT CAC CTG CGG TGA TCT ACT C |
| Forward guide mouse DHODH | Sigma-Aldrich | CAC CGT CAG GTA CTC GGC GTA GAA A |
| Reverse guide mouse DHODH | Sigma-Aldrich | AAA CTT TCT ACG CCG AGT ACC TGA C |
| Forward guide mouse ATP5B | Sigma-Aldrich | CAC CGC ACT GCC ACC GGG CGA ATC G |
| Reverse guide mouse ATP5B | Sigma-Aldrich | AAA CCG ATT CGC CCG GTG GCA GTG C |
| Primer for 4T1_12S forward primer | This paper | ctt ggt gat agc tgg tta |
| Primer for 4T1_12S forward primer | This paper | ggc cta caa tgg tta aaa g |
| Probe for 4T1_12S_mut_HEX | This paper | aat aGt gAa CaA ttA aCa Aaa ca |
| Probe for 4T1_12S_mut_HEX | This paper | aat aGt gAa TaA ttA aCa Aaa ca |
| Primer for POLG binding site, forward | This paper | TGA TCA ATT CTA GTA GTT CCC AAA A |
| Primer for POLG binding site, reverse | This paper | ACC TCT AAT TAA TTA TAA GGC CAG G |
| Primers for q(RT-)PCR | This paper | Table S2 |
| Forward mREP | Eurogentec | ATA TGA CTA TCC CCT TCC CC |
| Reverse mREP | Eurogentec | AGT TTA ATG GGC CCG GAG CG |
| Forward mTRANS (MT1, MT6, MT11 mix)_ MT1 | Eurogentec | GTT AAT GTA GCT TAA TAA |
| Reverse mTRANS (MT1, MT6, MT11 mix)_MT1 | Eurogentec | TTC CAA GCA CAC TTT CCA |
| Forward mTRANS (MT1, MT6, MT11 mix_MT6 | Eurogentec | CCC ATT CCA ACT TGG TCT |
| Reverse mTRANS (MT1, MT6, MT11 mix_MT6 | Eurogentec | AAT GAT GGC TAC AAC GAT |
| Forward mTRANS (MT1, MT6, MT11 mix)_MT11 | Eurogentec | GTC ATC TCA TAT AAT ATT |
| Reverse mTRANS(MT1, MT6, MT11 mix)_MT11 | Eurogentec | TCG ACA AAT GTG TGT TAC |
| Recombinant DNA | ||
| Salmon sperm DNA | Sigma-Aldrich | 438545-06-3 |
| pXPR_001 | Addgene | 49535 |
| pCDH-CMV-MCS-EF1-Puro | SBI System Biosciences | CD510B-1 |
| pWPI-AOX-IRES-GFP | Gift from N. Chandel | Martínez-Reyes et al., 2016 |
| Software and Algorithms | ||
| Image J | Fiji | http://Fiji.sc/ |
| Photoshop | Adobe | http://www.adobe.com/uk/products/photoshop.html |
| Prism | GraphPad | http://graphpad.com/scientific-software/prism/ |
| SeqManPro | DNASTAR Lasergene 11 | https://www.dnastar.com/software/ |
| CFX Manager 3.1 | BioRad | http://www.bio-rad.com/en-cz/product/cfx-manager-software?ID=aed9803d-cb4d-4ecb-9263-3efc9e650edb |
| Genes (MultiD) | MIQE guidelines | Bustin et al., 2009 |
| Huygens Professional version software 17.04 | Scientific Volume Imaging | https://svi.nl/HuygensSoftware |
| Classic Maximum Likelihood Estimation algorithm | https://svi.nl/ClassicMaximumLikelihoodEstimation | |
| R | Open source | https://www.r-project.org/ |
| Tidyverse R packages | Rstudio | https://www/tidyverse.org/ |
| Analyst 1.6 Software | SCIEX | https://sciex.com/products/software/analyst-software |
| MassHunter Software | Agilent | https://www.agilent.com/en/products/software-informatics/masshunter-suite/masshunter/masshunter-software |
| IMARIS 8.0 | BitPlane | http://www.bitplane.com/releasenotes/imaris800.aspx |
| Other | ||
| DMEM | Lonza | BE12-708F |
| RPMI medium | Lonza | 12-115Q |
| Fetal calf serum | Sigma-Aldrich | F7524 |
| Penicillin/streptomycin | Sigma-Aldrich | P3032/S9137 |
| Uridine | Sigma | U3750 |
| Pyruvate | Sigma | P5280 |
| Protease Inhibitor Cocktail | Roche | 39102.01 |
| Phsophatase Inhibitor Cocktail | Sigma-Aldrich | P5726-5ML |
| RNAzol reagent | MRC | RB190/100 |
| HOT FIREPol Blend Master Mix | Solis BioDyne | 08-36-00020 |
| DNA clean-and-concentration kit | Zymo Research | D5205 |
| AquaPure Genomic DNA Isolation Kit | BioRad | 732-6340 |
| 2xRT2SYBR Green qPCR Mastermix | Qiagen | 330500 |
| RNAeasy Mini Kit | Qiagen | 74104 |
| Revertaid First-Strand Synthesis System | Fermentas | K1621 |
| EvaGreen | Solis BioDyne | 08-24-00001 |
| Grandmaster for probes | TATAA Biocenter | TA02-625 |
| RNAse A | Sigma-Aldrich | R6513 |
| Proteinase K | Sigma-Aldrich | P4032 |
| Proteinase K | Eurobio | GEXPRK01-B05 |
| PCR clean-up columns | Machery Nagel | 740609 |
| Affymetrix MouseGene 2.0 ST Array | Thermo Fisher | 902119 |
| Triton X-100 | Sigma-Aldrich | X100 |
| TWEEN-20 | Sigma-Aldrich | P1379 |
| Abberior Mount Liquid Antifade | Abberior Instruments | 4-0100-004-3 |
| Lipofectamine 3000 | ThermoFisher | L3000008 |
| FastDigest Esp3I | ThermoFisher | FD0454 |
| FastDigest EcoRI | ThermoFisher | FD0274 |
| FastDigest BamHI | ThermoFisher | FD0055 |
| Puromycin | Invivogen | ant-pr-1 |
| Q5 High-Fidelity DNA Polymerase | New England Biolabs | M0491S |
| XBridge Amide Column | Waters | Part#186004868 |
| SeQuant ZIC-pHILIC Column | Merck | Cat#1504600001 |
| XBridge Amide Column | Waters | Part#186004868 |
Highlights.
Tumorigenesis depends on functional OXPHOS
OXPHOS-derived ATP is not required for tumor formation
DHODH-driven pyrimidine biosynthesis requires CoQ redox-cycling
CoQ redox-cycling via OXPHOS drives tumorigenesis through pyrimidine biosynthesis
ACKNOWLEDGMENTS
This work was supported in part by an Australian Research Council Discovery grant, Czech Science Foundation grants (15-02203S, 16-12719S, 17-07635S, and 17-0192J) and Czech Health Research Council grants (16-31604A and 17-30138A) to J.N., Czech Science Foundation grants (17-20904S and 16-22823S) to J.R., a Czech Science Foundation grant (16-12816S) to J.T., Czech Science Foundation grant (18-11275S) to K.D.-H., Czech Science Foundation grant (18-02550S) to S.H., by the institutional support from Czech Academy of Sciences (RVO: 86652036), by the Ministry of Education, Youth and Sports of the Czech Republic within the LQ1604 National Sustainability Program II (Project BIOCEV-FAR), and by the by the ERDF projects BIOCEV (CZ.1.05/1.100) and Mitenal (CZ.2.16/3.1.00/21531). Y.Z. was supported in part by the National Health and Medical Research Council (1059775 and 1083450). P.J.O. was funded in part by FEDER funds through the Operational Program Competitiveness Factors - COMPETE and national funds by FCT - Foundation for Science and Technology under projects PTDC/DTP-FTO/2433/2014, POCI-01-0145-FEDER-016659, POCI-01-0145-FEDER-007440, and POCI-01-0145-FEDER-016390:CANCEL STEM. R.S. acknowledges support from the National Health & Medical Research Council Senior Principal Research Fellowship 1111632, M.V.B. was supported by the Health Research Council of New Zealand, the Cancer Society of New Zealand and the Malaghan Institute, K.P. was supported by the Intramural Research Program of the NIH, NICHD, and M.S. and P.H. were supported by the Technology Agency of the Czech Republic (TE01020118). This work was also supported by the framework of international cooperation program (NRF-2016K2A9A1A06921853) and from a National Research Foundation of Korea (NRF) grant funded by the Korea government (MSIT) (NRF-2018R1A3B1052328). L.C. and M.R. were supported by DARRI (PasteurInnov 14/152). A.R.C. was supported by the FCT PhD scholarship SFRH/BD/103399/2014. M.B., Z.E., S.M.N., and E.D. were supported by the Grant Agency of Charles University (GA UK 362015, GA UK 1100217, GA UK 1552218, and GA UK 1560218, respectively). We acknowledge the Imaging Methods Core Facility at the BIOCEV supported by the Czech-BioImaging large RI project (LM2015062 funded by MEYS CR) and by the by the MEYS CR (CZ.02.1.01/0.0/0.0/16_013/0001775 Czech-BioImaging). We acknowledge as well the Electron Microscopy Core Facility at the IMG supported by the MEYS CR (LM2015062 Czech-BioImaging). We thank N.S. Chandel for providing the pWPI-AOX-IRES-GFP vector, C. Suarna for technical assistance with CoQ analysis, and C. Deus, T. Martins, and R. Couto for technical assistance with Seahorse analyses, and to T. Mracek for fruitful discussions.
Footnotes
SUPPLEMENTAL INFORMATION
Supplemental Information includes seven figures and two tables and can be found with this article online at https://doi.org/10.1016/j.cmet.2018.10.014.
DECLARATION OF INTERESTS
The authors declare that they have no competing interests.
REFERENCES
- Acin-Perez R, Fernandez-Silva R, Peleato ML, Perez-Martos A, and Enriquez JA (2008). Respiratory active mitochondrial supercomplexes. Moi. Ceil 32, 529–539. [DOI] [PubMed] [Google Scholar]
- Adam-Vizi V, and Chinopoulos C (2006). Bioenergetics and the formation of mitochondrial reactive oxygen species. Trends Pharmacol. Sci 27, 639–645. [DOI] [PubMed] [Google Scholar]
- Aiistar A, Morris BB, Desnoyer R, Kiepin HD, Hosseinzadeh K, Clark C, Cameron A, Leyendecker J, Topaloglu U, Boteju LW, et al. (2017). Safety and tolerability of the first-in-class agent CPI-613 in combination with modified FOLFIRINOX in patients with metastatic pancreatic cancer: a single-centre, open-label, dose-escalation, phase 1 trial. Lancet Oncol. 18, 770–778. [DOI] [PMC free article] [PubMed] [Google Scholar]
- Althoff T, Mills DJ, Popot JL, and Kühlbrandt W (2011). Arrangement of electron transport chain components in bovine mitochondrial supercomplex I1III2IV1. EMBO J. 30, 4652–4664. [DOI] [PMC free article] [PubMed] [Google Scholar]
- Anso E, Weinberg SE, Diebold LP, Thompson BJ, Malinge S, Schumacker PT, Liu X, Zhang Y, Shao Z, Steadman M, et al. (2017). The mitochondrial respiratory chain is essential for haematopoietic stem cell function. Nat. Cell Biol 19, 614–625. [DOI] [PMC free article] [PubMed] [Google Scholar]
- Aslakson CJ, and Miller FR (1992). Selective events in the metastatic process defined by analysis of the sequential dissemination of subpopulations of a mouse mammary tumor. Cancer Res. 52, 1399–1405. [PubMed] [Google Scholar]
- Ayer A, Macdonald P, and Stocker R (2015). CoQ10 function and role in heart failure and ischemic heart disease. Annu. Rev. Nutr 35, 175–213. [DOI] [PubMed] [Google Scholar]
- Bayona-Bafaluy MP, Acín-Pérez R, Mullikin JC, Park JS, Moreno- Loshuertos R, Hu P, Pérez-Martos A, Fernández-Silva P, Bai Y, and Enríquez JA (2003). Revisiting the mouse mitochondriai DNA sequence. Nucl. Acids Res 31, 5349–5355. [DOI] [PMC free article] [PubMed] [Google Scholar]
- Bezawork-Geleta A, Wen H, Dong LF, Yan B, Vider J, Boukalova S, Krobova L, Vanova K, Zobalova R, Sobol M, et al. (2018). Alternative assembly of respiratory complex II connects energy stress to metabolic checkpoints. Nat. Commun 9, 2221. [DOI] [PMC free article] [PubMed] [Google Scholar]
- Birsoy K, Wang T, Chen WW, Freinkman E, Abu-Remaileh M, and Sabatini DM (2015). An essential role of the mitochondrial electron transport chain in cell proliferation is to enable aspartate synthesis. Cell 162, 540–551. [DOI] [PMC free article] [PubMed] [Google Scholar]
- Blecha J, Magalhaes Novais S, Rohlenova K, Novotna E, Lettlova S, Schmitt S, Zizchka H, Neuzil J, and Rohlena J (2017). Antioxidant defense in quiescent cells determines selectivity of electron transport chain inhibition- induced cell death. Free Radic. Biol. Med 112, 253–266. [DOI] [PubMed] [Google Scholar]
- Boukalova S, Stursa J, Werner L, Ezrova Z, Cerny J, Bezawork-Geleta A, Pecinova A, Dong LF, Drahota Z, and Neuzil J (2016). Mitochondrial targeting of metformin enhances its activity against pancreatic cancer. Mol. Cancer Ther 15, 2875–2886. [DOI] [PubMed] [Google Scholar]
- Brandon M, Baldi P, and Wallace DC (2006). Mitochondrial mutations in cancer. Oncogene 25, 4647–4662. [DOI] [PubMed] [Google Scholar]
- Brown KK, Spinelli JB, Asara JM, and Toker A (2017). Adaptive reprogramming of de novo pyrimidine synthesis is a metabolic vulnerability in triple negative breast cancer. Cancer Discov. 7, 391–399. [DOI] [PMC free article] [PubMed] [Google Scholar]
- Bustin SA, Benes V, Garson JA, Hellemans J, Huggett J, Kubista M, Mueller R, Nolan T, Pfaffl MW, Shipley GL, et al. (2009). The MIQE guidelines: minimum information for publication of quantitative real-time PCR experiments. Clin. Chem 55, 611–622. [DOI] [PubMed] [Google Scholar]
- Calvo SE, Klauser CR, and Mootha VK (2015). MitoCarta 2.0: an updated inventory of mammalian mitochondrial proteins. Nucleic Acids Res. 44, D1251–D1257. [DOI] [PMC free article] [PubMed] [Google Scholar]
- Campanella M, Casswell E, Chong S, Farah Z, Wieckowski MR, Abramov AY, Tinker A, and Duchen MR (2008). Regulation of mitochondrial structure and function by the F1F0-ATPase inhibitor protein, IF1. Cell Metab. 8, 13–25. [DOI] [PubMed] [Google Scholar]
- Cardaci S, Zheng L, MacKay G, van den Broek NJ, MacKenzie ED, Nixon C, Stevenson D, Tumanov S, Bulusu V, Kamphorst JJ, et al. (2015). Pyruvate carboxylation enables growth of SDH-deficient cells by supporting aspartate biosynthesis. Nat. Cell Biol 17, 1317–1326. [DOI] [PMC free article] [PubMed] [Google Scholar]
- Chatre L, and Ricchetti M (2013). Prevalent coordination of mitochondrial DNA transcription and initiation of replication with the cell cycle. Nucl. Acids Res 41, 3068–3078. [DOI] [PMC free article] [PubMed] [Google Scholar]
- Cogliati S, Frezza C, Soriano ME, Varanita T, Quintana-Cabrera R, Corrado M, Cipolat S, Costa V, Casarin A, Gomes LC, et al. (2013). Mitochondrial cristae shape determines respiratory chain supercomplexes assembly and respiratory efficiency. Cell 155, 160–171. [DOI] [PMC free article] [PubMed] [Google Scholar]
- Daum B, Walter A, Horst A, Osiewacz HD, and Kühlbrandt W (2013). Age-dependent dissociation of ATP synthase dimers and loss of inner-membrane cristae in mitochondria. Proc. Natl. Acad. Sci. U S A 110,15301–15306. [DOI] [PMC free article] [PubMed] [Google Scholar]
- Deus CM, Serafim TL, Magalhaes-Novais S, Vilaca A, Moreira AC, Sardao VA, Cardoso SM, and Oliveira PJ (2017). Sirtuin 1-dependent re- sveratrol cytotoxicity and pro-differentiation activity on breast cancer cells. Arch. Toxicol 91, 1261–1278. [DOI] [PubMed] [Google Scholar]
- Dong LF, Kovarova J, Bajzikova M, Bezawork-Geleta A, Svec D, Endaya B, Sachaphibulkij K, Coelho AR, Sebkova N, Ruzickova A, et al. (2017). Horizontal transfer of whole mitochondria restores tumorigenic potential in mitochondrial DNA-deficient cancer cells. Elife 6, e22187. [DOI] [PMC free article] [PubMed] [Google Scholar]
- Frei B, Kim MC, and Ames BN (1990). Ubiquinol-10 is an effective lipid- soluble antioxidant at physiological concentrations. Proc. Natl. Acad. Sci. U S A 87, 4879–883. [DOI] [PMC free article] [PubMed] [Google Scholar]
- Garcia-Bermudez J, Baudrier L, La K, Zhu XG, Fidelin J, Sviderskiy VO, Papagiannakopoulos T, Molina H, Snuderl M, Lewis CA, et al. (2018). Aspartate is a limiting metabolite for cancer cell proliferation under hypoxia and in tumours. Nat. Cell Biol 20, 775–781. [DOI] [PMC free article] [PubMed] [Google Scholar]
- Goveia J, Pircher A, Conradi LC, Kalucka J, Lagani V, Dewerchin M, Eelen G, DeBerardinis RJ, Wilson ID, and Carmeliet P (2016). Meta-analysis of clinical metabolic profiling studies in cancer: challenges and opportunities. EMBO Mol. Med 8, 1134–1142. [DOI] [PMC free article] [PubMed] [Google Scholar]
- Greene S, Watanabe K, Braatz-Trulson J, and Lou L (1995). Inhibition of dihydroorotate dehydrogenase by the immunosuppressive agent leflunomide. Biochem. Pharmacol 50, 861–867. [DOI] [PubMed] [Google Scholar]
- Gregoire M, Morais R, Quilliam MA, and Gravel D (1984). On auxotrophy for pyrimidines of respiration-deficient chick embryo cells. Eur. J. Biochem 142, 49–55. [DOI] [PubMed] [Google Scholar]
- Gu J, Wu M, Guo R, Yan K, Lei J, Gao N, and Yang M (2016). The architecture of the mammalian respirasome. Nature 537, 639–643. [DOI] [PubMed] [Google Scholar]
- Guarás A, Perales-Clemente E, Calvo E, Acín-Pérez R, Loureiro-Lopez M, Pujol C, Martínez-Carrascoso I, Nuñez E, García-Marqués F, Rodríguez-Hernández MA, et al. (2016). The CoQH2/CoQ ratio serves as a sensor of respiratory chain eficiency. Cell Rep. 15, 197–209. [DOI] [PubMed] [Google Scholar]
- Guzy RD, Sharma B, Bell E, Chandel NS, and Schumacker PT (2008). Loss of the SdhB, but not the SdhA, subunit of complex II triggers reactive oxygen species-dependent hypoxia-inducible factor activation and tumori- genesis. Mol. Cell. Biol 28, 718–731. [DOI] [PMC free article] [PubMed] [Google Scholar]
- Hakkaart GA, Dassa EP, Jacobs HT, and Rustin P (2006). Allotopic expression of a mitochondrial alternative oxidase confers cyanide resistance to human cell respiration. EMBO Rep. 7, 341–345. [DOI] [PMC free article] [PubMed] [Google Scholar]
- He T, Haapa-Paananen S, Kaminskyy VO, Kohonen P, Fey V, Zhivotovsky B, Kallioniemi O, and Perälä M (2014). Inhibition ofthe mitochondrial pyrimidine biosynthesis enzyme dihydroorotate dehydrogenase by doxorubicin and brequinar sensitizes cancer cells to TRAIL-induced apoptosis. Oncogene 33, 3538–3549. [DOI] [PubMed] [Google Scholar]
- Hensley CT, Faubert B, Yuan Q, Lev-Cohain N, Jin E, Kim J, Jiang L, Ko B, Skelton R, Loudat L, et al. (2016). Metabolic heterogeneity in human lung tumors. Cell 164, 681–694. [DOI] [PMC free article] [PubMed] [Google Scholar]
- Hosseini M, Dousset L, Mahfouf W, Serrano-Sanchez M, Redonnet- Vernhet I, Mesli S, Kasraian Z, Obre E, Bonneu M, Claverol S, et al. (2018). Energy metabolism rewiring precedes UVB-induced primary skin tumor formation. Cell Rep. 23, 3621–3634. [DOI] [PubMed] [Google Scholar]
- Karnkowska A, Vacek V, Zubáčová Z, Treitli SC, Petrželková R, Eme L, Novák L, Žárský V, Barlow LD, Herman EK, et al. (2016). A eukaryote without a mitochondrial organelle. Curr. Biol 26, 1274–1284. [DOI] [PubMed] [Google Scholar]
- Khutornenko AA, Roudko VV, Chernyak BV, Vartapetian AB, Chumakov PM, and Evstafieva AG (2010). Pyrimidine biosynthesis links mitochondrial respiration to the p53 pathway. Proc. Natl. Acad. Sci. U S A 107, 12828–12833. [DOI] [PMC free article] [PubMed] [Google Scholar]
- Kim J, Hu Z, Cai L, Li K, Choi E, Faubert B, Bezwada D, Rodriguez- Canales J, Villalobos P, Lin YF, et al. (2017). CPS1 maintains pyrimidine pools and DNA synthesis in KRAS/LKB1-mutant cancer cells. Nature 546, 168–172. [DOI] [PMC free article] [PubMed] [Google Scholar]
- King KS, Prodanov T, Kantorovich V, Fojo T, Hewitt JK, Zacharin M, Wesley R, Lodish M, Raygada M, Gimenez-Roqueplo AP, et al. (2011). Metastatic pheochromocytoma/paraganglioma related to primary tumor development in childhood or adolescence: significant link to SDHB mutations. J. Clin. Oncol 29, 4137–142. [DOI] [PMC free article] [PubMed] [Google Scholar]
- King MP, and Attardi G (1988). Injection of mitochondria into human cells leads to a rapid replacement of the endogenous mitochondrial DNA. Cell 52, 811–819. [DOI] [PubMed] [Google Scholar]
- King MP, and Attardi G (1989). Human cells lacking mtDNA: repopulation with exogenous mitochondria by complementation. Science 246, 500–503. [DOI] [PubMed] [Google Scholar]
- Koppenol WH, Bounds PL, and Dang CV (2011). Otto Warburg’s contributions to current concepts of cancer metabolism. Nat. Rev. Cancer 11, 325–337. [DOI] [PubMed] [Google Scholar]
- Koundinya M, Sudhalter J, Courjaud A, Lionne B, Touyer G, Bonnet L, Menguy I, Schreiber I, Perrault C, Vougier S, et al. (2018). Dependence on the pyrimidine biosynthetic enzyme DHODH is a synthetic lethal vulnerability in mutant KRAS-driven cancers. Cell Chem. Biol 225, 705–717. [DOI] [PubMed] [Google Scholar]
- Kukat C, Davies KM, Wurm CA, Spåhr H, Bonekamp NA, Kuhl I, Joos F, Polosa PL, Park CB, Posse V, et al. (2015). Cross-strand binding of TFAM to a single mtDNA molecule forms the mitochondrial nucleoid. Proc. Natl. Acad. Sci. U S A 112, 11288–11293. [DOI] [PMC free article] [PubMed] [Google Scholar]
- Landon J, Fawcett JK, and Wynn V (1962). Blood pyruvate concentration measured by a specific method in control subjects. J. Clin. Pathol 15, 579–584. [DOI] [PMC free article] [PubMed] [Google Scholar]
- Le SB, Hailer MK, Buhrow S, Wang Q, Flatten K, Pediaditakis P, Bible KC, Lewis LD, Sausville EA, Pang YP, et al. (2007). Inhibition of mitochondrial respiration as a source of adaphostin-induced reactive oxygen species and cytotoxicity. J. Biol. Chem 282, 8860–8872. [DOI] [PubMed] [Google Scholar]
- LeBleu VS, O’Connell JT, Gonzalez Herrera KN, Wikman H, Pantel K, Haigis MC, de Carvalho FM, Damascena A, Domingos Chinen LT, Rocha RM, et al. (2014). PGC-1a mediates mitochondrial biogenesis and oxidative phosphorylation in cancer cells to promote metastasis. Nat. Cell Biol 16, 992–1003. [DOI] [PMC free article] [PubMed] [Google Scholar]
- Lei L, and Spradling AC (2016). Mouse oocytes differentiate through organelle enrichment from sister cyst germ cells. Science 352, 95–99. [DOI] [PMC free article] [PubMed] [Google Scholar]
- Letts JA, Fiedorczuk K, and Sazanov LA (2016). The architecture of respiratory supercomplexes. Nature 537, 644–648. [DOI] [PubMed] [Google Scholar]
- Loffler M (1980). On the role of dihydroorotate dehydrogenase in growth cessation of Ehrlich ascites tumor cells cultured under oxygen deficiency. Eur. J. Biochem 707, 207–215. [DOI] [PubMed] [Google Scholar]
- Loftier M, Fairbanks LD, Zameitat E, Marinaki AM, and Simmonds HA (2005). Pyrimidine pathways in health and disease. Trends Mol. Med 11, 430–437. [DOI] [PubMed] [Google Scholar]
- Lussey-Lepoutre C, Hollinshead KE, Ludwig C, Menara M, Morin A, Castro-Vega LJ, Parker SJ, Janin M, Martinelli C, Ottolenghi C, et al. (2015). Loss of succinate dehydrogenase activity results in dependency on pyruvate carboxylation for cellular anabolism. Nat. Commun 6, 8784. [DOI] [PMC free article] [PubMed] [Google Scholar]
- Marin-Valencia I, Yang C, Mashimo T, Cho S, Baek H, Yang XL, Rajagopalan KN, Maddie M, Vemireddy V, Zhao Z, et al. (2012). Analysis of tumor metabolism reveals mitochondrial glucose oxidation in genetically diverse human glioblastomas in the mouse brain in vivo. Cell Metab. 15, 827–837. [DOI] [PMC free article] [PubMed] [Google Scholar]
- Mashimo T, Pichumani K, Vemireddy V, Hatanpaa KJ, Singh DK, Sirasanagandla S, Nannepaga S, Piccirillo SG, Kovacs Z, Foong C, et al. (2014). Acetate is a bioenergetic substrate for human glioblastoma and brain metastases. Cell 159, 1603–1614. [DOI] [PMC free article] [PubMed] [Google Scholar]
- Martinez-Outschoorn UE, Peiris-Pagés M, Pestell RG, Sotgia F, and Lisanti MP (2017). Cancer metabolism: a therapeutic perspective. Nat. Rev. Clin. Oncol 14, 11–31. [DOI] [PubMed] [Google Scholar]
- Martinez-Reyes I, Diebold LP, Kong H, Schieber M, Huang H, Hensley CT, Mehta MM,Wang T, Santos JH, Woychik R, et al. (2016). TCA cycle and mitochondrial membrane potential are necessary for diverse biological functions. Mol. Cell 61, 199–209. [DOI] [PMC free article] [PubMed] [Google Scholar]
- Mathur D, Stratikopoulos E, Ozturk S, Steinbach N, Pegno S, Schoenfeld S, Yong R, Murty VV, Asara JM, Cantley LC, and Parsons R (2017). PTEN regulates glutamine flux to pyrimidine synthesis and sensitivity to dihydroorotate dehydrogenase inhibition. Cancer Discov. 7, 380–390. [DOI] [PMC free article] [PubMed] [Google Scholar]
- Molina JR, Sun Y, Protopopova M, Gera S, Bandi M, Bristow C, McAfoos T, Morlacchi P, Ackroyd T, Agip AA, et al. (2018). An inhibitor of oxidative phosphorylation exploits cancer vulnerability. Nat. Med 24, 1036–1046. [DOI] [PubMed] [Google Scholar]
- Mohamad Fairus AK, Choudhary B, Hosahalli S, Kavitha N, and Shatrah O (2017). Dihydroorotate dehydrogenase (DHODH) inhibitors affect ATP depletion, endogenous ROS and mediate S-phase arrest in breast cancer cells. Biochimie 135, 154–163. [DOI] [PubMed] [Google Scholar]
- Moreno-Lastres D, Fontanesi F, García-Consuegra I, Martín MA, Arenas J, Barrientos A, and Ugalde C (2012). Mitochondrial complex I plays an essential role in human respirasome assembly. Cell Metab. 15, 324–335. [DOI] [PMC free article] [PubMed] [Google Scholar]
- Moschoi R, Imbert V, Nebout M, Chiche J, Mary D, Prebet T, Saland E, Castellano R, Pouyet L, Collette Y, et al. (2016). Protective mitochondrial transfer from bone marrow stromal cells to acute myeloid leukaemia cells during chemotherapy. Blood 128, 253–264. [DOI] [PubMed] [Google Scholar]
- Murphy MP (2009). How mitochondria produce reactive oxygen species. Biochem. J 417, 1–13. [DOI] [PMC free article] [PubMed] [Google Scholar]
- Olsen NJ, and Stein CM (2004). New drugs for rheumatoid arthritis. N. Engl. J. Med 350,2167–2179. [DOI] [PubMed] [Google Scholar]
- Osswald M, Jung E, Sahm F, Solecki G, Venkataramani V, Blaes J, Weil S, Horstmann H, Wiestler B, Syed M, et al. (2015). Brain tumour cells interconnect to a functional and resistant network. Nature 528, 93–98. [DOI] [PubMed] [Google Scholar]
- Park JS, Sharma LK, Li H, Xiang R, Holstein D, Wu J, Lechleiter J, Naylor SL, Deng JJ, Lu J, and Bai Y (2009). A heteroplasmic, not homo- plasmic mitochondrial DNA mutation promotes tumorigenesis via alteration in reactive oxygen species generation and apoptosis. Hum. Mol. Genet 18, 1578–1589. [DOI] [PMC free article] [PubMed] [Google Scholar]
- Perales-Clemente E, Bayona-Bafaluy MP, Pérez-Martos A, Barrientos A, Fernández-Silva P, and Enriquez JA (2008). Restoration of electron transport without proton pumping in mammalian mitochondria. Proc. Natl. Acad. Sci. USA 105, 18735–18739. [DOI] [PMC free article] [PubMed] [Google Scholar]
- Peters GJ, van Dijk J, Laurensse E, van Groeningen CJ, Lankelma J, Leyva A, Nadal JC, and Pinedo HM (1988). In vitro biochemical and in vivo biological studies of the uridine ‘rescue’ of 5.fluorouracil. Br. J. Cancer 57, 259–265. [DOI] [PMC free article] [PubMed] [Google Scholar]
- Picard M, Zhang J, Hancock S, Derbeneva O, Golhar R, Golik P, O’Hearn S, Levy S, Potluri P, Lvova M, et al. (2014). Progressive increase in mtDNA 3243A>G heteroplasmy causes abrupt transcriptional reprogramming. Proc. Natl. Acad. Sci. U S A 111, E4033. [DOI] [PMC free article] [PubMed] [Google Scholar]
- Podda M, Weber C, Traber MG, Milbradt R, and Packer L (1999). Sensitive high-performance liquid chromatography techniques for simulta-neous determination of tocopherols, tocotrienols, ubiquinols, and ubiquinones in biological samples. Methods Enzymol. 299, 330–341. [DOI] [PubMed] [Google Scholar]
- Quinlan CL, Orr AL, Perevoshchikova IV, Treberg JR, Ackrell BA, and Brand MD (2012). Mitochondrial complex II can generate reactive oxygen species at high rates in both the forward and reverse reactions. J. Biol. Chem 287, 27255–27264. [DOI] [PMC free article] [PubMed] [Google Scholar]
- Rohlena J, Dong LF, Ralph SJ, and Neuzil J (2011). Anticancer drugs targeting the mitochondrial electron transport chain. Antioxid. Redox Signal. 15, 2951–2974. [DOI] [PubMed] [Google Scholar]
- Rohlenova K, Sachaphibulkij K, Stursa J, Bezawork-Geleta A, Blecha J, Endaya B, Werner L, Cerny J, Zobalova R, Goodwin J, et al. (2017). Selective disruption of respiratory supercomplexes as a new strategy to suppress Her2high breast cancer. Antiox. Redox Signal 26, 84–103. [DOI] [PMC free article] [PubMed] [Google Scholar]
- Schmitt S, Saathoff F, Meissner L, Schropp EM, Lichtmannegger J, Schulz S, Eberhagen C, Borchard S, Aichler M, Adamski J, Plesnila N, et al. (2013). A semi-automated method for isolating functionally intact mitochondria from cultured cells and tissue biopsies. Anal. Biochem 443, 66–74. [DOI] [PubMed] [Google Scholar]
- Shukla SK, Purohit V, Mehla K, Gunda V, Chaika NV, Vernucci E, King RJ, Abrego J, Goode GD, Dasgupta A, et al. (2017). MUC1 and HIF-1a signaling crosstalk induces anabolic glucose metabolism to impart gemcita- bine resistance to pancreatic cancer. Cancer Cell 32, 71–87. [DOI] [PMC free article] [PubMed] [Google Scholar]
- Sigoillot FD, Berkowski JA, Sigoillot SM, Kotsis DH, and Guy HI (2003). Cell cycle-dependent regulation of pyrimidine biosynthesis. J. Biol. Chem 278, 3403–3409. [DOI] [PubMed] [Google Scholar]
- Shalem O, Sanjana NE, Hartenian E, Shi X, Scott DA, Mikkelsen TS, Heckl D, Ebert BL, Root DE, Doench JG, and Zhang F (2014). Genome-scale CRISPR-Cas9 knockout screening in human cells. Science 343, 84–87. [DOI] [PMC free article] [PubMed] [Google Scholar]
- Strakova A, Ní Leathlobhair M, Wang GD, Yin TT, Airikkala-Otter I, Allen JL, Allum KM, Bansse-Issa L, Bisson JL, Castillo Domracheva A, et al. (2016). Mitochondrial genetic diversity, selection and recombination in a canine transmissible cancer. Elife 5, e14552. [DOI] [PMC free article] [PubMed] [Google Scholar]
- Sullivan LB, Gui DY, Hosios AM, Bush LN, Freinkman E, and Vander Heiden MG (2015). Supporting aspartate biosynthesis is an essential function of respiration in proliferating cells. Cell 162, 552–563. [DOI] [PMC free article] [PubMed] [Google Scholar]
- Sullivan LB, Gui DY, and Vander Heiden MG (2016). Altered metabolite levels in cancer: implications for tumour biology and cancer therapy. Nat. Rev. Cancer 16, 680–693. [DOI] [PubMed] [Google Scholar]
- Sullivan LB, Luengo A, Danai LV, Bush LN, Diehl FF, Hosios AM, Lau AN, Elmiligy S, Malstrom S, Lewis CA, et al. (2018). Aspartate is an endogenous metabolic limitation for tumour growth. Nat. Cell Biol 20, 782–788. [DOI] [PMC free article] [PubMed] [Google Scholar]
- Sykes DB, Kfoury YS, Mercier FE, Wawer MJ, Law JM, Haynes MK, Lewis TA, Schajnovitz A, Jain E, Lee D, et al. (2016). Inhibition of dihydroorotate dehydrogenase overcomes differentiation blockade in acute myeloid leukemia. Cell 167, 171–186. [DOI] [PMC free article] [PubMed] [Google Scholar]
- Tan AS, Baty JW, Dong LF, Bezawork-Geleta A, Endaya B, Goodwin J, Bajzikova M, Kovarova J, Peterka M, Yan B, et al. (2015). Mitochondrial genome acquisition restores respiratory function and tumori- genic potential in cancer cells without mitochondrial DNA. Cell Metab. 21, 81–94. [DOI] [PubMed] [Google Scholar]
- Titov DV, Cracan V, Goodman RP, Peng J, Grabarek Z, and Mootha VK (2016). Complementation of mitochondrial electron transport chain by manipulation of the NAD+/NADH ratio. Science 352, 231–235. [DOI] [PMC free article] [PubMed] [Google Scholar]
- Vander Heiden MG, and DeBerardinis RJ (2017). Understanding the intersections between metabolism and cancer biology. Cell 168, 657–669. [DOI] [PMC free article] [PubMed] [Google Scholar]
- Vander Heiden MG, Cantley LC, and Thompson CB (2009). Understanding the Warburg effect: the metabolic requirements of cell proliferation. Science 324, 1029–1033. [DOI] [PMC free article] [PubMed] [Google Scholar]
- Viale A, Pettazzoni P, Lyssiotis CA, Ying H, Sánchez N, Marchesini M, Carugo A, Green T, Seth S, Giuliani V, et al. (2014). Oncogene ablation- resistant pancreatic cancer cells depend on mitochondrial function. Nature 514, 628–632. [DOI] [PMC free article] [PubMed] [Google Scholar]
- Wallace DC (2012). Mitochondriaand cancer. Nat. Rev. Cancer 12,685–698. [DOI] [PMC free article] [PubMed] [Google Scholar]
- Weinberg F, Hamanaka R, Wheaton WW, Weinberg S, Joseph J, Lopez M, Kalyanaraman B, Mutlu GM, Budinger GR, and Chandel NS (2010). Mitochondrial metabolism and ROS generation are essential for Kras-mediated tumorigenicity. Proc. Natl. Acad. Sci. U S A 107, 8788–8793. [DOI] [PMC free article] [PubMed] [Google Scholar]
- Wheaton WW, Weinberg SE, Hamanaka RB, Soberanes S, Sullivan LB, Anso E, Glasauer A, Dufour E, Mutlu GM, Budigner GS, and Chandel NS (2014). Metformin inhibits mitochondrial complex I of cancer cells to reduce tumorigenesis. Elife 3, e02242. [DOI] [PMC free article] [PubMed] [Google Scholar]
- Wittig I, Braun HP, and Schagger H (2006). Blue native PAGE. Nat. Protoc 1, 418–428. [DOI] [PubMed] [Google Scholar]
- Wu M, Gu J, Guo R, Huang Y, and Yang M (2016). Structure of mammalian respiratory supercomplex I1III2IV1. Cell 167, 1598–1609. [DOI] [PubMed] [Google Scholar]
- Yin S, Kabashima T, Zhu Q, Shibata T, and Kai M (2017). Fluorescence assay of dihydroorotate dehydrogenase that may become a cancer biomarker. Sci. Rep 7, 40670. [DOI] [PMC free article] [PubMed] [Google Scholar]
- Zhang X, Fryknäs M, Hernlund E, Fayad W, De Milito A, Olofsson MH, Gogvadze V, Dang L, Påhlman S, Schughart LA, et al. (2014). Induction of mitochondrial dysfunction as a strategy for targeting tumour cells in metabolically compromised microenvironments. Nat. Commun 5, 3295. [DOI] [PMC free article] [PubMed] [Google Scholar]
Associated Data
This section collects any data citations, data availability statements, or supplementary materials included in this article.