Abstract
Myeloid‐derived suppressor cells (MDSCs) play a crucial role in immunosuppression in tumor‐bearing hosts. MDSCs express arginase‐I and indoleamine 2,3‐dioxygenase; they suppress T‐cell function by reducing the levels of l‐arginine and l‐tryptophan, respectively. We examined the anticancer effects of supplementation of these amino acids in CT26 colon carcinoma‐bearing mice. Oral supplementation of l‐arginine or l‐tryptophan (30 mg/mouse) did not affect tumor growth, whereas oral supplementation of d‐arginine was lethal. Supplementation of l‐arginine showed a tendency to augment the efficacy of cyclophosphamide (CP). CP reduced the proportions of granulocytic MDSCs and increased the proportions of monocytic MDSCs in the spleen and tumor tissues of CT26‐bearing mice. l‐Arginine supplementation alone did not affect the MDSC subsets. CP treatment tended to reduce the plasma levels of l‐arginine in CT26‐bearing mice and significantly increased the number of tumor‐infiltrating CD8+ T cells. In addition, l‐arginine supplementation significantly increased the proportions of tumor peptide‐specific CD8+ T cells in draining lymph nodes. Importantly, additional supplementation of l‐arginine significantly increased the number of cured mice that were treated with CP and anti‐PD‐1 antibody. Totally, l‐arginine supplementation shows promise for boosting the therapeutic efficacy of chemoimmunotherapy.
Keywords: arginase‐I, chemoimmunotherapy, l‐arginine, MDSC, T cells
Combination treatment with cyclophosphamide and anti‐PD‐1 antibody significantly suppressed the tumor growth, but did not exert a curative effect. However, the addition of l‐arginine supplementation boosted to complete regression in the majority of mice.
1. INTRODUCTION
In tumor‐bearing hosts, several types of immunosuppressive cells, including regulatory T (Treg) cells and myeloid‐derived suppressor cells (MDSCs), inhibit antitumor immune responses. 1 MDSCs are immature myeloid cells that are classified as either Gr‐1lowLy6Chigh monocytic MDSCs (M‐MDSCs) or Gr‐1highLy6Clow granulocytic MDSCs (G‐MDSCs). 2 MDSCs suppress antitumor immune responses via mechanisms involving arginase‐1, inducible nitric oxide synthase, and indoleamine 2,3‐dioxygenase. 2 , 3 l‐Arginine and l‐tryptophan are required for T‐cell proliferation/activation. Arginase‐I and inducible nitric oxide synthase metabolize l‐arginine. Indoleamine 2,3‐dioxygenase degrades l‐tryptophan, resulting in the accumulation of kynurenine, an immunosuppressive metabolite, and leading to T‐cell dysfunction. 2 , 4 In addition, degradation of l‐arginine by MDSCs leads to reduced expression of the CD3ζ chain, resulting in impaired T‐cell responsiveness. 5 , 6
Immune‐checkpoint blockade therapy shows promise for various types of cancers. To improve therapeutic efficacy, combinations of immune‐checkpoint blockade with other anticancer therapies have been employed. 7 , 8 , 9 , 10 However, chemotherapeutic drugs can exert both positive and negative effects on antitumor immunity. For example, some chemotherapeutics mitigate Treg‐ or MDSC‐mediated immunosuppression 11 , 12 and trigger immunogenic death of cancer cells. 13 In contrast, high doses of chemotherapeutics induce immunosuppression. In addition, the proportion of MDSCs reportedly increases after administration of chemotherapeutic drugs, such as cyclophosphamide (CP) and docetaxel. 14 , 15 In addition, we reported that CP increases the proportion of M‐MDSCs in the spleen of tumor‐bearing mice. 16 Therefore, it is possible that the increase in the proportion of MDSCs after chemotherapy attenuates the anticancer T‐cell responses by reducing levels of l‐arginine and l‐tryptophan in tumor‐bearing hosts.
In this study, we examined the effect of supplementation of l‐arginine or l‐tryptophan on antitumor immunity using a CT26 carcinoma mouse model. Although supplementation of l‐arginine or l‐tryptophan alone did not affect the in vivo growth of CT26 tumors, l‐arginine supplementation showed a tendency to augment the antitumor effect of CP. CP with anti‐PD‐1 therapy tended to reduce the plasma levels of l‐arginine in CT26‐bearing mice, whereas l‐arginine supplementation restored them. In addition, l‐arginine supplementation significantly increased the proportions of tumor peptide‐specific CD8+ T cells in tumor‐draining lymph nodes and the number of cured mice treated with CP and anti‐PD‐1 antibody.
2. MATERIALS AND METHODS
2.1. Mice and tumor cell lines
BALB/c female mice (6‐7 wk old) were purchased from CLEA Japan. The mice were maintained under specific pathogen‐free conditions. All experiments involving animals were performed in accordance with the ethical guidelines for animal experiments of the Shimane University Faculty of Medicine (IZ30‐88). CT26 is a colon carcinoma cell line from a BALB/c mouse. This cell line was maintained in RPMI 1640 medium (Sigma‐Aldrich) that was supplemented with 10% fetal bovine serum and 20 µg/mL gentamycin (Sigma‐Aldrich).
2.2. Treatment protocol
BALB/c mice were injected subcutaneously (sc) in the right flank with 5 × 10⁵ tumor cells. Amino acids (l‐arginine, d‐arginine, and l‐tryptophan; Nacalai Tesque) (30 mg/mouse; 200 µL) were administered orally. CP (Shionogi Co., Ltd.) (100 mg/kg) or 5‐fluorouracil (5‐FU; Nacalai Tesque) (100 mg/kg) was injected intraperitoneally (ip) in a 200‐µL volume on day 12 after tumor inoculation. An anti‐PD‐1 monoclonal antibody (mAb) (100 µg/mouse) (clone RMP 1‐14, Bio X Cell Inc) was injected ip at 200 µL on the indicated days. The same volume of rat IgG (100 µg/mouse) (Sigma‐Aldrich) was injected ip as the vehicle control. Tumor size (mm2) was measured on the indicated days.
2.3. Assay of cytotoxicity
At 2 mo after complete regression of CT26 tumors, spleen cells were harvested and cultured in vitro with an AH1 peptide (10 µg/mL), an H‐2Ld‐binding CT26‐associated tumor‐derived peptide (SPSYVYHQF), 17 in the presence of IL‐2 (20 U/mL) for 4 d. Thereafter, their cytotoxicities were evaluated by 5 h 51Cr‐release assay.
2.4. Flow cytometry
To examine MDSCs in the spleen and tumor sites, suspended cells were stained with an allophycocyanin (APC)‐conjugated anti‐CD45 mAb (BioLegend), phycoerythrin (PE)‐conjugated anti‐CD11b mAb (BioLegend), fluorescein isothiocyanate (FITC)‐conjugated anti‐Gr‐1 mAb (R&D Systems), and PE/Cy7‐conjugated anti‐Ly6C mAb (BioLegend). To examine T cells in tumor tissues, suspensions of cells from tumor tissues were stained with an APC‐conjugated anti‐CD45 mAb, PE‐conjugated anti‐CD4 mAb (BioLegend), and FITC‐conjugated anti‐CD8 mAb (Southern Biotech). To assess the proportions of tumor peptide‐specific CD8+ T cells in draining lymph nodes (LNs), axially draining and inguinal LN cells were stained with a PE‐conjugated tetramer of an H‐2Ld‐binding AH1 peptide and FITC‐conjugated anti‐CD8 mAb. Stained cells were analyzed using a FACSCalibur flow cytometer (Becton‐Dickinson).
2.5. Measurement of plasma levels of amino acids
Plasma from naïve or CT26‐bearing mice with or without treatment was prepared individually and stored at −30°C. Plasma l‐arginine and l‐tryptophan levels were assayed by liquid chromatography‐mass spectrometry (LC‐MS) (LC‐MS8050, Shimadzu).
2.6. Cell proliferation assay
Erythrocyte‐free spleen cells from BALB/c female mice (6‐7 wk old) were cultured in flat 96‐well plates pre‐coated with anti‐CD3 mAb (3 µg/mL, clone 145‐2C11, BioLegend), in the presence of soluble anti‐mouse CD28 mAb (1 µg/mL, clone 37.51, BioLegend) in RPMI 1640 medium containing 0‐1150 µmol/L l‐arginine. Cell viability was evaluated by 2‐(2‐methoxy‐4‐nitrophenyl)‐3‐(4‐nitrophenyl)‐5‐(2,4‐disulfophenyl)‐2H‐tetrazolium monosodium salt (WST‐8) assay (Nacalai Tesque). Spleen cells were cultured on flat‐bottomed 96‐well plates. At 3 d later, 10 μL of WST‐8 solution were added to each well and the plates were incubated for 2 h. The absorbance at 450 nm was read using a microplate reader (Beckman Coulter).
2.7. Assay of protective immunity
At 1 mo after complete regression of sc inoculated CT26 after therapy, CT26 cells (2.5 × 10⁵) were injected sc into the flank of mice. In some mice, either anti‐CD4 antibody (clone GK1.5, BioLegend), anti‐CD8 antibody (clone 53‐6.7, BioLegend), or control rat IgG was injected ip twice, 3 and 1 d before CT26 inoculation, at a dose of 150 µg. Thereafter, tumor size (mm2) was measured.
2.8. Statistical analysis
Data were analyzed by unpaired two‐tailed Student t test (2 groups), ANOVA with Tukey’s post hoc test (2 or more groups), or Fisher exact test. A P‐value of <.05 was considered indicative of statistical significance.
3. RESULTS
3.1. Supplementation of l‐arginine tended to augment in vivo antitumor effects of CP
First, we examined the effect of supplementation with l‐arginine, d‐arginine, or l‐tryptophan on the in vivo growth of CT26 carcinoma cells (Figure 1A). Daily oral supplementation (30 mg/mouse) was initiated from day 1 after tumor inoculation. This dose was determined based on findings by other researchers. 18 , 19 Supplementation of l‐arginine or l‐tryptophan did not affect tumor growth. Because 4 of 6 mice were unexpectedly killed by supplementation of d‐arginine, the control for l‐arginine, supplementation of d‐arginine was aborted. Next, l‐arginine supplementation was initiated on days 1, 7, or 12 after tumor inoculation (Figure 1B). However, no growth suppression was observed. Given that anticancer therapy targets established tumor, supplementation of l‐arginine was initiated on day 12 after tumor inoculation in subsequent experiments.
FIGURE 1.
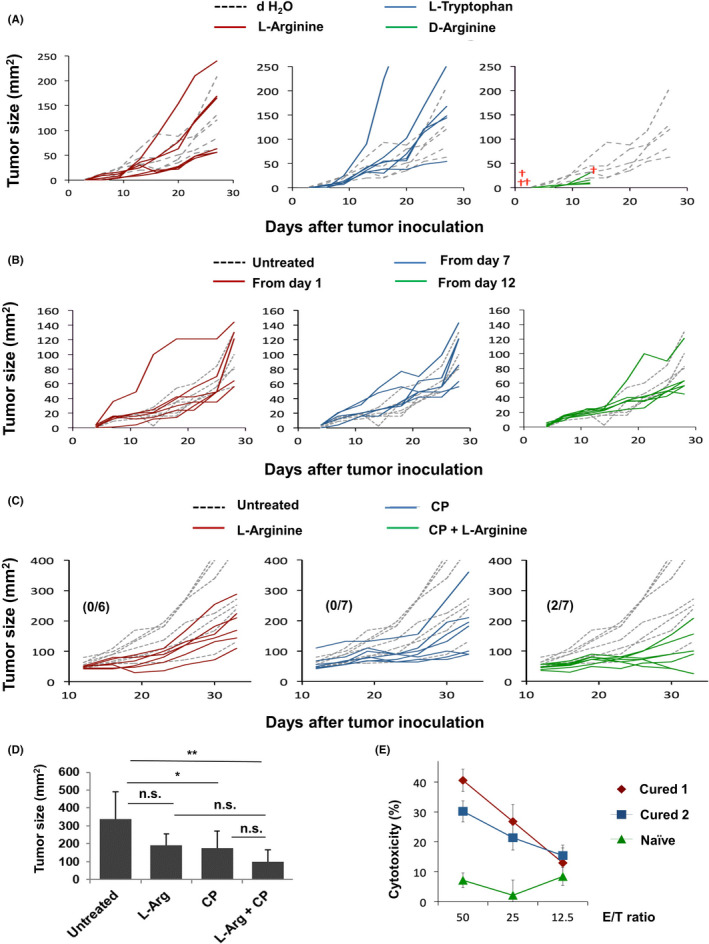
Effects of l‐arginine supplementation and/or CP treatment in CT26‐bearing mice. A, BALB/c mice (n = 6) were injected sc with CT26 cells (5 × 10⁵). Amino acids (30 mg/mouse) were orally administered daily from day 1. Dotted line indicates the control (dH2O); red cross represents death of a mouse. B, l‐Arginine (30 mg/mouse) was orally administered daily, beginning on the indicated days. Dotted line indicates the control (dH2O). C, On day 12 after inoculation of CT26 cells (5 × 10⁵), mice received ip injection of CP (100 mg/kg). l‐Arginine (30 mg/mouse) was orally administered daily from day 12. Numbers in parentheses are cured mice/total mice. Dotted line indicates the untreated control. D, Tumor size on day 33. *P < .05, **P < .01, n.s., not significant. (ANOVA) E, Spleen cells from 2 cured mice and one naïve mouse were separately cultured with AH1 peptide and IL‐2 (20 U/mL) for 4 d. Their cytotoxicity to CT26 cells was examined by 5 h 51Cr‐release assay.
We next determined whether l‐arginine supplementation could augment the CP‐induced antitumor effect. CP (100 mg/kg) was injected ip on day 12 after tumor inoculation. CP treatment alone significantly inhibited tumor growth. Although statistical significance was not observed, complete cure was observed in 2 mice treated with both CP and l‐arginine, and their mean tumor size was almost half compared with mice treated with CP alone (Figure 1C,D). Similar antitumor effects on the tumor size were observed in another experiment (Figure S1). At 2 mo later, cytotoxicity against CT26 cells was examined using spleen cells from cured mice. The spleen cells of cured mice exerted a greater cytotoxic effect, compared with spleen cells of naïve mice (Figure 1E).
3.2. Effects of CP and/or l‐arginine on MDSCs in the spleen and tumor sites of CT26‐bearing mice
We next examined the effects of either or both CP treatment and l‐arginine supplementation on MDSCs in the spleen of CT26‐bearing mice. CP treatment showed a tendency to reduce the number of spleen cells, but l‐arginine supplementation showed no such effect (Figure 2A). Figure 2B shows the MDSC staining strategy. M‐MDSCs and G‐MDSCs were identified as CD11b+Gr‐1lowLy6Chigh and CD11b+Gr‐1highLy6Clow cells, respectively. CP treatment and/or l‐arginine supplementation did not affect the proportion of CD11b+ cells in the spleen (Figure 2C). CP treatment significantly increased the proportion of M‐MDSCs, but reduced the proportion of G‐MDSCs (Figure 2D,E). l‐Arginine supplementation did not alter these changes. The number of M‐MDSCs showed a tendency to increase in untreated CT26‐bearing mice compared with naïve mice, whereas CP treatment and/or l‐arginine supplementation did not affect the number of M‐MDSCs (Figure 2F). In contrast, CP treatment significantly reduced the number of G‐MDSCs, irrespective of l‐arginine supplementation. Therefore, CP treatment reduced the proportion of G‐MDSCs and increased the proportion of M‐MDSCs in the spleens of CT26‐bearing mice; l‐arginine supplementation did not alter these changes. In contrast, l‐arginine supplementation did not affect the proportions of CD11b+ cells in tumor sites (Figure S2A). CP showed a tendency to reduce the proportion of G‐MDSCs compared with the other groups (Figure S2B), as observed in the spleen (Figure 2E), whereas significant difference was observed between the CP and l‐arginine groups. However, no reduction in the proportion of G‐MDSCs was induced by the combination of CP treatment and l‐arginine supplementation.
FIGURE 2.
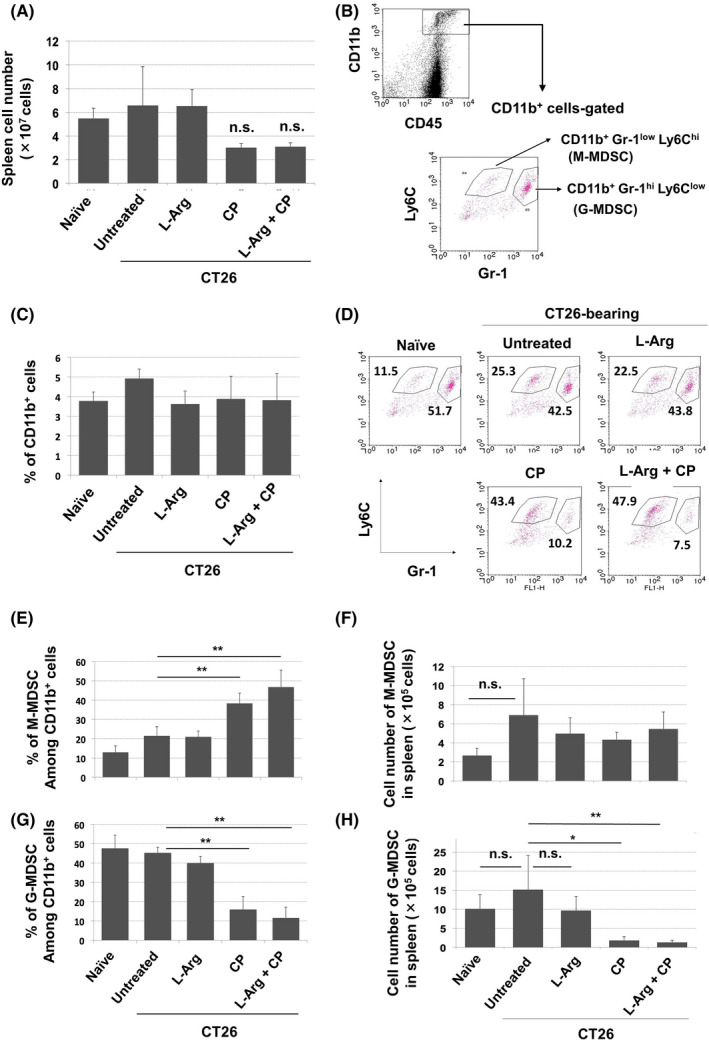
Effects of CP treatment on the proportions of MDSC subsets in spleens of CT26‐bearing mice. A, On day 12 after CT26 inoculation, mice received ip injection of CP (100 mg/kg). Simultaneously, oral supplementation of l‐arginine (30 mg/mouse) was initiated. On day 18, spleens were harvested and cells were enumerated (n = 4). B, Staining strategy for MDSC subsets. C, Proportions of CD11b+ cells. On day 18, the spleens were harvested and stained with the indicated antibodies. D, A representative result is shown. Proportions (E) and numbers (F) of MDSCs in spleen. (n = 4). Data are means ± standard deviations. **P < .01, *P < .05, n.s., not significant (ANOVA)
3.3. CP reduces the plasma levels of l‐arginine in CT26‐bearing mice
We next used LC‐MS to measure the plasma levels of l‐arginine and l‐tryptophan in naïve and CT26‐bearing mice (Figure 3). Naïve or CT26‐bearing mice were injected ip with CP (100 mg/kg) on day 12; supplementation of l‐arginine (30 mg/mouse) was initiated on the same day. Plasma was collected on day 26 after tumor inoculation. The plasma level of l‐arginine was slightly, but non‐significantly, reduced in untreated CT26‐bearing mice. Supplementation of l‐arginine significantly increased the plasma level of l‐arginine in CT26‐bearing mice. The plasma level of l‐arginine in CP‐treated CT26‐bearing mice showed a tendency to decrease compared with that of untreated CD26‐bearing mice and l‐arginine supplementation restored the plasma level of l‐arginine, whereas this recovery was not significant. In contrast, the plasma level of l‐tryptophan was significantly elevated in untreated CT26‐bearing mice compared with that of naïve mice, and the combination therapy decreased it.
FIGURE 3.
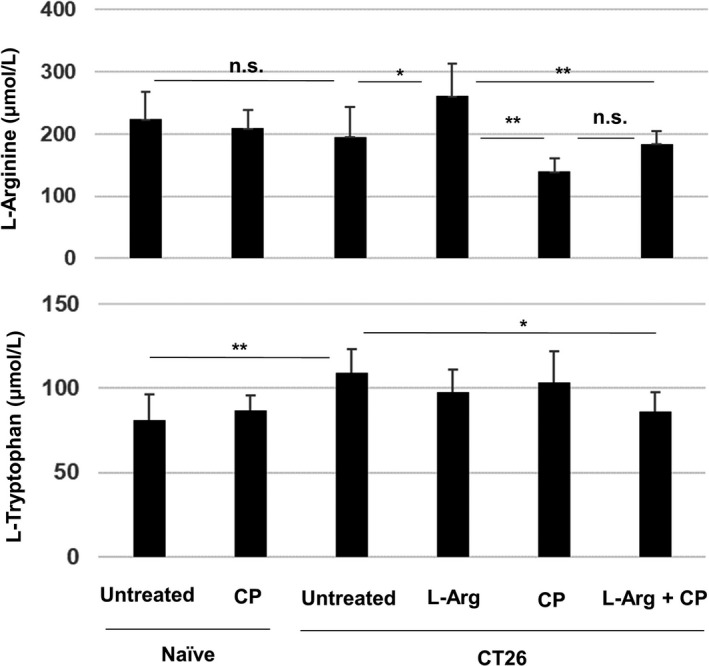
CP treatment reduces the plasma levels of l‐arginine in CT26‐bearing mice. BALB/c mice were injected sc with CT26 cells (5 × 10⁵). CP (100 mg/kg) was injected ip on day 12. l‐Arginine (30 mg/mouse) was orally administered daily from day 12. On day 26 after tumor inoculation, the plasma levels of l‐arginine and l‐tryptophan were measured by LC‐MS. Data are means ± standard deviations of 7 mice. *P < .05, **P < .01, n.s., not significant (ANOVA)
Because MDSCs increase after several types of chemotherapeutic drugs other than CP, 15 , 20 the plasma levels of these amino acids after 5‐FU treatment were also examined (Figure S3). Administration of 5‐FU showed a tendency to reduce the plasma level of l‐arginine, but l‐arginine supplementation significantly increased the level of l‐arginine in 5‐FU‐treated CT26‐bearing mice. In contrast, the plasma levels of l‐tryptophan were significantly elevated in untreated CT26‐bearing mice, whereas 5‐FU alone or 5‐FU plus l‐arginine supplementation decreased them in CT26‐bearing mice.
We also examined the effect of l‐arginine supplementation on T‐cell proliferation in vitro (Figure S4). Spleen cells from naïve mice were cultured with anti‐CD3 and anti‐mouse CD28 antibodies in the presence of various doses of l‐arginine. Conventional RPMI 1640 medium contains 1150 µmol/L l‐arginine. However, cell viability starts to reduce from a dose of 57.5 µmol/L l‐arginine.
3.4. Effect of l‐arginine supplementation on T cells in tumor sites and draining LNs
We next examined the effect of l‐arginine supplementation on T‐cell infiltration into tumor sites. CP treatment did not significantly promote the infiltration of CD45+ cells in tumor sites, irrespective of l‐arginine supplementation (Figure 4A). However, the proportions of CD8+ T cells among CD45+ cells were significantly increased by CP treatment, irrespective of l‐arginine supplementation, whereas the proportions of CD4+ T cells among CD45+ cells were unchanged (Figure 4B). Representative results are shown in Figure 4C. We also measured the cell number of these cells. Although the number of CD8+ T cells was increased by CP or CP/l‐arginine treatment, this increase was not statistically significant (Figure 4D). The number of CD4+ T cells was unchanged.
FIGURE 4.
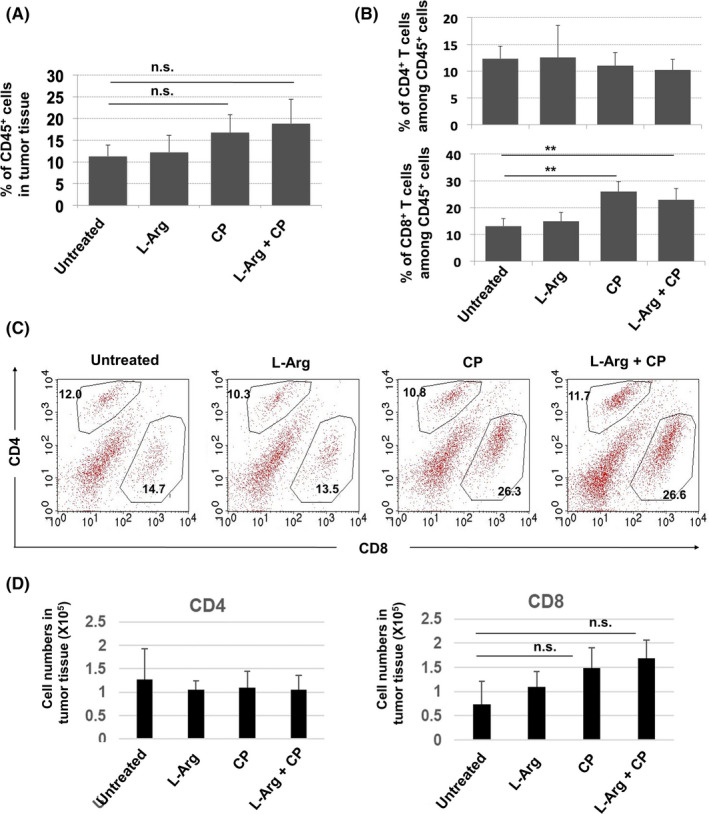
CP treatment increases the proportions of CD8+ T cells in tumor sites. BALB/c mice were injected sc with CT26 cells (5 × 10⁵). CP (100 mg/kg) was injected ip on day 12. l‐Arginine (30 mg/mouse) was orally administered daily from day 12. Tumor tissues were harvested on day 18 after tumor inoculation. A, Proportions of CD45+ immune cells in tumor tissues. B, Proportions of CD4+ and CD8+ T cells among CD45+ cells. Data are means ± standard deviations of 4 mice. C, A representative result is shown. Numbers indicate the proportions of the subsets. D, The cell numbers were counted. Data are means ± standard deviations of 4 mice. **P < .01, n.s., not significant (ANOVA)
We next analyzed CT26‐draining LNs. Tumor‐specific T cells were evaluated by staining with the AH1 peptide/tetramer. The CT26‐bearing state increased the proportions of AH1 tetramer+ CD8+ T cells among whole cells (Figure 5A) and among CD8+ T cells (Figure 5B) of draining LNs. Neither l‐arginine supplementation alone nor CP treatment alone increased these proportions, but their combination significantly increased the proportions of AH1 tetramer+ CD8+ T cells among whole cells and CD8+ T cells of draining LNs. Representative results are shown in Figure 5C. We also measured the number of these cells. Although the number of AH1 tetramer+ CD8+ T cells showed a tendency to increase after CP or CP/l‐arginine treatment, this increase was not statistically significant (Figure 5D).
FIGURE 5.
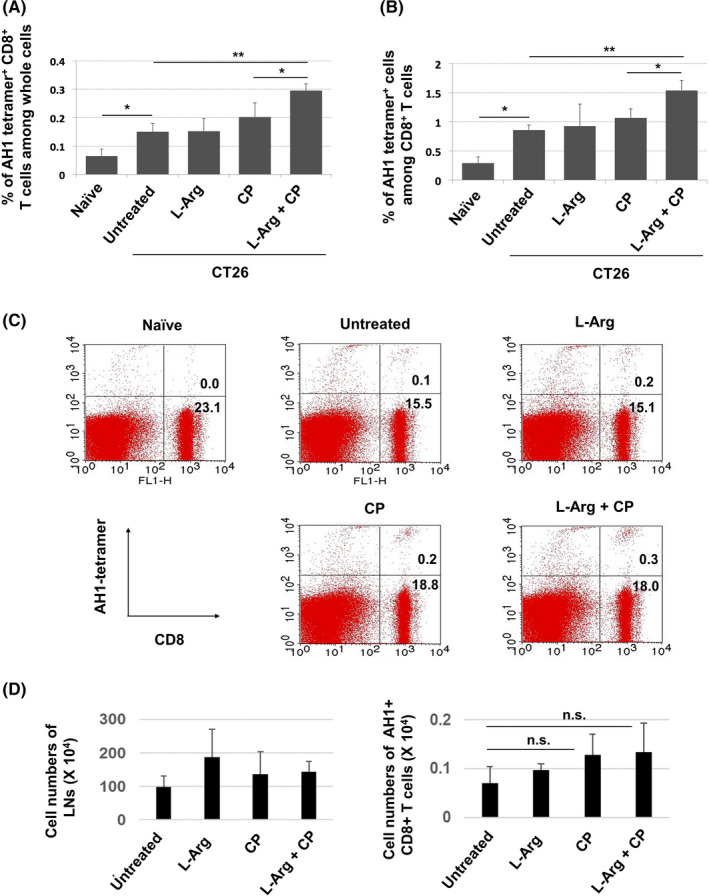
The combination of l‐arginine supplementation and CP treatment increases the proportion of AH1‐specific CD8+ T cells in draining lymph nodes. A, BALB/c mice were injected sc with CT26 cells (5 × 10⁵). CP (100 mg/kg) was injected ip on day 12. l‐Arginine (30 mg/mouse) was orally administered daily from day 12. Draining lymph nodes were harvested on day 18 after tumor inoculation. Proportions of AH1+CD8+ T cells among all cells (A) and CD8+ T cells in the lymph nodes (B). Data are means ± standard deviations of 4 mice. C, A representative result is shown. Numbers indicate the proportions of the subsets. D, The cell numbers were counted. Data are means ± standard deviations of 4 mice. *P < .05, **P < .01, n.s., not significant (ANOVA)
We also examined the effects of CP treatment or l‐arginine supplementation on the phenotype of CD8+ T cells in draining LNs. The CT26‐bearing state significantly increased the proportions of CD44+CD62L+ (central memory) cells, but reduced the proportions of CD44−CD62L+ (naïve) cells among whole cells and CD8+ T cells in draining LNs (Figure S5A). However, no such changes were observed in CT26‐bearing mice that received either or both CP treatment and l‐arginine supplementation. Representative results are shown in Figure S5B.
3.5. Efficacy of the combination of CP, anti‐PD‐1 antibody, and l‐arginine supplementation
We previously reported that combination treatment with CP and anti‐PD‐1 antibody significantly suppressed the growth of CT26 carcinoma in vivo, but did not exert a curative effect. 16 Here, we investigated whether supplementation of l‐arginine could augment the antitumor effect. In agreement with the findings of our previous report, 16 combination treatment with CP and anti‐PD‐1 antibody significantly suppressed tumor growth, but did not exert a curative effect (Figure 6A,B). However, the addition of l‐arginine supplementation boosted the therapeutic effect of combination with CP and anti‐PD‐1 antibody, leading to complete regression in 4 of 6 mice. In another experiment, 2 of 7 mice were cured by therapy with CP and anti‐PD‐1 antibody, whereas 6 of 8 mice were cured by additional supplementation with l‐arginine (Figure S6). Taken together, additional l‐arginine supplementation significantly increased the number of cured mice that were treated with CP and anti‐PD‐1 antibody (Table 1).
FIGURE 6.
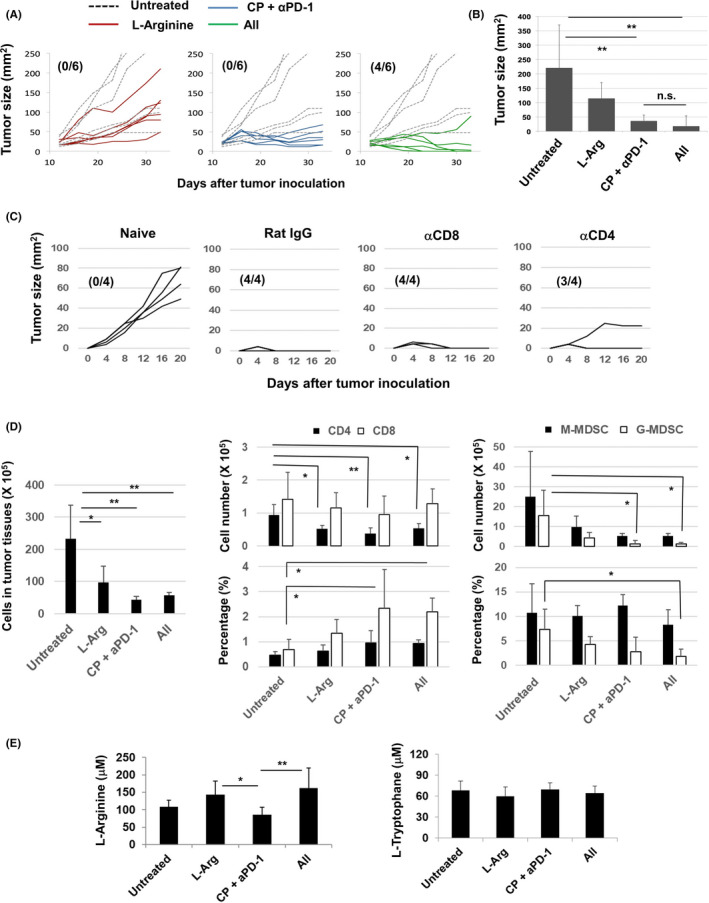
Combination treatment with CP, anti‐PD‐1 antibody, and l‐arginine increases the number of cured mice. A, BALB/c mice were injected sc with CT26 cells (5 × 10⁵). On day 12 after tumor inoculation, mice received ip injection of CP (100 mg/kg) followed by ip injection of anti‐PD‐1 mAb (100 μg/mouse) on days 13 and 15. As a control, rat IgG was injected ip l‐arginine (30 mg/mouse) was orally administered daily from day 12. Dotted line indicates the untreated control. Numbers in parentheses are cured mice/total mice. B, Tumor size on day 33. C, At 1 mo after complete regression of sc inoculated CT26, CT26 cells (2.5 × 10⁵) were injected sc into the flank of mice. In some mice, either anti‐CD4 antibody, anti‐CD8 antibody, or control rat IgG was injected ip twice, 3 and 1 d before CT26 inoculation, at a dose of 150 µg. Similarly, naïve mice were inoculated sc with CT26 cells. Numbers in parentheses are rejected mice/total mice. D, The cell numbers of tumor tissues, the cell numbers and proportions of CD4+ T cells, CD8+ T cells and MDSCs were measured and counted. Data are means ± standard deviations of 4 mice. E, On day 26 after tumor inoculation, the plasma levels of l‐arginine and l‐tryptophan were measured by LC‐MS. Data are means ± standard deviations of 7 mice. *P < .05, **P < .01, n.s., not significant (ANOVA)
TABLE 1.
Additional treatment with l‐arginine supplementation increases the number of cured mice that were treated with CP and anti‐PD‐1 antibody
| Mice were treated with | Number of mice | P‐value | |
|---|---|---|---|
| Not cured | Cured | ||
| CP + αPD‐1 | 11 | 2 | <.01 |
| CP + αPD‐1 + l‐arginine | 4 | 10 | |
The numbers of cured and non‐cured mice are shown. The result is sum total from 2 independent experiments. The statistical significance was evaluated by Fisher exact test.
We next tried to determine cells that were responsible for protective immunity against re‐challenged CT26. Unexpectedly, re‐challenged CT26 was rejected in all 4 mice that were pre‐injected with anti‐CD8 antibody, and CT26 slowly grew in one of 4 mice that were pre‐injected with anti‐CD4 antibody (Figure 6C). These results suggest that either CD8+ T cells or CD4+ T cells are enough to reject re‐challenged CT26 in cured mice that were treated with CP/anti‐PD‐1 antibody and l‐arginine. In addition, marked cytotoxicity against CT26 cells was induced from the spleen cells of mice that rejected re‐challenge with CT26 cells (Figure S7).
We finally examined the immune cells in tumor sites and the levels of l‐arginine and l‐tryptophan in mice that were treated with either or both of CP/anti‐PD‐1 antibody and l‐arginine. The cell numbers of tumor tissues were significantly decreased by either or both of these therapies (Figure 6D). Either treatment decreased the numbers of CD4+ T cells in tumor sites, whereas therapy with CP/anti‐PD‐1 antibody with or without l‐arginine significantly increased the proportions of CD8+ T cells in tumor sites. In terms of MDSCs, therapy with CP/anti‐PD‐1 antibody with or without l‐arginine significantly decreased the cell numbers of G‐MDSCs in tumor tissues. The proportions of G‐MDSCs in tumor tissues were significantly decreased in tumor tissues of mice treated with CP/anti‐PD‐1 antibody and l‐arginine. In addition, l‐arginine supplementation significantly restored the levels of l‐arginine in mice treated with CP/anti‐PD‐1 antibody (Figure 6E). This type of change was not observed regarding the levels of l‐tryptophan.
4. DISCUSSION
l‐Arginine is a conditionally essential amino acid, 21 which is necessary in the presence of inflammation and during wound healing. 1 Given that a tumor‐bearing state is associated with inflammation and chronic fatigue, we examined the effect of l‐arginine supplementation on antitumor immunity in tumor‐bearing hosts.
Cao et al reported that l‐arginine and docetaxel exerted a synergistic antitumor effect against 4T1 mouse mammary carcinoma and that l‐arginine supplementation alone suppressed tumor growth and reduced the proportion of MDSCs in tumor sites. 18 He et al showed that l‐arginine supplementation was effective against osteosarcoma when combined with an anti‐PD‐L1 antibody. 19 Geiger et al revealed that in vitro pretreatment with l‐arginine augmented the therapeutic efficacy of antitumor T cells after transfer into tumor‐bearing mice, using ovalbumin as a model tumor antigen. 22 To the best of our knowledge, the present study is the first to show that the addition of l‐arginine supplementation to chemoimmunotherapy, such as CP and an anti‐PD‐1 antibody, enhances antitumor efficacy.
We evaluated the effect of d‐arginine as a control. d‐arginine supplementation was lethal to tumor‐bearing mice (Figure 1A), this was likely to be because d‐arginine competed with l‐arginine. Although l‐arginine and l‐tryptophan did not affect tumor growth, we used l‐arginine in subsequent experiments because kynurenine, a metabolite of l‐tryptophan, is immunosuppressive 2 , 4 and because tryptophan metabolites promote Treg differentiation and suppress Th1 cells. 23 Moreover, l‐arginine is a health‐promoting supplement. The maximum oral dose is approximately 3 g/kg/d in animals 24 and 20 g/d in humans. 25 The dose administered to mice in this study (1.5 g/kg) may be excessive for humans. Therefore, l‐arginine should be administered to cancer patients based on the plasma level. Alternatively, administration of a derivative of l‐arginine or simultaneous supplementation of l‐citrulline, a metabolite of l‐arginine, may be feasible. 26
LC‐MS revealed that, although the plasma level of l‐arginine was not reduced in untreated CT26‐bearing mice, it showed a tendency to decrease in CT26‐bearing mice that had received CP treatment. Moreover, it was not reduced in naïve mice that had received CP treatment (Figure 3). In addition, administration of 5‐FU showed a tendency to decrease the levels of l‐arginine but the decrease was not significant (Figure S3). It is of interest that chemotherapeutic or radiation treatment induces trafficking of immature myeloid cells, including MDSCs, from bone marrow in a CCL2‐dependent manner. 20 In the present study, CP treatment selectively depleted G‐MDSCs, resulting in an increase in the proportion of M‐MDSCs (Figure 2). These increased M‐MDSCs might consume l‐arginine. Alternatively, CP‐induced leukopenia in the periphery may result in rapid recovery of immune cells and vigorous (ie, homeostatic) proliferation of lymphocytes. This proliferation would increase consumption of l‐arginine, therefore supplementation of l‐arginine rescued their growth. Conversely, a dose of l‐arginine that started to affect in vitro T‐cell proliferation was lower than the plasma level of l‐arginine. Although we have no idea to explain this discrepancy, T cells in tumor‐bearing hosts might be more vulnerable to a decrease in l‐arginine compared with the in vitro condition. Further analysis is needed to elucidate the underlying mechanisms.
To elucidate how supplementation of l‐arginine augmented antitumor efficacy, we investigated the spleen, tumor sites, and draining LNs. Although CP treatment mitigates Treg‐mediated immunosuppression in tumor‐bearing hosts, 27 , 28 chemotherapy‐induced cell death triggers accumulation of immature myeloid cells from bone marrow. 14 , 15 , 20 In the present study, CP treatment reduced the proportion of G‐MDSCs in the spleen of tumor‐bearing mice, but increased the proportion of M‐MDSCs (Figure 2). l‐Arginine supplementation may restore the level of l‐arginine, which was consumed by increased M‐MDSCs or proliferating lymphocytes, as discussed above. Alternatively, l‐arginine might promote the induction and trafficking of tumor‐specific CD8+ T cells. CP treatment alone promoted the infiltration of CD8+ T cells into tumor sites (Figure 4B). Supplementation of l‐arginine to the CP treatment increased the proportions of AH1 tetramer+CD8+ T cells in the draining LNs (Figure 5). In addition, an increase in the intracellular l‐arginine level reportedly shifted activated T‐cell metabolism from glycolysis to oxidative phosphorylation and promoted the survival of central memory‐like cells. 21 Therefore, we examined the effects of l‐arginine supplementation on naïve, central memory, and effector/effector memory CD8+ T cells in draining LNs (Figure S5). The tumor‐bearing state increased the proportions of CD44+CD62L+CD8+ T cells and reduced the proportions of CD44−CD62L+CD8+ naïve T cells. Either or both CP treatment and l‐arginine supplementation mitigated these changes and returned the cells to the naïve state. Although CD44+CD62L+CD8+ cells are considered central memory T cells, 29 we presume that, in this tumor model, these cells did not represent a central memory population but just failed to downregulate their expression of CD62L. Although a reduction in the expression of CD62L causes primed CD8+ T cells to leave draining LNs, 30 , 31 CD62L is suggested not to be a deterministic marker of central memory T‐cell differentiation. 32 We presume that supplementation of l‐arginine in CT26‐bearing and CP‐treated mice boosted the recruitment of naïve T cells into the draining LNs, the priming of tumor‐specific CD8+ T cells, and their departure to tumor sites.
In conclusion, l‐arginine supplementation boosts the antitumor effect of combination treatment with CP and anti‐PD‐1 antibody. Given that the frequency of combined therapy with immune‐checkpoint blockade and chemotherapeutics is increasing, supplementation of l‐arginine may show promise for boosting the therapeutic efficacy of anticancer chemoimmunotherapy.
DISCLOSURES
The authors have no conflict of interest.
Supporting information
Figure S1
Figure S2
Figure S3
Figure S4
Figure S5
Figure S6
Figure S7
ACKNOWLEDGMENTS
This study was supported in part by JSPS KAKENHI Grant (no. 17K07217 to M. Harada), the Shimane University “SUIGANN” Project, and The Japan Food Chemical Research Foundation (H. Kotani).
Satoh Y, Kotani H, Iida Y, Taniura T, Notsu Y, Harada M. Supplementation of l‐arginine boosts the therapeutic efficacy of anticancer chemoimmunotherapy. Cancer Sci. 2020;111:2248–2258. 10.1111/cas.14490
REFERENCE
- 1. van Waardenburg DA, de Betue CT, Luiking YC, et al. Plasma arginine and citrulline concentrations in critically ill children: strong relation with inflammation. Am J Clin Nutr. 2007;86:1438‐1444. [DOI] [PubMed] [Google Scholar]
- 2. Ostrand‐Rosenberg S, Fenselau C. Myeloid‐derived suppressor cells: immune‐suppressive cells that impair antitumor immunity and are sculpted by their environment. J Immunol. 2018;200:422‐431. [DOI] [PMC free article] [PubMed] [Google Scholar]
- 3. Kim SH, Roszik J, Grimm EA, et al. Impact of l‐arginine metabolism on immune response and anticancer immunotherapy. Front Oncol. 2018;8:67. [DOI] [PMC free article] [PubMed] [Google Scholar]
- 4. Cassetta L, Baekkevold ES, Brandau S, et al. Deciphering myeloid‐derived suppressor cells: isolation and markers in humans, mice and non‐human primates. Cancer Immunol Immunother. 2019;68:687‐697. [DOI] [PMC free article] [PubMed] [Google Scholar]
- 5. Bronte V, Zanovello P. Regulation of immune responses by l‐arginine metabolism. Nat Rev Immunol. 2005;5:641‐654. [DOI] [PubMed] [Google Scholar]
- 6. Rodriguez PC, Zea AH, Culotta KS, et al. Regulation of T cell receptor CD3zeta chain expression by l‐arginine. J Biol Chem. 2002;277:21123‐21129. [DOI] [PubMed] [Google Scholar]
- 7. Gandhi L, Rodríguez‐Abreu D, Gadgeel S, et al. Pembrolizumab plus chemotherapy in metastatic non‐small‐cell lung cancer. N Engl J Med. 2018;378:2078‐2092. [DOI] [PubMed] [Google Scholar]
- 8. Socinski MA, Jotte RM, Cappuzzo F, et al. Atezolizumab for first‐line treatment of metastatic nonsquamous NSCLC. N Engl J Med. 2018;378:2288‐2301. [DOI] [PubMed] [Google Scholar]
- 9. Paz‐Ares L, Luft A, Vicente D, et al. Pembrolizumab plus chemotherapy for squamous non‐small‐cell lung cancer. N Engl J Med. 2018;379:2040‐2051. [DOI] [PubMed] [Google Scholar]
- 10. Motzer RJ, Penkov K, Haanen J, et al. Avelumab plus axitinib versus sunitinib for advanced renal‐cell carcinoma. N Engl J Med. 2019;380:1103‐1115. [DOI] [PMC free article] [PubMed] [Google Scholar]
- 11. Sistigu A, Viaud S, Chaput N, et al. Immunomodulatory effects of cyclophosphamide and implementation for vaccine design. Semin Immunopathol. 2011;33:369‐383. [DOI] [PubMed] [Google Scholar]
- 12. Ghiringhelli F, Larmonier N, Schmitt E, et al. CD4+ CD25+ regulatory T cells suppress tumor immunity but are sensitive to cyclophosphamide which allows immunotherapy of established tumors to be curative. Eur Immunol. 2004;34:336‐344. [DOI] [PubMed] [Google Scholar]
- 13. Kroemer G, Galluzzi L, Keep O, Zitvogel L. Immunogenic cell death in cancer therapy. Annu Rev Immunol. 2013;31(1):51‐72. [DOI] [PubMed] [Google Scholar]
- 14. Ding ZC, Lu X, Yu M, et al. Immunosuppressive myeloid cells induced by chemotherapy attenuate antitumor CD4+ T‐cell responses through the PD‐1‐PD‐L1 axis. Cancer Res. 2014;74:3441‐3453. [DOI] [PMC free article] [PubMed] [Google Scholar]
- 15. Kodumudi KN, Weber A, Sarnaik AA, et al. Blockade of myeloid‐derived suppressor cells after induction of lymphopenia improves adoptive T cell therapy in a murine model of melanoma. J Immunol. 2012;189:5147‐5154. [DOI] [PMC free article] [PubMed] [Google Scholar]
- 16. Iida Y, Harashima N, Motoshima T, et al. Contrasting effects of cyclophosphamide on anti‐CTL‐associated protein 4 blockade therapy in two mouse tumor models. Cancer Sci. 2017;108:1974‐1984. [DOI] [PMC free article] [PubMed] [Google Scholar]
- 17. Huang AY, Gulden PH, Woods AS, et al. The immunodominant major histocompatibility complex class I‐restricted antigen of a murine colon tumor derives from an endogenous retroviral gene product. Proc Natl Acad Sci USA. 1996;93:9730‐9735. [DOI] [PMC free article] [PubMed] [Google Scholar]
- 18. Cao Y, Wang Q, Du Y, et al. l‐Arginine and docetaxel synergistically enhance anti‐tumor immunity by modifying immune status of tumor‐bearing mice. Int Immunopham. 2016;35:7‐14. [DOI] [PubMed] [Google Scholar]
- 19. He X, Lin H, Yuan L, Li B. Combination therapy with l‐arginine and α‐PD‐L1 antibody boost immune response against osteosarcoma in immunocompetent mice. Cancer Biol Ther. 2017;18:91‐100. [DOI] [PMC free article] [PubMed] [Google Scholar]
- 20. Ding ZC, Munn DH, Zhou G. Chemotherapy‐induced myeloid suppressor cells and antitumor immunity: The Janus face of chemotherapy in immunomodulation. Oncoimmunology. 2014;3:e954471. [DOI] [PMC free article] [PubMed] [Google Scholar]
- 21. Tapiero H, Mathé G, Couvreur P, et al. Arginine. Biomed Pharmacother. 2002;56:439‐445. [DOI] [PubMed] [Google Scholar]
- 22. Geiger R, Rieckmann JC, Wolf T, et al. l‐Arginine modulates T cell metabolism and enhances survival and anti‐tumor activity. Cell. 2016;167:829‐842. [DOI] [PMC free article] [PubMed] [Google Scholar]
- 23. Lanz TV, Becker S, Mohapatra SR, et al. Suppression of Th1 differentiation by tryptophan supplementation in vivo. Amino Acids. 2017;49:1169‐1175. [DOI] [PubMed] [Google Scholar]
- 24. European Food Safety Authority (EFSA) . Opinion of the Panel on additives and products or substances used in animal feed (FEEDAP) on the safety and efficacy of the product containing l‐arginine produced by fermentation from Corynebacterium glutamicum (ATCC‐13870) for all animal species. EFSA J. 2007;4731–19. [Google Scholar]
- 25. Shao A, Hathcock JN. Risk assessment for the amino acids taurine, l‐glutamine and l‐arginine. Regul Toxicol Pharmacol. 2008;50:376‐399. [DOI] [PubMed] [Google Scholar]
- 26. Morita M, Hayashi T, Ochiai M, et al. Oral supplementation with a combination of l‐citrulline and l‐arginine rapidly increases plasma l‐arginine concentration and enhances NO bioavailability. Biochem Biophys Res Commun. 2014;454:53‐57. [DOI] [PubMed] [Google Scholar]
- 27. Scurr M, Pembroke T, Bloom A, et al. Low‐dose cyclophosphamide induces antitumor T‐cell responses, which associate with survival in metastatic colorectal cancer. Clin Cancer Res. 2017;23:6771‐6780. [DOI] [PMC free article] [PubMed] [Google Scholar]
- 28. Heylmann D, Bauer M, Becker H, et al. Human CD4+ CD25+ regulatory T cells are sensitive to low dose cyclophosphamide: implications for the immune response. PLoS One. 2013;8:e83384. [DOI] [PMC free article] [PubMed] [Google Scholar]
- 29. Sallusto F, Lenig D, Förster R, et al. Two subsets of memory T lymphocytes with distinct homing potentials and effector functions. Nature. 1999;401:708‐712. [DOI] [PubMed] [Google Scholar]
- 30. Chao CC, Jensen R, Dailey MO. Mechanisms of L‐selectin regulation by activated T cells. J Immunol. 1997;159:1686‐1694. [PubMed] [Google Scholar]
- 31. Kjaergaard J, Shu S. Tumor infiltration by adoptively transferred T cells is independent of immunologic specificity but requires down‐regulation of L‐selectin expression. J Immunol. 1999;163:751‐759. [PubMed] [Google Scholar]
- 32. Wirth TC, Badovinac VP, Zhao L, et al. Differentiation of central memory CD8 T cells is independent of CD62L‐mediated trafficking to lymph nodes. J Immunol. 2009;182:6195‐6206. [DOI] [PubMed] [Google Scholar]
Associated Data
This section collects any data citations, data availability statements, or supplementary materials included in this article.
Supplementary Materials
Figure S1
Figure S2
Figure S3
Figure S4
Figure S5
Figure S6
Figure S7


