

Abstract
Mitochondria are signaling hubs in eukaryotic cells. Here, we showed that the mitochondrial FUN14-domain-containing protein-1 (FUNDC1), an effector of Parkin-independent mitophagy, also participates in cellular plasticity by sustaining oxidative bioenergetics, buffering ROS production and supporting cell proliferation. Targeting this pathway in cancer cells suppressed tumor growth but rendered transformed cells more motile and invasive in a manner dependent on ROS-mediated mitochondrial dynamics and mitochondrial repositioning to the cortical cytoskeleton. Global metabolomics and proteomics profiling identified a FUNDC1 interactome at the mitochondrial inner membrane, comprising the AAA+ protease, LonP1 and subunits of oxidative phosphorylation, complex V (ATP synthase). Independently of its previously identified role in mitophagy, FUNDC1 enabled LonP1 proteostasis, which in turn preserved complex V function and decreased ROS generation. Therefore, mitochondrial reprogramming by a FUNDC1-LonP1 axis controls tumor cell plasticity by switching between proliferative and invasive states in cancer.
INTRODUCTION
Mitochondrial functions in oxidative metabolism, redox balance and gene expression maintain cellular homeostasis and tissue specialization (1). However, how these processes participate in cellular adaptation or plasticity has not been clearly delineated (2). Tumors are prime examples of cellular plasticity (3) because transformed cells must continuously titrate cues from a rapidly changing and often unfavorable microenvironment (4) to thwart cell death (5), sustain cell proliferation (6), and, in some cases, activate cell motility and invasion to colonize distant organs during the process of metastasis (7).
The effectors of cellular plasticity in cancer (3), in particular those that control the balance between cell proliferation and cell motility are still mostly elusive (8), and a potential role of mitochondria in this process has only recently been hypothesized (9). On the other hand, there is evidence that mitochondrial functions are broadly exploited in cancer (10). Specifically, oxidative bioenergetics (11), ROS signaling (12), and mitochondrial dynamics, an adaptive process that controls the size, shape and subcellular distribution of mitochondria (13) have been implicated in key disease traits of therapy resistance (14), stemness (15) and tumor growth in vivo (16).
Mechanistically, mitochondrial reprogramming in cancer (10) relies on an increase in protein folding quality control (17). This buffers the risk of proteotoxic stress (18) and globally maintains mitochondrial integrity through the complementary activities of molecular chaperones, including Heat Shock Protein-90 (Hsp90) molecules in protein folding (17) and AAA+ proteases ClpXP (19, 20) and LonP1 (21) in proteolytic disposal of misfolded and aggregated proteins. These two arms of mitochondrial proteostasis are invariably exploited in cancer and may provide a therapeutic target (22), but their contribution to cellular plasticity and disease traits have not been fully elucidated. In this study, we identified mitophagy effector FUN14-domain-containing protein-1 (FUNDC1) (23) as a regulator of mitochondrial proteostasis that controls the balance between cell proliferation and cell motility states in cancer.
RESULTS
FUNDC1 regulates mitochondrial-directed cell motility.
In unpublished results, FUNDC1 (23) was identified in a short interfering RNA (shRNA) screen as a candidate molecule required for inhibition of tumor cell invasion mediated by mitochondrial proteotoxic stress (24). To explore this possibility, we characterized pooled small interfering RNA (siRNA) sequences that suppress FUNDC1 protein levels in prostate adenocarcinoma PC3 cells (fig. S1A). We also generated clones of PC3 cells stably transduced with FUNDC1-directed shRNA, which suppressed endogenous FUNDC1 expression (fig. S1B). Consistent with the unpublished results of the shRNA screen (24), knockdown of FUNDC1 partially rescued the inhibition of tumor cell invasion mediated by the mitochondrial-targeted Hsp90 inhibitor, Gamitrinib (fig. S1, C and D), which induces mitochondrial proteotoxic stress. A control, non-targeting siRNA did not affect tumor cell invasion (fig. S1, C and D).
We next asked if FUNDC1 had a role in cell motility. Silencing of FUNDC1 in PC3 cells promoted focal adhesion (FA) dynamics (Fig. 1A, Movie S1 and S2), a prerequisite of cell motility. Quantification of this response demonstrated that loss of FUNDC1 increased the rates of FA assembly and disassembly (Fig. 1B), promoted new FA formation, and concomitantly decreased stable FA, compared to control cultures (fig. S1E). Consistent with these results, FUNDC1 knockdown increased the 2D motility of PC3 cells (Fig. 1C), prostate adenocarcinoma DU145 cells (fig. S1F) and glioblastoma LN229 (fig. S1G) cells, compared to control siRNA transfectants. In these experiments, loss of FUNDC1 increased both the speed of cell movements as well as the distance traveled by individual cells (Fig. 1D, fig. S1H). A control siRNA had no effect (Fig. 1, C and D, fig. S1, F–H). When analyzed for directional chemotaxis, FUNDC1 silencing resulted in increased propensity for random, in addition to directional tumor cell movements (Fig. 1E). Conversely, control transfectants uniformly migrated directionally along a chemotactic gradient (Fig. 1E). Finally, FUNDC1-targeted PC3 cells exhibited greater invasion across Matrigel-coated inserts, compared to controls (Fig. 1F).
Fig. 1. FUNDC1 regulates tumor cell movements.
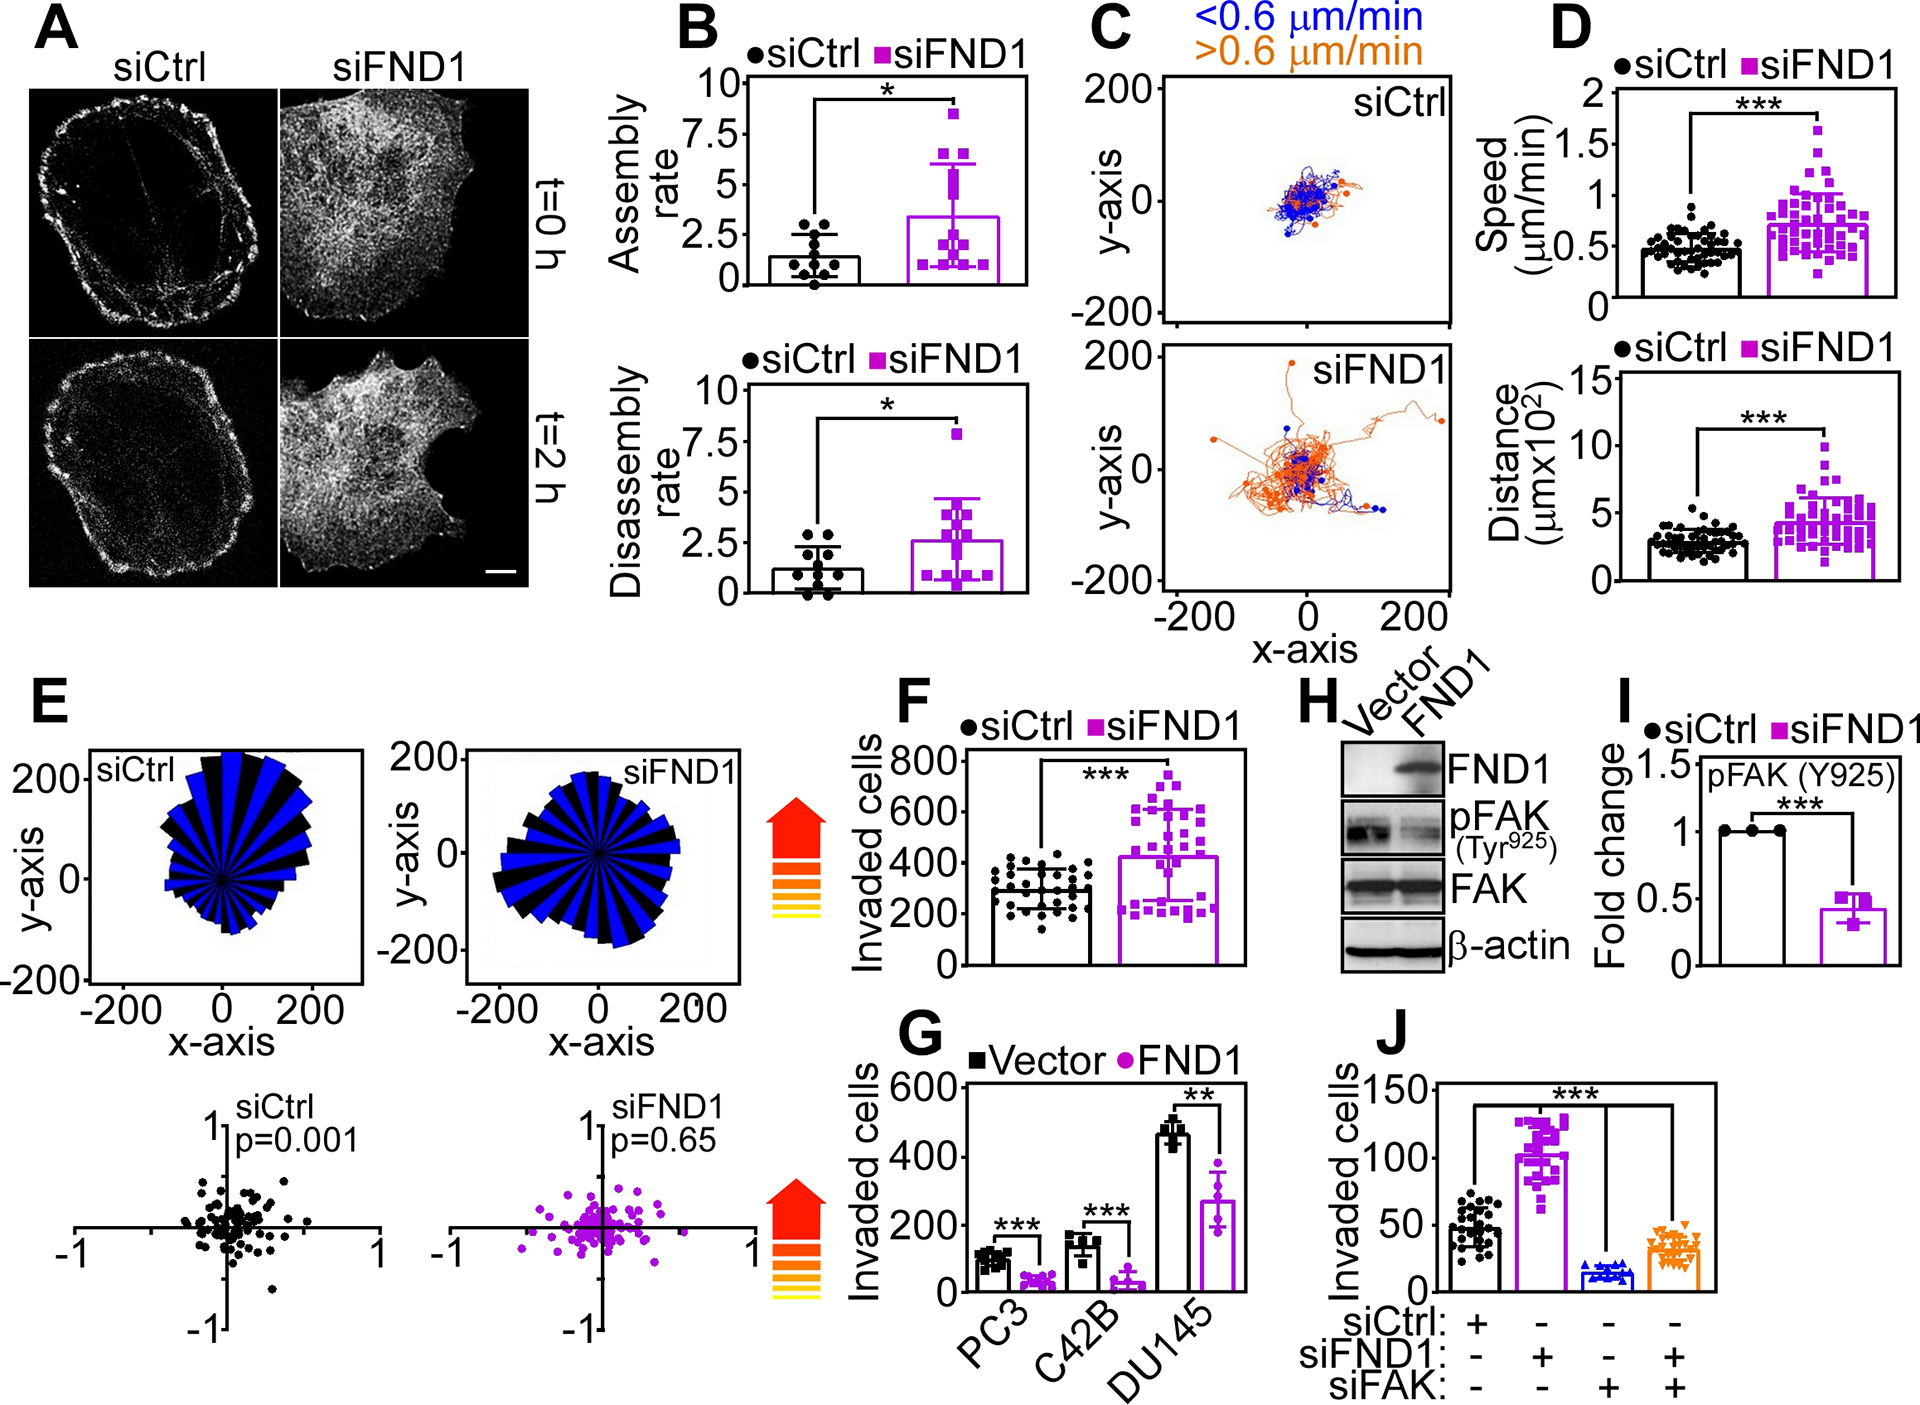
(A) PC3 cells transfected with control non-targeting siRNA (siCtrl) or FUNDC1-directed pooled siRNA (siFND1) were labeled with Talin-RFP and analyzed for focal adhesion (FA) dynamics by time-lapse videomicroscopy. Representative images at 0 h and 2 h from 3 independent experiments are shown. (B) The rate (events/h) of FA assembly (top) or disassembly (bottom) was quantified from the cells in (A). Each point corresponds to FA events in an individual cell (11–14 cells per condition). Mean±SD (N=3 independent experiments per group). *, p=0.02–0.04. (C and D) PC3 cells transfected with siCtrl or siFND1 were analyzed for cell motility in 2D contour plots by time-lapse video microscopy (C) with quantification of speed of cell movements (D, top) and distance traveled by individual cells (D, bottom). Each tracing in (C) corresponds to the movements of an individual cell (49 cells per condition) in a representative experiment. The cutoff velocities for slow (blue, <0.6 μm/min)- or fast (orange, >0.6 μm/min)-moving cells are indicated. Mean±SD (N=3 independent experiments per group). ***, p<0.0001. (E) PC3 cells transfected with siCtrl or siFND1 were analyzed for 2D chemotaxis in a rose plot (top) with quantification of the forward migration index (bottom). Arrows indicate the direction of the chemotactic gradient. Each point corresponds to an individual cell (89 cells per condition; N=3 independent experiments per group). (F) PC3 cells transfected with siCtrl or siFND1 were analyzed for invasion across Matrigel-coated Transwell inserts. Each point corresponds to an individual determination. Mean±SD (N=3 independent experiments per group). ***, p=0.0001. (G) The indicated prostate cancer cell lines were transfected with vector or FND1 cDNA and analyzed for Matrigel invasion. Mean±SD (N=3 independent experiments per group). **, p=0.001; ***, p <0.0001 – 0.0005. (H and I) PC3 cells transfected with vector or FND1 cDNA were analyzed by Western blotting (H, representative blot of three independent experiments) and the intensity of phosphorylated (p) FAK protein band was quantified by densitometry (I). Mean±SD (N=3 independent experiments per group). ***, p=0.0008. (J) PC3 cells transfected with siCtrl or siFND1 were analyzed for Matrigel invasion in the presence or absence of FAK-directed siRNA (siFAK). Mean±SD (N=3 independent experiments per group). ***, p<0.0001.
To test the specificity of this response, we next carried out reciprocal experiments in which FUNDC1 was overexpressed in tumor cells. Here, forced expression of FUNDC1 suppressed 2D tumor cell migration (fig. S1I), reducing the speed of cell movements and the distance traveled by individual cells compared to control transfectants (fig.S1J). Cells overexpressing FUNDC1 showed reduced Matrigel invasion (Fig. 1G) and decreased activating phosphorylation (Tyr925) of the cell motility kinase FAK (Fig. 1, H and I). Functionally, siRNA-mediated silencing of FAK reversed the increase in tumor cell invasion induced by FUNDC1 depletion (Fig. 1J).
FUNDC1 differentially affects cell motility and cell proliferation.
Bioinformatics analysis of public databases demonstrated that FUNDC1 copy number and mRNA levels were heterogeneously expressed in disparate tumor types (fig. S2A), including the Cancer Cell Line Encyclopedia (fig. S2B). Accordingly, FUNDC1 was present at variable levels in cell lines representative of lung (H1299, A549 and H460) and breast (MCF7, MDA231) adenocarcinoma (fig. S2C). Therefore, we next looked at how different levels of FUNDC1 may affect tumor response(s). Consistent with the data above, forced expression of FUNDC1 inhibited Matrigel invasion of multiple prostate cancer cell types, compared to control transfectants (Fig. 2A). However, under the same conditions, FUNDC1 overexpression significantly increased tumor cell proliferation (Fig. 2B). In reciprocal experiments, FUNDC1 knockdown inhibited PC3 cell proliferation (fig. S2D) and reduced colony formation (Fig. 2, C and D), a marker of tumorigenicity. These effects were accompanied by cell cycle arrest at S and G2/M phases (fig. S2E).
Fig. 2. Dual regulation of primary and metastatic tumor growth by FUNDC1.
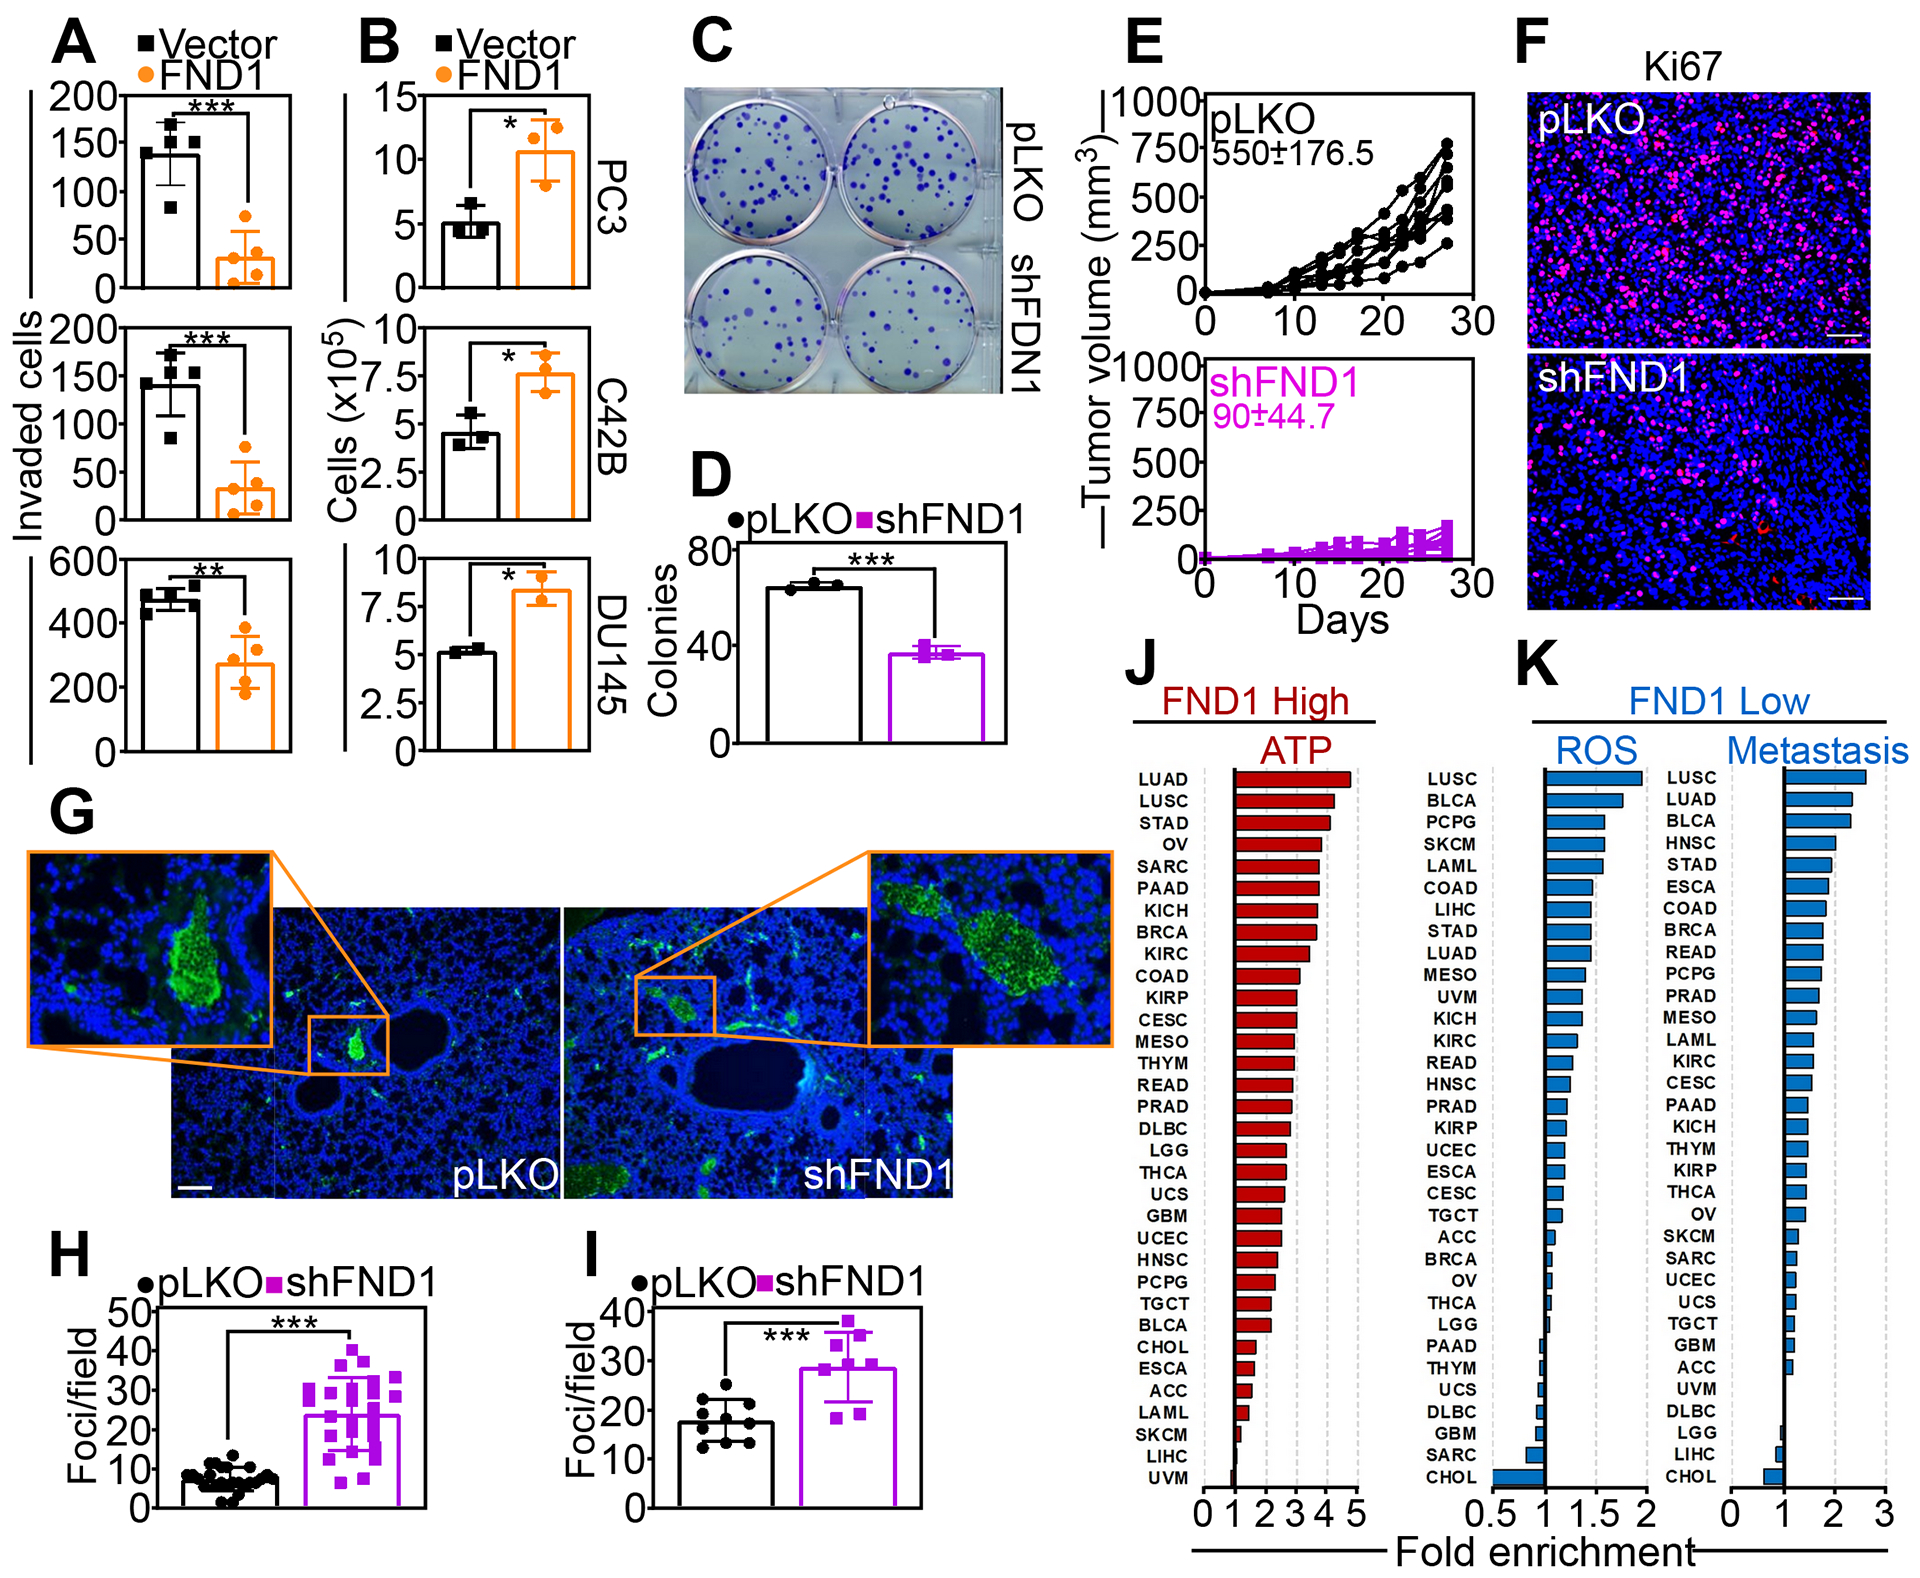
(A and B) PC3 (top), C42B (middle) or DU145 (bottom) cells were transfected with vector or FND1 cDNA and analyzed for Matrigel invasion (A) or cell proliferation by direct cell counting (B). Mean±SD (N=3 or 5 independent experiments per condition). **, p=0.001; ***, p <0.0001–0.0005. (C and D) PC3 cells stably transduced with pLKO or FUNDC1-directed shRNA (shFND1) were analyzed for colony formation (C) and quantified after 14 d (D). Mean±SD (N=3 independent experiments per group). ***, p<0.0001. (E) PC3 cells transduced with pLKO or shFND1 were engrafted subcutaneously onto the flanks of immunocompromised mice (N=10 animals/group) and tumor growth was quantified at the indicated time intervals. Each line corresponds to an individual tumor. The mean±SD tumor size (mm3) for each animal group harvested at day 27 is indicated, p<0.0001. (F) Representative tumor samples from each animal group in (E) were excised at the end of the experiment and analyzed for Ki67 staining by immunohistochemistry. Representative images are shown. Scale bar, 100 μm. (G and H) Representative lung samples isolated from each animal group in (E) were stained with an antibody to human mitochondria by immunohistochemistry (G, representative images) and the number of lung metastatic foci was quantified (H). Scale bar, 100 μm. Mean±SD (N=25 determinations per group). ***, p<0.0001. (I) PC3 cells stably transduced with pLKO or shFND1 were injected into the spleen of immunocompromised mice (N=5 animals per group) and metastatic foci to the liver were quantified after 11 days by histology. Mean±SD (N=8–10 determinations per group). ***, p=0.0009. (J and K) RNA-seq expression data from 33 cancer types (TCGA) for genes (Spearman r>0.2; p<0.05) positively (J, GO:0046034, ATP metabolism) or negatively (K, GO:0000302, response to ROS; GO:0048870, cell motility; GO:0008283, cell proliferation) correlated with FUNDC1 (FND1) expression.
Next, we asked if potential opposing effects of FUNDC1 in cell motility and cell proliferation affected tumor growth. Engraftment of PC3 cells stably transduced with pLKO vector onto the flanks of immunocompromised mice gave rise to exponentially growing superficial tumors (Fig. 2E). In contrast, stable knockdown of FUNDC1 suppressed xenograft tumor growth in immunocompromised mice (Fig. 2E). By immunohistochemistry, FUNDC1-depleted tumors showed a statistically significant reduction in the number of Ki67-positive cells, a marker of cell proliferation, compared to controls (Fig. 2F, fig. S2F). Although impaired for primary tumor growth, PC3 cells lacking FUNDC1 gave rise to an increased number of spontaneous metastases to the lungs, compared to pLKO-expressing tumors (Fig. 2, G and H). To confirm this response, we used a second metastasis model in which tumor cells are injected into the spleen of immunocompromised animals, and metastatic foci to the liver are quantified histologically after 11 d. In this model, PC3 cells depleted of FUNDC1 produced more metastatic foci in the liver, compared to pLKO-transduced cells (Fig. S2G, Fig. 2I). However, the surface areas of liver metastases did not differ between animals injected with pLKO and shFUNDC1-transduced cells (fig. S2H).
Next, we looked at the impact of FUNDC1 in human samples. Inspection of RNA-seq expression data of 33 cancer types in the TCGA database (fig. S2I) revealed that high levels of FUNDC1 correlated with the expression of genes involved in ATP bioenergetics in most tumor types (97/94/91% of samples with enrichment of at least >1/10/20%) (Fig. 2J, fig. S2J). Conversely, low levels of FUNDC1 correlated with the expression of genes involved in ROS signaling (79/64/52%) and metastatic competence (cell motility/invasion) (Fig. 2K, fig. S2J) in most cancers (85/85/79%). In this analysis, a high correlation (Pearson r=0.51) between ATP and metastasis-enrichment signatures was observed across different cancer types (fig. S2, I and J), and was the highest in lung cancer (both adenocarcinoma and squamous cell carcinoma subtypes) (fig. S2J).
FUNDC1 regulates mitochondrial dynamics and subcellular trafficking.
Because cell motility is regulated by changes in mitochondrial dynamics, especially fission (24), we next investigated whether FUNDC1 signaling affected mitochondrial dynamics. Knockdown of FUNDC1 in DU145 or LN229 cells increased the redistribution of mitochondria from a perinuclear localization to the peripheral, or cortical cytoskeleton (Fig. 3, A and B). By time-lapse videomicroscopy, this redistribution reflected heightened mitochondrial motility, with faster speed of organelle movements and greater distance traveled by individual mitochondria, compared to control transfectants (Fig. 3C, fig. S3A). In addition, FUNDC1-silenced cells exhibited increased mitochondrial association of Ser616 phosphorylated, and therefore active, dynamin-related protein-1 (Drp1) (fig. S3B, Fig. 3D), which mediates mitochondrial fission. Consistent with these findings, FUNDC1 loss induced heightened mitochondrial dynamics compared to control transfectants, with increased mitochondrial fission in both PC3 (Fig. 3, E and F, Movie S3 and Movie S4) and LN229 (fig. S3C, Fig. 3F, Movie S5 and Movie S6) cells. Accordingly, PC3 cells depleted in FUNDC1 showed reduced mitochondrial mass, compared to control transfectants (Fig. 3, G and H). Functionally, targeting mitochondrial fission by silencing Drp1 abrogated the increase in PC3 cell invasion after FUNDC1 loss (Fig. 3I). In addition, knockdown of the kinesin family protein, Kif5B, which mediates anterograde mitochondrial movements and is important for tumor cell invasion (24), also abolished the increase in Matrigel invasion induced by FUNDC1 knockdown (Fig. 3J). A control siRNA did not affect tumor cell invasion (Fig. 3J).
Fig. 3. FUNDC1 controls mitochondrial dynamics.
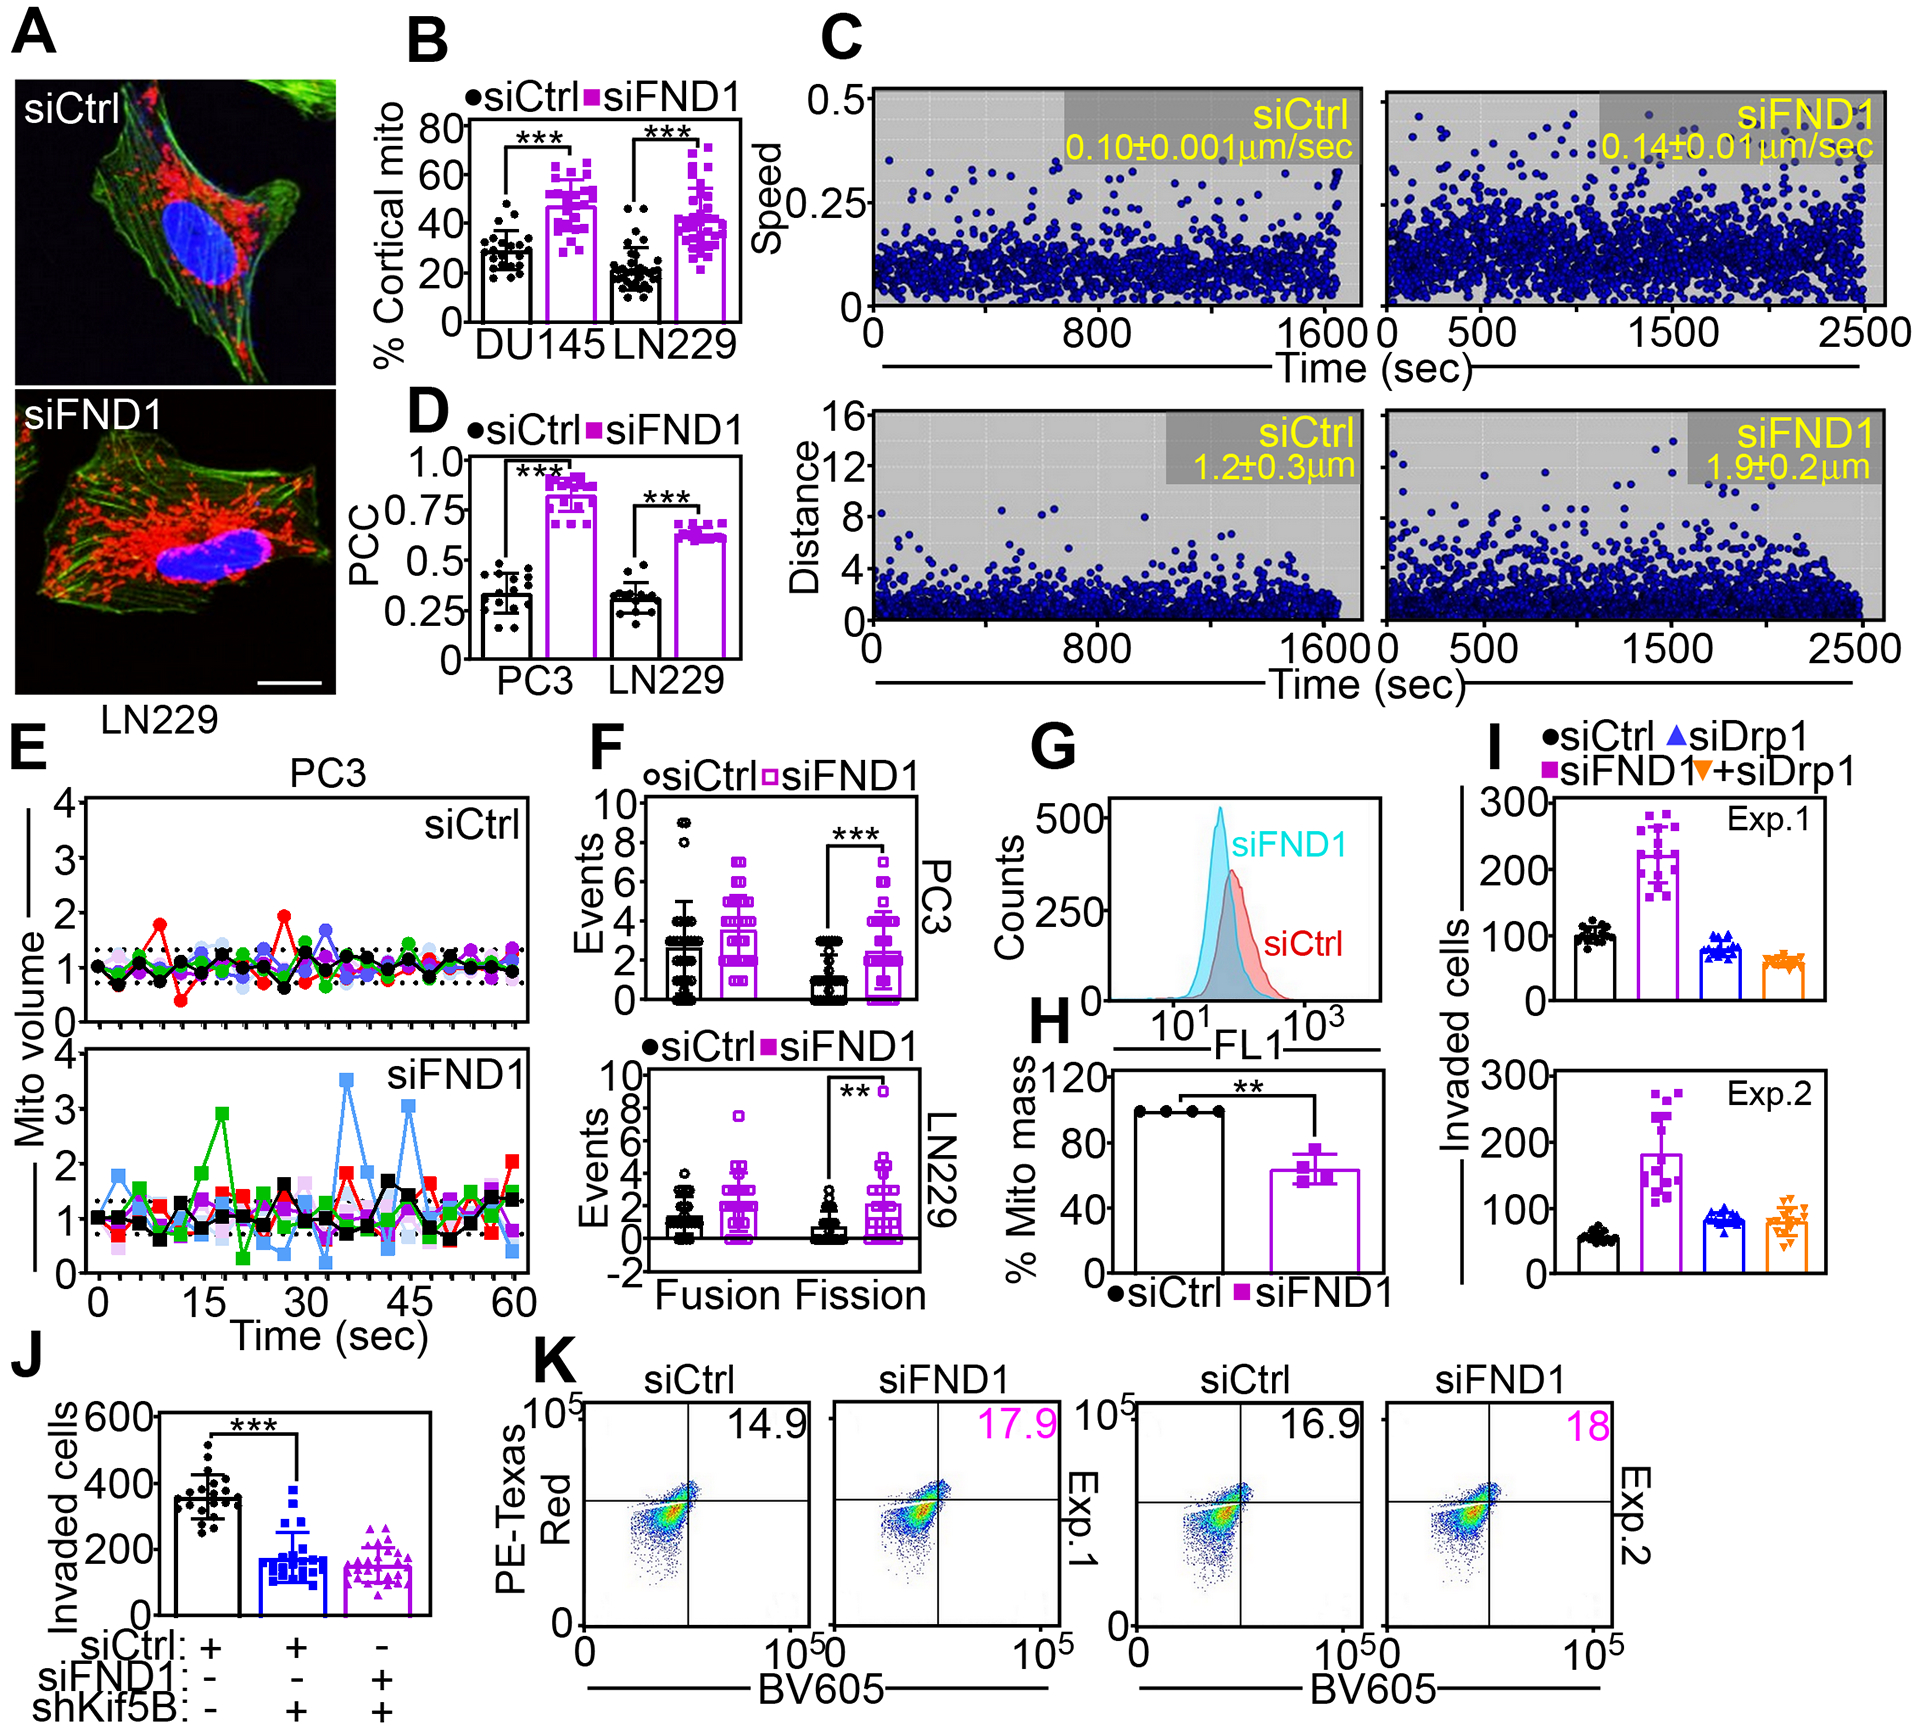
(A and B) DU145 or LN229 cells transfected with siCtrl or siFND1 were imaged for subcellular mitochondrial localization (A, representative images for LN229 cells) and mitochondrial accumulation at the cortical cytoskeleton was quantified (B). Each point corresponds to the percentage of cortical mitochondria in an individual cell. Scale bar, 20 μm. Mean±SD (N=3 independent experiments per group). ***, p<0.0001. (C) PC3 cells transfected with siCtrl or siFND1 were analyzed for mitochondrial motility with quantification of speed of mitochondrial movements (top) and distance traveled by individual mitochondria (bottom). Each symbol corresponds to the tracked movement of an individual mitochondrion. Data are representative of 3 independent experiments per group. The mean±SD of mitochondrial speed (siCtrl compared to siFND1, p<0.0001) or distance traveled (siCtrl compared to siFND1, p=0.0008) is indicated. (D) Co-localization of Ser616-phosphorylated Drp1 and MitoTracker was quantified in PC3 or LN229 cells transfected with siCtrl or siFND1. Each point corresponds to an individual cell. PCC, Pearson Correlation Coefficient. Mean±SD (N=3 independent experiments per group). ***, p<0.0001. (E) PC3 cells transfected with siCtrl or siFND1 were analyzed for changes in mitochondrial (Mito) volume representative of mitochondrial fusion (>1.3-fold) or fission (<0.7-fold) by time-lapse videomicroscopy. Each tracing corresponds to an individual cell (6 cells in a representative experiment). Data are representative of 3 independent experiments per group. The cutoff lines are indicated. (F) Mitochondrial fusion or fission events for PC3 (top, 32–33 cells analyzed) or LN229 (bottom, 22–23 cells analyzed) cells were quantified over a 60-sec interval. Each point corresponds to the number of events per cell. Mean±SD (N=3 independent experiments per group). **, p=0.008; ***, p=0.001. (G and H) PC3 cells transfected with siCtrl or siFND1 were analyzed for mitochondrial mass by MitoTracker staining and flow cytometry (G, tracings are from a representative experiment) and quantified (H). Mean±SD (N=4 independent experiments per group). **, p=0.004. (I) PC3 cells transfected with siCtrl or siFND1 were analyzed for Matrigel invasion in the presence or absence of siDrp1. Two independent experiments (Exp) are shown. Mean±SD of 15 technical replicates per experiment. (J) PC3 cells transfected with siCtrl or siFND1 were analyzed for Matrigel invasion in the presence or absence of Kif5B-directed siRNA (siKif5B). Mean±SD (N=3 independent experiments per group). ***, p<0.0001. (K) DU145 cells expressing mitochondrial Keima-Red fluorescence reporter were transfected with siCtrl or siFND1 and analyzed by flow cytometry. The percentage of PE-Texas Red+ cells in the two upper quadrants corresponding to mitophagy are indicated. Two independent experiments (Exp) are shown.
FUNDC1 has been implicated in Parkin-independent mitophagy (23), and a role of this pathway in tumor cell motility was next investigated. Silencing of FUNDC1 in DU145 cells had minimal effects on pH-sensitive fluorescence emissions from a mitochondrial Keima-Red reporter, which monitors mitochondrial fusion with lysosomes during mitophagy (Fig. 3K). Similar results were obtained with a different cell line (PC3), where FUNDC1 knockdown only modestly increased mitochondrial Keima-Red fluorescence signals under conditions of normoxia or hypoxia, compared to control siRNA transfectants (fig. S3D). Conversely, forced expression of siRNA-resistant wild-type FUNDC1 in PC3 (fig. S3E) or DU145 (fig. S3F) cells increased mitophagy-associated mitochondrial Keima-Red fluorescence, consistent with FUNDC1 regulation of mitophagy.
FUNDC1 controls mitochondrial oxidative functions.
To elucidate how FUNDC1 affects mitochondrial activities, we next carried out a metabolomics screen in control or FUNDC1-silenced PC3 cells. Loss of FUNDC1 caused extensive defects in mitochondrial bioenergetics (Fig. 4A), characterized by reduced levels of TCA cycle products, pyruvate, cis-aconitase, α-ketoglutarate, and succinate, and increased oxidized glutathione and ROS, consistent with unbalanced mitochondrial antioxidant mechanisms (Fig. 4B). Accordingly, silencing of FUNDC1 by siRNA (Fig. 4C) or shRNA (fig. S4A) decreased oxygen consumption rates (OCR) in tumor cells (Fig. 4C), a marker of oxidative metabolism, affecting both basal and maximal respiration (fig. S4B). Extracellular acidification rates (ECAR) were also lower after transient (fig. S4C) or stable (fig. S4D) FUNDC1 knockdown. Consistent with impaired bioenergetics, FUNDC1-depleted cells showed reduced rates of ATP production (fig. S4E) and markers of cellular starvation, including AMPK phosphorylation on Thr172 (fig. S4F) and punctate LC3 fluorescence staining (fig. S4, G and H), both of which suggested increased autophagy. In contrast, treatment with pharmacologic inhibitors of autophagy, 3-methyladenine or bafilomycin A, did not affect the increase in tumor cell invasion mediated by FUNDC1 silencing (fig. S4I).
Fig. 4. Control of mitochondrial bioenergetics and oxidative stress by FUNDC1.
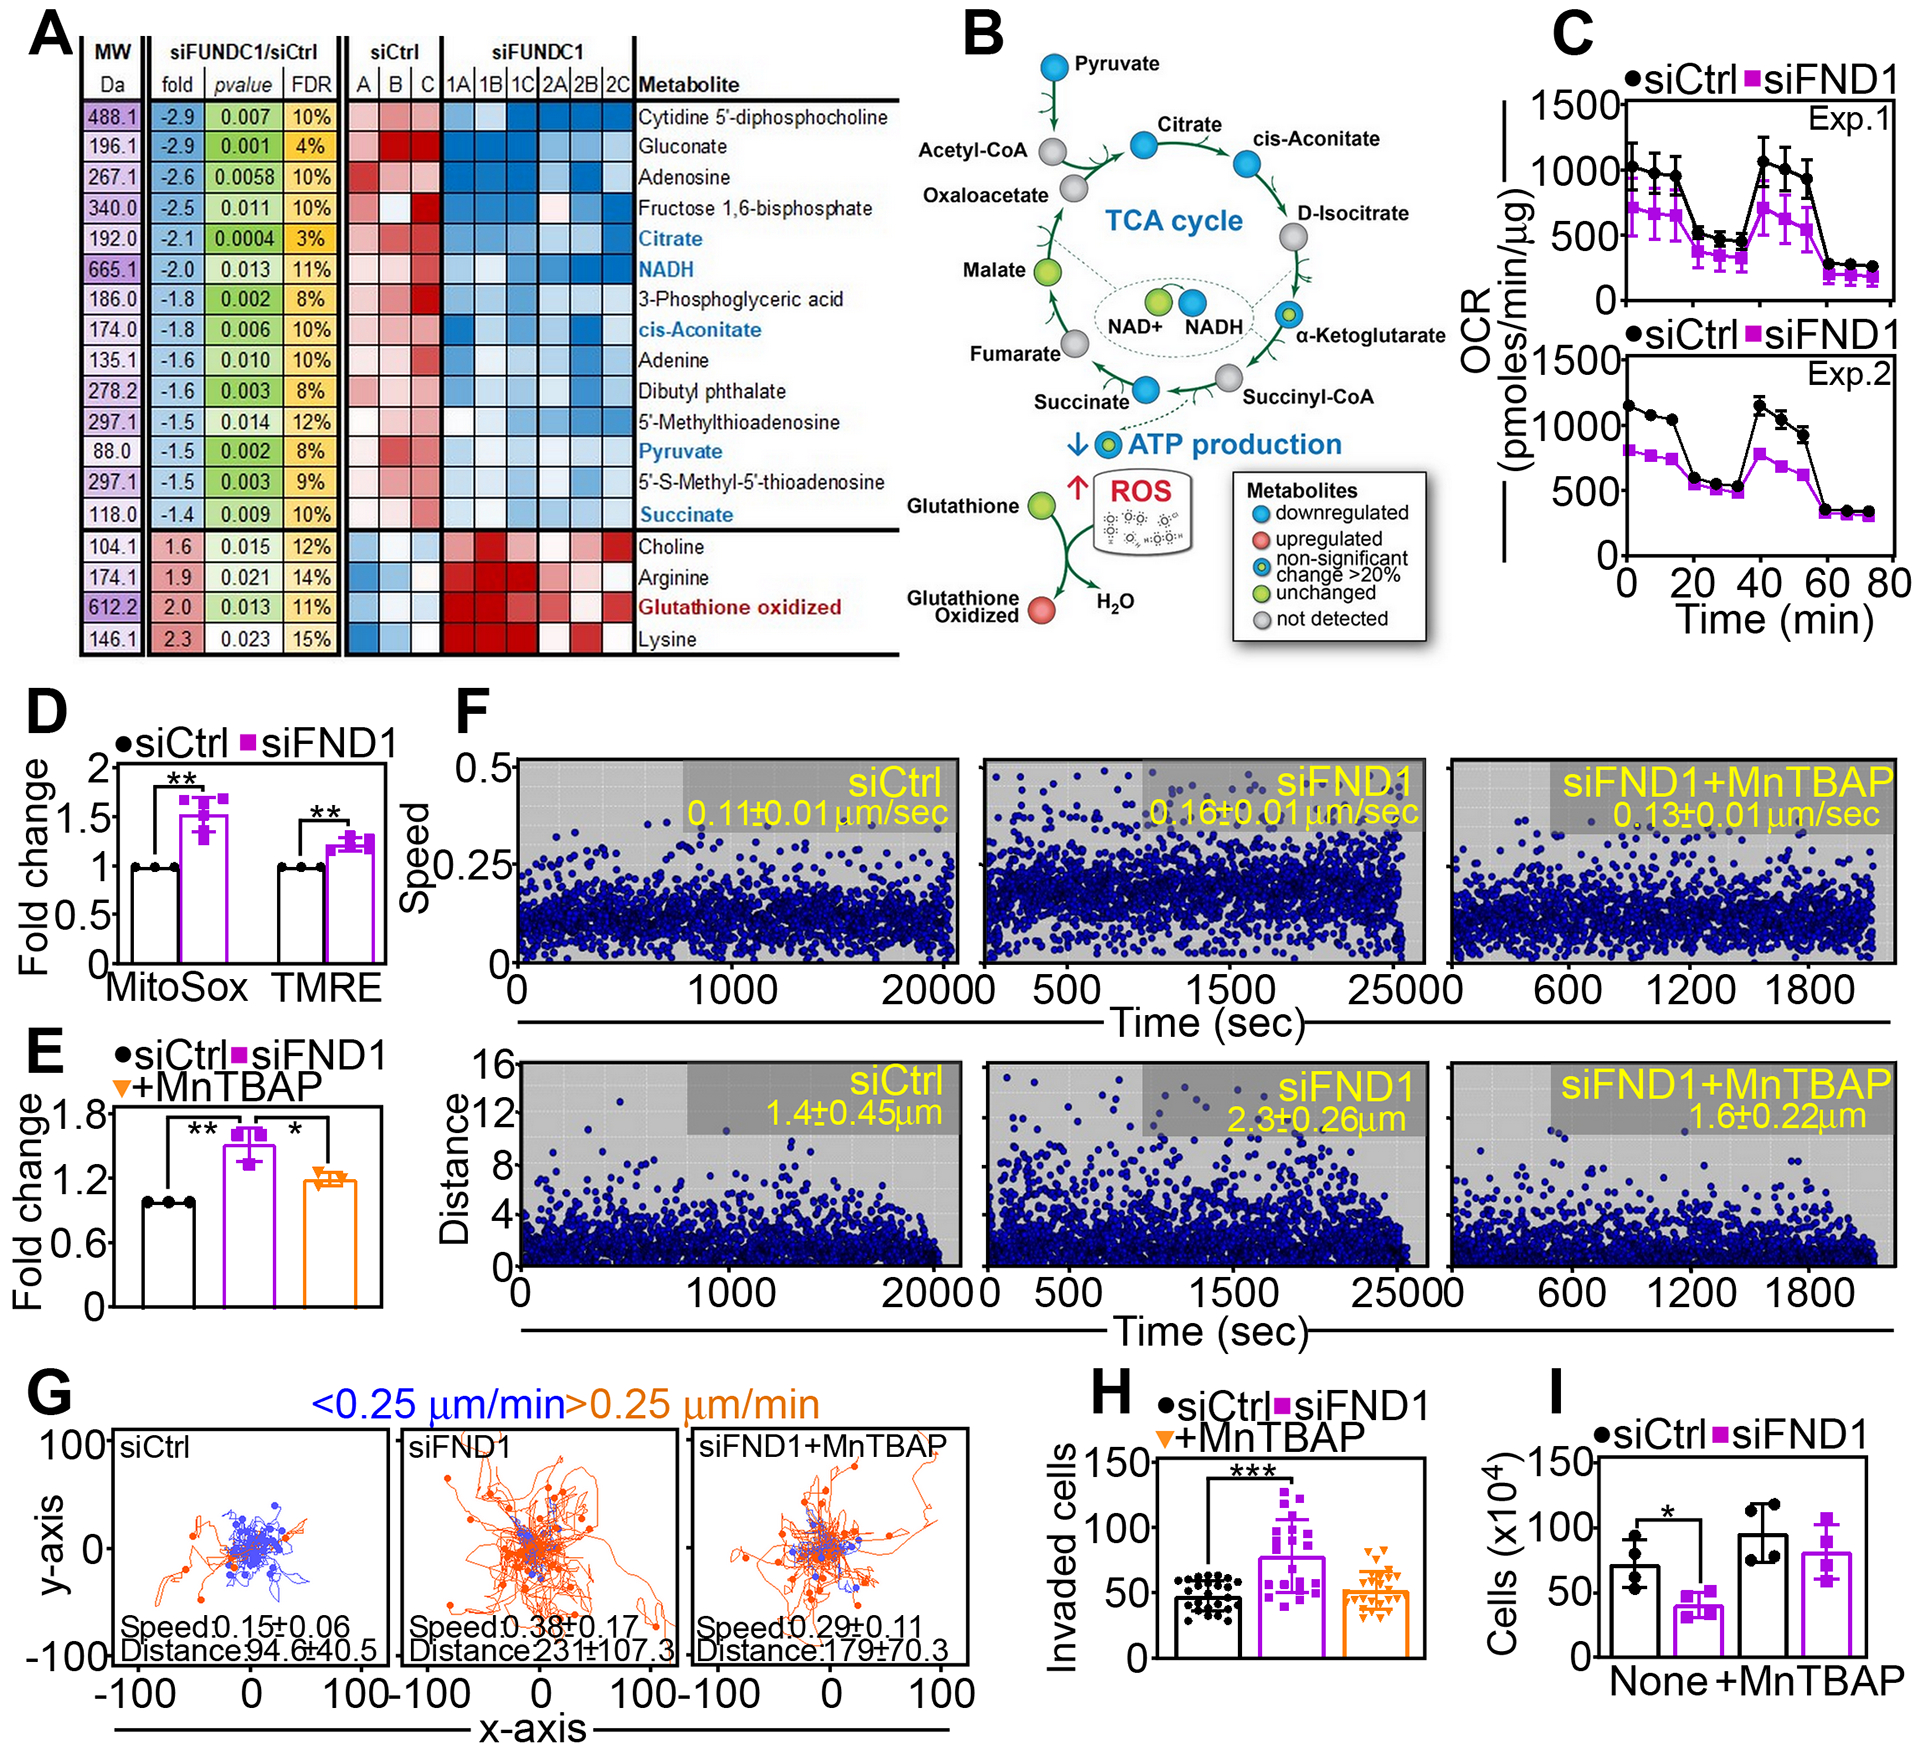
(A) Heatmap of changes in metabolite levels in PC3 cells transfected with siCtrl or siFND1. Fold changes, p values and false discovery rate (FDR) are indicated. Data are from a representative experiment (siCtrl) or two independent experiments in triplicate (siFND1, 1A-C; 2A-C). (B) Schematic diagram of mitochondrial bioenergetics and ROS pathways affected by FUNDC1 silencing as in (A). (C) PC3 cells transfected with siCtrl or siFND1were analyzed for oxygen consumption rates (OCR) on a Seahorse XFe96 Bioenergetics Flux Analyzer. Tracings from two independent experiments (Exp) are shown. Mean±SD of 3 technical replicates per experiment. (D) PC3 cells transfected with siCtrl or siFND1were analyzed for MitoSox reactivity and mitochondrial membrane potential (TMRE) by flow cytometry. Mean±SD (N=3–4 independent experiments per group). **, p=0.001. (E) PC3 cells transfected with siCtrl or siFND1were analyzed for MitoSox reactivity in the presence or absence of the superoxide scavenger, MnTBAP, by flow cytometry. Mean±SD (N=3 independent experiments per group). **, p=0.005; *, p=0.03. (F) PC3 cells transfected with siCtrl or siFND1were analyzed for speed of mitochondrial movements (top) or distance traveled by individual mitochondria (bottom) with or without MnTBAP. Each symbol corresponds to the tracked movement of an individual mitochondrion. Data are representative of 3 independent experiments. The mean±SD of mitochondrial speed (siCtrl compared to siFND1, p<0.0001; siFND1 compared to siFND1+MnTBAP, p=0.002) and distance traveled (siCtrl compared to siFND1, p=0.001; siFND1 compared to siFND1+MnTBAP, p=0.0005) are indicated. (G) siCtrl- or siFND1-transfected PC3 cells were analyzed for cellular motility in 2D contour plots in the presence or absence of MnTBAP. Each tracing corresponds to the movements of an individual cell. The cut-off velocities for slow (<0.25 μm/min)- or fast (>0.25 μm/min)-moving cells are indicated. Data are representative of 3 independent experiments per group. The speed (μm/min) of cell motility (siCtrl compared to siFND1, p<0.0001; siFND1 compared to siFND1+MnTBAP, p=0.006) and distance (μm) traveled (siCtrl compared to siFND1, p<0.0001; siFND1 compared to siFND1+MnTBAP, p=0.006) are indicated. (H) PC3 cells transfected with siCtrl or siFND1 were analyzed for Matrigel invasion in the presence or absence of MnTBAP. Mean±SD (N=3 independent experiments per group). ***, p<0.0001. (I) PC3 cells transfected with siCtrl or siFND1 were analyzed for cell proliferation in the presence or absence of MnTBAP by direct cell counting. Mean±SD (N=4 independent experiments per group). **, p=0.03.
In line with the results of the metabolomics screen, knockdown of FUNDC1 increased mitochondrial ROS production and heightened mitochondrial inner membrane potential, compared to control transfectants (Fig. 4D). In contrast, intracellular levels of H2O2 remained unchanged in control or FUNDC1 knockdown cells (fig. S4J). In rescue experiments, treatment with the cell permeable superoxide dismutase mimetic, MnTBAP reversed the increase in mitochondrial ROS after FUNDC1 silencing to levels of control cells (Fig. 4E). Consistent with a role of ROS in mitochondrial dynamics, MnTBAP treatment normalized the speed of mitochondrial movements and the distance traveled by individual mitochondria in FUNDC1 knockdown cells (Fig. 4F). Accordingly, MnTBAP also reversed the increase in 2D cell motility associated with FUNDC1 silencing, decreasing the speed of cell migration and shortening the distance traveled by individual cells to levels of control cultures (Fig. 4G). As a result, MnTBAP reversed the dual phenotype of FUNDC1 depletion in tumor cells, inhibiting the increase in cell invasion (Fig. 4H) while restoring cell proliferation comparably to that in control cultures (Fig. 4I).
FUNDC1 is required for LonP1 proteostasis.
We next looked at the biochemical requirements of FUNDC1 regulation of mitochondrial functions. Submitochondrial fractionation experiments revealed that endogenous or recombinant FUNDC1 existed in two separate pools in tumor mitochondria, localized to the inner as well as outer mitochondrial membrane (Fig. 5A). No other submitochondrial localizations of FUNDC1 were observed (Fig. 5A). Next, we carried out a global proteomics screen to identify a FUNDC1 interactome in mitochondria. In these experiments, 170 mitochondrial proteins were identified with at least a 2-fold increased association with endogenous FUNDC1, compared to vector transfectants (fig. S5A). By bioinformatics analysis, this FUNDC1 interactome comprised regulators of mitochondrial ribosomal function (MRPS2, MRPS15, MRPS27, MRPS23, PRPL19, MRPL10A, MRPL50, MRSP18B, RPS18), tRNA transferases (TRMT61B, GARS, QTRT1, TARS2, TRMT1, KARS), subunits of mitochondrial complex V/ATP synthase (ATP5F1D, ATP5PF, ATP5F1C, ATP5PB, ATP5F1A, ATP5F1B) and AAA+ proteases involved in mitochondrial protein quality control (LonP1, ClpB, ClpX, MAIP1) (Fig. 5B). Consistent with these data, Flag-FUNDC1 co-immunoprecipitated with the endogenous complex V subunits ATP5C1, ATP5O and ATP5B in PC3 cells, whereas immunoprecipitates of Flag-vector were unreactive (Fig. 5C). Reciprocally, immune complexes of endogenous ATP5C1, but not IgG, contained endogenous LonP1 as well as FUNDC1 (Fig. 5D).
Fig. 5. A FUNDC1-LonP1 complex regulates mitochondrial complex V activity.
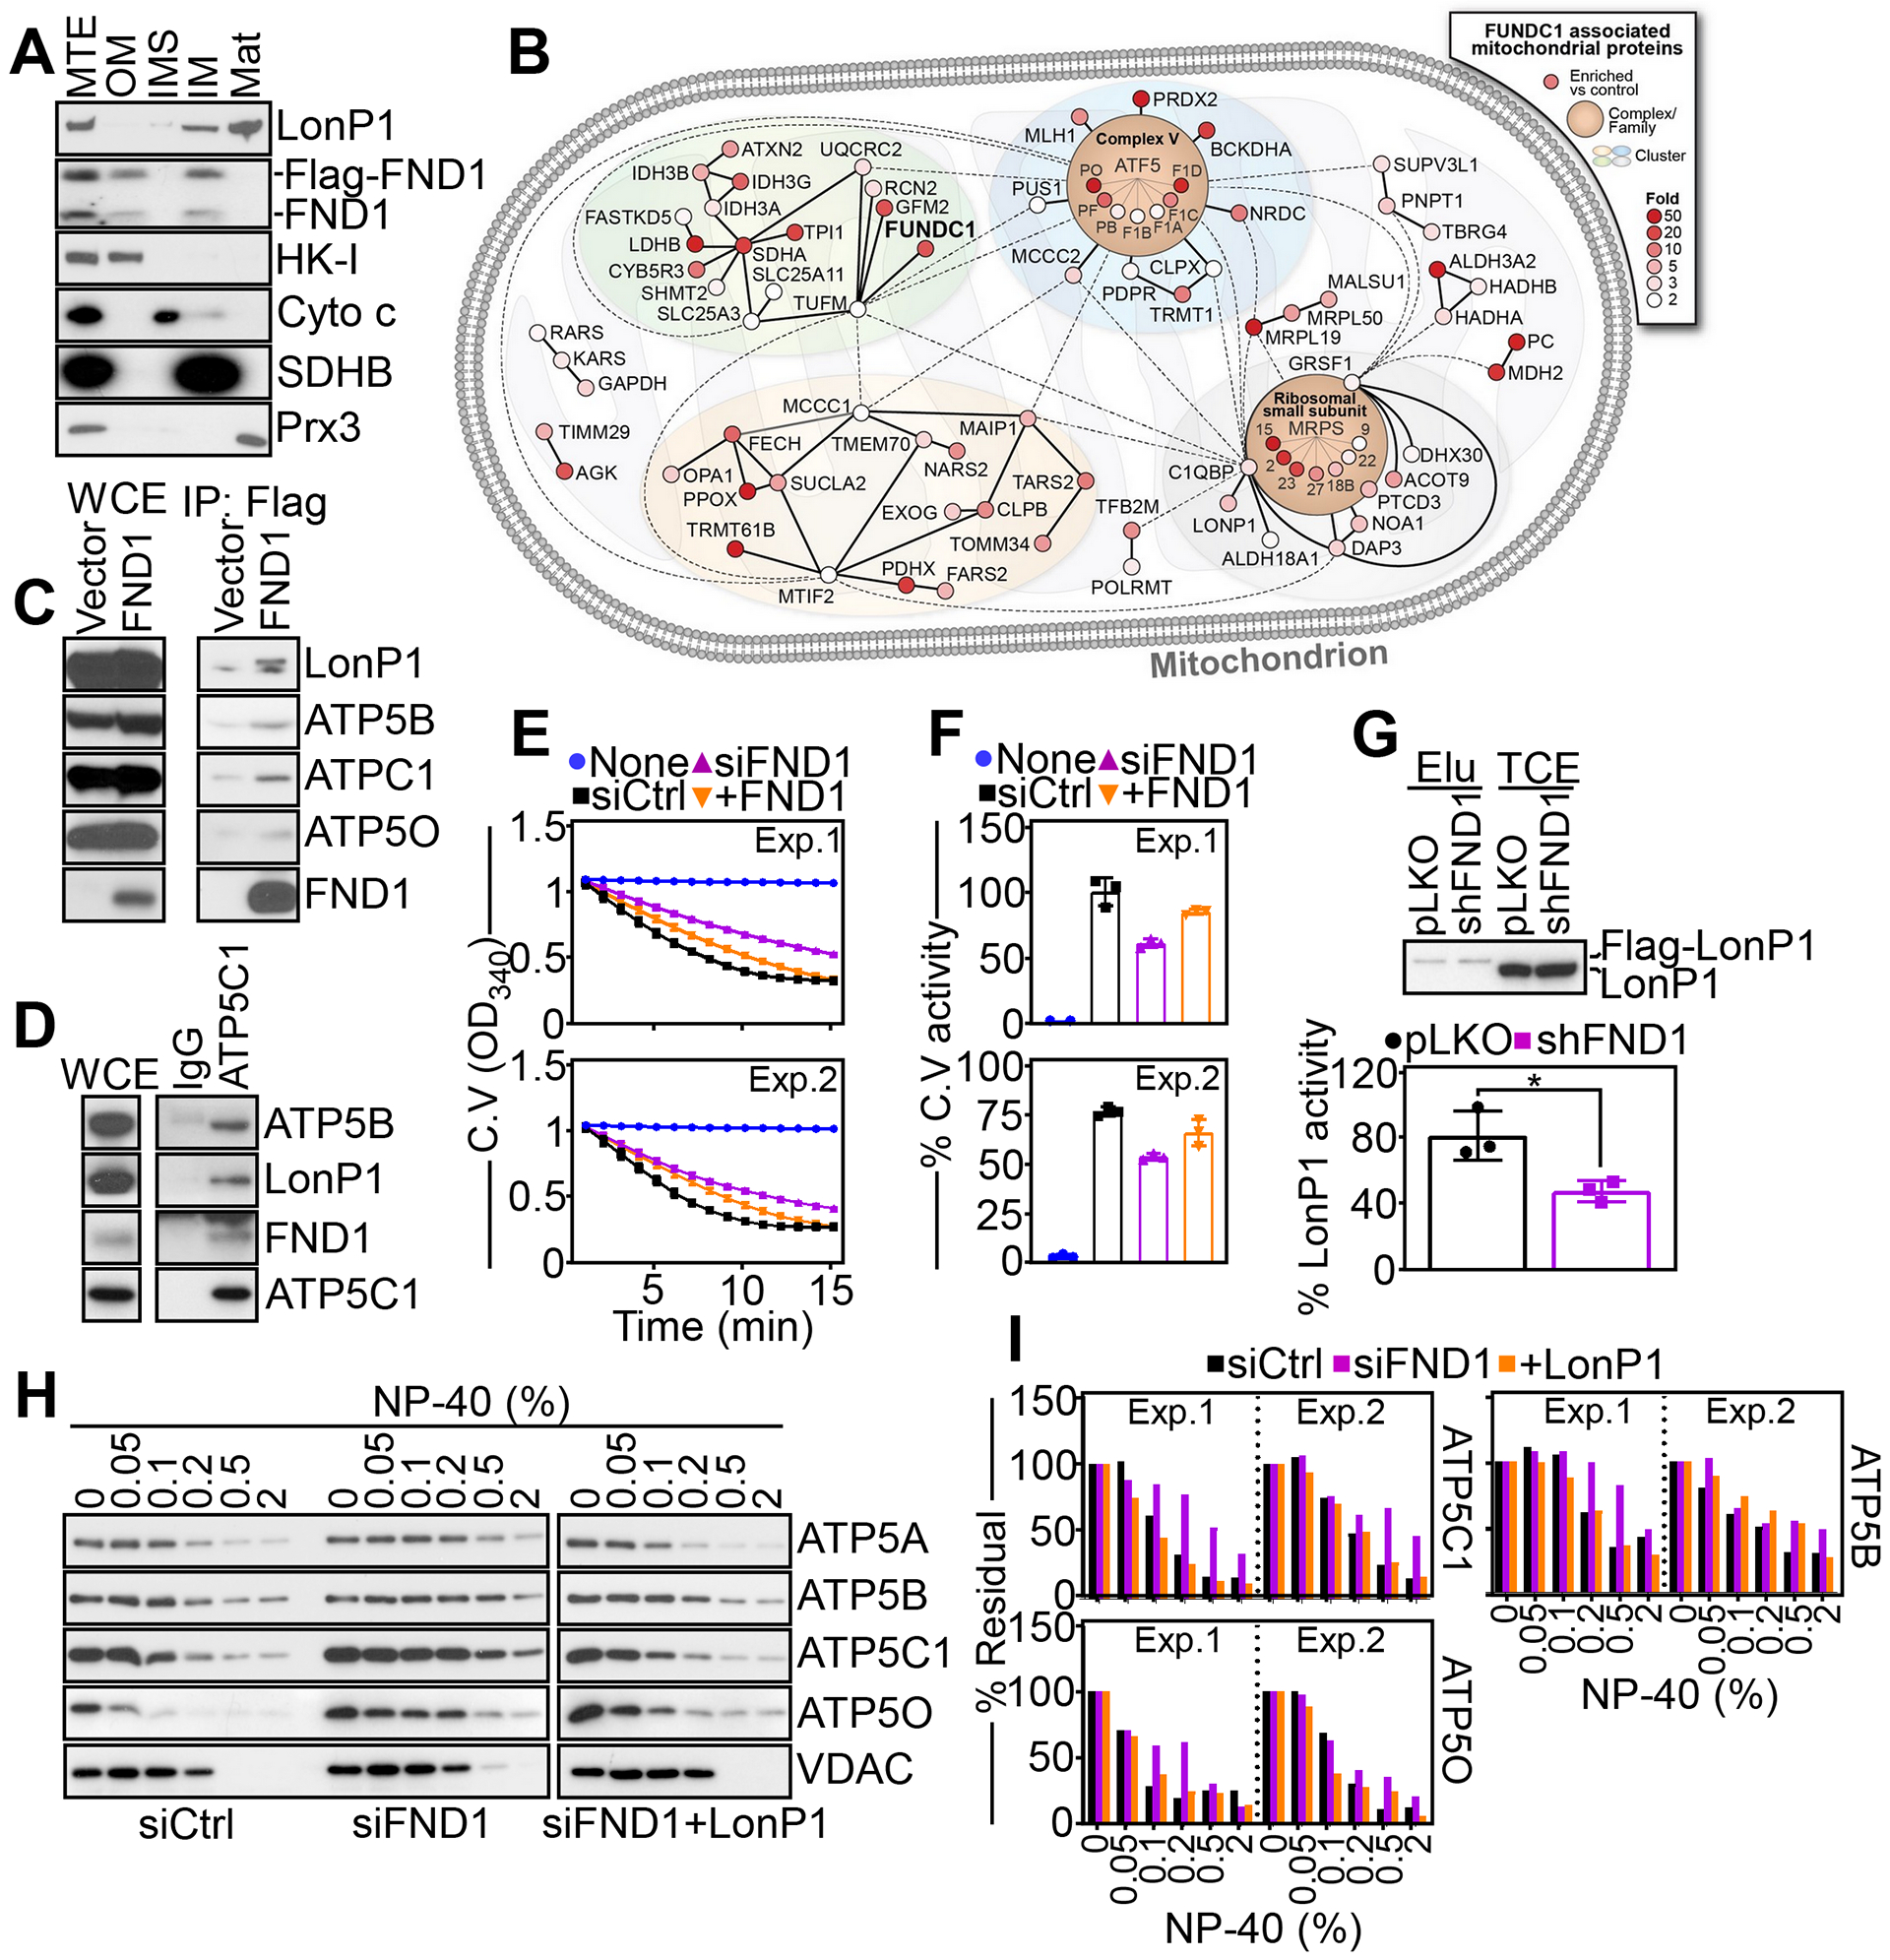
(A) PC3 cells were fractionated in submitochondrial compartments and analyzed by Western blotting. MTE, mitochondrial extracts; OM, outer membrane; IM, inner membrane; IMS, intermembrane space; Mat, matrix. Data are representative of 2 independent experiments. (B) Ingenuity pathway analysis of a mitochondrial FUNDC1 interactome identified by LC-MS/MS proteomics (N=1 independent experiment). The fold-induction for FUNDC1-associated proteins compared to Flag-vector are indicated with red color intensity. (C) PC3 cells transfected with Flag-vector or Flag-FND1 cDNA were immunoprecipitated (IP) with an antibody to Flag and immune complexes were analyzed by Western blotting. Data are representative of 2 independent experiments. WCE, whole cell extracts. (D) PC3 cells were immunoprecipitated with non-binding IgG or an antibody to endogenous ATP5C1 and immune complexes were analyzed by Western blotting. Data are representative of 2 independent experiments. WCE, whole cell extracts. (E) PC3 cells transfected with siCtrl or siFND1 were reconstituted with FND1 cDNA and analyzed for complex V (C.V) activity. Tracings from two independent experiments (Exp) are shown. Mean±SD of 3 technical replicates per experiment. (F) Citrate synthase-normalized complex V (C.V) activity as in (E) was quantified. Two independent experiments (Exp) are shown. Mean±SD of 3 technical replicates per experiment. (G) PC3 cells stably transduced with pLKO or shFND1 were reconstituted with Flag-LonP1 cDNA, and Flag-eluted LonP1 immune complexes (Elu) (top, representative blot of 3 independent experiments) were analyzed for LonP1 proteolytic activity (bottom). TCE, total cell extracts. Mean±SD (N=3 independent experiments per group). (H and I) PC3 cells transfected with siCtrl or siFND1 were reconstituted with LonP1 cDNA, extracted at increasing concentrations of NP-40 and detergent-insoluble protein bands corresponding to complex V subunits, ATP5C1, ATP5O and ATP5B were analyzed by Western blotting (H, representative blot of 2 independent experiments) and quantified by densitometry (I). VDAC was a control. Two independent experiments (Exp) are shown (I).
Based on these findings, we next asked if FUNDC1 affected mitochondrial complex V activity. In cycloheximide block and release experiments, FUNDC1 depletion caused accelerated degradation of complex V subunits ATP5C1, ATP5O and ATP5B, whereas Hsp90 was not affected (fig. S5, B and C). As a result, FUNDC1 knockdown cells showed reduced citrate synthase-normalized complex V activity, compared to control transfectants (Fig. 5, E and F). This response was specific because reconstitution of knockdown cells with recombinant FUNDC1 restored complex V activity to levels of control cultures (Fig. 5, E and F).
LonP1 maintains the integrity of certain complex V subunits, including ATP5A and ATP5B (25), leading us to investigate whether FUNDC1 has a role in this process. In a first series of experiments, loss of FUNDC1 caused misfolding of LonP1, as well as the complex V subunits APT5C1, ATP5O, and ATP5B, compared to control transfectants (fig. S5, D and E). In contrast, VDAC protein folding was not affected (fig. S5, D and E). Due to impaired protein quality control, recombinant LonP1 expressed in FUNDC1 knockdown cells showed reduced catalytic activity compared to control cultures transduced with pLKO (Fig. 5G). To validate the specificity of these findings, we next carried out reconstitution experiments with recombinant LonP1. Here, expression of LonP1 restored the stability of the complex V subunits ATP5C1, ATP5O and ATP5B in FUNDC1 knockdown cells, comparably to that in control siRNA transfectants (Fig. 5, H and I).
A FUNDC1-LonP1 axis controls cellular plasticity.
We next asked if FUNDC1-enabled LonP1 activity was important for tumor cell responses. In line with improved complex V activity, expression of LonP1 corrected the OCR defect in FUNDC1 knockdown cells (Fig. 6A, fig. S6A), rescuing both basal and maximal respiration to levels of control transfectants (Fig. 6B, fig. S6A). This rescue was associated with improved ATP production (Fig. 6C, fig. S6A) and decreased ROS generation (Fig. 6D) comparably to those in control cultures.
Fig. 6. A FUNDC1-LonP1 complex regulates tumor plasticity.
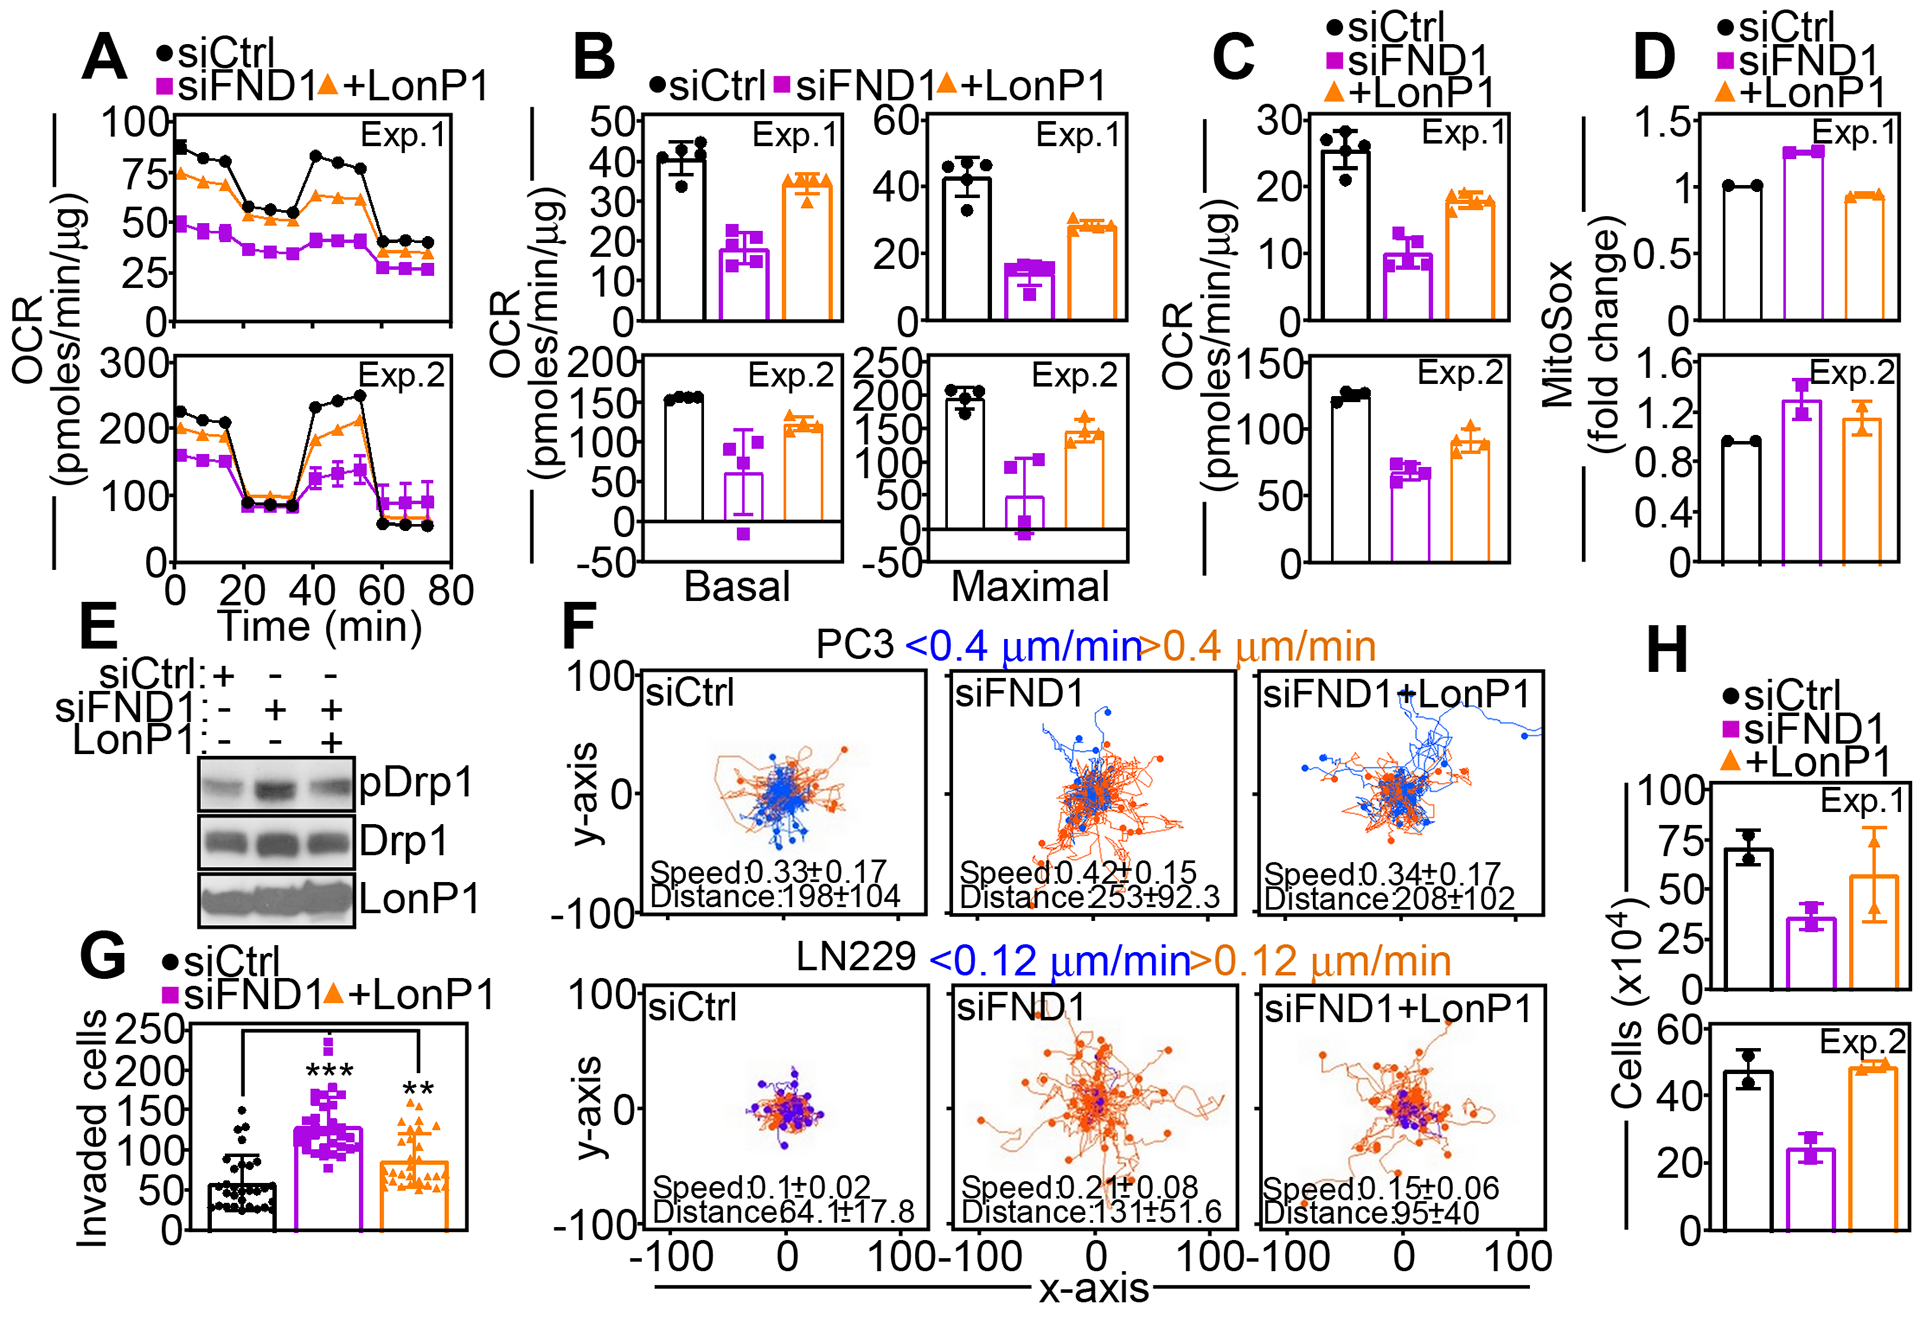
(A) PC3 cells transfected with siCtrl or siFND1 were reconstituted with LonP1 cDNA and analyzed for oxygen consumption rates (OCR) on a Seahorse XFe96 Bioenergetics Flux Analyzer. Tracings from two independent experiments (Exp) are shown. Mean±SD of 5 technical replicates per experiment. (B) PC3 cells reconstituted as in (A) were analyzed for basal (left) and maximal (right) respiration. Two independent experiments (Exp) are shown. Mean±SD of 5 technical replicates per experiment. (C and D) PC3 cells reconstituted as in (A) were analyzed for rates of ATP production (C) or MitoSox reactivity (D). Two independent experiments (Exp) per condition are shown. Mean±SD of 5 (C) or 2 (D) technical replicates per experiment. (E) PC3 cells reconstituted as in (A) were analyzed by Western blotting. p, phosphorylated. Data are representative of 2 independent experiments. (F) PC3 (top) or LN229 (bottom) cells transfected with siCtrl or siFND1 and reconstituted with LonP1 cDNA were analyzed for cellular motility in 2D contour plots. Each tracing corresponds to the movements of an individual cell. The cut-off velocities for slow (<0.4 or <0.12 μm/min)- or fast (>0.4 or > 0.12 μm/min)-moving cells are indicated. Data are representative of 2 independent experiments. The mean±SD of speed of cell movements (μm/min) and distance traveled (μm) are indicated. (G and H) siRNA-transfected PC3 cells reconstituted with LonP1 cDNA were analyzed for Matrigel invasion (G, Mean±SD of 3 independent experiments per group. *, p=0.01; **, p=0.002; ***, p<0.0001) or cell proliferation by direct cell counting (H, Mean±SD of 2 technical replicates per experiment). Two independent experiments (Exp) are shown.
Functionally, this response was associated with normalized mitochondrial dynamics in LonP1-reconstituted cells, with reduced phosphorylation of Ser616 in Drp1 (Fig. 6E), slower speed mitochondrial movements and shorter distances traveled by individual mitochondria (fig. S6, B and C). As a result, reconstitution with LonP1 corrected the increase in 2D tumor cell motility induced by FUNDC1 loss (Fig. 6F), and reduced tumor cell invasion across Matrigel-coated inserts to levels of control transfectants (Fig. 6G, fig. S6D). Reciprocally, re-expression of LonP1 restored tumor cell proliferation after FUNDC1 knockdown, indistinguishably from that in control cultures (Fig. 6H).
DISCUSSION
In this study, we showed that FUNDC1 reprogrammed mitochondrial dynamics, oxidative bioenergetics, and redox balance in tumor cells. The underlying mechanism involved interaction between FUNDC1 and the AAA+ protease LonP1, which enhanced proteostasis and maintained the stability and function of complex V. This pathway was exploited by cancer cells to control cellular plasticity, switching between cell proliferation and cell motility states. High levels of FUNDC1 enabled oxidative bioenergetics and supported tumor cell proliferation and growth, whereas decreased FUNDC1 expression was a “stress” signal that stimulated ROS-dependent mitochondrial dynamics and greater tumor cell invasion and metastasis.
FUNDC1 has been recognized to be a phosphorylation-regulated (26) receptor for LC3 in Parkin-independent mitophagy, especially under hypoxic conditions (23), but a broader role of this pathway in mitochondrial reprogramming has not been previously explored. Here, forced expression of FUNDC1 increased mitophagy in tumor cells, in agreement with previous observations (23). However, although FUNDC1 depletion impaired mitochondrial bioenergetics, enhanced cell motility and reduced cell proliferation, it had negligible effects on mitophagy, including in hypoxia. This suggests that FUNDC1 may have distinct and potentially non-overlapping roles in regulating mitophagy and mitochondrial oxidative metabolism, a possibility further reinforced by the identification of spatially separate pools of FUNDC1 at the outer and inner mitochondrial membranes. How FUNDC1 is sorted to different submitochondrial compartments, especially in tumor cells, remains to be elucidated. However, the multiple transmembrane domains predicted by the FUNDC1 primary sequence suggest a potential mechanism for insertion at both mitochondrial membranes.
Distinct from a proposed role of FUNDC1 in mediating mitochondrial fission in cooperation with calnexin and Drp1 (27), we found that depletion of FUNDC1 promoted the recruitment of Ser616-phosphorylated Drp1 to mitochondria, resulting in greater organelle fission and increased redistribution to the cortical cytoskeleton. Previously considered a unique trait of axons to localize mitochondria at sites of high energy demand (28), we now know that both normal (29) and tumor (30) cells exploit anterograde and retrograde mitochondrial trafficking (24) to reposition mitochondria at the leading edge of migrating cells (31). In turn, this mitochondrial repositioning fuels focal adhesion complex turnover and membrane lamellipodia dynamics, culminating with heightened cell movements and invasion (24, 32, 33). How mitochondrial fission contributes to this process is still unclear (34), but smaller, fragmented mitochondria travel faster and farther in tumor cells, which correlates with greater invasion and metastatic dissemination in vivo (24). In FUNDC1-depleted cells, the heightened mitochondrial trafficking was associated with altered cytoskeleton dynamics, increasing the propensity of tumor cells (35) for non-polarized, random cell migration, irrespective of a chemotactic gradient (36). This response is a feature of invasive and metastatic cancer (35), and is reminiscent of the “stress-regulated” random tumor cell migration paradoxically induced by exposure to molecular therapy, which also involves greater mitochondrial dynamics and trafficking to the cortical cytoskeleton (32).
A key signal in FUNDC1-directed mitochondrial reprogramming was aberrant generation of ROS. Whether emanating from a leaky TCA cycle and/or unbalance of mitochondrial antioxidant systems, increased ROS supported mitochondrial movements, cell motility and invasion under conditions of FUNDC1 depletion. The role of ROS in cancer continues to be debated (37), with a spectrum of cell- and context-specific responses that range from enhancement (38) to suppression (39) of primary and metastatic tumor growth. A similar dichotomy may apply to how ROS dosage affects mitochondrial dynamics. Similar to the findings presented here, non-toxic ROS produced after depletion of the mitochondrial trafficking regulator syntaphilin (SNPH) stimulate mitochondrial fission, resulting in greater organelle trafficking and cell motility (24). Conversely, more severe oxidative stress following loss of LonP1 (21) impairs cell proliferation, suppresses xenograft tumor growth and inhibits tumor cell movements (25). Together, these findings are consistent with other data that non-toxic ROS stimulate cell motility (40), promote epithelial-to-mesenchymal (EMT) transition and enable greater metastatic dissemination (41), whereas higher ROS levels, in particular H2O2, suppress mitochondrial trafficking (42) and metastasis in vivo (39).
The role of FUNDC1 in mitochondrial reprogramming involved regulation of oxidative phosphorylation, and, specifically, complex V activity. Global metabolomics and proteomics profiling demonstrated that multiple complex V constituents of the F1 (β, γ and δ) and peripheral stalk (OSCP and F6) subunits, as well as LonP1 (21), associated with FUNDC1. Here, knockdown of FUNDC1 destabilized LonP1 and reduced its proteolytic activity, causing accumulation of misfolded/aggregated complex V subunits, impaired complex V activity, bioenergetics defects, and suppression of tumor growth in vivo. How FUNDC1 maintains LonP1 stability and function remains to be elucidated. Similar to ClpXP-directed proteostasis (20), it is possible that a LonP1-FUNDC1 complex may also contain molecular chaperones that participate in protein (re)folding, potentially affecting oxidative phosphorylation subunits (17). Nonetheless, these data reaffirm an emerging role of LonP1 as a regulator of complex V protein quality control in cancer (25), enabling oxidative bioenergetics (43), ROS buffering (44) and tumor growth (25). Other complex V regulators participate in mitochondrial protein folding (45), as well as ROS signaling and tumor cell invasion (46). In this context, a requirement of complex V in cancer may be context-specific: Reduced levels of complex V are present in certain malignancies (47), whereas complex V inhibition by oncometabolite(s) (48) or the tumoricidal protein, HAMLET (49) produces growth arrest, tumor cell death and suppression of oncogenic signaling, including that mediated by mTOR.
In terms of biological relevance, the FUNDC1 pathway described here enabled cellular plasticity (3), controlling a cell proliferation versus cell motility balance in cancer. Also called “phenotype switching”, the reversible transition from a proliferative to an invasive state (4) is considered an adaptive response to changing environmental conditions, influencing metabolism (50), EMT and acquisition of stem-like properties (51). The similarity of the phenotype of FUNDC1 depletion (this study) with that observed after loss of syntaphilin (SNPH) (52) suggests that mitochondrial reprogramming may function as a general determinant of phenotype switching in cancer. What controls the heterogeneous levels of FUNDC1 in tumor cells, and thus phenotype switching, is presently unknown. One possibility is that, similar to SNPH, stress conditions of the tumor microenvironment, for instance hypoxia, modulate FUNDC1 expression and the transition from a proliferative to an invasive state (52). This is consistent with a model that heightened cell motility and metastatic propensity are responses to “microenvironment stress”, enabling tumor cells to escape an unfavorable surrounding no longer suitable to sustain cell proliferation and local expansion (53).
Finally, it is intriguing that mitochondria with decreased levels of SNPH (52) or FUNDC1 (this study), which fuel greater cell motility and invasion (24), have paradoxically lower ATP output, elevated ROS and heightened fission, conditions that are all associated with mitochondrial clearance and cell death (5, 9, 13). This conundrum remains to be explained, but it is possible that mitochondrial reprogramming in cancer subverts mitophagy mechanisms that would ordinarily eliminate such damaged or subpar mitochondria (9). Although Parkin-dependent mitophagy is a recognized tumor suppressor in vivo (54), the situation may be different for FUNDC1. In fact, high levels of FUNDC1 have been associated with worse patient outcome in breast cancer (55), and, accordingly, FUNDC1 supports tumor growth in vivo (this study). Therefore, it is plausible that in cancer, the function of FUNDC1 in mitochondrial reprogramming and cellular plasticity may become dominant over a proposed role in mitophagy (23) that may potentially antagonize tumor growth.
MATERIALS AND METHODS
Cells and cell culture.
Prostate adenocarcinoma PC3, DU145, C42B, glioblastoma LN229, lung adenocarcinoma H1299, H460 and A549, breast adenocarcinoma MCF7 and MDA231, and mouse fibroblasts NIH3T3 were obtained from the American Type Culture Collection (ATCC, Manassas, VA), and maintained in culture according to the supplier’s specifications. Cell passaging was limited to <40 passages from receipt and cell lines were authenticated by STR profiling with AmpFlSTR Identifiler PCR Amplification Kit (Life Technologies) at the Wistar Institute’s Genomics facility. Mycoplasma-free cultures were confirmed at the beginning of the studies, and every 2 months afterwards, by direct polymerase chain reaction (PCR) of cultures using Bioo Scientific Mycoplasma Primer Sets (cat. #375501) and Hot Start polymerase (QIAGEN). Conditioned media was prepared from exponentially growing cultures of NIH3T3 cells in DMEM supplemented with 4.5 g/l D-glucose, sodium pyruvate, 10 mM HEPES and 10% FBS for 48 h.
Antibodies and reagents.
Antibodies to FUNDC1 (Aviva System Biology, diluted 1:500), Drp1 (clone D6C7, Cell Signaling cat. #8570 diluted 1:1000), Ser616-phosphorylated Drp1 (Cell Signaling cat. #3455 diluted 1:1000), Drp1 (Cell Signaling cat. #5391 diluted 1:1000), Tyr925-phosphorylated FAK (Cell Signaling cat. #3284 diluted 1:1000), FAK (Cell Signaling cat. n. #3285), FLAG (clone M-2, Sigma cat. #F1804 diluted 1:5000) and β-actin (clone AC-15, Sigma cat. #A5441 diluted 1:100000) were used for Western blotting. Antibodies to F-Actin (Invitrogen cat. #A12379, Phalloidin, diluted 1:300), Tom20 (FL-145 Santa Cruz, cat. # sc-11415 diluted 1:250), and anti-mitochondria antibody (clone 113–1 Millipore cat. # MAB1273 diluted 1:1000) were used for immunofluorescence. For immunofluorescence experiments, Phalloidin Alexa488, MitoTracker Red CMH2XROS, MitoSOX Red (Molecular Probes), mitochondrial superoxide dismutase mimetic MnTBAP and cycloheximide (CHX) was from Sigma.
Plasmid and siRNA transfection.
Gene knockdown using small interfering RNA (siRNA) was carried out as previously described (52). The following siRNA sequences were used: control ON-TARGETplus non-targeting siRNA pool (Dharmacon cat. #D-001810), custom human FUNDC1-directed siRNA (Dharmacon cat. #DC1_sc-91118;). The different cell types were transfected with the individual siRNA at 40 nM in Lipofectamine RNAiMAX (Invitrogen) at a 1:1 ratio (20 μM siRNA–Lipofectamine RNAiMAX [vol/vol]). After 72 h, transfected cells were validated for target protein knockdown by Western blotting and processed for functional experiments. In some experiments, cells were transfected with vector (pcDNA) or FUNDC1 cDNA, confirmed for recombinant protein expression by Western blotting and further analyzed.
Mitochondrial isolation.
Mitochondrial fractions were prepared from PC3 cell homogenates, as described (52). For submitochondrial fractionation experiments, mitochondrial extracts were centrifuged at 12,000 g for 10 min and further separated in fractions containing outer membrane (OM), inner membrane (IM), intermembrane space (IMS), and matrix, as previously described (52).
Protein analysis.
Protein lysates prepared in 150 mM NaCl, 1% Triton X-100, 0.5% sodium deoxycholate, 0.1% SDS, 50 mM Tris, pH 8.0, plus EDTA-free protease and phosphatase inhibitor cocktails (Roche) were separated by SDS gel electrophoresis, transferred to polyvinylidene difluoride (PVDF) membranes, and incubated with primary antibodies of various specificities. Protein bands were visualized by chemiluminescence.
Mitochondrial protein folding.
Changes in mitochondrial protein folding in siRNA-transfected PC3 cells were assessed at increasing detergent (NP-40) concentrations (0–2%) as previously described (17).
Cellular respiration.
Oxygen consumption rates (OCR) or extracellular acidification rates (ECAR) were quantified using an Agilent Seahorse XFe96 analyzer (Agilent Technologies, Wilmington, DE) using siRNA-transfected PC3 cells, as previously described (56). Metabolic rates were monitored under basal conditions and after addition of oligomycin (1 μM), FCCP (1 μM) and antimycin (0.5 μM), all dissolved in XF base media. After sequential drug addition, OCR/ECAR rates were measured using three cycles of mixing (150 sec), waiting (120 sec) and measuring (210 sec). This cycle was repeated following each injection.
Mitochondrial complex V activity.
Extracts from PC3 cells transfected with siCtrl or siFND1 were analyzed for changes in oxidative phosphorylation complex V activity using Abcam reagents (ab109907). Aliquots of cell lysate (20 μg) were assayed in parallel for citrate synthase (CS) activity (ScienCell Research Laboratories), and samples with comparable CS activity were used to quantify complex V activity. Relative activity was calculated from changes in absorbance over time in the linear range of the measurements.
Proteomics screening.
To identify a FUNDC1 interactome in mitochondria, immune complexes of endogenous FUNDC1 or non-binding control IgG were separated on an SDS-gel for approximately 5 mm followed by fixing and staining with colloidal Coomassie. The entire region of the gel-containing proteins was excised and digested with trypsin. Tryptic peptides were analyzed by LC-MS/MS on a Q Exactive HF mass spectrometer (Thermo Scientific) coupled with a Nano-ACQUITY UPLC system (Waters). Samples were injected onto a UPLC Symmetry trap column (180 μm i.d. × 2 cm packed with 5 μm C18 resin; Waters), and tryptic peptides were separated by RP-HPLC on a BEH C18 nanocapillary analytical column (75 μm i.d. × 25 cm, 1.7 μm particle size; Waters) using a 90-min gradient. Eluted peptides were analyzed in data-dependent mode where the mass spectrometer obtained full MS scans from 400 to 2000 m/z at 60,000 resolution. Full scans were followed by MS/MS scans at 15,000 resolution on the 20 most abundant ions. Peptide match was set as preferred, the exclude isotopes option and charge-state screening were enabled to reject singly and unassigned charged ions. MS/MS spectra were searched using MaxQuant 1.6.1.0 (57) against the UniProt human protein database (October 2017). MS/MS spectra were searched using full tryptic specificity with up to two missed cleavages, static carboxamidomethylation of Cys, and variable oxidation of Met, protein N-terminal acetylation, and phosphorylation of Ser, Thr and Tyr. Consensus identification lists were generated with false discovery rates of 1% at protein, peptide and site levels. Protein quantitation and fold changes of FUNDC1-LonP1 vs FUNDC1-vector were determined from the iBAQ intensity.
Metabolomics screening.
LC-MS analysis was performed on a ThermoFisher Scientific Q Exactive HF-X mass spectrometer equipped with a HESI II probe and coupled to a ThermoFisher Scientific Vanquish Horizon UHPLC system as described (56). Briefly, polar metabolites were extracted using 80% methanol and separated at 0.2 ml/min by HILIC chromatography at 45°C on a ZIC-pHILIC 2.1-mm i.d × 150 mm column (EMD Millipore) using 20 mM ammonium carbonate, 0.1% ammonium hydroxide, pH 9.2, (solvent A) and acetonitrile (solvent B) with a gradient of: 0 min, 85% B; 2 min, 85% B; 17 min, 20% B; 17.1 min, 85% B; and 26 min, 85% B. Samples were analyzed in a randomized order using full MS scans with polarity switching for quantitation at: scan range 65 to 975 m/z; 120,000 resolution; automated gain control (AGC) target of 1E6; and maximum injection time (max IT) of 100 ms. A sample pool (QC) was generated by combining equal volume of each sample and analyzed using full MS scan at the beginning, middle and end of the run sequence. MS/MS was also performed on the QC samples using separate runs for positive and negative mode analysis as follows: a full MS scan was acquired as described above, followed by MS/MS of the 10 most abundant ions at 15,000 resolution, AGC target of 5E4, max IT of 50 ms, isolation width of 1.0 m/z, and stepped collision energy of 20, 40 and 60. Metabolite identification (MS/MS data) and quantitation (MS only data) were performed using Compound Discoverer 3.0 (Thermo Fisher Scientific). Metabolites were identified from a mass list of 206 verified compounds (high confidence identifications) as well as by searching the MS/MS data against the mzCloud database (www.mzcloud.org) with identifications having scores of at least 50 assigned as tentative identifications.
ROS.
PC3 cells (4×10⁵) transfected with various siRNA were stained with MitoSOX Red mitochondrial superoxide indicator (Life Technologies, 5 μM) for 10 min in complete medium, followed by washes in PBS pH 7.4, and analysis on a FACSCalibur flow cytometer. In some experiments, H2O2 levels were measured using an Intracellular Hydrogen Peroxide assay kit (AAT Bioquest cat # 11505). Briefly, PC3 cells transfected with siCtrl and siFND1 were treated with OxiVision Blue peroxide sensor for 30 min, washed and analyzed by flow analysis using a 405 nm laser and 450/40 filter. For both sets of experiments, intact cells were gated in the FSC/SSC plot to exclude small debris.
LonP1 protease activity.
PC3 cells stably expressing control pLKO or FUNDC1-directed shRNA (shFND1) were transfected with Flag-LonP1 cDNA, immunoprecipitated with an antibody to Flag and immune complexes were eluted using a Flag peptide (Sigma-Aldrich, F4799). Affinity-purified LonP1 was then incubated for 5 min at 37°C in a 100 μl reaction cocktail containing 25 mM Tris-HCl (pH 8.0) and 10 mM MgCl2 with or without 2.5 mM ATP. Samples were further incubated with FITC-casein substrate (2 μg) for 1 h at 37°C, and proteolytic release of free FITC molecules was monitored by increase in fluorescence emission with excitation and emission wavelengths set at 485 nm and 535 nm, respectively.
Mitophagy assay.
Mitophagy was quantified using a FACS-based analysis of a mitochondrially targeted Keima-Red fluorescence reporter (Addgene, cat. #56018). Briefly, PC3 cells stably expressing mitochondrial Keima-Red or DU145 cells transiently transfected with mitochondrial Keima-Red were further transfected with siCtrl or siFND1, or alternatively, with vector or FUNDC1 cDNA. Cells were detached with trypsin, washed and suspended in PBS followed by analysis on an LSR 18 flow cytometer at 405 and 561 nm lasers and 610/20 filters. Intact cells were gated in the FSC/SSC plot to exclude small debris.
Immunofluorescence.
Cells were fixed in formalin/PBS (4% final concentration) for 15 min at 22°C, permeabilized with 0.1% Triton X-100/PBS for 5 min, washed, and incubated with primary antibodies to Tom20 (diluted 1:300) or phosphorylated Drp1 (Ser616; diluted 1:200) in 5% NGS/0.3M glycine/PBS for 18 h at 4°C. After washes, secondary antibodies conjugated to Alexa 488 or Alexa 568 (1:500 in 5% NGS/0.3M glycine/PBS) were added for 1 h at 22°C. Where indicated, F-actin was stained with phalloidin Alexa488 (1:200 dilution) for 30 min at 22°C. Slides were washed and mounted in 4,6-diamidino-2-phenylindole (DAPI)-containing Prolong Gold mounting medium (Life Technologies). At least seven random fields were analyzed by fluorescence microscopy on a Nikon i80 microscope.
Cortical mitochondrion quantification.
Mitochondria/F-actin composite images were analyzed in ImageJ as previously described (52). For cortical mitochondrial quantification, a mask was manually created around the periphery of the cell based on the F-actin channel and subsequently applied to the mitochondrial channel to measure intensity at the cortical region. The intensity was normalized to total mitochondrial intensity per cell and background subtracted. A minimum of 20 cells was analyzed in each independent experiment to obtain mean values.
Focal Adhesion (FA) dynamics.
PC3 cells transfected with various siRNA on high-optical-quality 35-mm glass-bottom plates were imaged by time-lapse videomicroscopy using a Leica TCS SP8 confocal laser scanning microscope with an HCX PL APO CS 63, 1.40-NA oil UV objective. Acquisition of live cells using integrated Leica LAS software was performed every 3 min per frame for a total interval of 2 h. Sequences were imported into ImageJ for further analysis. The initial and final frames were duplicated and assembled as composite images. FA were manually counted and classified (according to the presence in some or all the time frames) into three groups: decaying, new and stable (merged areas). An average of 7 cells (about 150 FA) was analyzed per each condition in 2 independent time-lapse experiments using the LASX software package. In other experiments, time-lapse videomicroscopy movies of Talin-RFP-expressing PC3 cells transfected with siCtrl or siFND1 were analyzed using the Focal Adhesion Analysis Server (FAAS) (https://faas.bme.unc.edu/) and rates of FA assembly and disassembly were calculated.
Mitochondria time-lapse videomicroscopy.
Cells (2×10⁴) growing on high optical-quality glass bottom 35-mm plates (MatTek Corporation) were incubated with 100 nM Mitotracker Deep Red FM dye for 30 min and imaged on a Leica TCS SP8 X inverted laser scanning confocal microscope using a 63X 1.40NA oil objective. Short duration time-lapse sequences were carried out using a Tokai Hit incubation chamber equilibrated to 37°C and 5% CO2. Time lapse imaging was performed for 2 min (3 sec per frame). Individual 12-bit images were acquired using a white-light supercontinuum laser (0.2% at 645 nm) and HyD detectors at 5X digital zoom with a pixel size of 70 nm × 70 nm. A pinhole setting of 1 Airy Units provided a section thickness of 0.896 μm. Each time point was captured with a step size of 0.15 μm. At least 7 cells under each condition were collected for analysis. Initial postprocessing of 3D sequences was carried out with Hyugens software to deconvolve the images, which were then imported into LasX software to study fission and fusion events. A workflow capable of tracking time-dependent changes in mitochondrial volume was designed on the LasX software platform. For each cell, the volume of mitochondria over time was analyzed in 4 different areas (with an average of 10 mitochondria per area) in 3D images. Variations in mitochondrial volume were evaluated by fold-change over time: a fold-change >1.3 denoted a fusion event; a fold-change <0.7 denoted a fission event. The average fission and fusion events in the 4 different areas was used for each cell analyzed.
Two-dimensional (2D) cell motility.
Experiments were carried out essentially as described (32) using 2D chemotaxis chambers (Ibidi) and a gradient setup with NIH3T3 conditioned medium. Videomicroscopy was performed over 10 h, with a time-lapse interval of 10 min. Stacks were imported into ImageJ and images were aligned according to subpixel intensity registration with the StackReg plugin for ImageJ43. At least 30 cells were tracked using the Manual Tracking plugin for ImageJ, and the tracking data from four independent time-lapse experiments were pooled and exported into the Chemotaxis and Migration Tool v2.0 (Ibidi) to quantitatively calculate the speed of cell movements and total distance traveled by individual cells. In some experiments of cellular chemotaxis, a Forward Migration Index (FMI) and Rayleigh distribution statistics were used to quantify directional compared to random cell movements.
Cell invasion.
Experiments were carried out essentially as described (24) using Growth Factor Reduced Matrigel-coated 8 mm PET Transwell chambers (Corning) and NIH3T3 conditioned medium placed in the lower chamber as chemoattractant. Cells were allowed to invade for 16–24 h, non-invading cells were scraped off the top side of the membranes, and the invaded cells on the Transwell insert were fixed in methanol. Membranes were mounted in medium containing DAPI (Vector Labs) and analyzed by fluorescence microscopy. Five random fields at x20 magnification were collected for each membrane. Digital images were batch-imported into ImageJ, thresholded and analyzed with the Analyze particles function.
Cell proliferation and cell cycle analysis.
Cells transfected with various siRNA or stably transduced with pLKO or shFND1 were labeled with propidium iodide (PI) and analyzed for differential cell cycle distribution by flow cytometry. Alternatively, cell proliferation was assayed by a CellTiter 96 A Queous One Solution Cell Proliferation Assay or by direct cell counting.
Animal studies.
Experiments were carried out in accordance with the recommendations in the Guide for the Care and Use of Laboratory Animals of the National Institutes of Health (NIH). Protocols were approved by the Institutional Animal Care and Use Committee (IACUC) of The Wistar Institute. Sample size was determined by power analysis. All animals were included in the analysis. A liver metastasis model was performed essentially as previously described (52). Surgical procedures were carried out in isoflurane-anesthetized animals following aseptic technique inside a biosafety cabinet, and a slow release buprenorphine formulation was administered for pain relief. For these experiments, PC3 cells stably transduced with pLKO or shFND1 at 80% confluency were suspended in PBS, and 1×10⁶ cells were injected (50 μl) in the spleen of anesthetized 6–8 weeks old male NOD SCID γ (NSG, NOD.Cg-Prkdcscid Il2rgtm1Wjl/SzJ) mice (Jackson Laboratory). After 11 d, animals were sacrificed and the number and surface areas of metastatic foci to the liver were quantified by morphometry. In other experiments, PC3 stably transduced with pLKO or shFND1 were engrafted subcutaneously on the flanks of NOD SCID γ mice (10 animals/group) and tumor growth was measured with a caliper throughout a 27-d interval. Excised tumors at the end of the experiment were analyzed for Ki67-positive cells by immunohistochemistry. Lungs collected from the various animal groups were analyzed for metastatic dissemination by reactivity with an anti-human mitochondria antibody and immunohistochemistry.
Immunohistochemistry.
Four μm-thick sections from tissue blocks of the various animal models were stained with primary antibodies to human mitochondria (MAB1273, MilliporeSigma, Burlington, MA, USA) or Ki67 (clone 30‐9; Ventana Medical Systems, Roche Group, Tucson, AZ, USA) using diaminobenzidine (DAB) as a chromogen. All slides were counterstained with hematoxylin.
Proteomics analysis.
Proteomics intensity data were floored to the minimum detected signal (intensity of 105) and a total of 810 proteins with at least 2-fold enrichment detected with at least 2 MS2 spectra counts were considered for further annotation analysis. Proteins were then annotated as mitochondrial-related using MitoCarta 2.0 database (58) and Ingenuity Pathway Analysis (IPA®, QIAGEN Redwood City, www.qiagen.com/ingenuity). IPA was then used to identify all known protein-protein interactions between the identified FUNDC1-associated mitochondrial proteins.
Metabolomics analysis.
Differences between siCtrl and siFUNDC1 groups were examined using Student’s t-test with correction for multiple testing by the Benjamini-Hochberg procedure. Metabolites with FDR <15% identified as single match (mass list match) or >90% for mzCloud best match detected with no more than 4 missing ions were reported.
TCGA analysis.
The TCGA tumor expression data for FUNDC1 mRNA (RNA seq values) were downloaded from the cBioPortal for Cancer Genomics (http://www.cbioportal.org/). Genes whose expression positively and negatively correlated (Spearman |r|>0.2, p<0.05) with FUNDC1 expression using RNA-seq expression data for 33 individual cancer types were considered. For each cancer, genes positively or negatively associated with FUNDC1 were tested for enrichment of ATP (GO:0046034 ATP metabolic process), ROS (GO:0000302 response to reactive oxygen species) and metastasis (GO:0048870 cell motility) functions.
CCLE.
For the Cancer Cell Line Encyclopedia (CCLE), mRNA expression for FUNDC1 was accessed through the cBioPortal and downloaded. Individual cancer cell lines were grouped by primary tissue of origin according to the CCLE classification and plotted with GraphPad software.
Statistical analysis.
Data are expressed as mean±SD of amalgamated results from a minimum of three independent experiments. For some studies, results obtained from two independent experiments are shown. Unpaired, two-tailed Student’s t test was used for two-group comparative analyses. In some cases, correction for multiple testing by the Benjamini-Hochberg procedure was obtained. For multiple-group comparisons, analysis of variance (ANOVA) was used. Rayleigh distribution statistics were used for experiments of cellular chemotaxis. All statistical analyses were performed using the GraphPad software package (Prism 8.1) for Windows. A p value of <0.05 was considered statistically significant.
Supplementary Material
fig. S1. FUNDC1 regulates tumor cell motility.
fig. S2. Control of primary and metastatic tumor growth by FUNDC1.
fig. S3. FUNDC1 regulates mitochondrial dynamics.
fig. S4. FUNDC1 controls tumor cell metabolism and redox balance.
fig. S5. A FUNDC1-LonP1 complex regulates mitochondrial proteostasis.
fig. S6. FUNDC1-LonP1 regulates mitochondrial trafficking.
Movie S1. FA dynamics in cells transfected with control siRNA.
Movie S2. FA dynamics in cells transfected with FUNDC1-directed siRNA.
Movie S3. Mitochondrial dynamics in PC3 cells transfected with control siRNA.
Movie S4. Mitochondrial dynamics in PC3 cells transfected with FUNDC1-directed siRNA.
Movie S5. Mitochondrial dynamics in LN229 cells transfected with control siRNA.
Movie S6. Mitochondrial dynamics in LN229 cells transfected with FUNDC1-directed siRNA.
ACKNOWLEDGMENTS
We thank James Hayden and Frederick Keeney for assistance with time-lapse videomicroscopy in the Imaging Core Facility as well as the Proteomics and Metabolomics Core Facility for LC-MS/MS analysis.
FUNDING
This work was supported by National Institutes of Health (NIH) grants P01 CA140043 (D.C.A., L.R.L. and D.W.S.), R35 CA220446 (D.C.A.), R50 CA221838 (H.-Y.T), R50 CA211199 (A.V.K.) and NIH Shared Instrumentation grants OD023586 and OC023658.
Footnotes
COMPETING INTERESTS
The authors declare that they have no competing interests.
DATA AND MATERIALS AVAILABILITY
The mass spectrometry proteomics data have been deposited into the MassIVE and ProteomeXchange data repository with the accession number MSV000084843 (https://massive.ucsd.edu/ProteoSAFe/dataset.jsp?task=335ca74786d445a8bbe49e477aad0ee8) and PXD017295 (http://proteomecentral.proteomexchange.org/cgi/GetDataset?ID=PXD017295), respectively. All other data needed to evaluate the conclusions in the paper are present in the paper or the Supplementary Materials.
REFERENCES AND NOTES
- 1.Chandel NS, Evolution of Mitochondria as Signaling Organelles. Cell Metab 22, 204–206 (2015). [DOI] [PubMed] [Google Scholar]
- 2.Bahat A, Gross A, Mitochondria Plasticity in Cell Fate Regulation. J Biol Chem, (2019). [DOI] [PMC free article] [PubMed] [Google Scholar]
- 3.Yuan S, Norgard RJ, Stanger BZ, Cellular Plasticity in Cancer. Cancer Discov 9, 837–851 (2019). [DOI] [PMC free article] [PubMed] [Google Scholar]
- 4.Kim IS, Heilmann S, Kansler ER, Zhang Y, Zimmer M, Ratnakumar K, Bowman RL, Simon-Vermot T, Fennell M, Garippa R, Lu L, Lee W, Hollmann T, Xavier JB, White RM, Microenvironment-derived factors driving metastatic plasticity in melanoma. Nat Commun 8, 14343 (2017). [DOI] [PMC free article] [PubMed] [Google Scholar]
- 5.Tait SW, Green DR, Mitochondria and cell death: outer membrane permeabilization and beyond. Nat Rev Mol Cell Biol 11, 621–632 (2010). [DOI] [PubMed] [Google Scholar]
- 6.DeBerardinis RJ, Lum JJ, Hatzivassiliou G, Thompson CB, The biology of cancer: metabolic reprogramming fuels cell growth and proliferation. Cell Metab 7, 11–20 (2008). [DOI] [PubMed] [Google Scholar]
- 7.Gao CF, Xie Q, Su YL, Koeman J, Khoo SK, Gustafson M, Knudsen BS, Hay R, Shinomiya N, Vande Woude GF, Proliferation and invasion: plasticity in tumor cells. Proc Natl Acad Sci U S A 102, 10528–10533 (2005). [DOI] [PMC free article] [PubMed] [Google Scholar]
- 8.Holzel M, Bovier A, Tuting T, Plasticity of tumour and immune cells: a source of heterogeneity and a cause for therapy resistance? Nat Rev Cancer 13, 365–376 (2013). [DOI] [PubMed] [Google Scholar]
- 9.Ferro F, Servais S, Besson P, Roger S, Dumas JF, Brisson L, Autophagy and mitophagy in cancer metabolic remodelling. Semin Cell Dev Biol, (2019). [DOI] [PubMed] [Google Scholar]
- 10.Vyas S, Zaganjor E, Haigis MC, Mitochondria and Cancer. Cell 166, 555–566 (2016). [DOI] [PMC free article] [PubMed] [Google Scholar]
- 11.LeBleu VS, O’Connell JT, Gonzalez Herrera KN, Wikman H, Pantel K, Haigis MC, de Carvalho FM, Damascena A, Domingos Chinen LT, Rocha RM, Asara JM, Kalluri R, PGC-1alpha mediates mitochondrial biogenesis and oxidative phosphorylation in cancer cells to promote metastasis. Nat Cell Biol 16, 992–1003 (2014). [DOI] [PMC free article] [PubMed] [Google Scholar]
- 12.Porporato PE, Payen VL, Perez-Escuredo J, De Saedeleer CJ, Danhier P, Copetti T, Dhup S, Tardy M, Vazeille T, Bouzin C, Feron O, Michiels C, Gallez B, Sonveaux P, A mitochondrial switch promotes tumor metastasis. Cell Rep 8, 754–766 (2014). [DOI] [PubMed] [Google Scholar]
- 13.Eisner V, Picard M, Hajnoczky G, Mitochondrial dynamics in adaptive and maladaptive cellular stress responses. Nat Cell Biol 20, 755–765 (2018). [DOI] [PMC free article] [PubMed] [Google Scholar]
- 14.Bosc C, Selak MA, Sarry JE, Resistance Is Futile: Targeting Mitochondrial Energetics and Metabolism to Overcome Drug Resistance in Cancer Treatment. Cell Metab 26, 705–707 (2017). [DOI] [PubMed] [Google Scholar]
- 15.Viale A, Pettazzoni P, Lyssiotis CA, Ying H, Sanchez N, Marchesini M, Carugo A, Green T, Seth S, Giuliani V, Kost-Alimova M, Muller F, Colla S, Nezi L, Genovese G, Deem AK, Kapoor A, Yao W, Brunetto E, Kang Y, Yuan M, Asara JM, Wang YA, Heffernan TP, Kimmelman AC, Wang H, Fleming JB, Cantley LC, DePinho RA, Draetta GF, Oncogene ablation-resistant pancreatic cancer cells depend on mitochondrial function. Nature 514, 628–632 (2014). [DOI] [PMC free article] [PubMed] [Google Scholar]
- 16.Sellers K, Fox MP, Bousamra M 2nd, Slone SP, Higashi RM, Miller DM, Wang Y, Yan J, Yuneva MO, Deshpande R, Lane AN, Fan TW, Pyruvate carboxylase is critical for non-small-cell lung cancer proliferation. J Clin Invest 125, 687–698 (2015). [DOI] [PMC free article] [PubMed] [Google Scholar]
- 17.Chae YC, Angelin A, Lisanti S, Kossenkov AV, Speicher KD, Wang H, Powers JF, Tischler AS, Pacak K, Fliedner S, Michalek RD, Karoly ED, Wallace DC, Languino LR, Speicher DW, Altieri DC, Landscape of the mitochondrial Hsp90 metabolome in tumours. Nat Commun 4, 2139 (2013). [DOI] [PMC free article] [PubMed] [Google Scholar]
- 18.Lin YF, Haynes CM, Metabolism and the UPR(mt). Mol Cell 61, 677–682 (2016). [DOI] [PMC free article] [PubMed] [Google Scholar]
- 19.Cole A, Wang Z, Coyaud E, Voisin V, Gronda M, Jitkova Y, Mattson R, Hurren R, Babovic S, Maclean N, Restall I, Wang X, Jeyaraju DV, Sukhai MA, Prabha S, Bashir S, Ramakrishnan A, Leung E, Qia YH, Zhang N, Combes KR, Ketela T, Lin F, Houry WA, Aman A, Al-Awar R, Zheng W, Wienholds E, Xu CJ, Dick J, Wang JC, Moffat J, Minden MD, Eaves CJ, Bader GD, Hao Z, Kornblau SM, Raught B, Schimmer AD, Inhibition of the Mitochondrial Protease ClpP as a Therapeutic Strategy for Human Acute Myeloid Leukemia. Cancer Cell 27, 864–876 (2015). [DOI] [PMC free article] [PubMed] [Google Scholar]
- 20.Seo JH, Rivadeneira DB, Caino MC, Chae YC, Speicher DW, Tang HY, Vaira V, Bosari S, Palleschi A, Rampini P, Kossenkov AV, Languino LR, Altieri DC, The Mitochondrial Unfoldase-Peptidase Complex ClpXP Controls Bioenergetics Stress and Metastasis. PLoS Biol 14, e1002507 (2016). [DOI] [PMC free article] [PubMed] [Google Scholar]
- 21.Bezawork-Geleta A, Brodie EJ, Dougan DA, Truscott KN, LON is the master protease that protects against protein aggregation in human mitochondria through direct degradation of misfolded proteins. Sci Rep 5, 17397 (2015). [DOI] [PMC free article] [PubMed] [Google Scholar]
- 22.Caino MC, Altieri DC, Molecular Pathways: Mitochondrial Reprogramming in Tumor Progression and Therapy. Clin Cancer Res 22, 540–545 (2016). [DOI] [PMC free article] [PubMed] [Google Scholar]
- 23.Liu L, Feng D, Chen G, Chen M, Zheng Q, Song P, Ma Q, Zhu C, Wang R, Qi W, Huang L, Xue P, Li B, Wang X, Jin H, Wang J, Yang F, Liu P, Zhu Y, Sui S, Chen Q, Mitochondrial outer-membrane protein FUNDC1 mediates hypoxia-induced mitophagy in mammalian cells. Nat Cell Biol 14, 177–185 (2012). [DOI] [PubMed] [Google Scholar]
- 24.Caino MC, Seo JH, Aguinaldo A, Wait E, Bryant KG, Kossenkov AV, Hayden JE, Vaira V, Morotti A, Ferrero S, Bosari S, Gabrilovich DI, Languino LR, Cohen AR, Altieri DC, A neuronal network of mitochondrial dynamics regulates metastasis. Nat Commun 7, 13730 (2016). [DOI] [PMC free article] [PubMed] [Google Scholar]
- 25.Ghosh JC, Seo JH, Agarwal E, Wang Y, Kossenkov AV, Tang HY, Speicher DW, Altieri DC, Akt phosphorylation of mitochondrial Lonp1 protease enables oxidative metabolism and advanced tumor traits. Oncogene 38, 6926–6939 (2019). [DOI] [PMC free article] [PubMed] [Google Scholar]
- 26.Wu W, Tian W, Hu Z, Chen G, Huang L, Li W, Zhang X, Xue P, Zhou C, Liu L, Zhu Y, Zhang X, Li L, Zhang L, Sui S, Zhao B, Feng D, ULK1 translocates to mitochondria and phosphorylates FUNDC1 to regulate mitophagy. EMBO Rep 15, 566–575 (2014). [DOI] [PMC free article] [PubMed] [Google Scholar]
- 27.Wu W, Lin C, Wu K, Jiang L, Wang X, Li W, Zhuang H, Zhang X, Chen H, Li S, Yang Y, Lu Y, Wang J, Zhu R, Zhang L, Sui S, Tan N, Zhao B, Zhang J, Li L, Feng D, FUNDC1 regulates mitochondrial dynamics at the ER-mitochondrial contact site under hypoxic conditions. EMBO J 35, 1368–1384 (2016). [DOI] [PMC free article] [PubMed] [Google Scholar]
- 28.Birsa N, Norkett R, Higgs N, Lopez-Domenech G, Kittler JT, Mitochondrial trafficking in neurons and the role of the Miro family of GTPase proteins. Biochem Soc Trans 41, 1525–1531 (2013). [DOI] [PubMed] [Google Scholar]
- 29.Campello S, Lacalle RA, Bettella M, Manes S, Scorrano L, Viola A, Orchestration of lymphocyte chemotaxis by mitochondrial dynamics. J Exp Med 203, 2879–2886 (2006). [DOI] [PMC free article] [PubMed] [Google Scholar]
- 30.Desai SP, Bhatia SN, Toner M, Irimia D, Mitochondrial localization and the persistent migration of epithelial cancer cells. Biophys J 104, 2077–2088 (2013). [DOI] [PMC free article] [PubMed] [Google Scholar]
- 31.Cunniff B, McKenzie AJ, Heintz NH, Howe AK, AMPK activity regulates trafficking of mitochondria to the leading edge during cell migration and matrix invasion. Mol Biol Cell 27, 2662–2674 (2016). [DOI] [PMC free article] [PubMed] [Google Scholar]
- 32.Caino MC, Ghosh JC, Chae YC, Vaira V, Rivadeneira DB, Faversani A, Rampini P, Kossenkov AV, Aird KM, Zhang R, Webster MR, Weeraratna AT, Bosari S, Languino LR, Altieri DC, PI3K therapy reprograms mitochondrial trafficking to fuel tumor cell invasion. Proc Natl Acad Sci U S A 112, 8638–8643 (2015). [DOI] [PMC free article] [PubMed] [Google Scholar]
- 33.Schuler MH, Lewandowska A, Caprio GD, Skillern W, Upadhyayula S, Kirchhausen T, Shaw JM, Cunniff B, Miro1-mediated mitochondrial positioning shapes intracellular energy gradients required for cell migration. Mol Biol Cell 28, 2159–2169 (2017). [DOI] [PMC free article] [PubMed] [Google Scholar]
- 34.Zhao J, Zhang J, Yu M, Xie Y, Huang Y, Wolff DW, Abel PW, Tu Y, Mitochondrial dynamics regulates migration and invasion of breast cancer cells. Oncogene 32, 4814–4824 (2013). [DOI] [PMC free article] [PubMed] [Google Scholar]
- 35.Roussos ET, Condeelis JS, Patsialou A, Chemotaxis in cancer. Nat Rev Cancer 11, 573–587 (2011). [DOI] [PMC free article] [PubMed] [Google Scholar]
- 36.Bear JE, Haugh JM, Directed migration of mesenchymal cells: where signaling and the cytoskeleton meet. Curr Opin Cell Biol 30, 74–82 (2014). [DOI] [PMC free article] [PubMed] [Google Scholar]
- 37.Sabharwal SS, Schumacker PT, Mitochondrial ROS in cancer: initiators, amplifiers or an Achilles’ heel? Nat Rev Cancer 14, 709–721 (2014). [DOI] [PMC free article] [PubMed] [Google Scholar]
- 38.Weinberg F, Hamanaka R, Wheaton WW, Weinberg S, Joseph J, Lopez M, Kalyanaraman B, Mutlu GM, Budinger GR, Chandel NS, Mitochondrial metabolism and ROS generation are essential for Kras-mediated tumorigenicity. Proc Natl Acad Sci U S A 107, 8788–8793 (2010). [DOI] [PMC free article] [PubMed] [Google Scholar]
- 39.Piskounova E, Agathocleous M, Murphy MM, Hu ZP, Huddlestun SE, Zhao ZY, Leitch AM, Johnson TM, DeBerardinis RJ, Morrison SJ, Oxidative stress inhibits distant metastasis by human melanoma cells. Nature 527, 186–191 (2015). [DOI] [PMC free article] [PubMed] [Google Scholar]
- 40.Hurd TR, DeGennaro M, Lehmann R, Redox regulation of cell migration and adhesion. Trends Cell Biol 22, 107–115 (2012). [DOI] [PMC free article] [PubMed] [Google Scholar]
- 41.Ishikawa K, Takenaga K, Akimoto M, Koshikawa N, Yamaguchi A, Imanishi H, Nakada K, Honma Y, Hayashi J, ROS-generating mitochondrial DNA mutations can regulate tumor cell metastasis. Science 320, 661–664 (2008). [DOI] [PubMed] [Google Scholar]
- 42.Debattisti V, Gerencser AA, Saotome M, Das S, Hajnoczky G, ROS Control Mitochondrial Motility through p38 and the Motor Adaptor Miro/Trak. Cell Rep 21, 1667–1680 (2017). [DOI] [PMC free article] [PubMed] [Google Scholar]
- 43.Quiros PM, Espanol Y, Acin-Perez R, Rodriguez F, Barcena C, Watanabe K, Calvo E, Loureiro M, Fernandez-Garcia MS, Fueyo A, Vazquez J, Enriquez JA, Lopez-Otin C, ATP-dependent Lon protease controls tumor bioenergetics by reprogramming mitochondrial activity. Cell Rep 8, 542–556 (2014). [DOI] [PubMed] [Google Scholar]
- 44.Pryde KR, Taanman JW, Schapira AH, A LON-ClpP Proteolytic Axis Degrades Complex I to Extinguish ROS Production in Depolarized Mitochondria. Cell Rep 17, 2522–2531 (2016). [DOI] [PMC free article] [PubMed] [Google Scholar]
- 45.Deng J, Wang P, Chen X, Cheng H, Liu J, Fushimi K, Zhu L, Wu JY, FUS interacts with ATP synthase beta subunit and induces mitochondrial unfolded protein response in cellular and animal models. Proc Natl Acad Sci U S A 115, E9678–E9686 (2018). [DOI] [PMC free article] [PubMed] [Google Scholar]
- 46.Song KH, Kim JH, Lee YH, Bae HC, Lee HJ, Woo SR, Oh SJ, Lee KM, Yee C, Kim BW, Cho H, Chung EJ, Chung JY, Hewitt SM, Chung TW, Ha KT, Bae YK, Mao CP, Yang A, Wu TC, Kim TW, Mitochondrial reprogramming via ATP5H loss promotes multimodal cancer therapy resistance. J Clin Invest 128, 4098–4114 (2018). [DOI] [PMC free article] [PubMed] [Google Scholar]
- 47.Esparza-Molto PB, Cuezva JM, The Role of Mitochondrial H(+)-ATP Synthase in Cancer. Front Oncol 8, 53 (2018). [DOI] [PMC free article] [PubMed] [Google Scholar]
- 48.Fu X, Chin RM, Vergnes L, Hwang H, Deng G, Xing Y, Pai MY, Li S, Ta L, Fazlollahi F, Chen C, Prins RM, Teitell MA, Nathanson DA, Lai A, Faull KF, Jiang M, Clarke SG, Cloughesy TF, Graeber TG, Braas D, Christofk HR, Jung ME, Reue K, Huang J, 2-Hydroxyglutarate Inhibits ATP Synthase and mTOR Signaling. Cell Metab 22, 508–515 (2015). [DOI] [PMC free article] [PubMed] [Google Scholar]
- 49.Ho J, Sielaff H, Nadeem A, Svanborg C, Gruber G, The molecular motor F-ATP synthase is targeted by the tumoricidal protein HAMLET. J Mol Biol 427, 1866–1874 (2015). [DOI] [PubMed] [Google Scholar]
- 50.Lehuede C, Dupuy F, Rabinovitch R, Jones RG, Siegel PM, Metabolic Plasticity as a Determinant of Tumor Growth and Metastasis. Cancer Res 76, 5201–5208 (2016). [DOI] [PubMed] [Google Scholar]
- 51.Mani SA, Guo W, Liao MJ, Eaton EN, Ayyanan A, Zhou AY, Brooks M, Reinhard F, Zhang CC, Shipitsin M, Campbell LL, Polyak K, Brisken C, Yang J, Weinberg RA, The epithelial-mesenchymal transition generates cells with properties of stem cells. Cell 133, 704–715 (2008). [DOI] [PMC free article] [PubMed] [Google Scholar]
- 52.Caino MC, Seo JH, Wang Y, Rivadeneira DB, Gabrilovich DI, Kim ET, Weeraratna AT, Languino LR, Altieri DC, Syntaphilin controls a mitochondrial rheostat for proliferation-motility decisions in cancer. J Clin Invest 127, 3755–3769 (2017). [DOI] [PMC free article] [PubMed] [Google Scholar]
- 53.Pienta KJ, Robertson BA, Coffey DS, Taichman RS, The cancer diaspora: Metastasis beyond the seed and soil hypothesis. Clin Cancer Res 19, 5849–5855 (2013). [DOI] [PMC free article] [PubMed] [Google Scholar]
- 54.Drake LE, Springer MZ, Poole LP, Kim CJ, Macleod KF, Expanding perspectives on the significance of mitophagy in cancer. Semin Cancer Biol 47, 110–124 (2017). [DOI] [PMC free article] [PubMed] [Google Scholar]
- 55.Wu L, Zhang D, Zhou L, Pei Y, Zhuang Y, Cui W, Chen J, FUN14 domain-containing 1 promotes breast cancer proliferation and migration by activating calcium-NFATC1-BMI1 axis. EBioMedicine 41, 384–394 (2019). [DOI] [PMC free article] [PubMed] [Google Scholar]
- 56.Agarwal E, Altman BJ, Seo JH, Ghosh JC, Kossenkov AV, Tang HY, Krishn SR, Languino LR, Gabrilovich DI, Speicher DW, Dang CV, Altieri DC, Myc-mediated transcriptional regulation of the mitochondrial chaperone TRAP1 controls primary and metastatic tumor growth. J Biol Chem 294, 10407–10414 (2019). [DOI] [PMC free article] [PubMed] [Google Scholar]
- 57.Cox J, Mann M, MaxQuant enables high peptide identification rates, individualized p.p.b.-range mass accuracies and proteome-wide protein quantification. Nat Biotechnol 26, 1367–1372 (2008). [DOI] [PubMed] [Google Scholar]
- 58.Calvo SE, Clauser KR, Mootha VK, MitoCarta2.0: an updated inventory of mammalian mitochondrial proteins. Nucleic Acids Res 44, D1251–1257 (2016). [DOI] [PMC free article] [PubMed] [Google Scholar]
Associated Data
This section collects any data citations, data availability statements, or supplementary materials included in this article.
Supplementary Materials
fig. S1. FUNDC1 regulates tumor cell motility.
fig. S2. Control of primary and metastatic tumor growth by FUNDC1.
fig. S3. FUNDC1 regulates mitochondrial dynamics.
fig. S4. FUNDC1 controls tumor cell metabolism and redox balance.
fig. S5. A FUNDC1-LonP1 complex regulates mitochondrial proteostasis.
fig. S6. FUNDC1-LonP1 regulates mitochondrial trafficking.
Movie S1. FA dynamics in cells transfected with control siRNA.
Movie S2. FA dynamics in cells transfected with FUNDC1-directed siRNA.
Movie S3. Mitochondrial dynamics in PC3 cells transfected with control siRNA.
Movie S4. Mitochondrial dynamics in PC3 cells transfected with FUNDC1-directed siRNA.
Movie S5. Mitochondrial dynamics in LN229 cells transfected with control siRNA.
Movie S6. Mitochondrial dynamics in LN229 cells transfected with FUNDC1-directed siRNA.