Introduction
In an earlier article, we cautioned against overemphasizing the importance of the P-value.1 We argued that the P-value was just one tool in the toolbox for interpreting the results of a study. One should also consider the size of the effect and define and interpret effect measures that are clinically relevant. In this article, we discuss another tool that can be used to inform consumers of research: the “fragility index.”
What Is the Fragility Index?
The fragility index is a measure of the robustness (or fragility) of the results from a clinical trial that uses dichotomous outcomes.2 It most often is used when results are statistically significant (P ≤ .05). The fragility index represents the minimum number of participants whose status needs to change from an “event” to a “nonevent” (or vice versa) so that the results switch from statistically significant to nonsignificant. The larger the fragility index, the more robust are the trial’s data. One can further evaluate the fragility index relative to the sample size by calculating the “fragility quotient” (fragility index divided by sample size), with a smaller fragility quotient indicating a more robust trial endpoint.
How Is the Fragility Index Calculated?
The fragility index is calculated by switching one patient in the control or intervention group from an “event” to a “nonevent” and recalculating a 2-sided Fisher’s exact test until the P-value is >.05. In essence, this process is a type of sensitivity analysis that describes how many patients would need a different outcome to make the trial results not statistically significant.
An example of the fragility index calculation is provided in Table 1 using data from a 2009 randomized controlled trial (RCT) comparing the rate of fusion between iliac crest bone graft (ICBG) versus recombinant human bone morphogenetic protein–2 (rhBMP-2) in patients with lumbosacral degenerative disease.3 At the 24-month follow-up, 96% (186 of 194) of the patients in the rhBMP-2 group compared with 89% (151 of 169) of those in the ICBG group achieved fusion, P = .023. The fragility index score for this trial is 2; in other words, if 184 rhBMP-2 patients instead of 186 achieved fusion, the P-value would be greater than .05.
Table 1.
Fragility Index Calculation Example Using Data Comparing Fusion of the Lumbosacral Spine Between recombinant human bone morphogenetic protein–2 (rhBMP-2) and Iliac Crest Bone Graft (ICBG).3
| rhBMP-2 | ICBG | P | |
|---|---|---|---|
| Original results | 186/194 | 151/169 | .023 |
| Step 1 | 185/194 | 151/169 | .043 |
| Step 2 | 184/194 | 151/169 | .074 |
What Does a Fragility Index of Zero Represent?
Since the fragility index is calculated using a Fisher’s exact test, results from other methods, such as a chi-square test, can be discordant. The chi-squared test applies an approximation assuming the sample is large, while Fisher’s exact test runs an exact procedure especially for small-sized samples. Therefore, when investigators do not use Fisher’s exact test for small trials, a recalculation of the results using Fisher’s exact test can produce a nonsignificant P-value without “converting” a patient from a nonevent to an event. In those situations, the fragility index is zero, which underscores the fragility of the trial results.
Is There an “Acceptable” Fragility Index?
Currently, no specific fragility index value is accepted as “robust” (good) or “fragile” (bad). However, the results of a trial should be viewed with particular skepticism if the number of patients who are lost to follow-up is greater than the fragility index given that the unknown outcomes of these patients could alter the results. In a systematic survey of 40 spine RCTs, Evaniew et al5 provide a description of the fragility index among trials of spine surgery as follows:
Median fragility index: 2 (interquartile range [IQR] 1-3)
75% of trials had a fragility index ≤ 3
20% of trials had a fragility index of zero
65% of trials had a fragility index ≤ the total number of participants lost to follow-up
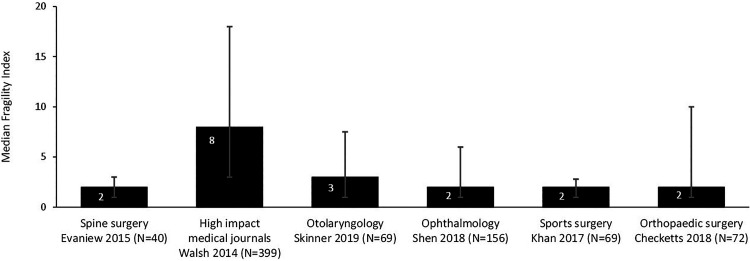
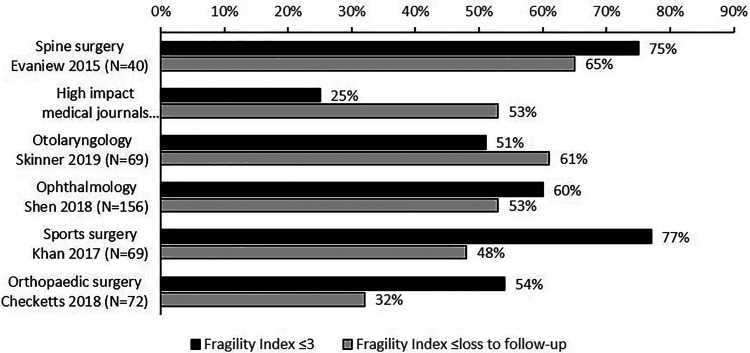
Figures 1 and 2 provide a landscape for the fragility index among RCTs in spine surgery compared with other medical and surgical disciplines. Only those studies from high-impact medical journals had appreciably higher fragility indices than those in spine surgery.
Figure 1.
Median fragility index and interquartile range among randomized controlled trials (RCTs) in different medical and surgical disciplines.2,4-8
Figure 2.
Proportion of randomized controlled trials (RCTs) with a fragility index ≤3 and a fragility index ≤ loss to follow-up by different medical and surgical disciplines.2,4-8
Limitations of the Fragility Index
It is only appropriate for dichotomous outcomes. The fragility index as described can be applied neither to an outcome that is continuous (eg, Oswestry Disability Index or visual analogue pain scale) nor to an outcome dependent on time-to-event such as survival analysis.
No standard fragility index “cutoff.” As discussed above, there is no specific cutoff or lower limit of the fragility index to classify a study as “fragile” or “robust.”
The language associated with the fragility index may be misleading. The fragility index closely correlates inversely with the P-value. As a result, larger P-values (closer to .05) will be categorized as “fragile” while comparisons with smaller P-values will be deemed “robust.” This language inappropriately suggests that the P-value is a measure of the strength of effect, which it is not.
Summary
The fragility index is a measure of the robustness (or fragility) of the results from a clinical trial that uses dichotomous outcomes.
The fragility index represents the minimum number of participants whose status needs to change from an “event” to a “nonevent” (or vice versa) so that the results switch from statistically significant to nonsignificant.
The larger the fragility index, the more robust is the trial’s data.
Currently, there is no specific cutoff or lower limit of the fragility index to classify a study as “fragile” or “robust.”
Though it has limitations, the fragility index provides the clinician with an intuitive measure (ie, number of individual patients) to assist in the assessment of the strength of a research finding.
Footnotes
Declaration of Conflicting Interests: The author(s) declared no potential conflicts of interest with respect to the research, authorship, and/or publication of this article.
Funding: The author(s) received no financial support for the research, authorship, and/or publication of this article.
References
- 1. Dettori JR, Norvell DC, Chapman JR. P-value worship: is the idol significant? Global Spine J. 2019;9:357–359. [DOI] [PMC free article] [PubMed] [Google Scholar]
- 2. Walsh M, Srinathan SK, McAuley DF, et al. The statistical significance of randomized controlled trial results is frequently fragile: a case for a fragility index. J Clin Epidemiol. 2014;67:622–628. [DOI] [PubMed] [Google Scholar]
- 3. Dimar JR, 2nd, Glassman SD, Burkus JK, Pryor PW, Hardacker JW, Carreon LY. Clinical and radiographic analysis of an optimized rhBMP-2 formulation as an autograft replacement in posterolateral lumbar spine arthrodesis. J Bone Joint Surg Am. 2009;91:1377–1386. [DOI] [PubMed] [Google Scholar]
- 4. Checketts JX, Scott JT, Meyer C, Horn J, Jones J, Vassar M. The robustness of trials that guide evidence-based orthopaedic surgery. J Bone Joint Surg Am. 2018;100:e85. [DOI] [PubMed] [Google Scholar]
- 5. Evaniew N, Files C, Smith C, et al. The fragility of statistically significant findings from randomized trials in spine surgery: a systematic survey. Spine J. 2015;15:2188–2197. [DOI] [PubMed] [Google Scholar]
- 6. Khan M, Evaniew N, Gichuru M, et al. The fragility of statistically significant findings from randomized trials in sports surgery: a systematic survey. Am J Sports Med. 2017;45:2164–2170. [DOI] [PubMed] [Google Scholar]
- 7. Shen C, Shamsudeen I, Farrokhyar F, Sabri K. Fragility of results in ophthalmology randomized controlled trials: a systematic review. Ophthalmology. 2018;125:642–648. [DOI] [PubMed] [Google Scholar]
- 8. Skinner M, Tritz D, Farahani C, Ross A, Hamilton T, Vassar M. The fragility of statistically significant results in otolaryngology randomized trials. Am J Otolaryngol. 2019;40:61–66. [DOI] [PubMed] [Google Scholar]


