Abstract
Open burning of refuse is one of the key sources that causes high air pollution in Metropolitan cities. This paper identifies pollutant concentration of particulate matter (PM2.5) emission and air quality index categories with the peak hour interval on Hidar Sitaten day, and present analysis of air quality in Addis Ababa from August 2016 to November 2019. Daily records, with a 1-hour interval, of raw concentration of air pollutant and air quality index data, were obtained from the AirNow website of Addis Ababa central monitoring station. The data collected were analyzed using descriptive statistics of the mean air quality index and concentration of PM2.5. Accordingly, the study revealed that the peak hour for high pollutant concentration emission ranges between 8 pm to 11 pm hours, and the mean air quality index was more than a moderate level. Particularly, on Hidar Sitaten in 2019 at 9 pm the maximum concentration of PM2.5 was 8.6 times higher than WHO air quality guideline standard of daily allowance. The highest mean of air quality index and concentration of PM2.5 recorded was 112 and 44.2 µg/m3 on 21 November 2017, respectively, and it was found to be unhealthy for sensitive groups. This implies that the concentration of PM2.5 was harmful to people who are unusually sensitive to particulate pollution and have health problems. Therefore, public participation and strong regulations are needed on air quality management to strike a balance between a cultural practice of Hidar Sitaten and healthy air quality.
Keywords: Addis Ababa, air quality index, PM2.5, Hidar Sitaten, open burning
Introduction
Air pollution has been a major concern throughout the world, and ambient air pollution is the leading environmental health risk factor worldwide.1-3 Air pollutants are various chemicals diffused into the atmosphere from both natural and anthropogenic sources that change the composition of atmospheres and affect the biotic and abiotic environment.1,2 Open burning, emission of air pollutants from vehicles, industries, domestic sources, and natural sources are the source of air pollutants. A high amount of air pollutant in the ambient air was reported to affect the health of the population. Thus, air pollution has always been an issue when it comes to the health of the world.4,5 It is a key global risk with the WHO estimating 8 million people a year dying prematurely from breathing polluted air.6 The quality of the air on respiration is more important for cities such as İstanbul, having the busiest traffic flow and the highest population in Turkey.7
Air pollutants can be transported from one region to another under the influence of the transboundary movement of air mass,8 and the biggest environmental health challenges confronting humanity.9 The effect of regional pollution transport is much greater in countries with a very high population density.10 The outdoor and indoor air pollution is directly linked with pneumonia and other respiratory diseases that account for almost one in 10 under-5 deaths, making air pollution one of the leading dangers to children’s health.11 Likewise, exposure to airborne fine PM2.5 carries substantial health risks, particularly for younger children.12 The time variability and long term trends of PM2.5 at various regional background sites across Europe are studied and interpreted in the work.13 Unhealthy air quality can harm human health and the environment as well as property.14
Anthropogenic activities have high potential environmental and human health impacts.15 Due to rampant industrialized growth, anthropogenic emissions of various gaseous emissions and particulate matter rise.16 It is an invisible and foremost cause of some of the most common human health challenges,9 PM2.5 is a primary air pollutant, widely reported as important for public health especially for respiratory problems.17 It is currently one of the main concerns on a global scale for its adverse effects on human health, environment, and climate.18 On the other hand, fine particles are the smallest particles (those 2.5 micrometers or less in diameter) are called “fine” particles.19 Currently, in some countries, there are traditional practices of open burning of refuses, waste, and other municipal solid waste. Average source contributions to PM2.5 indicate that biomass burning and motor vehicle emissions are the predominant sources of PM2.5 across all sites in Auckland.20 Open waste burning contributes to a large percentage of global PM2.5 emissions with an estimated 10 million tons per year.21 According to a study conducted by Park et al,22 open burning was the main agent of air pollution and cause major health difficulties for children and pregnant women and also the potential sources of non-point emission.
Air quality in Africa has remained a relatively under-researched field. Most of the African population is dependent on biomass for cooking and heating with most of the combustion happening in low-efficiency stoves in unvented kitchens.23 However, air quality is closely related to quality of life. Air pollution forecasting plays a vital role in air pollution warnings and controlling.24 Clean air is the foremost requirement to sustain the healthy lives of humankind. Human beings need a regular supply of food and water and an essentially continuous supply of air. The requirements for air and water are relatively constant (10-20 m3 and 1-2 L per day, respectively).25 That all people should have free access to air and water of acceptable quality is a fundamental human right.25 Effective air quality management and planning use observational air pollutant data to not only assess air quality conditions but to also evaluate the impact of air quality control measures.26
As Addis Ababa grows both economically and spatially air pollution from vehicle emissions, open burning of waste, and other sources has become an increasing health concern in the metropolitan area. The residents traditionally collect waste from households like refuses, plastics, papers, and other waste materials gathered and set alight each year on Hidar12 of the Ethiopian calendar and the date was locally called Hidar Sitaten. This implies that the concentration of PM2.5 was harmful to people who are unusually sensitive to particulate pollution and have health problems. Thus, this paper intends to show the impact of the traditional practice: Hidar Sitaten, on air quality of Addis Ababa implicate its public health importance. Therefore, awareness creation for community, public participation, and strong regulations are needed on air quality management to prohibit open burning of refuse during Hidar Sitaten day.
Study design and methods
Study area
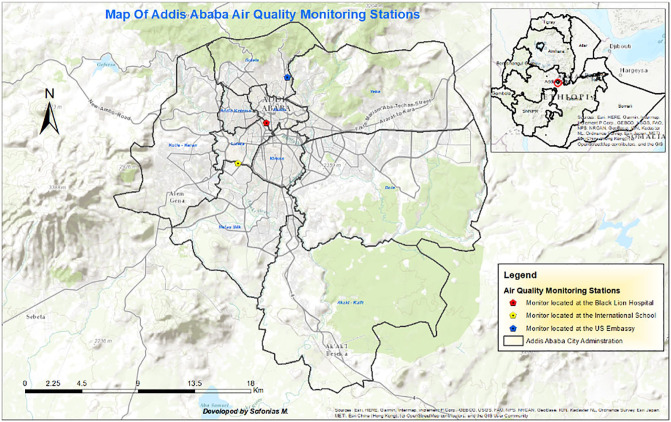
Ethiopia has a wide range of altitudes, from 100 m below sea level on the Northeastern border to more than 4000 m above sea level in the country’s mountain ranges.27 Addis Ababa is located on the central highlands of Ethiopia in the middle of Oromia region with the absolute location of nearly 09°01′48″N latitude and 38°44′24″E longitudes (Figure 1). There are 10 sub-cities with about 116 districts. The city has seen a strong annual growth rate in 3 decades and the population as of 2017 is growing closer to 4 million. It is now estimated to be inhabited by almost 5.4 million people.28 The city had annual rainfall of 1175.8 mm rainfall. The climate is characterized by 3 continuous months of rainy season (June-August) and 9 months of dry season. A relatively colder nights (“Wurch”) exists between October and January.29
Figure 1.
Map of study site of US. Embassy station or Addis Ababa central monitoring station.
Materials and methods
Addis Ababa has 3 PM2.5 air quality monitoring stations at Black Lion Hospital, Addis Ababa Central, and Addis Ababa International Community School which is run by the United States Department of State in partnership with the United States of Environmental Protection Agency (USEPA). The air quality monitoring data from Black Lion (Geo-Health Hub) station is not publicly available. However, the US Embassy monitors are located at the US Embassy and the Addis Ababa International Community School, and data are available online to the community. The study used data from Addis Ababa central monitoring (US Embassy monitoring) station of air concentration that is available on the AirNow website. Based on Environmental Protection Authority standards the descriptors are intended to convey information to the public about how air quality within each category relates to public health.
Accordingly, there are two criteria used for the selection of monitoring stations. The first criterion is availability of data and valid data for more than 2 years. The second criterion constitutes an important factor in the selection of monitoring sites. Based on the above criteria Addis Ababa central monitoring station site was fit the requirement for this study. Winds in Addis Ababa come primarily from East to West and high wind speeds tend to clear out particulate matter through dispersion.
Data gathering
Environmental Protection Authority and its federal, tribal, state, and local partners have developed an AirNow web site to provide the public with easy access to national air quality information. The data used in this study were PM2.5 concentration. The hourly concentration data were downloaded from AirNow or www.airnow.gov website of USEPA. The real-time air quality data and forecast were essential to protect public health in Addis Ababa. The PM2.5 was selected due to the negative health effects related to them. Available data was collected from AirNow website, and trend analysis was used as data extracting method to collect data during study period August 2016 to November 2019. AirNow receives real-time PM2.5 data from Addis Ababa central monitor and collect air quality forecasts for Addis Ababa city. The recorded raw concentration of air pollutants and air quality index data are taken from a registered data monitoring station on daily bases with 1-hour intervals.
PM2.5 was considered for air pollutants and trend analysis of air quality categories. Available air quality data and information was used to assess the current situation and identify key peak hour air pollutant and air quality index level or categories. Particularly, data gathered on Hidar 12 according to Ethiopia calendar when there is open burning refuse. Also, air pollution data measured by governments across the world are a public good that can lead to transformational advances in public health when made openly available.30
Data pre-processing
The raw concentration of pollutant and air quality index data was downloaded according to day, month, and year. The pre-processing of the data was done in 2 steps namely: (1) missing or invalid data; (2) valid data. The first step requires searching the data for missing and invalid data points, which are flagged as –999 in the raw data or put as missed or invalid. The presence of missing data in the dataset can be caused by various factors including the shutdown or malfunctioning of the instrument or invalid data points that appear due to unusually high concentrations. Finally, the time intervals for the missing days were identified and rejected. In cases where a pollutant showing valid data percentage value less than 60% (ie, less than 5250 hours) during a year, that pollutant in that year was excluded from further analysis.31 Preferably, the researcher would present secondary data analyses with available datasets of the PM2.5 from each hours, days, months, and years from the air monitoring station. The data were analyzed by descriptive statistical analysis such as maximum, mean, and minimum using OriginPro version 9 software.s
Air quality indexinterpretation
Air quality indices (AQI) used for local and regional air quality management in many metro cities of the world (Table 1).32
Table 1.
| S.No | Air quality index numbers | Level of health concern (Descriptor) | Health message | Air quality index color |
|---|---|---|---|---|
| 1 | 0-50 | Good | None | Green |
| 2 | 51-100 | Moderate | Unusually sensitive people should reduce prolonged or heavy exertion | Yellow |
| 3 | 101-150 | Unhealthy for sensitive groups | Sensitive groups should reduce prolonged or heavy exertion | Orange |
| 4 | 151-200 | Unhealthy | Sensitive groups should avoid prolonged or heavy exertion; general public should reduce prolonged or heavy exertion | Red |
| 5 | 201-300 | Very Unhealthy | Sensitive groups should avoid all physical activity outdoors; general public should avoid prolonged or heavy exertion | Purple |
| 6 | 301-500 | Hazardous | Everyone should avoid all physical activity outdoors | Maroon |
Results
The summary of maximum, mean, and minimum of PM2.5 concentration values calculated for the monitoring station considered in this study from August 2016 to November 2019 (Table 2). The result revealed that, the air quality index and raw concentration of pollutant exceeded, the allowable limits according to WHO air quality guidelines respectively.
Table 2.
Summary of air quality index and raw concentration in maximum, mean, minimum, and standard deviation with AQI category from 2016 to 2019 intervals from Addis Ababa central monitoring station on 21 and 22 November.
| Parameter | AQI | AQI category | Raw concentration. µg/m3 | Year |
|---|---|---|---|---|
| Maximum | 68 | Moderate | 22 | 21-11-2016 |
| Mean | 49.37 | Good | 12.58 | |
| Minimum | 28 | Good | 6 | |
| Stand deviation | 10.93 | Good | 4.78 | |
| Maximum | 171 | Unhealthy | 106 | 21-11-2017 |
| Mean | 112 | Unhealthy for sensitive | 44.17 | |
| Minimum | 53 | Moderate | 11 | |
| Stand deviation | 40.9 | Moderate | 29.90 | |
| Maximum | 177 | Unhealthy | 176 | 21-11-2018 |
| Mean | 68.96 | Moderate | 23.3 | |
| Minimum | 21 | Good | 3 | |
| Stand deviation | 45.20 | Good | 39.05 | |
| Maximum | 184 | Unhealthy | 215 | 22-11-2019 |
| Mean | 77.6 | Moderate | 30.625 | |
| Minimum | 24 | Good | 4 | |
| Stand deviation | 51.8 | Moderate | 49.21 |
As indicated in Table 2 below, the mean of air quality index range between 49.4 and 112. This implies that the level of health concern with respective to air quality was: good (2016), moderate (2018 and 2019), and unhealthy for sensitive groups (2017) during Hidar Sitaten day. The maximum value AQI recorded were 171, 177, and 184 for 2017, 2018, 2019 respectively. The air condition was ranged from unhealthy conditions to human health, whereas the value of AQI recorded was 68 (2016) which was moderate on Hidar Sitaten day (21 November).
According to the WHO of air quality guidelines, the standard of PM2.5 were 25 µg/m3 and 10 µg/m3, repetitively based on relation between 24-hour and annual PM2.5 levels (Table 3).
Table 3.
Air quality standard guideline and interim targets for particulate matter (PM2.5): 24-hour mean.36
| S.No | 24-hour mean level | PM10 (µg/m3) | PM2.5 (µg/m3) | Basis for the selected level based |
|---|---|---|---|---|
| 1 | WHO interim target 1 (IT-1) | 150 | 75 | Based on published risk coefficients from multicenter studies and meta-analyses (about 5% increase in short-term mortality over AQG) |
| 2 | WHO interim target 2 (IT-2) | 100 | 50 | Based on published risk coefficients from multicenter studies and meta-analyses (about 2.5% increase in short-term mortality over AQG) |
| 3 | WHO interim target 3 (IT-3) | 75 | 37.5 | About 1.2% increase in short-term mortality over AQG |
| 4 | WHO air quality guidelines (AQG) | 50 | 25 | Based on relation between 24-hour and annual PM levels |
As shown in Table 4 below, there are possible PM2.5 air quality index categories for regions (1997 and 2006 USEPA NAAQS, and 2007 WHO air quality guidelines). Likewise, the daily and annual allowable of PM2.5 were 25 µg/m3 and 10 µg/m3, respectively.
Table 4.
Possible PM2.5 AQI categories for region.35
| PM2.5 Standard (µg/m3) | 1997 USEPA NAAQS | 2006 USEPA NAAQS | 2007 WHO Guidelines | |||
| Daily | 65 | Daily | 35 | Daily | 25 | |
| Annual | 15 | Annual | 15 | Annual | 10 | |
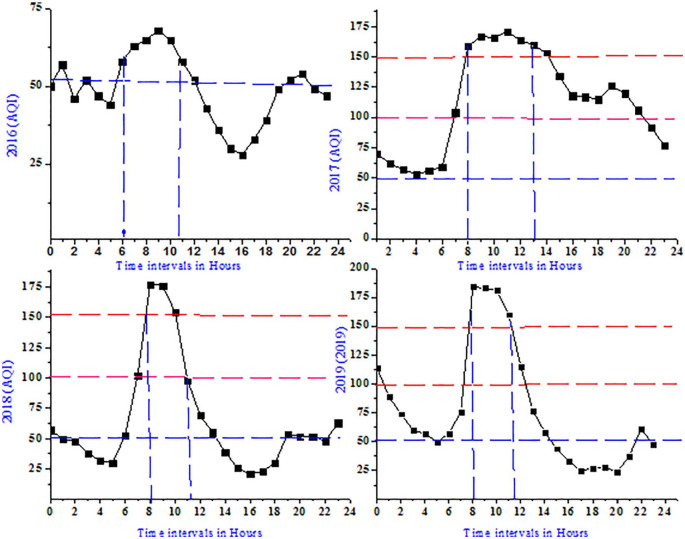
As indicated in Figure 2 below, the highest AQI recorded was 184 at 9 PM peak hour in 2019 and the lowest air quality level recorded was 68 at 9 PM peak hour in 2016 during Hidar Sitaten day. Whereas, the air quality index level recorded were 171 (11 PM) and 177 (8 PM) peak hours in 2017 and 2018, respectively. The peak hours of AQI recorded were from 8 pm to 11 PM during Hidar Sitaten days from 2017 to 2019 which shows unhealthy air quality.
Figure 2.
Daily air quality index values in time interval of 1 hours of Hidar Sitaten day from 2016 to 2019 of Addis Ababa central monitoring station.
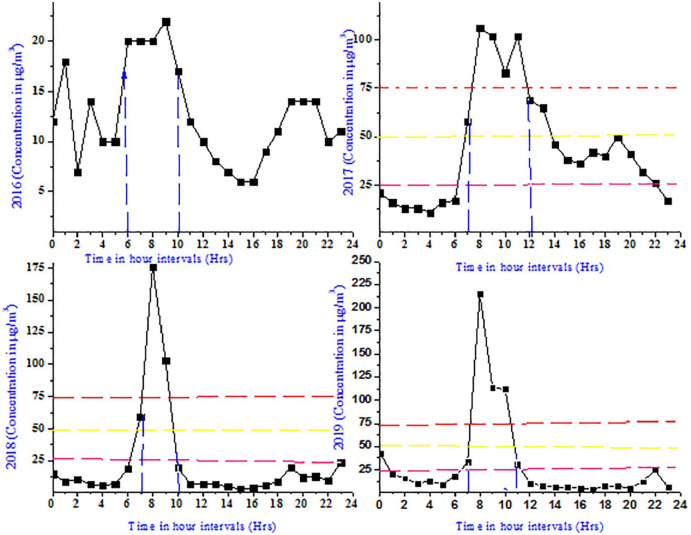
As shown in Figure 3 below, the maximum recorded raw concentration of PM2.5 were 215 µg/m3 at 9 PM peak hour in 2019. On the contrary the lowest raw concentration of PM2.5 recorded was 22 µg/m3 at 9 PM peak hour in 2016 during Hidar Sitaten day. Besides, the peak hour ranges from 7 PM to 10 PM during Hidar Sitaten days from 2017 to 2019 and this period is unsafe for health life. Furthermore, 9 PM was critical time of open burning refuse and the highest emission of PM2.5 released to the environment. It was unsafe for human and environmental health because the Environmental Protection Authority stated the standards of daily PM2.5 was 25 µg/m3 but the result found was beyond the standard limit. Moreover, on Hidar Sitaten (22) day in 2019 at 9 PM, the concentration of particulate matter released was 8.6 times higher than WHO air quality guideline standards of daily allowance. On the other hand, the emission of PM2.5 during 2016 was found below U.S. EPA standards (<25 µg/m3) daily.
Figure 3.
Daily raw concentration of PM2.5 in (µg/m3) values in time interval of 1 hours of Hidar Sitaten day from 2016 to 2019 of Addis Ababa central monitoring station.
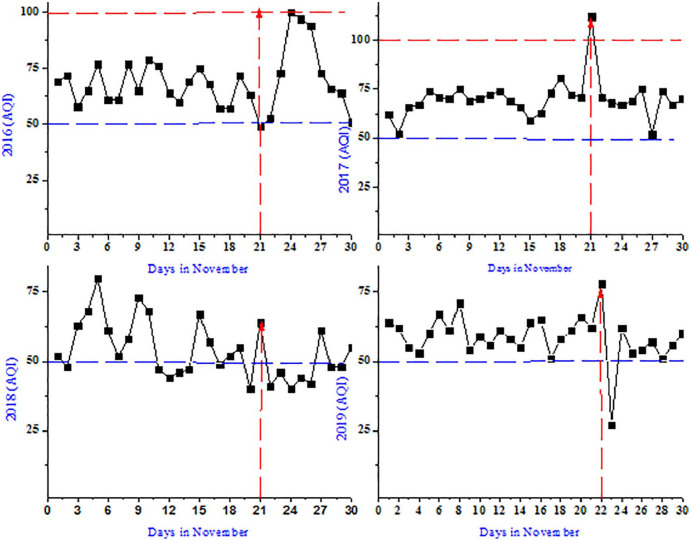
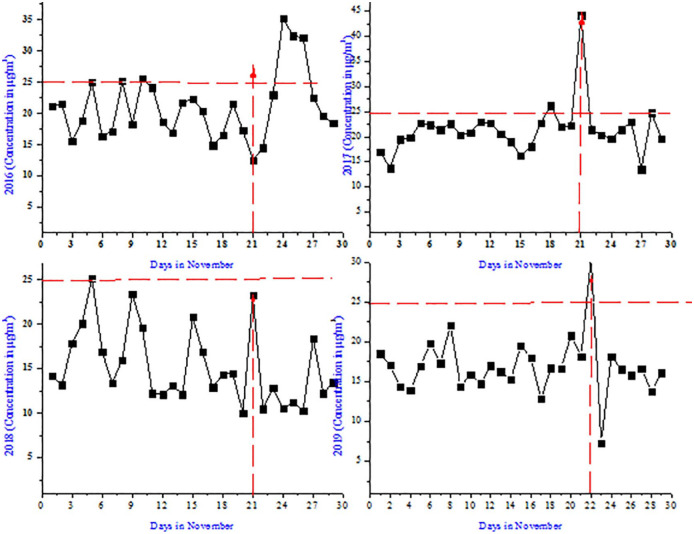
As indicated in Figure 4 below, the highest air quality index recorded was 112 on 21 November during Hidar Sitetan day in 2017, on the other hand the lowest of air quality index recorded was 27.48 on 23 November 2019.
Figure 4.
Trend analysis of air quality index of PM2.5 values in time interval of Hidar Sitaten days from 2016 to 2019 of Addis Ababa central monitoring.
As shown in Figure 5 below, the highest recorded raw concentration of PM2.5 was 44.17 µg/m3 on 21 November or Hidar Sitetan day 2017, whereas the lowest concentration of air pollutants recorded was 7.29 µg/m3 on 23 of November 2019. Moreover, the recorded raw concentration of PM2.5 increased between 21 and 27 November in 2016. Likewise, the recorded raw concentration of PM2.5 increased 20 November and 22 November 2017. Moreover, similar trends had been observed for the same period of 2018 and 2019.
Figure 5.
Trend analysis of raw concentration of air pollutant (PM2.5) values in time interval of Hidar Sitaten days from 2016 to 2019 of Addis Ababa central monitoring station.
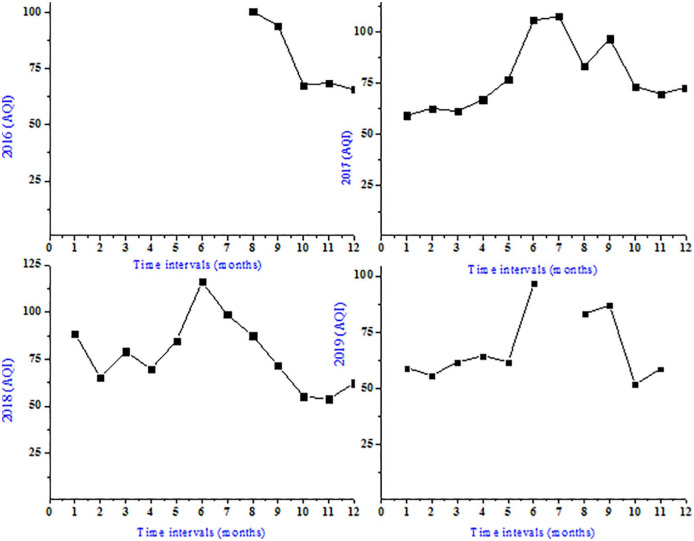
As indicated in Figure 6 below, the highest AQI recorded was 116.1 in June 2018 and the lowest AQI recorded was 51.9 in October 2019. Almost all AQI was found to be above 50 AQI monthly, this implies that the air quality index of Addis Ababa city ranged between moderate and above moderate level.
Figure 6.
Trend analysis of air quality index values in time interval of months from 2016 to 2019 of Addis Ababa central monitoring station.
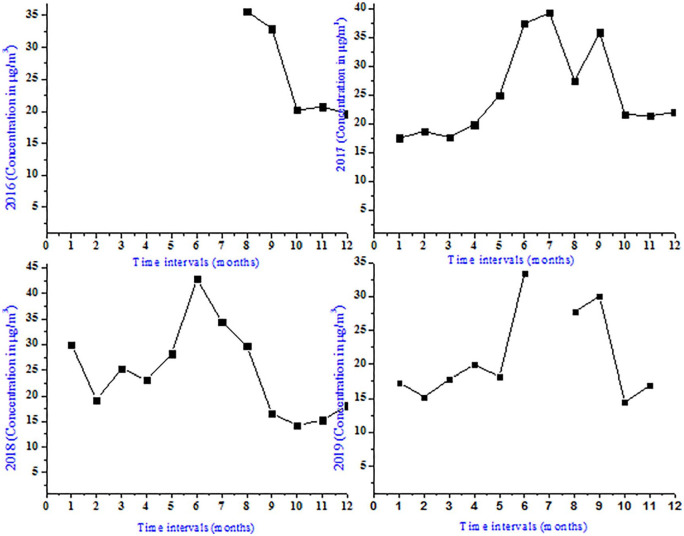
As shown in Figure 7 below, the highest recorded trend of PM2.5 concentration recorded was 42.3 µg/m3 in June 2018, and the lowest PM2.5 concentration of recorded was 14.3 µg/m3 in October 2019.
Figure 7.
Trend analysis of raw concentration of PM2.5 values in time interval of months from 2016 to 2019 of Addis Ababa central monitoring station.
As indicted in Figure 8 below, the highest mean concentration pollutant recorded was 44.17 µg/m3 and 30.6 µg/m3 in 2017 and 2019 respectively, Oppositely the lowest mean annual concentration of pollutants recorded were 12.58 µg/m3 and 23.3 µg/m3 in 2016 and 2018, correspondingly. The mean average of particulate matter concentration was 27.7 µg/m3 from August 2016 to November 2019.
Figure 8.
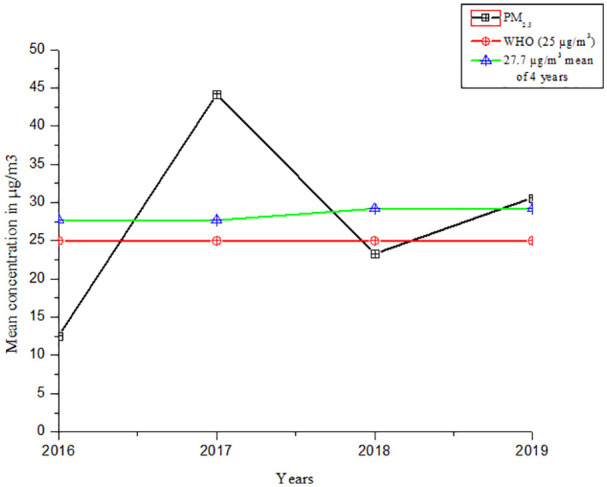
The mean average and the mean of PM2.5 concentration values from 2016 to 2019 on Hidar Sitaten days.
Discussion
This study identifying the impact of open burning refuses on air quality during Hidar Sitaten day. Hidar Sitaten sometimes called smoking Hidar is annually practiced and commemorated for the memory of Spanish flu cases in Ethiopia. It is very common to observe open burning activities on Hidar Sitaten day and the resulting air pollution in Addis Ababa city. Consequently, respiration activities were difficult, precisely for people who have lung complications, and for health sensitive groups. As shown in Figure 5, the maximum PM2.5 concentration recorded was 215 µg/m3 at 9 PM in 2019 while, the lowest concentration recorded was 22 µg/m3 at 10 PM in 2016 during Hidar Sitaten days. One study conducted in Ethiopia showed that average concentrations of PM2.5 reached as high as 280 µg/m3 for 24-hour measurements.37 In Addis Ababa city the coffee preparers the geometric mean (57 µg/m3) and median (72 µg/m3) contributions to an increase in a 24-hour time-weighted average exposure were above WHO air quality guidelines.38 Also, the air pollution level in Addis Ababa is presumed to be high due to the prevalence of old vehicles and substandard road infrastructures.29 For instance, in many Asia cities, PM2.5 is a major problem and exceeding 300 µg/m3.39 In Guangzhou City the total suspended particulate was the prominent pollutant in the ambient air environment.40
The concentration PM2.5 emitted increased from May month in Addis Ababa city presented in Figure 7. Moreover, the highest recorded concentration PM2.5 was 42.3 µg/m3 in June 2018. This may be due to the construction activities and collection of solid waste activities enhanced during this season. Use of low-quality fuel, topographic structure, unplanned urbanization, industrial facilities, and traffic were enhanced the level of air pollution.9,41 Road construction in Ethiopia is in high demand to meet its short and long term goals in infrastructure development programs.42 Therefore, the rapidly increasing transport sectors together with the fast urbanization, poorly and slowly constructing road infrastructure and the type and quality of high sulfur-containing fuel usage are the major sources of Addis Ababa air quality degradation.43 A study conducted in Ghana showed that sources of air pollution in developing country cities include transportation and industrial pollution, biomass fuel use, and re-suspended dust from unpaved roads.44 In Shanghai transport pathways is the potential sources of PM10.45 Study conducted in China showed that fugitive dust deriving from construction sites is a serious local source of PM2.5 that leads to air pollution in cities undergoing rapid urbanization.46 Moreover, study conducted in Nepal shown that overall average PM2.5 concentrations and peak 1 hour CO concentrations exceeded WHO Indoor Air Quality Guidelines.47
AQI is used worldwide to inform the public about levels of air pollution and associated health risks.48 In Addis Ababa, the AQI increased between November 21 and 27 November in 2016. Likewise, the recorded AQI increased between 20 November and 22 November 2017. Moreover, similar trends had been observed for the same period of 2018 and 2019 (Figure 4). The higher the AQI value the higher the level of air pollution and the greater the health concern. AQI between 51 and 100 is acceptable; however, pollution in this range may pose a moderate health concern for a very small number of individuals as indicted (Appendix 1). People who are usually sensitive to particle pollution may experience respiratory symptoms.33 When AQI values are more than 101 air quality is considered to be unhealthy. The current AQI approach used in China is based on the maximum value of individual pollutants and does not consider the combined health effects of exposure to multiple pollutants.48 A study in South Western Nigeria showed that charcoal production is often accompanied by gaseous and particulate emission into the atmosphere and occupationally exposed workers could be affected.49
There are high pollution days associated with open-burning of refuses from November 21 to November 22. From this study, the highest trend of PM2.5 concentration recorded was 44.17 µg/m3 on 21 November 2017 (Figure 5) during Hidar Sitaten days and months. Throughout this day, the mean average concentration of PM2.5 was 27.7 µg/m3 from 2016 to 2019. This implies that the mean average concentration of PM2.5 released during Hidar Sitaten day was beyond WHO air quality guidelines (25 µg/m3) per 24 hours (Figure 8). Independent studies conducted in Bahir Dar and Hawassa cities showed that the poor urban management strategy, fossil fuel combustion, and aged vehicles were some of the factors responsible for the observed concentrations.50 Moreover, the open burning of scrap (bicycle, motorcycle, car, and truck) tyres has a large impact on the ambient air quality.51 Similar study conducted in Thailand revealed that the percentage of waste burned on or outside the households’ property was 53.7% of solid waste burned in open areas.52
Open burning of refuse is released directly into the surrounding ambient air without being treated or filtered.53 PM2.5 is often considered even more dangerous to human health because of its ultrafine size.11 It has a major health problem for both developed and developing countries. A study in the Neighborhoods in Oslo revealed that concentration-response relation between air pollution (nitrogen dioxide, PM10, and PM2.5) and cause-specific mortality.54 The adverse health effects of exposure to pollution have received relatively little attention to the potential impact of ambient air pollution on cognitive function in older adults of US.55 The 24 hours PM2.5 personal exposure was highest among adult females with a geometric mean (GM) and Geometric Standard Deviation (GSD) concentrations of 205 µg/m3 (1.67) in Ethiopia; 177 µg/m3 (1.61 GSD) in Uganda.56 Air pollution poses a critical threat to human health with ambient and household air pollution identified as key health risks in India.57
Future work
Based on the research findings in developing countries, open refuse burning is an under-researched area of air pollution. The main findings in this study establish a basis for future study related to cultural practice of open burning. As found in the literature, the major sources of fine particles include open burning, motor vehicles, industrial processes, and other combustion processes. The researcher recommends that future work includes additional detailed experimental measurements on air quality analysis on Hidar Sitaten day or seasonal air quality analysis of Addis Ababa sub-cities. Also, air quality modeling analysis that accurately reflect the effect of PM2.5 on human health would be suitable. Further, investigation is needed on the analysis of increased particulate matter concentration from May to June months indicated during the study period.
Conclusion
The main finding of the study showed that the emission of PM2.5 from the open burning of refuses was the main source of air pollution in Addis Ababa city on Hidar Sitaten day. The highest PM2.5 concentration recorded was 215 µg/m3 on Hidar Sitaten day at 9 PM in 2019, while the highest mean PM2.5 concentration recorded was 44.17 µg/m3 on 21 November 2017. On the other hand, the mean concentration of PM2.5 recorded was 27.7 µg/m3 on Hidar Sitaten days. This work also showed that the mean concentration of PM2.5 on during Hidar Sitaten was higher than the WHO air quality guideline limits from August 2016 to November 2019. High pollution days associated with open-burning of refuses in the 21 to 22 days of during Hidar Sitaten. Consequently, the open burning of refuses practice causes poor air quality. This implies that the concentration of air pollutants was harmful to people who are usually sensitive to particle pollution and have health problems.
Acknowledgments
I would like to express my special gratitude to the U.S. Embassies of Addis Ababa, Ethiopia, and the U.S. Environmental Protection Authority who established the air quality monitoring stations and for providing the free available concentration air data of particulate matter. Secondly, I would also like to thank the staff of the Environmental Management Department, Kotebe Metropolitan University, and Centre for Science and Environment New Delhi and our friends who helped me to finalize this paper and give their helpful comments within the limited time frame.
Appendix 1
Table 5.
Trend analysis of status air quality index and raw concentration of air pollutant values in time interval on months from August 2016 to November 2019 of Addis Ababa central monitoring station (Figures 6 and 7).
| S.No | Air quality Index (AQI) | Month | Raw concentration in (µg/m3) | ||||||
|---|---|---|---|---|---|---|---|---|---|
| 2016 | 2017 | 2018 | 2019 | 2016 | 2017 | 2018 | 2019 | ||
| 1 | N/A | 59.32 | 88.45 | 59.13 | January | N/A | 17.49 | 29.98 | 17.33 |
| 2 | N/A | 62.75 | 65.45 | 55.88 | February | N/A | 18.63 | 19.23 | 15.22 |
| 3 | N/A | 61.37 | 79.15 | 61.73 | March | N/A | 17.64 | 25.31 | 17.79 |
| 4 | N/A | 66.98 | 69.74 | 64.56 | April | N/A | 19.81 | 23.07 | 19.92 |
| 5 | N/A | 76.94 | 84.81 | 61.87 | May | N/A | 24.94 | 28.19 | 18.16 |
| 6 | N/A | 105.72 | 116.07 | 96.65 | June | N/A | 37.36 | 42.79 | 33.45 |
| 7 | N/A | 107.54 | 98.65 | N/A | July | N/A | 39.22 | 34.45 | N/A |
| 8 | 100.46 | 83.19 | 87.58 | 83.21 | August | 35.67 | 27.39 | 29.65 | 27.74 |
| 9 | 94.12 | 96.71 | 71.51 | 87.04 | September | 32.93 | 35.83 | 16.58 | 30.02 |
| 10 | 67.63 | 73.46 | 55.28 | 51.87 | October | 20.20 | 21.59 | 14.30 | 14.47 |
| 11 | 68.68 | 69.89 | 53.83 | 58.64 | November | 20.71 | 21.33 | 15.31 | 16.89 |
| 12 | 65.71 | 72.84 | 62.37 | N/A | December | 19.62 | 21.97 | 18.10 | |
N/A means not available data from recorded from Addis Ababa central monitoring station study site.
Footnotes
Funding:The author received no financial support for the research, authorship, and/or publication of this article.
Declaration of Conflicting Interests:The author declared no potential conflicts of interest with respect to the research, authorship, and/or publication of this article.
Author Contribution: Tadesse Weyuma designed the study concept, drafted the manuscript, collected data, analyzed data, interpretation of data, and made revisions to the manuscript. The author reviewed and approved the final version of the manuscript.
ORCID iD: Tadesse Weyuma Bulto  https://orcid.org/0000-0001-7993-1788
References
- 1. Ndamitso MM, Iyaka YA, Abdulkadiri A, Abulude FO. Source apportionment: case studies of selected African countries. Int J Adv Res Technol. 2016;5:1-25. [Google Scholar]
- 2. Anenberg S, Miller J, Henze D, Minjares RAY. Pollution-Related Health Impacts of Transportation Sector Emissions in 2010 and 2015. IOP Publishing Ltd; 2015. [Google Scholar]
- 3. Yadav G, Mishra N. Air pollution trend analysis using sen estimator method. Int J Adv Res Comput Sci Soft Eng. 2015;5:1073-1080. [Google Scholar]
- 4. Tsegaw GT, Alemayehu YA. Principal air pollutants and their effects on athletes’ health and performance: a critical review. Sci Res Essays. 2019;14:44-52. [Google Scholar]
- 5. Allen D, Mcdonald-buller E, Mcgaughey G. State of the science of air quality in Texas: summary of scientific projects and findings from the Texas air quality research program (AQRP). AQRP Independent Technical Advisory Committee. January 18, 2018. Austin: The University of Texas. [Google Scholar]
- 6. Evans MJ. Policy-relevant findings of dynamics-aerosol-chemistry-cloud interactions in West Africa (DACCIWA) Project. November 11, 2018. Zenodo. [Google Scholar]
- 7. Yolsal H. Estimation of the air quality trends in Istanbul. Marmara Üniversitesi İktisadi ve İdari Bilimler Dergisi. 2016;38:375-399. [Google Scholar]
- 8. Gupta P, Christopher SA. Seven year particulate matter air quality assessment from surface and satellite measurements. Atmos Chem Phys. 2008;8:3311-3324. [Google Scholar]
- 9. Kasim OF, Abshare MW, Agbola SB. Analysis of air quality in Dire Dawa, Ethiopia. J Air Waste Manage Assoc. 2018;68:801-811. [DOI] [PubMed] [Google Scholar]
- 10. Parrish DD, Xu J, Croes B, Shao M. Air quality improvement in Los Angeles perspectives for developing cities. Front Environ Sci Eng. 2016;10:11. [Google Scholar]
- 11. Rees N. The Impact of Air Pollution on Children. Geneva: World Health Organization; 2016. [Google Scholar]
- 12. Liu H, Dunea D. A Review of airborne particulate matter effects on young children’s respiratory symptoms and diseases. Atmosphere. 2018;9:150. [Google Scholar]
- 13. Cusack M, Alastuey A, Pérez N, Pey J, Querol X. Trends of particulate matter (PM2.5) and chemical composition at a regional background site in the Western Mediterranean over the last nine years (2002–2010). Atmos Chem Phys. 2012;12:8341-8357. [Google Scholar]
- 14. Rani NLA, Azid A, Khalit SI, Juahir H, Samsudin MS. Air pollution index trend analysis in Malaysia, 2010-15. Pol J Environ Stud. 2018;27:801-807. [Google Scholar]
- 15. Trippetta S, Caggiano R, Telesca L. Analysis of particulate matter in anthropized areas characterized by the presence of crude oil pre-treatment plants: the case study of the Agri Valley (Southern Italy). Atmos Environ. 2013;77:105-116. [Google Scholar]
- 16. Jain R, Palwa K. Air pollution and health: discussion paper. 2015. New Delhi: TERI. [Google Scholar]
- 17. Lawal O, Asimiea AO. Spatial modelling of population at risk and PM2.5 exposure index: a case study of Nigeria. Ethiopian J Environ Stud Manag. 2015;8:69-80. [Google Scholar]
- 18. Gozzi F, Ventura GD, Marcelli A, Lucci F. Current status of particulate matter pollution in Europe and future perspectives: a review. JMES. 2017;8:1901-1909. [Google Scholar]
- 19. van Donkelaar A, Martin RV, Brauer M, et al. Global estimates of ambient fine particulate matter concentrations from satellite-based aerosol optical depth: development and application. Environ Health Perspect. 2010;118:847-855. [DOI] [PMC free article] [PubMed] [Google Scholar]
- 20. Davy PK, Trompetter WJ, Ancelet T, Markwitz A. Source apportionment and trend analysis of air particulate matter in the Auckland region. Auckland Council Technical Report TR2017/001, July, 2017. Auckland. [Google Scholar]
- 21. Cogut A. Open burning of waste: a global health disaster. R20 Regions of Climate Action, October, 2016. [Google Scholar]
- 22. Young Koo YK, Kim W, Jo YM. Release of harmful air pollutants from open burning of domestic municipal solid wastes in a metropolitan area of Korea. Aerosol Air Qual Res. 2013;13:1365-1372. [Google Scholar]
- 23. Muindi K. Air pollution in Nairobi slums: sources, levels and lay perceptions. 2017. Sweden: Umeå University. [Google Scholar]
- 24. Zhu S, Lian X, Liu H, Hu J, Wang Y, Che J. Daily air quality index forecasting with hybrid models: a case in China. Environ Pollut. 2017;231:1232-1244. [DOI] [PubMed] [Google Scholar]
- 25. WHO. Air Quality Guidelines for Europe. 2nd ed. Geneva: World Health Organization; 2000. [Google Scholar]
- 26. Lau A, Yuan Z, Turner J, Yadav V. Study on integrated data analysis and characterization of particulate matter in Hong Kong. Final Report for Provision of Service. Tender Reference AS09-056, Environmental Protection Department, 2012. [Google Scholar]
- 27. Selin NE, Reilly JM. Air Quality Impacts and Benefits under U.S. Policy for Air Pollution, Climate Change, and Clean Energy. [PhD thesis]. Cambridge, MA: Massachusetts Institute of Technology; 2015. [Google Scholar]
- 28. CSA. Central statistcal agency. 2010. [Google Scholar]
- 29. Kume A, Charles K, Berehane Y, Anders E, Ali A. Magnitude and variation of traffic air pollution as measured by CO in the city of Addis Ababa, Ethiopia. Ethiop J Heal Dev. 2010;24:11. [Google Scholar]
- 30. Hasenkopf CA, Adukpo DC, Brauer M, et al. Commentary: to combat air inequality, governments and researchers must open their data. Clean Air J. 2016;26:9-11. [Google Scholar]
- 31. Said AY. Air Quality Trends and Pollution Roses in Selected Cities of Canada. [Master thesis]. Canada: University of Windsor; 2012. [Google Scholar]
- 32. Nagendra SMS, Venugopal K, Jones SL. Assessment of air quality near traffic intersections in Bangalore city using air quality indices. Transport Res D-Tr E. 2007;12:167-176. [Google Scholar]
- 33. EPA. A guide to air quality and your health. Report for Air Quality Index. EPA-456/F-14-002, February 2014. U.S. Environmental Protection Agency. [Google Scholar]
- 34. IQAir. World air quality report. 2018. [Google Scholar]
- 35. Salvador S, Salvador E. Air quality index (AQI) air quality communication workshop. 2012. Environmental Protection Agency: ACUERDO DE COOPERACION USAID-CCAD. [Google Scholar]
- 36. WHO. Air Quality Guidelines: Global Update 2005. Geneva: World Health Organization. [Google Scholar]
- 37. Tefera W, Asfaw A, Gilliland F, et al. Indoor and outdoor air pollution- related health problem in Ethiopia: review of related literature. Ethiop J Heal Dev. 2016;30:5-16. [PMC free article] [PubMed] [Google Scholar]
- 38. Keil C, Kassa H, Brown A, Kumie A, Tefera W. Inhalation exposures to particulate matter and carbon monoxide during Ethiopian coffee ceremonies in Addis Ababa: a pilot study. J Environ Public Health. 2010;2010:213960. [DOI] [PMC free article] [PubMed] [Google Scholar]
- 39. Baldasano JM, Valera E, Jiménez P. Air quality data from large cities. Sci Total Environ. 2003;307:141-165. [DOI] [PubMed] [Google Scholar]
- 40. Zhou K, Ye YH, Liu Q, Liu AJ, Peng SL. Evaluation of ambient air quality in Guangzhou, China. J Environ Sci (China). 2007;19:432-437. [DOI] [PubMed] [Google Scholar]
- 41. Cukurluoglu S, Bacanli U. Trend analysis of the Sulfur dioxide and particulate matter concentrations in the Aegean region, Turkey. Int J Eng Sci. 2018;7:64-74. [Google Scholar]
- 42. Befkadu A, Quezon ET, Busier M. Assessment on the effects of weather change on road construction planning at some selected projects in Addis Ababa and Oromia. Int J Sci Eng Res. 2016;7:134-145. [Google Scholar]
- 43. Tarekegn MM, Gulilat TY. Trends of ambient air pollution and the corresponding respiratory diseases in Addis Ababa. J Environ Sci. 2018;2(15):1-14. [Google Scholar]
- 44. Rooney MS, Arku RE, Dionisio KL, et al. Spatial and temporal patterns of particulate matter sources and pollution in four communities in Accra, Ghana. Sci Total Environ. 2012;435-436:107-114. [DOI] [PubMed] [Google Scholar]
- 45. Li M, Huang X, Zhu L, et al. Analysis of the transport pathways and potential sources of PM10 in Shanghai based on three methods. Sci Total Environ. 2012;414:525-534. [DOI] [PubMed] [Google Scholar]
- 46. Feng Q, Wu S, Du Y, et al. Improving neural network prediction accuracy for PM10 individual air quality index pollution levels. Environ Eng Sci. 2013;30:725-732. [DOI] [PMC free article] [PubMed] [Google Scholar]
- 47. Bartington SE, Bakolis I, Devakumar D, et al. Patterns of domestic exposure to carbon monoxide and particulate matter in households using biomass fuel in Janakpur, Nepal [published online ahead of print October 1, 2016]. Environ Pollut. doi: 10.1016/j.envpol.2016.08.074. [DOI] [PMC free article] [PubMed] [Google Scholar]
- 48. Hu J, Ying Q, Wang Y, Zhang H. Characterizing multi-pollutant air pollution in China: comparison of three air quality indices. Environ Int. 2015;84:17-25. [DOI] [PubMed] [Google Scholar]
- 49. Olujimi OO, Ana GR, Ogunseye OO, Fabunmi VT. Air quality index from charcoal production sites, carboxyheamoglobin and lung function among occupationally exposed charcoal workers in South Western Nigeria. Springerplus. 2016;5:1546. [DOI] [PMC free article] [PubMed] [Google Scholar]
- 50. Kasim OF, Abshare MW, Mukuna TE, Wahab B. Land use and ambient air quality in Bahir Dar and Hawassa, Ethiopia. Air, Soil Water Res. 2018;11:1-10. [Google Scholar]
- 51. Jimoda LA, Sulaymon ID, Alade AO, Adebayo GA. Assessment of environmental impact of open burning of scrap tyres on ambient air quality. Int J Environ Sci Technol. 2018;15:1323-1330. [Google Scholar]
- 52. Pansuk J, Junpen A, Garivait S. Assessment of air pollution from household solid waste open burning in Thailand. Sustainability. 2018;10:2553. [Google Scholar]
- 53. Blakeman S. A Retrospective Analysis of Open Burning Activity in Kentucky. [thesis and dissertations]. Lexington: the University of Kentucky; 2017. [Google Scholar]
- 54. Naess Ø, Nafstad P, Aamodt G, Claussen B, Rosland P. Relation between concentration of air pollution and cause-specific mortality: four-year exposures to nitrogen dioxide and particulate matter pollutants in 470 neighborhoods in Oslo, Norway. Am J Epidemiol. 2007;165:435-443. [DOI] [PubMed] [Google Scholar]
- 55. Ailshire JA, Crimmins EM. Fine particulate matter air pollution and cognitive function among older US adults. Am J Epidemiol. 2014;180:359-366. [DOI] [PMC free article] [PubMed] [Google Scholar]
- 56. Okello G, Devereux G, Semple S. Women and girls in resource poor countries experience much greater exposure to household air pollutants than men: results from Uganda and Ethiopia. Environ Int. 2018;119:429-437. [DOI] [PMC free article] [PubMed] [Google Scholar]
- 57. Pant P, Guttikunda SK, Peltier RE. Exposure to particulate matter in India: a synthesis of findings and future directions. Environ Res. 2016;147:480-496. [DOI] [PubMed] [Google Scholar]


